 Husam Mostafa*
 Duraisamy Arumugasamy
- Department of Economics, Faculty of Science and Humanities, SRM Institute of Science and Technology, Kattankulathur, India
This study evaluates the impact of digital payments on monetary policy transmission in India post-demonetization. Using the Long Run ARDL Model, ARDL Short-Run Dynamics, and ARDL Error Correction Model, we find a significant negative correlation between digital payments and the Weighted Average Lending Rate on Fresh Rupees Loans (WALRF), with a 1 percent increase in digital payments leading to a 0.43 percent reduction in WALRF. Short-run dynamics show immediate impacts, enhancing competitive pressures within the banking sector. The error correction term indicates that monthly corrections account for 23 percent of long-term equilibrium variances, highlighting the stabilizing effects of digital financial infrastructures. Robustness tests, including the Breusch-Godfrey Serial Correlation LM Test, Breusch-Pagan-Godfrey Heteroskedasticity Test, Bounds Test for Cointegration, and CUSUM (Cumulative Sum) of squares test, confirm the results' reliability. The study advocates for promoting and integrating digital payment systems to enhance banking sector responsiveness and achieve broader macroeconomic goals.
JEL codes: E4, E5
1 Introduction
The rapid evolution of global economies, especially in the wake of the COVID-19 outbreak, has brought about significant shifts in monetary policies and their subsequent effects on employment rates, liquidity, and potential recession risks. This economic environment has highlighted the critical importance of effective monetary policy implementation, especially in light of contemporary developments in digital currency. The challenges faced by central banks today differ markedly from the traditional issues they previously managed.
India has one of the globe's largest economies, and it is also one of the fastest-growing. In 2023, it had more than 1.428 billion people and a GDP of more than 173,293 billion rupees. It will probably be a big part of global growth in the next few years (International Monetary Fund, 2023). There are a lot of young, active population in the economy, which is growing quickly. Since the Real Time Gross Settlement (RTGS) system—which is s a system of transferring funds where the transfer of money takes place between banks on a real-time and on a gross basis- was set up in 2004 (Reserve Bank of India, 2004) and the National Electronic Funds Transfer (NEFT) -which is an electronic payment system in India that allows individuals, firms, and corporates to transfer money from one bank account to another across the country—system was set up in 2008 (Reserve Bank of India, 2008), India's digital payments have come a long way. The goal of demonetization in 2016 was also to make the country's digital payment system better (Shepard, 2016).
In this case, the idea of monetary policy pass-through is a good way to understand how monetary policy works. Monetary policy pass-through indicates the impact of the central bank's decisions on the economy in the real world. The number of ways through which this transmission occurs is notable, e.g., such core ways are the interest rates, credit, asset prices, and currency rates (Bhoi et al., 2016). The main point of this paper is to examine the impact of digital payments on macroeconomic factors. It is evident that an increased reliance on digital payments in an economy would presumably enhance the efficiency of monetary policy transmission. To experimentally validate this impact, we focused on utilizing the digital payments by the primary entities responsible for monetary policy transmission (banks). This will facilitate the examination of the impact of transforming the economy from a cash-based system to a digitalized one. Digitalization of payment methods will significantly impact the velocity of money, since digital transactions may enhance the effective circulation velocity, hence impacting inflation and production. The money demand function will be influenced by changes in the structure of M1 and M3. Moreover, transitioning from an informal to a formal economy, as a cash-based economy expands, amplifies informal transactions, diminishes the tax base, and undermines fiscal capacity. All these shortages might be mitigated by transitioning to a digital-based economy. In simple words, the digitization of the economy via digital payments represents a revolution of the monetary and financial system, whereby currency flows mostly via digital channels, hence altering money demand, velocity, financial inclusion, and the efficacy of monetary and fiscal policy.
To our understanding, this is the first study to look at the association between digital payments and monetary policy pass-through using a robust econometric model. Although various studies have explored monetary policy transmission channels and digital payments in India separately, this paper seeks to integrate these two aspects and analyze their combined effects.
Following this introduction, the “Review of Literature” section surveys existing research relevant to our study. Subsequent sections will cover the “Distinctive features of digital payments in India”, explain the “Data and methodology” utilized in this study, present the “Results”, and conclude with final remarks in the “Conclusion” section.
2 Distinctive features of digital payments in India
In an overpopulated nation like India, a significant concern arose over how Indian monetary policy will address the digital change during the demonetization phase in 2016. Transforming a substantial economy from a cash-based system to a digital-based one was a formidable undertaking. In addition to the recurrent economic disruptions, the Covid-19 crisis represented the inaugural significant challenge to assess the efficacy of the Indian monetary policy pass-through. It also critically evaluated how the digitalization of the economy could facilitate monetary policy transmission amid the constraints of lockdowns and restrictions on cash transactions. At this juncture, we were sufficiently motivated to chronicle the Indian experience in the digitization of payment systems and, by extension, the whole economy. The primary task was to assess the degree to which the digitization of the Indian economy has enhanced the effectiveness of the Indian monetary policy transmission channel. Does such transformation impact the loan rates? Moreover, we questioned whether an increased reliance on digital payments within the banking industry had a neutral impact on competitive forces.
The acceptance of digital payments is influenced by various factors, including socioeconomic characteristics, payment attributes, and regulatory changes (Koulayev et al., 2016). The rapid growth of digital payments in India since the demonetization policy, as depicted in the accompanying graph (Figure 1) is particularly noteworthy. The graph highlights several key trends:
A. Steady Expansion and Preliminary Acceptance (2015–2018): Throughout this era, digital payments demonstrated a consistent upward trend. This may be attributed to the influence of demonetization as a primary catalyst. Government initiatives fostering digitization, particularly the implementation of UPI, have markedly expedited the rapid adoption of digital transformation, which must be acknowledged as a vital element in this important upward trend.
B. Economic Deceleration and fall (2019–2020): This period had a slowdown in economic activity, resulting in a little fall by 2020. This may be attributed to temporary frictions within the system, partial saturation in urban markets, and, most notably, the effects of the COVID-19 pandemic, during which economic activity declined and uncertainty prevailed despite heightened digital reliance.
C. Vigorous Recovery and Rejuvenated Growth (2021–2022): The digital payments industry saw a notable comeback after 2020, to unparalleled heights by 2022. The epidemic generated a significant impetus for the public to adopt contactless and cashless transactions owing to safety concerns intensified by the need of repeated lockdowns. The rapid expansion of UPI transactions and financial advances further propelled this comeback.
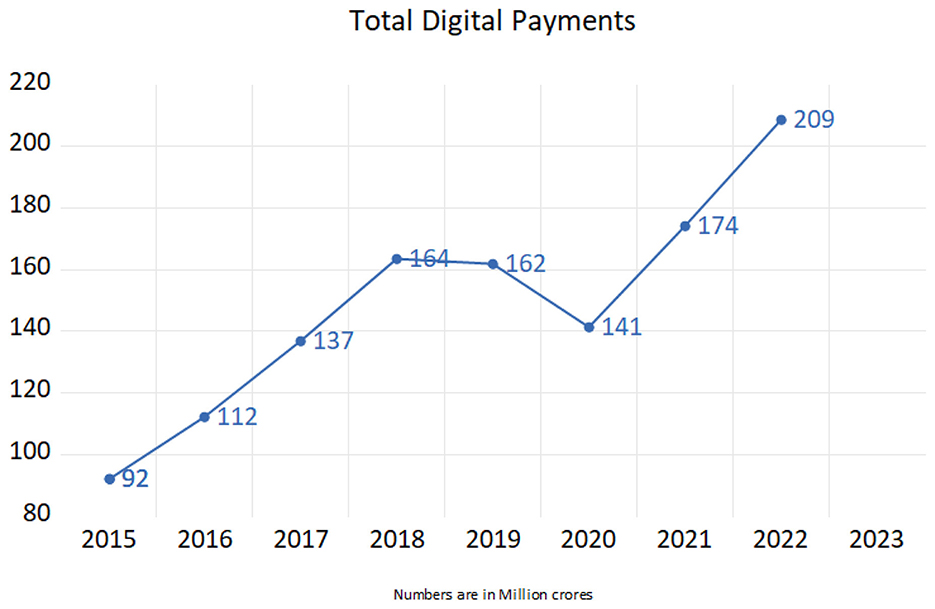
Figure 1. The growth of digital payments during the study period (2015–2023). Source: Reserve Bank of India (2024a).
Despite this rapid growth of digital payments, cash remains a predominant mode of transaction in India. The percentage of cash with the public as a proportion of broad money (CWP/M3) remains relatively high, as shown in the graph (Figure 2). Observations from the graph include:
A. Pre-Demonetization Stability: Leading up to 2015–16, the currency with public (CWP)/M3 ratio shows relative stability, indicating a balanced preference between cash and digital transactions
B. Significant Decline: The sharp dip in 2016–17 aligns with demonetization, where cash supply was shrunk, and digital payments surged, marking a significant shift in public liquidity preferences.
C. Gradual improvement and growth: Post-initial shock, the ratio shows gradual recovery and steady growth from 2017–18 onwards, reflecting normalization as digital payment adoption became more ingrained in consumer behavior.
D. Post-pandemic: A slight decline in 2023–24 suggests that while digital payments have become mainstream, there may be an emerging equilibrium where cash and digital payments coexist, indicating a balanced approach by the public.
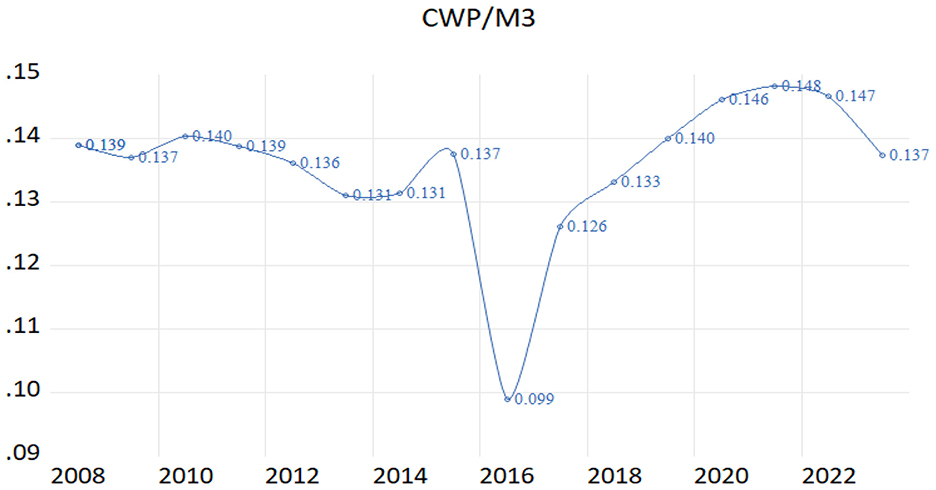
Figure 2. Percentage of cash with public to the total money supply (M3) (2008–2024). Source: Reserve Bank of India (2024b).
The characteristics that distinguish Indian economy from others of the globe making establishing regulations for digital currency in India is challenging due to these characteristics issue. A substantial number of households continue to use cash; hence, a digital economy cannot completely dominate. This imposes the policy makers to investigate the reasons certain households continue to utilize cash. The objective of this study is to examine the impact of digital payments on India's monetary policy. This examines whether the fast proliferation of digital payments has enhanced the efficacy of monetary policy transmission.
3 Literature review
Current studies have focused on the public's acceptability of digital payments through a multi-dimensional approach, such as behavioral reaction and technological development. Studies reveal that the social-economic status of individuals influences their decision in payment, the type of the transaction, and legal adjustments. Digital payments are set to keep increasing in India after the demonetization program, which means a paradigm shift in consumer payment processes in India (Schuh and Stavins, 2014), address the role of legal changes and socioeconomic factors in the payment card usage while (McAndrews and Wang, 2008) analyze the payment card pricing patterns and trends. Studies have shown that digital payments are an important factor when it comes to the way customers spend and how convenient their transactions are. The influence of innovative financial products on the perception and use of money among individuals is proven by (Attanasio et al. 2002) and (Liñares-Zegarra and Willesson 2021). Mobile money has massively contributed to financial management in poor countries. It has improved the stability of the economy and lowered the transaction costs (Ky et al., 2018; Jack and Suri, 2011).
Besides the issues of health and the changes in consumer preferences, the COVID-19 outbreak elevated the use of digital purchases (Kotkowski and Polasik, 2021; Wisniewski et al., 2021). These studies imply that strong and at the same time adaptable institutions are necessary to stimulate economic recovery, given the crises that are yet to come. Digital payments appear to be an important tool that bridges the gap between unbanked or any other financially challenged individuals, which is why financial inclusion has become a key research subject. Studies show that the acquisition of bank accounts and schemes such as the Pradhan Mantri Jan Dhan Yojana in India influence the participation and aspects of decision making of people (Dupas et al., 2014; Agarwal et al., 2017). Mobile money has helped some poor people save money and become sound financially (Somville and Vandewalle, 2018; Aron, 2018). (Ofoeda et al. 2024) discuss the interconnection among such aspects as the stability of banks, the quality of institutions, and financial inclusion in sub-Saharan Africa. According to their study, financial inclusion makes banks more stable as they can raise the level of deposits, and it allows people to have access to a broader variety of banking services. This outcome proves the idea that digital payments in India can stabilize banks, boosting their liquidity and lowering expenses.
Regulations and laws are primary in establishing the possibilities of regulation and use of digital payments. Researchers analyze the impact of Indian demonetization on the digital payment usage and underline the need to form the laws, which require competition-innovation balance (Macmillan et al., 2016). (Zachariadis and Ozcan 2017) underline the possible influence of open banking policies on the functioning of digital financial services.
It is now well established that digital payment systems greatly impact economic growth in terms of market efficiency, reduction in the cost of carrying out transactions in the market, and financial inclusion. Researchers have concluded that mobile money and other digital payment tools improve the work of the companies, access to credit, and entrepreneurship, and thus bring economic growth (Jensen, 2007; Beck et al., 2018). The article by (Aker et al. 2016) talks about the importance of financial technology in terms of the ability to get small enterprise loans and to improve the accessibility of monetary resources by individuals, and is, therefore, related to poverty reduction. Technological development has a huge impact both positively and negatively on the lives of people in terms of financial management. It has now been found that mobile data can be used to estimate the loan behavior of people. It can potentially give access to a loan to more people, yet can also provide new risks, including the issues of cybersecurity (Björkegren and Grissen, 2020). These studies combined give an in-depth implication of determinants of the use of digital payments, the transformation of an individual, and financial inclusion processes, as well as the legislation needed to ensure sustainable development in the digital financial systems.
4 Data & methodology
4.1 Variable selections and the study's timeframe
This study addresses the effects of digital payments on the monetary policy in India. With the help of 88 observations, after the demonetization of November 2016. The RBI, namely the Data Base of Indian Economy portal, is the source from which we obtained data on digital payments, available in both traditional and new formats (Reserve Bank of India, 2024c). The new format is considered as a standard to harmonize the prior series with the current one. Our analysis of digital payment composition revealed that two components dominate: Real-Time Gross Settlement (RTGS), comprising around 74% of the total value of digital transactions, and retail credit transfers, which represent about 25%. The latter component includes National Electronic Funds Transfer (NEFT), which constitutes around 66% of retail credit transactions (Please refer to Appendix A). Consequently, we identify these two parts as the fundamental components of the digital payment system. Thus, we have two components: RTGS, representing high-value wholesale transactions including interbank and high-volume customer settlements, and NEFT, indicating the retail facet of digital transfers. These two instruments, collectively, represent almost all elements of India's digital payments, which provides a thorough and representative framework for evaluating the impact of digitalization on monetary policy transmission. Other components—including debit/credit cards, prepaid payment instruments (PPIs), AePS, APBS, IMPS, and NACH—collectively represent less than 1% of the total and therefore have been excluded without compromising representativeness.
Figure 3 illustrates the fluctuations of RTGS and NEFT during the research period. It is noteworthy that the comparison between Figures 1 and 3 substantiates the empirical validity of using RTGS and NEFT as proxies for digital payment. Observing the behavior of the two lines indicates the degree of their similarity and supports our assertion that RTGS and NEFT accurately reflect total digital payments.
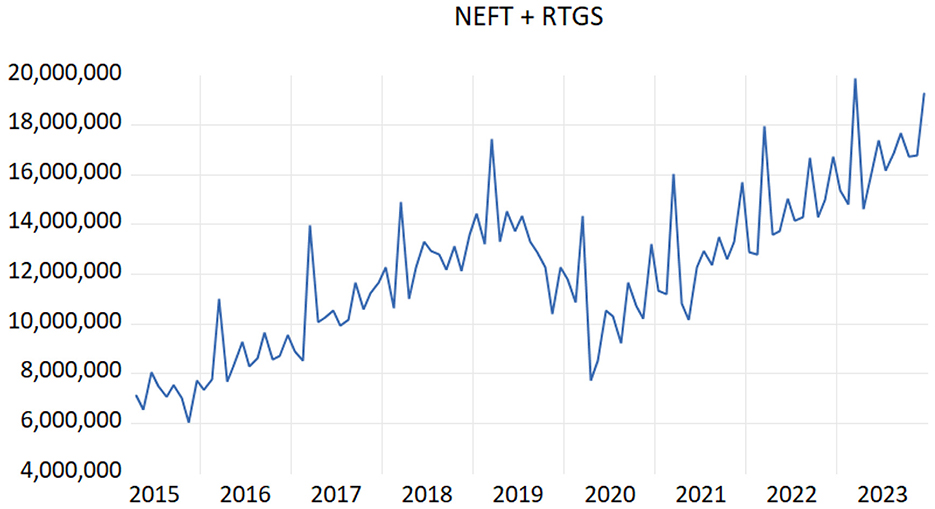
Figure 3. Development of digital payments represented by RTGS and NEFT (2006–2023).
It pays particular attention the Weighted Average Call Money rate (WACR), utilized in place of the policy rate (Repo rate), indicates short-term interbank borrowing costs and the central bank's policy stance. Data for WACR were collected from the DBIE portal (Reserve Bank of India, 2024f,g), in addition to the Weighted Average Lending Rate on Fresh Rupee Loans (WALRF), reflecting the lending rates applied to new loans, serves as the dependent variable that expresses the monetary policy pass-through in our analysis. This data, expressed as a percentage, was obtained from the RBI's press releases. GDP is proxied by the IIP (Reserve Bank of India, 2024d), following the approach of (Singh and Kalirajan 2006). The IIP is highly correlated with GDP (correlation coefficient of 0.974 during the study period) and provides monthly frequency data, which is essential for our analysis. Inflation is represented by the CPI (Reserve Bank of India, 2024e), preferred over the WPI due to its relevance in reflecting changes in retail prices, which directly impact consumer behavior and monetary policy. The RBI monitors CPI inflation closely, targeting around 4 percent with a tolerance band of ±2 percent.
The initial stages of monetary digitization in India commenced in 2004 when the use of the digital system of payment, such as RTGS (Real Time Gross Settlement), was adopted. In November 2016, the government introduced the plan of demonetization as a significant governmental modification that would encourage people to use digital payments. In this decade, a rapid expansion of digital payments was caused by various factors, such as advancements in the infrastructure (Fouillet et al., 2021). The major objective of the demonetization was to digitalize the Indian economy. This allows for clearer attribution of changes in monetary policy transmission to digital payment shocks. Post-demonetization data reflects a period of rapid digital payment adoption accompanied with infrastructural improvements, reflecting that the analysis captures contemporary dynamics and impacts, leading to more relevant policy insights. Examining data from the post-demonetization era offers clarity by removing noise associated with the past eras, marked by a gradual embrace of digital payments and less governmental influence. A pivotal moment in the proliferation of digital payments began in April 2006 with the launch of RTGS data recording, persisting to the present. This critical observation was fostered by demonetization in 2016. The Bai-Perron test results (Table 1) support this assertion, demonstrating that March 2017 was the critical juncture, coinciding with the demonetization released in November 2016. This inflection point signifies the substantial impact of demonetization on digital payments, beginning January 1, when the old notes' deposit period ended.
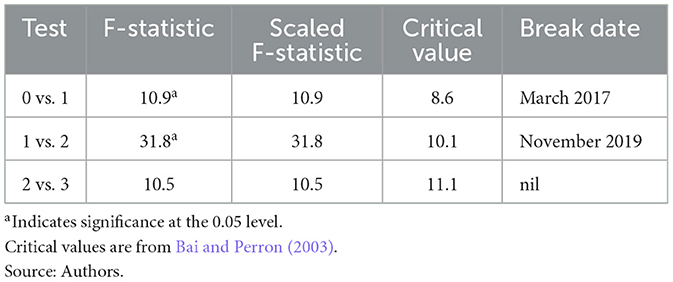
Table 1. Bai-Perron multiple breakpoint test results.
4.2 Econometric approach
A dummy variable was added to account for the COVID-19 pandemic's effects; it takes on a value of 1 for March 2020 to December 2021 and 0 otherwise. This variable allows us to isolate the pandemic's potential distortions on digital payments and monetary policy transmission. All data were seasonally adjusted using the X-13 Census algorithm to remove seasonal effects and reveal the underlying trends and relationships. To ensure robustness and reliability, unit root tests (Table 2) were conducted on all variables to determine their stationarity properties. The findings showed that, except for GDP (IIP), which is stationary at level I (0), all variables are stationary at level I (1). Given the mixed order of integration, we employed the Autoregressive Distributed Lag (ARDL) model (Pesaran and Shin, 1995) to examine the short- and long-term relationships between monetary policy and digital payments. Both I (0) and I (1) variables may be included using the ARDL technique without the need for differencing, making it appropriate for small sample sizes.
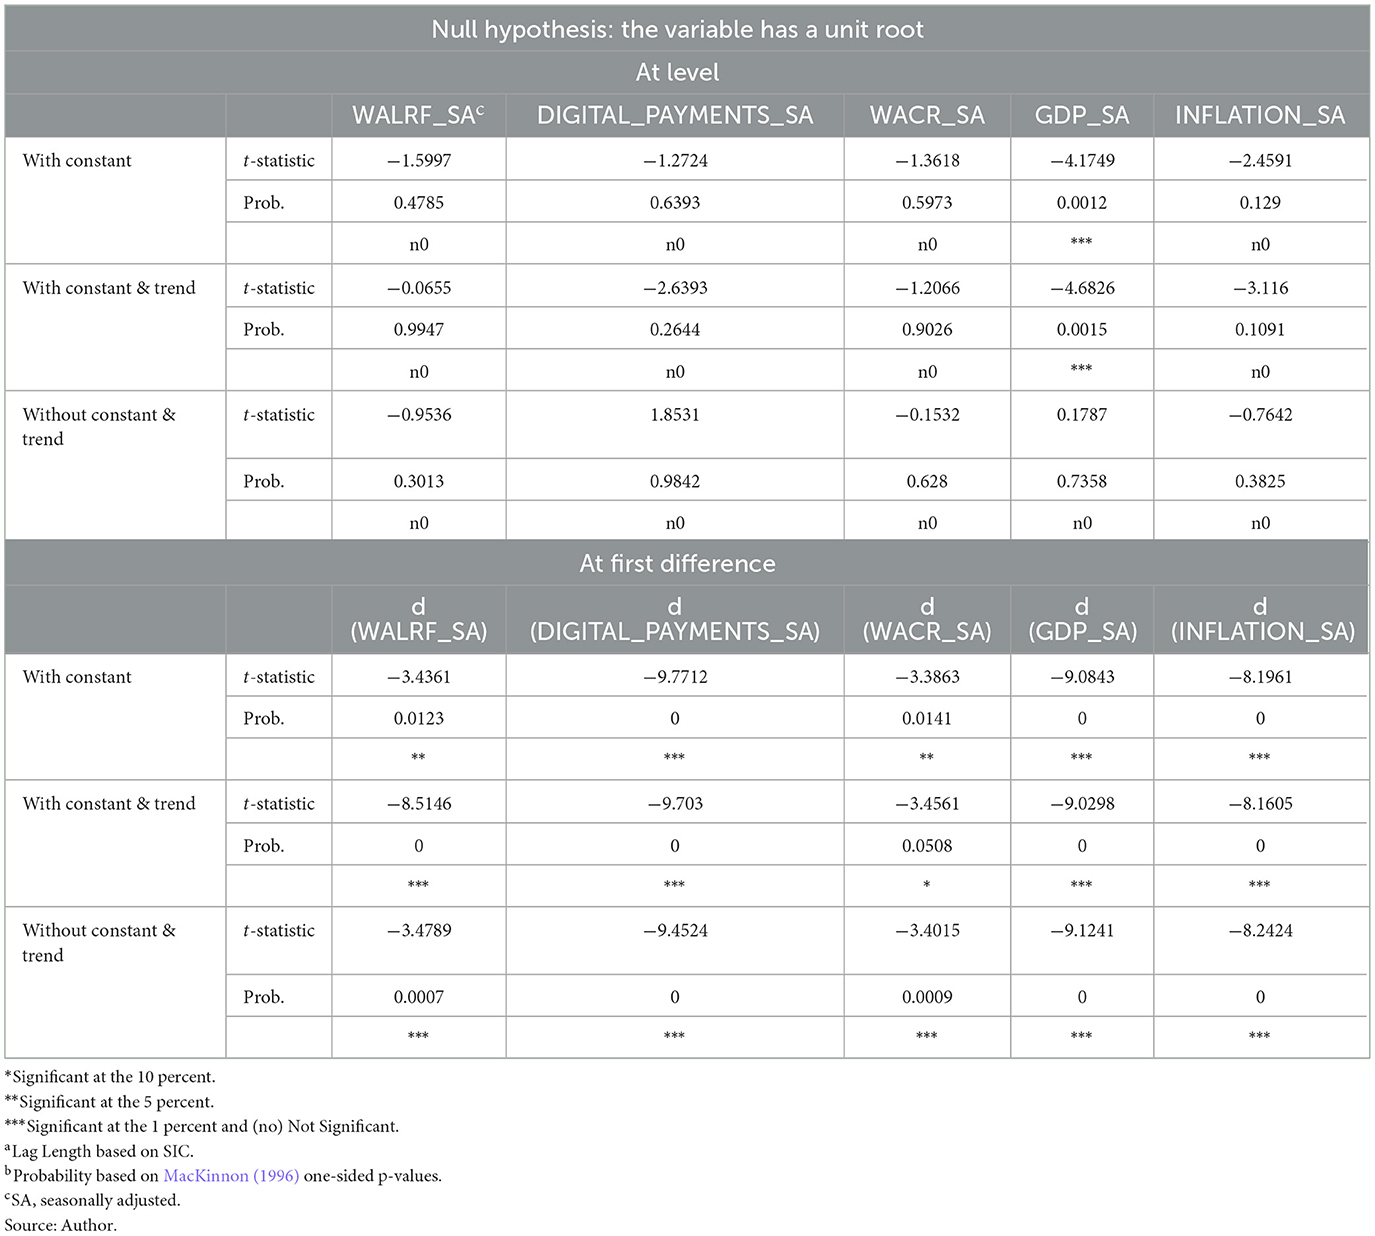
Table 2. Unit root test results table (ADF).
The model specification involved one lag for the dependent variable (WALRF) and two lags for the independent variables (digital payments, GDP, CPI, WACR). To guarantee the best possible model fit, this lag structure was selected using the Akaike Information Criterion (AIC). The following is the specification for the ARDL equation's general form:
Where:
α0: is the constant term βi, δj, γk, θl, λl, μn: are the coefficients of the lagged variable ∈ t: captures un explained term
The cointegration equation is written as follows to represent the long-term relationship:
The temporary error correction model (ECM) is described as follows:
Where
Δ denotes the first difference operator, and
φ is the correction for the error coefficient, which shows how quickly the system is returning to the long-term equilibrium.
5 Results
5.1 Empirical results from the ARDL model
We have estimated the mentioned equations by using the ARDL model, which enables the inclusion of variables with mixed orders of integration, notably I (0) and I (1), and is especially helpful when working with time series data that show both long-run and short-run dynamics. Accordingly, it is appropriate to use ARDL in our study given that our primary variables include digital payments (proxied by RTGS and NEFT transactions), key monetary policy indicators (WALRF and WACR), and control variables such as GDP (proxied by IIP) and CPI, which exhibit mixed stationarity properties. The period of study, from post-demonetization (November 2016) to the present, provides 88 observations, making ARDL suitable due to its ability to handle relatively small sample sizes effectively. The results of the Long Run ARDL Model, ARDL Short-Run Dynamics, and ARDL Error Correction Model collectively illuminate the significant influence of digital payments on monetary policy transmission in India.
The Long Run ARDL Model (Table 3) shows a substantial inverse relationship between the Weighted Average Lending Rate on Fresh Rupee Loans (WALRF) and digital payments. Specifically, the coefficient for digital payments is approximately −0.43, indicating that a 1 percent increase in digital payments results in a 0.43 percent reduction in WALRF.
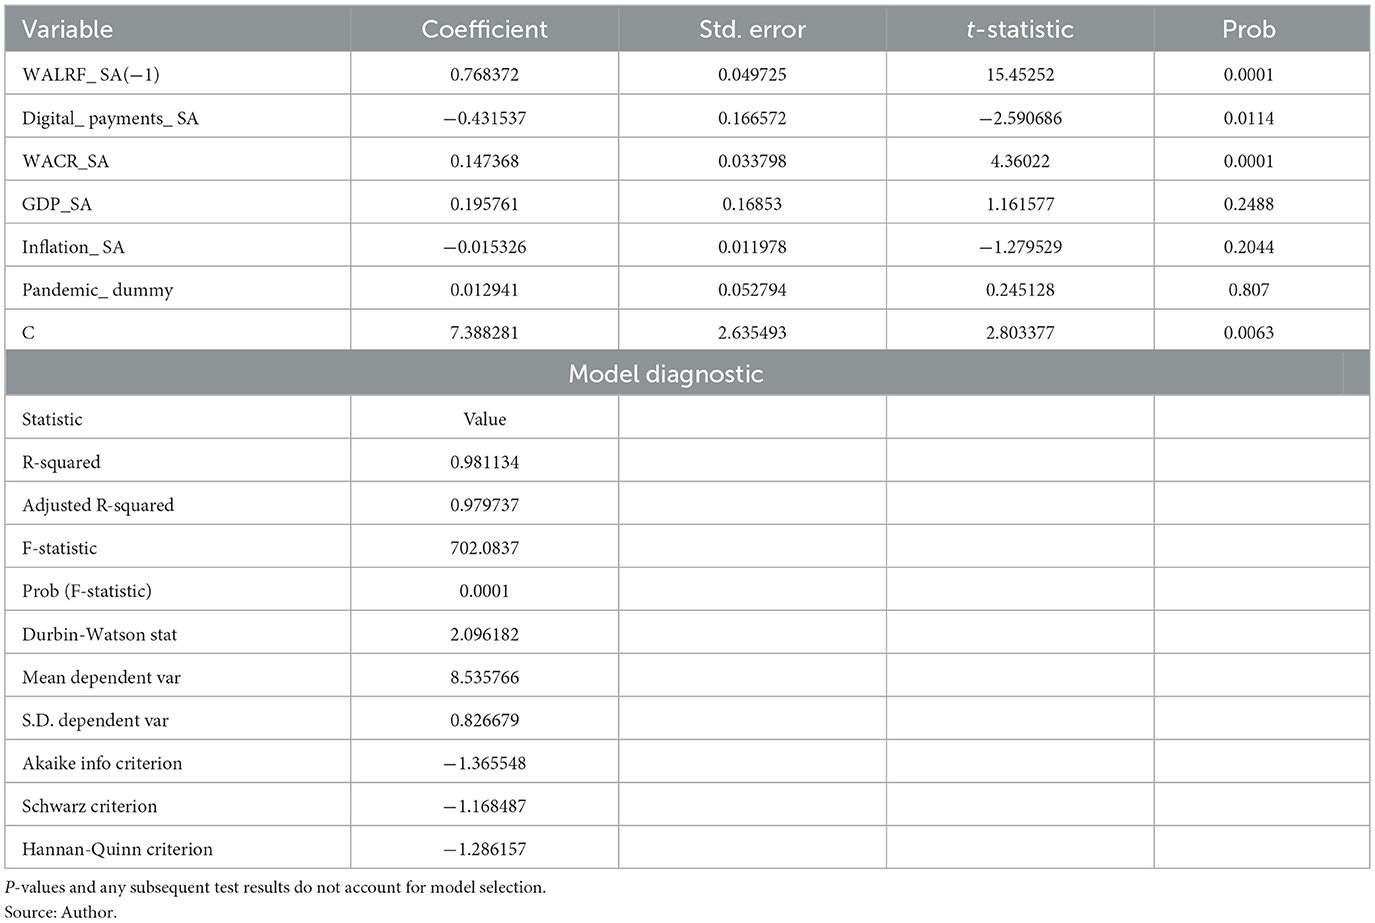
Table 3. Long run ARDL model.
Over the long term. This finding underscores the enhanced efficiency of monetary policy pass-through facilitated by the proliferation of digital payments. Furthermore, the Weighted Average Call Money Rate (WACR) exhibits a positive relationship with WALRF, with a coefficient of approximately 0.15. This finding aligns with (Chattopadhyay and Mitra, 2023), who reported a 0.12 percent point change in WALRF for a 1 percent point change in WACR. Our results reinforce the role of WACR as a critical monetary policy instrument, highlighting its influence on lending rates within the banking sector. In the ARDL Short-Run Dynamics (Table 4), digital payments continue to show an immediate and significant impact on lending rates, with the short-run coefficient for digital payments also around −0.43.
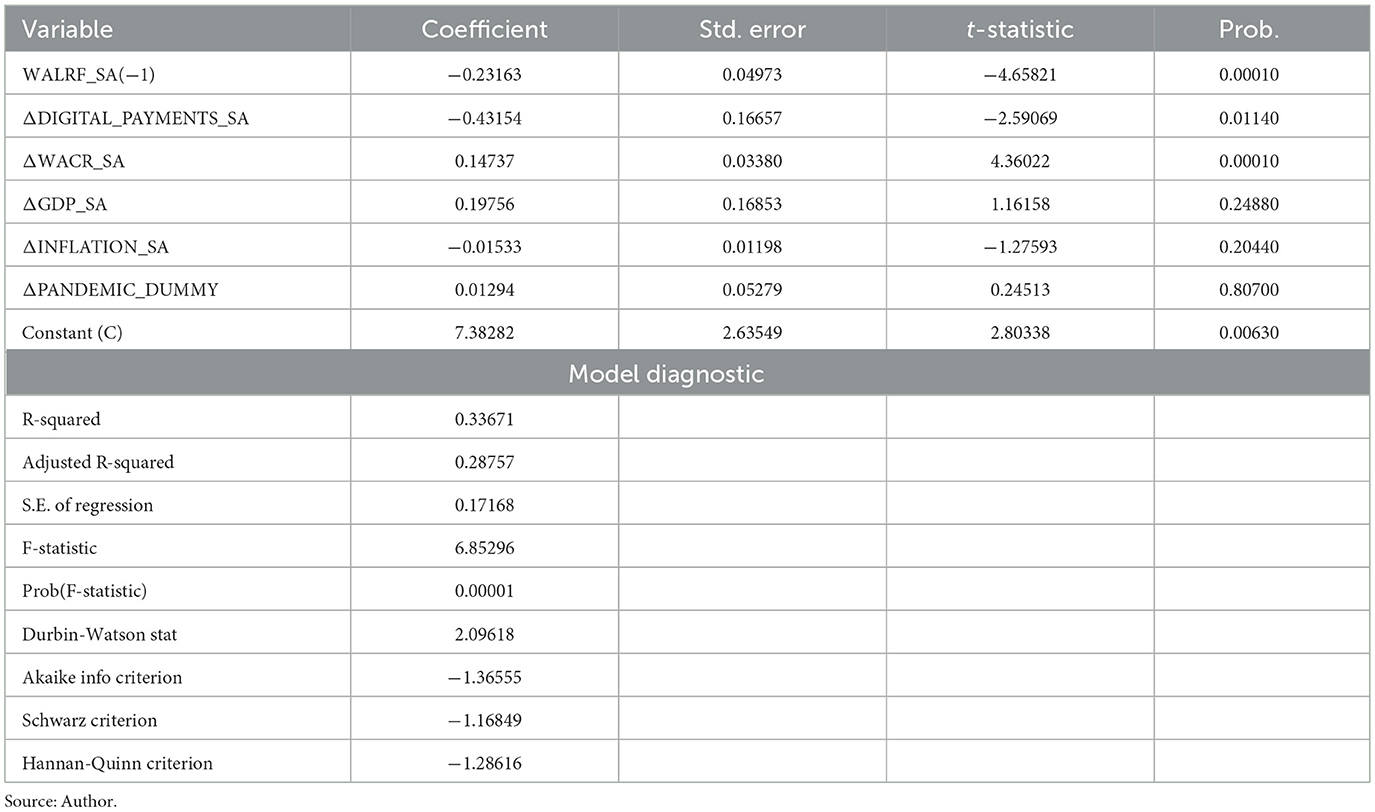
Table 4. Short-run ARDL model.
This shows that WALRF rate falls quickly as digital payments rise. This implies that the financial sector has to become more productive and sustainable. The model further highlights the positive influence of WACR on short-term lending rates, with a coefficient of ~0.15, emphasizing its importance in the monetary policy framework. The ARDL Error Correction Model demonstrates the speed of adjustment toward long-run equilibrium.
The consistent results between the short-run and long-run ARDL models can be econometrically justified by the inherent design of the ARDL framework, which effectively captures both the immediate and equilibrium dynamics of the variables in question. The significant and comparable coefficients across both models suggest that the relationships between digital payments, WACR, and WALRF are robust and stable over different time horizons.
This alignment underscores the ARDL model's ability to integrate short-term fluctuations and long-term trends, providing a comprehensive understanding of the monetary policy transmission mechanism facilitated by digital payments. The coefficient for the error correction part (Table 5) is about −0.23. This means that every month, more than 23 percent of deviations from the long-term equilibrium are corrected. This rapid correction mechanism underscores the dynamic interplay between digital payments and financial policy, highlighting the crucial role of digital financial infrastructures in stabilizing the banking sector and enhancing monetary policy effectiveness.
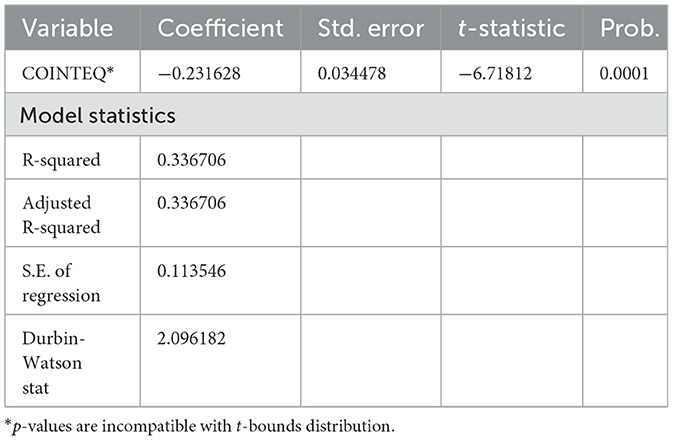
Table 5. ARDL error correction model.
5.2 Discussion
However, examining the extensive literature review reveals limited direct overlap with our specific findings on the association between digital transactions and the implementation of economic policy in India. The role of digital payments in reducing lending rates and enhancing monetary policy pass-through, as highlighted in our results, remains underexplored in the literature reviewed. Studies such as (Agarwal et al. 2017) investigating the influence of India's Pradhan Mantri Jan Dhan Yojana, and mobile money's impact on economic behavior, like (Jack and Suri, 2011) analyzing the economics of M-PESA in Kenya, underscores the transformative potential of digital payments in developing economies, albeit without directly addressing their role in monetary policy transmission.
Technological barriers persist as a significant challenge in growing economies and, more generally, in developing cultures. In India, the increased number of restrictions that come with new technology has made it harder to carry out monetary policy smoothly. A clear illustration is how rural and urban societies reacted differently to digitalization. UPI and mobile wallets have grown a lot, but technological problems like server unavailability, poor network coverage in certain places, and being open to fraud have made it such that the successful transmission of monetary policy depends a lot on fixing these problems (Hunady et al., 2025). Undoubtedly, digital awareness is a primary facilitator of seamless change (Meena and Santhanalakshmi, 2024) examined how the “digital literacy divide” across diverse societies and enterprises in India obstructs the advantages of complete digital transformation.
From a regulatory and policy perspective, the findings resonate with the literature on the impact of regulatory frameworks on digital payment adoption. (Dupas et al. 2014) and other research indicate that digital payment mechanisms, such as mobile money, significantly facilitate economic participation and enhance stability. Our study indicates that digital payments significantly and rapidly influence lending rates. This substantiates the notion that emerging digital financial technology may reduce costs and enhance bank competitiveness, hence increasing the accessibility of banking services to a broader population. Digital payments are shaped by the institutional and regulatory frameworks that organize the industry in the proper manner that avoid any disruption of the flow of the economic activity. Global research highlights the necessity of standardization and enforcement mechanisms in financial digitalization to improve transparency and foster trust within the realm of digital transformation. Following the Indian Government's embrace of digital payments, the Reserve Bank of India has focused on achieving a delicate equilibrium between digital inclusion and financial stability. In pursuit of these objectives, numerous regulations and acts have been enacted, including the Payment and Settlement Systems Act of 2007, licensing of payment banks, and various initiatives such as the introduction of the Unified Payments Interface (UPI). This aligns with the experiences of numerous other central banks; for example, the reforms in the Jordanian banking system underscore the importance of sustainability and digital transformation (Alroud, 2025). In the context of Indian experience, the event of demonetization and the ensuing digital transformation served as the primary catalyst for the regulatory framework. In greater detail, during the early phases of demonetization, it became mandatory for Indians to establish new bank accounts and make initial deposits in these newly opened accounts, presenting a significant statutory challenge for a densely populated nation such as India.
As a key player in monetary policy transmission, it is important to note the response of Indian banks to digitization in their internal structure. In this perspective, the Indian experience aligns with the findings of (Hunady et al. 2025) on the need of digital literacy among workforces to provide a conducive atmosphere for sustained digital innovations. Conversely (Mohamad et al. 2025) prove that governmental assistance along with digital literacy is regarded worldwide as a primary factor in the proliferation of organizational adoption of digital transformation. In the Indian context, the integration of fintechs and traditional banks, supported by the Government of India, is exemplified by various initiatives such as Digital India, which has enhanced the financial services landscape and improved monetary policy transmission by reducing dependence on cash-intensive operations and establishing a more resilient ecosystem.
Extensive studies have been conducted on digital payments, examining the many factors that facilitate or hinder their use (Schuh and Stavins 2014) and (McAndrews and Wang 2008) examined the factors influencing individuals' selection of payment options. This aligns with our findings: more digital payments enhance operational efficiency. (Arango et al. 2011) and (Zachariadis and Ozcan 2017) discuss the impact of incentives and emerging technologies on transformation. This corroborates our study's findings: digital payments significantly influence the efficacy of economic policy. These results demonstrate the significance of digital payments in enhancing the efficacy of India's monetary policy. The strong correlations shown in long-term and short-term models, together with the rapid correction of mistakes, demonstrate that digital payment systems are essential for improving the effectiveness of monetary policy, lowering loan interest rates, and promoting financial stability. These findings endorse the sustained use and expansion of digital payment technology inside the financial system to achieve broader macroeconomic objectives. This integration supports the main goals of economic policy and improves the financial sector's responsiveness, which aims to establish a stable and efficient financial system.
Our results align largely with the existing research on the effect of digitalization on the monetary policy transmission. The (Huang et al. 2024) asserts that using digital techniques for monetary policy transmission enhances the effectiveness of monetary policy pass-through. (Hasan et al. 2021) affirmed that the capacity for digitization substantially affects the transmission of monetary policy via the lending channel, indicating that digital technologies may modify reactions to policy shocks. Our claim on short-run dynamics, which exhibit immediate impacts that amplify competitive pressures in the banking sector, is substantiated by comprehensive research. (Gropp et al. 2014) and (van Leuvensteijn et al. 2011) have shown that the rate of adopting technology improvements is expediting the transfer of lending rates to the actual economy. The fierce competition within the banking sector narrows spreads and accelerates responses to policy changes. (Wang 2024) proposed a theoretical framework suggesting that the adoption of digital payments can expedite the transmission of monetary policy while simultaneously reducing certain traditional channels, necessitating sophisticated modeling to evaluate the impact of payment method digitalization on monetary policy transmission channels. (Huang et al. 2024) contended that digitization has a neutral influence on monetary policy transmission channels, presenting persuasive evidence of significant enhancements in the transmission of monetary policy attributable to advances in e-money inside low-income and developing nations.
5.3 Robustness tests and stability analysis
We performed several diagnostic tests (Table 6) to make sure our empirical findings were reliable and robust. These tests included the Bounds Test for Cointegration, the Breusch-Pagan-Godfrey Heteroskedasticity Test, the Breusch-Godfrey Serial Correlation LM Test, and stability analysis using the CUSUM test (Figure 4).
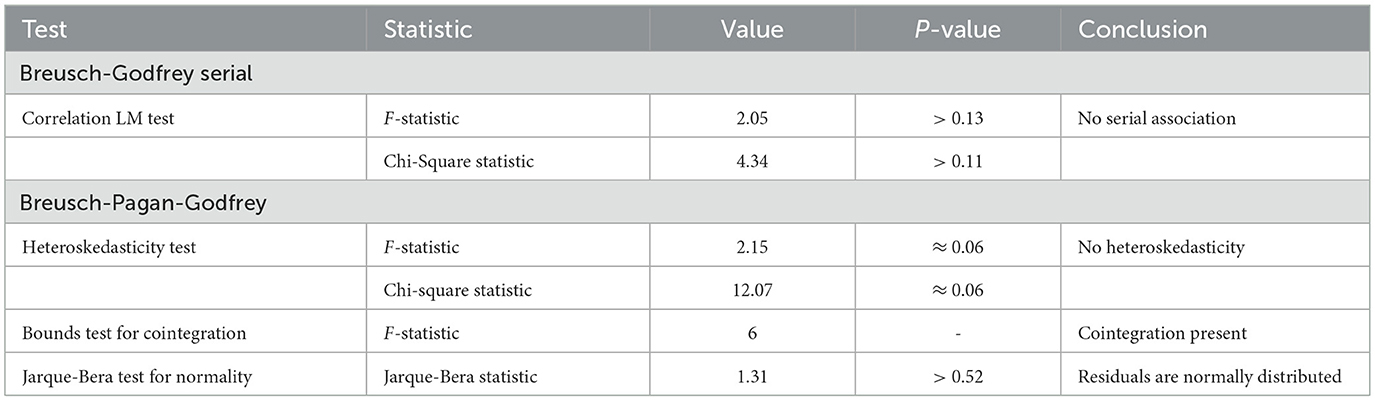
Table 6. Robustness test results.
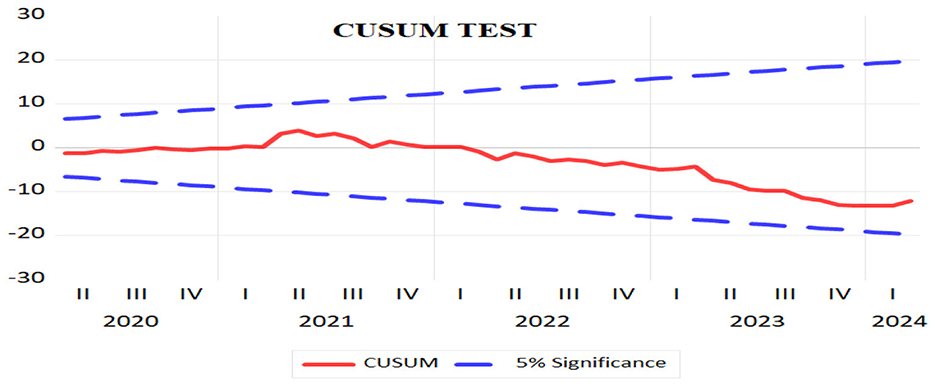
Figure 4. CUSUM test for stability (2020–2024).
We used the Breusch-Godfrey Serial Correlation LM Test to find autocorrelation in the residuals up to two lags. There was a p-value greater than 0.13, which means that the null hypothesis, which says there is no serial association, could not be rejected. This shows that the residuals don't have any serial correlation, which proves that the model is good at showing how the basic data changes over time. To determine if the remaining values were heteroskedastic, we employed the Breusch-Pagan-Godfrey Test. The homoskedasticity null hypothesis was not rejected as well, and the p-value was about 0.06. The results show that there is not enough strong evidence for heteroskedasticity, which means that the model's error variance stays the same across all data. To determine if there was a lasting relationship across the variables in question, we employed the Bounds Test for Cointegration. We may reject the null hypothesis that there is no cointegration since the F-statistic of 6.00 was more than the upper limit critical values at all standard significance levels (10, 5, and 1%). This proves that the factors move together over time, which means that there is a stable equilibrium connection. We used the CUSUM test to check the model parameters' stability again. The CUSUM plot stayed within the 5 percent significance thresholds the whole time the data was being collected. This means that the model parameters are stable over time. This provides further confidence in the reliability of our model and its estimates. To determine if the residuals were normal, we employed the Jarque-Bera test. Since the p-value was greater than 0.52, we were unable to rule out the null hypothesis that the remaining values are regularly distributed. The histogram of residuals confirmed the normality assumption, which meant that the standard errors are reliable and fair. The diagnostic tests all show that the model is strong, well-defined, and reliable. This gives us confidence in the accuracy of our empirical results about how digital payments can help improve the propagation of financial policy in India. The findings are strong because there is no serial association or heteroskedasticity, there is cointegration, and the parameters are stable. This shows that digital payments have a big effect on how well monetary policy works.
6 Conclusion
In an overpopulated nation such as India, the swift adoption of digital payment methods among the populace presents an intriguing opportunity to examine and document how the Indian experience has successfully navigated various challenges. This journey commenced with the significant shift toward digitalization during the demonetization phase in 2016 and culminated in the notable success in addressing the adverse effects of the Covid-19 crisis.
This paper offers a thorough examination of the crucial impact digital payments represented namely by RTGS and NEFT have in improving the efficiency of the propagation of financial policy in India. Utilizing the Long Run ARDL Model, ARDL Short-Run Dynamics, and ARDL Error Correction Model, we have demonstrated a strong connection between the expansion of digital payments and the enhanced efficacy of monetary policy execution. Our results reveal that digital payments substantially lower the Weighted Average Lending Rate on Fresh Rupees Loans (WALRF), that's with a 1 per cent increase in the digital payment's adoption, WALRF was decreased by 0.43 per cent during the period of the study indicating a notable enhancement in the way monetary policy is transmitted.
This influence is observed both in the short term and the long term, highlighting the immediate benefits and sustained advantages of increased digital payment adoption. Specifically, greater reliance on RTGS and NEFT transactions strengthens the responsiveness of loan and credit rates to changes in policy rates. The rapid adjustment toward long-run equilibrium further underscores the dynamic and stabilizing effects of digital financial infrastructures on the banking sector.
The results align closely with previous research highlighting the crucial role of digital financial services in ensuring economic stability and advancing financial inclusion. Our study builds upon these insights by quantifying the impact of digitalization in payment methods on the competitiveness among banks and detailing how a greater reliance on digital payments influences lending rates.
From a policy perspective, the findings suggest that the continued promotion and integration of digital payment systems within the financial ecosystem are crucial for achieving broader macroeconomic objectives. Such integration not only enhances the responsiveness and competitiveness of the banking sector but also aligns with the overarching goals of monetary policy, fostering a stable and efficient financial landscape.
Despite the rapid proliferation of digital money worldwide and its significant impact on monetary policy formulation, India's expertise in this domain remains far behind. In contrast to many major economies, private cryptocurrencies like Bitcoin and Ethereum are not legally authorized as circulating currency in India, since they lack recognition as legal tender by the RBI and the Government of India. The most recent update about this matter was the statement from the Governor of the Reserve Bank of India (RBI) in June-2025 (Reserve Bank of India, 2025), whereby Mr. Sanjay Malhotra affirmed that the RBI maintains its prudent approach, given its association with risks to financial stability and monetary policy. The lack of defined frameworks continues to hinder the seamless deployment of private digital currencies. This constraint has restricted our study in keeping pace with the worldwide trend on the impact of digital currency. This research has concentrated only on the impact of digital payments on the lending channel. Despite the lending channel being a primary mechanism of monetary policy transmission, future research may elucidate the importance of digital payment methods across different channels, particularly for the credit channel.
Data availability statement
Publicly available datasets were analyzed in this study. The data were obtained from the official sources of the Reserve Bank of India's Database, specifically covering monthly digital payment volumes, values, and monetary policy variables. The authors processed the data using appropriate techniques to ensure accuracy and consistency. The processed data supporting the findings of this study are available from the corresponding author upon reasonable request.
Author contributions
HM: Data curation, Methodology, Formal analysis, Investigation, Software, Visualization, Resources, Writing – original draft. DA: Supervision, Conceptualization, Validation, Writing – review & editing.
Funding
The author(s) declare that no financial support was received for the research and/or publication of this article.
Conflict of interest
The authors declare that the research was conducted in the absence of any commercial or financial relationships that could be construed as a potential conflict of interest.
Generative AI statement
The author(s) declare that no Gen AI was used in the creation of this manuscript.
Any alternative text (alt text) provided alongside figures in this article has been generated by Frontiers with the support of artificial intelligence and reasonable efforts have been made to ensure accuracy, including review by the authors wherever possible. If you identify any issues, please contact us.
Publisher's note
All claims expressed in this article are solely those of the authors and do not necessarily represent those of their affiliated organizations, or those of the publisher, the editors and the reviewers. Any product that may be evaluated in this article, or claim that may be made by its manufacturer, is not guaranteed or endorsed by the publisher.
Supplementary material
The Supplementary Material for this article can be found online at: https://www.frontiersin.org/articles/10.3389/fhumd.2025.1673850/full#supplementary-material
References
Agarwal, S., Shashwat, A., Pulak, G., Soumya, G., Tomasz, P., Amit, S., et al. (2017). Banking the Unbanked: What Do 255 Million New Bank Accounts Reveal about Financial Access? New York, NY: Columbia Business School Research Paper, no. 17–12. doi: 10.2139/ssrn.2906523
Aker, J. C., Boumnijel, R., McClelland, A., and Tierney, N. (2016). Payment mechanisms and antipoverty programs: evidence from a mobile money cash transfer experiment in niger. Econ. Dev. Cult. Change 65, 1–37. doi: 10.1086/687578
Alroud, S. F. (2025). Digital transformation as a moderator: a study of the impacts of sustainability reporting disclosure on financial reporting quality in the jordanian banking sector. Economics 13, 389–413. doi: 10.2478/eoik-2025-0046
Arango, C. A., Kim, P. H., and Leonard, S. (2011). How Do You Pay? The Role of Incentives at the Point-of-Sale. ECB Working Paper 1386. European Central Bank. doi: 10.2139/ssrn.1932620
Aron, J. (2018). Mobile money and the economy: a review of the evidence. World Bank Res. Obs. 33, 135–188. doi: 10.1093/wbro/lky001
Attanasio, O. P., Luigi, G., and Tullio, J. (2002). The demand for money, financial innovation, and the welfare cost of inflation: an analysis with household data. J. Polit. Econ. 110, 317–351. doi: 10.1086/338743
Bai, J., and Perron, P. (2003). Critical values for multiple structural change tests. Econ. J. 6, 72–78. doi: 10.1111/1368-423X.00102
Beck, T., Haki, P., Ravindra, R., and Burak, R. U. (2018). Payment instruments, finance and development. J. Dev. Econ. 133, 162–186. doi: 10.1016/j.jdeveco.2018.01.005
Bhoi, B. K., Arghya, K. M., Jang, B. S., and Gangadaran, S. (2016). Effectiveness of alternative channels of monetary policy transmission: some evidence for India. Macroecon. Finance Emerging Mark. Econ. 10, 19–38. doi: 10.1080/17520843.2016.1188837
Björkegren, D., and Grissen, D. (2020). Behavior revealed in mobile phone usage predicts credit repayment. World Bank Econ. Rev. 34, 618–634. doi: 10.1093/wber/lhz006
Chattopadhyay, S. K., and Mitra, A. K. (2023). Monetary policy transmission in india under the base rate and MCLR regimes: a comparative study. Hum. Soc. Sci. Commun. 10, 1–14. doi: 10.1057/s41599-023-01883-9
Dupas, P., Sarah, G., Anthony, K., and Jonathan, R. (2014). “Challenges in banking the rural poor: evidence from Kenya's Western province,” in African Successes, Volume III: Modernization and Development, eds. S. Edwards, S. Johnson, and D. N. Weil (Chicago: University of Chicago Press), 63–101.
Fouillet, C., Isabelle, G., and Jean-Michel, S. (2021). Demonetization and digitalization: the indian government's hidden agenda. Telecommun. Policy 45:102079. doi: 10.1016/j.telpol.2020.102079
Gropp, R., Christoffer, K., and Jung-Duk, L. (2014). The dynamics of bank spreads and financial structure. Q. J. Finance 4:1450014. doi: 10.1142/S2010139214500141
Hasan, I., Xiang, L., and Tuomas, T. (2021). Technological innovation and the bank lending channel of monetary policy transmission. Available online at: https://papers.ssrn.com/sol3/papers.cfm?abstract_id=3928813 (Accessed April 5, 2021)
Huang, Z., Amina, L., Saito, M., and Wiriadinata, U. (2024). E-money and monetary policy transmission. Available online at: https://www.imf.org/en/Publications/WP/Issues/2024/03/29/E-Money-and-Monetary-Policy-Transmission-546926?utm_source (Accessed March 29, 2024).
Hunady, J., Demeova, E., and Chylakova, V. (2025). The role of digital skills and digitalisation in enhancing labour productivity in the EU. Collect. Pap. New Econ. 3, 33–45. doi: 10.61432/CPNE0301033h
International Monetary Fund (2023). GDP and Population of India: Special Query Report. Washington, DC: IMF Data. doi: 10.5089/9798400263231.002
Jack, W., and Suri, T. (2011). Mobile Money: The Economics of M-PESA. Working Paper 16721. Cambridge, MA: National Bureau of Economic Research. doi: 10.3386/w16721
Jensen, R. (2007). The digital provide: information (technology), market performance, and welfare in the south indian fisheries sector. Q. J. Econ. 122, 879–924. doi: 10.1162/qjec.122.3.879
Kotkowski, R., and Polasik, M. (2021). COVID-19 pandemic increases the divide between cash and cashless payment users in Europe. Econ. Lett. 209:110139. doi: 10.1016/j.econlet.2021.110139
Koulayev, S., Rysman, M., Schuh, S., and Stavins, J. (2016). Explaining adoption and use of payment instruments by US consumers. RAND J. Econ. 47, 293–325. doi: 10.1111/1756-2171.12129
Ky, S., Rugemintwari, C., and Sauviat, A. (2018). Does mobile money affect saving behaviour? Evidence from a developing country. J. Afr. Econ. 27, 285–320. doi: 10.1093/jafeco/ejx028
Liñares-Zegarra, J. M., and Willesson, M. (2021). The effects of negative interest rates on cash usage: evidence for EU countries. Econ. Lett. 198:109674. doi: 10.1016/j.econlet.2020.109674
MacKinnon, J. G. (1996). Numerical distribution functions for unit root and cointegration tests. J. Appl. Econom. 11, 601–618. doi: 10.1002/(SICI)1099-1255(199611)11:6<601::AID-JAE417>3.0.CO;2-T
Macmillan, R., Paelo, A., and Paremoer, T. (2016). The ‘evolution' of regulation in Uganda's Mobile Money Sector 1. Afr. J. Inf. Commun. 2016, 89–110. doi: 10.23962/10539/21627
McAndrews, J., and Wang, Z. (2008). The Economics of Two-Sided Payment Card Markets: Pricing, Adoption and Usage. Kansas City, MO: Federal Reserve Bank of Kansas City Working Paper, no. 08-12. doi: 10.2139/ssrn.1335331
Meena, G., and Santhanalakshmi, K. (2024). Deconstructing digital transformation: a multidimensional analysis of digital literacy's role in shaping human capital and driving organizational success. Economics 13, 405–430. doi: 10.2478/eoik-2025-0018
Mohamad, Z., Mohd Alim, N. S. S., Abdul Rashid, N. K., Che Hassim, N. H., Anang, Z., Abdullah, S., et al. (2025). The impact of digital entrepreneurial competencies, digital literacy and government support on digital entrepreneurship using regression analysis. Economics 13, 289–308. doi: 10.2478/eoik-2025-0025
Ofoeda, I., Mensah Mawutor, J. K., and Fosu-Hemaa Ohenebeng, D. N. (2024). Financial inclusion, institutional quality and bank stability: evidence from Sub-Saharan Africa. Int. Econ. Econ. Policy 21, 27–64. doi: 10.1007/s10368-023-00578-5
Pesaran, M. H., and Shin, Y. (1995). An Autoregressive Distributed Lag Modelling Approach to Cointegration Analysis. Vol. 9514. Cambridge, UK: Department of Applied Economics, University of Cambridge.
Reserve Bank of India (2004). RTGS Services Now for Bank Customers: RBI. Press Release: 2004-2005/188. Reserve Bank of India.
Reserve Bank of India (2008). RBI to publish monthly data on bank transactions in NEFT and RTGS. Press release: 2008-2009/248. Available online at: https://www.rbi.org.in/scripts/BS_PressReleaseDisplay.aspx?prid=19014 (Accessed August 27).
Reserve Bank of India (2024a). Annual Growth of Digital Payments: Database of Indian Economy→Home→Statistics→Financial Sector→Payment Systems→Payment System Indicators. Mumbai: Reserve Bank of India.
Reserve Bank of India (2024b). Currency with Public/M3: Database of Indian Economy→Home→Statistics→Monetary Statistics→Source of Money Stock (Annually). Mumbai: Reserve Bank of India.
Reserve Bank of India (2024c). Digital Payments: Database of Indian Economy→Statistics→Financial Sector→Payment Systems→Payment Systems Indicators. Mumbai: Reserve Bank of India.
Reserve Bank of India (2024d). IIP: Database of Indian Economy→Home→Statistics→Real Sector→Industrial Statistics→Index of Industrial Production. Mumbai: Reserve Bank of India.
Reserve Bank of India (2024e). Inflation Data: Database of Indian Economy→Home→Statistics→Real Sector→Prices & Wages→Consumer Price Index - Rural, Urban, Combined (All India). Mumbai: Reserve Bank of India.
Reserve Bank of India (2024f). WACR: Database of Indian Economy: Statistics→Financial Market→Money Market. Mumbai: Reserve Bank of India.
Reserve Bank of India (2024g). WALRF: Reserve Bank of India: Home→Press Release→Lending and Deposit Rates of Scheduled Commercial Banks. Mumbai: Reserve Bank of India.
Reserve Bank of India (2025). Post monetary policy press conference by Shri Sanjay Malhotra, RBI Governor. YouTube video, 1:19, 36. Available online at: https://www.youtube.com/watch?v=ysiVzF_X1ks (Accessed June 6, 2025).
Schuh, S. D., and Stavins, J. (2014). The 2011 and 2012 Surveys of Consumer Payment Choice. Boston, MA: Federal Reserve Bank of Boston Research Paper Series Research Data Reports, no. 14-1. Available online at: https://www.bostonfed.org/publications/research-data-report/2014/the-2011-and-2012-surveys-of-consumer-payment-choice.aspx
Shepard, W. (2016). A cashless future is the real goal of india's demonetization move. Forbes. Available online at: https://www.forbes.com/sites/wadeshepard/2016/12/14/inside-indias-cashless-revolution/?sh=73b2c8bd4d12 (Accessed January 6, 2021).
Singh, K., and Kalirajan, K. (2006). Monetary policy in India: objectives, reaction function and policy effectiveness. Rev. Appl. Econ. 2, 181–199. doi: 10.22004/ag.econ.50149
Somville, V., and Vandewalle, L. (2018). Saving by default: evidence from a field experiment in rural India. Am. Econ. J. Appl. Econ. 10, 39–66. doi: 10.1257/app.20160547
van Leuvensteijn, M., Sørensen, C. K., Bikker, J. A., and van Rixtel Adrian, A. R. J. M. (2011). Impact of bank competition on the interest rate pass-through in the Euro area. Oxford Bull. Econ. Stat. 73, 1359–1380. doi: 10.1080/00036846.2011.617697
Wang, H. (2024). Transformation of monetary policy transmission mechanisms in the digital economy era. Theor. Econ. Lett. 15, 2065–2080. doi: 10.4236/me.2024.1512065
Wisniewski, T. P., Polasik, M., Kotkowski, R., and Moro, A. (2021). Switching from cash to cashless payments during the COVID-19 pandemic and beyond. Int. J. Central Banking. 20, 303–371. doi: 10.2139/ssrn.3794790
Keywords: banking sector, digital payments, monetary policy, ARDL model, Weighted Average Call Money Rate (WACR), Weighted Average Lending Rate sanctioned on Fresh Rupees Loans (WALRF)
Citation: Mostafa H and Arumugasamy D (2025) Impact of digital payments on monetary policy transmission in India: evidence from the post-demonetization era. Front. Hum. Dyn. 7:1673850. doi: 10.3389/fhumd.2025.1673850
Received: 26 July 2025; Accepted: 08 September 2025;
Published: 01 October 2025.
Edited by:
Zoran Mastilo, Faculty of Business Economics, Bosnia and HerzegovinaReviewed by:
Adis Puška, University of Bijeljina, Bosnia and HerzegovinaBranka Topic Pavkovic, Univerzitet u Banjoj Luci Ekonomski Fakultet, Bosnia and Herzegovina
Kostiantyn Pavlov, Lesya Ukrainka Volyn National University, Ukraine
Copyright © 2025 Mostafa and Arumugasamy. This is an open-access article distributed under the terms of the Creative Commons Attribution License (CC BY). The use, distribution or reproduction in other forums is permitted, provided the original author(s) and the copyright owner(s) are credited and that the original publication in this journal is cited, in accordance with accepted academic practice. No use, distribution or reproduction is permitted which does not comply with these terms.
*Correspondence: Husam Mostafa, aG00NjkzQHNybWlzdC5lZHUuaW4=