


- 1Trinity College Institute of Neuroscience and School of Psychology, Trinity College Dublin, Dublin, Ireland
- 2Department of Psychological Sciences, University of Melbourne, Melbourne, VIC, Australia
Recent electrophysiological research has sought to elucidate the neural mechanisms necessary for the conscious awareness of action errors. Much of this work has focused on the error positivity (Pe), a neural signal that is specifically elicited by errors that have been consciously perceived. While awareness appears to be an essential prerequisite for eliciting the Pe, the precise functional role of this component has not been identified. Twenty-nine participants performed a novel variant of the Go/No-go Error Awareness Task (EAT) in which awareness of commission errors was indicated via a separate speeded manual response. Independent component analysis (ICA) was used to isolate the Pe from other stimulus- and response-evoked signals. Single-trial analysis revealed that Pe peak latency was highly correlated with the latency at which awareness was indicated. Furthermore, the Pe was more closely related to the timing of awareness than it was to the initial erroneous response. This finding was confirmed in a separate study which derived IC weights from a control condition in which no indication of awareness was required, thus ruling out motor confounds. A receiver-operating-characteristic (ROC) curve analysis showed that the Pe could reliably predict whether an error would be consciously perceived up to 400 ms before the average awareness response. Finally, Pe latency and amplitude were found to be significantly correlated with overall error awareness levels between subjects. Our data show for the first time that the temporal dynamics of the Pe trace the emergence of error awareness. These findings have important implications for interpreting the results of clinical EEG studies of error processing.
Introduction
The ability to detect errors is an essential prerequisite for adaptive behavior, signaling that performance levels are inadequate to achieve current goals. Our understanding of the neural networks involved in such a process has greatly increased in recent decades (Botvinick et al., 2004; Ridderinkhof et al., 2004; Yeung et al., 2004), but researchers have not typically made the important distinction between error detection and conscious error awareness. Diminished error awareness greatly limits the extent to which corrective behavior can be initiated and maintained in the long-term and has been linked to loss of insight and symptom severity in several clinical populations (Mintz et al., 2004; O'Keeffe et al., 2004; Larson and Perlstein, 2009; O'Connell et al., 2009a; Perez et al., in press). Early scalp electroencephalography (EEG) studies in humans revealed the existence of two distinct event-related signals associated with the processing of action errors: the error-related negativity (ERN; Falkenstein et al., 1990; Gehring et al., 1993), a fronto-central deflection peaking 20–100 ms after the erroneous response, and the error positivity (Pe; Falkenstein et al., 1991, 1995), a late (300–500 ms) positive wave that is maximal at centro-parietal electrodes. Of the relatively small number of studies that asked participants to explicitly signal any errors they made, a majority have reported that the amplitude of the ERN is unaffected by error awareness whereas the Pe is only present on error trials that are consciously perceived as such (Nieuwenhuis et al., 2001; Endrass et al., 2005; Overbeek et al., 2005; O'Connell et al., 2007; Shalgi et al., 2009; Dhar et al., 2011).
Extensive research has suggested that the ERN signal may reflect an early detection mechanism sensitive to response conflict (van Veen and Carter, 2002; Yeung et al., 2004), or changes in probability or expectation of reward (Holroyd and Coles, 2002; Holroyd et al., 2004). Despite its robust link to conscious error perception, however, the specific neural mechanism represented by the Pe remains a matter of considerable debate (Overbeek et al., 2005; Ridderinkhof et al., 2009). The Pe has variously been suggested to reflect conscious recognition that an error has occurred (Nieuwenhuis et al., 2001; Endrass et al., 2005), a P3b-like potential in response to the motivational significance of an error (Leuthold and Sommer, 1999; Ridderinkhof et al., 2009), delayed stimulus processing (Shalgi et al., 2009) and, most recently, the accumulation of evidence that an error has occurred (Steinhauser and Yeung, 2010; see also Ullsperger et al., 2010; Wessel et al., 2011). Although much of the literature supports the proposal that the presence of a Pe component is an important prerequisite to awareness of an error, this characterization is more descriptive than mechanistic (Ridderinkhof et al., 2009). Disambiguating whether the Pe may reflect processes that contribute to, or result from, the emergence of error awareness is a critical question that is only beginning to be addressed (see Steinhauser and Yeung, 2010). If the Pe does reflect the emergence of error awareness then one clear and testable prediction which follows is that the temporal dynamics of this component should closely relate to the time at which an error is perceived.
Behavioral studies have measured the timing of error detection using two different types of speeded response (Rabbitt, 1990, 2002; Steinhauser et al., 2008). In the first kind, errors must be signaled via a response which is not mapped to any stimulus (Error Signaling Response, ESR). In the second, errors are signaled by pressing the correct response after error commission (Error Correction Response, ECR). There is evidence to suggest that the ESR is a more appropriate measure when investigating error awareness: error correction is typically associated with significantly faster response times (RTs) than error signaling (some ECRs occur as early as 40 ms after initial error commission; Rabbitt, 1966a,b), and it is unclear whether all ECRs reflect true error detection or merely a delayed activation of the correct response without explicit detection of the initial error (Rabbitt, 2002). By contrast, a correct ESR requires a switching of response sets which is contingent on detection of the initial response as erroneous. Correct ESRs are, therefore, unambiguously characterized by correct error detection and, presumably, by awareness that an error has been committed. For this reason, we employed a speeded awareness press analogous to the ESR as our marker of the timing of error awareness.
Although behavioral studies of the error detection process have frequently employed such speeded awareness responses, almost all event-related potential (ERP) studies to date have enforced a delay between error commission and the subsequent indication of error awareness. One reason for the imposition of such a delay is that the additional motor activity related to error signaling would introduce topographical and morphological distortions within the latency range of the Pe (e.g., Colebatch, 2007). This aspect of experimental design has precluded any investigation of the relationship between the Pe and the timing of error awareness. One notable exception compared error-evoked ERPs from a condition requiring speeded ESRs after error commission to those from a condition requiring ECRs (Ullsperger and von Cramon, 2006), but the relationship between error signaling latency and the Pe component was not examined.
Another limitation of the majority of Pe studies to date has been a tendency to analyze the average ERP signal only (though see Steinhauser and Yeung, 2010; Hughes and Yeung, 2011 for recent exceptions), which discards much of the variability in the original EEG and is not always representative of trends at the single-trial level of analysis (Arieli et al., 1996; Debener et al., 2006; Eichele et al., 2010; Bland et al., 2011). Analysis of the Pe has, therefore, typically been limited to a constrained latency window as derived from the average ERP, which fails to take much of the inherent variability in component amplitude and latency into account. Hence, while it is clear that the Pe is exclusively elicited by consciously perceived errors, previous research has been largely unable to go beyond this “binary” characterization to examine the extent to which variation in Pe amplitude and latency relates to fluctuations in the timing of awareness. This presents a significant problem in interpreting the findings of clinical studies in which group differences in Pe morphology have been reported (e.g., Brazil et al., 2009; O'Connell et al., 2009a; Olvet et al., 2010; Larson et al., 2011; Luijten et al., 2011; Perez et al., in press; Peterburs et al., 2012).
The present study attempted to address these issues by quantifying the relationship between Pe latency and the precise timing of error awareness. Trial-by-trial variations in the timing of awareness were measured via the introduction of a speeded awareness press (analogous to an ESR) to a previously validated error awareness paradigm, the Error Awareness Task (EAT) (Hester et al., 2005, 2012; O'Connell et al., 2007; Shalgi et al., 2007, 2009). To eliminate possible motor confounds from our analysis we utilized independent component analysis (ICA) to decompose the EEG into orthogonal independent components (ICs) which were generated by distinct neural sources (Makeig et al., 2004; Onton et al., 2006). ICA, therefore, enabled the parsing of neural activity uniquely related to the Pe from that related to the execution of the speeded awareness response and other co-incident neuro-cognitive phenomena extraneous to error awareness. After isolating the Pe in this way, we demonstrate via a combination of within-subjects single-trial analyses, ROC classification analysis and between-subjects correlations that this component is closely tied to the latency of the awareness response, suggesting it provides an index of the emergence of error awareness.
Study 1
Materials and Methods
Participants
Twenty-nine participants took part in this study. Two were excluded due to poor accuracy on the task (<30% correctly withheld No-go trials). A further participant with no observable Pe component was also excluded from all analyses. This left a final sample of 26 participants (14 female), with a mean age of 23.1 years (SD = 5.4). All participants were right-handed, had normal or corrected-to-normal vision, no history of psychiatric illness or head injury, and reported no history of color-blindness. All participants were asked to refrain from ingesting any caffeine on the day of testing. They provided written informed consent before testing began, and all procedures were approved by the Trinity College Dublin ethics committee and in accordance with the Declaration of Helsinki. Participants received a gratuity of €20 to cover any expenses incurred on the day of testing.
Study design
We employed the EAT, (see Figure 1) developed by Hester and colleagues (Hester et al., 2005, 2012). The EAT is a Go/No-go response inhibition paradigm in which a serial sequence of color words is presented to participants, with congruency between the font color of the word and its semantic content manipulated across trials. In the iteration of the paradigm used here, subjects were required to respond as quickly as possible with a single “A” button press in situations where the semantic content of the word and the color in which it was presented were incongruent (Go trial), and to withhold this response in two different circumstances: (1) when the word presented on the current trial was the same as that presented on the previous trial (“Repeat” No-go), and (2) when the meaning of the word and its font color matched (“Congruent” No-go). In the event that participants failed to withhold to either type of No-go stimulus (a commission error; referred to hereafter as an “error press”), they were required to press a second “B” button as quickly as possible when they realized their error (referred to hereafter as an “awareness press”). The inclusion of this speeded awareness press represents a departure from previous iterations of the EAT (Hester et al., 2005, 2012; O'Connell et al., 2007; Shalgi et al., 2007, 2009) and other error awareness paradigms (e.g., Nieuwenhuis et al., 2001) which required participants to delay this response for a fixed time. This aspect of the study design was advantageous as it provided a trial-by-trial measure of the timing of error awareness. Participants were instructed to perform the task “as quickly and as accurately as possible.”
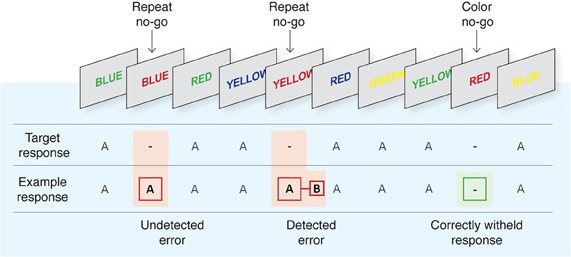
Figure 1. The Error Awareness Task [EAT; Hester et al. (2005, 2012)]. Participants were required to make a speeded button press (“A”) to all incongruent stimuli (word and color not matching) and to withhold from responding to congruent stimuli or when a word was repeated on consecutive trials. Participants were also required to press a different button (“B”) as soon as possible following commission errors to indicate error awareness.
Each participant was required to complete an automated training session which provided a standardized set of instructions and practice protocols in three separate steps. First, participants were asked to make speeded presses to a sequence of 10 standard Go trials. Second, participants were presented with a sequence of 18 Go trials interceded by both a Repeat No-go stimulus and a Congruent No-go stimulus to which they were asked to withhold responding and to signal any errors. In the event that any stimulus was responded to inappropriately (by withhold on a Go trial, error press on a No-go trial and/or lack of awareness press following this error) the participant was automatically provided with feedback outlining their error and forced to repeat that training protocol until perfect accuracy was achieved. Third, participants progressed to an extended practice session without performance feedback, which lasted approximately 4 min and allowed the experimenter to assess the extent to which the participant was capable of performing the task without further instruction. In the event of any obvious persisting problems in task performance during this practice session (low accuracy/no awareness press to errors), the entire training protocol was repeated. The large majority of participants were able to complete the practice session without any repetition.
All instructions and stimuli were presented using the “Presentation” software suite (NeuroBehavioral Systems, San Francisco, CA). Participants were instructed to use the thumb of their right hand for both “A” and “B” button responses (Microsoft “Sidewinder” Controller). Every participant was administered at least eight blocks of the EAT. Where possible (allowing for time constraints), we administered more blocks in order to maximize the number of error trials available for analysis. On average, participants completed of 9.5 (SD = 0.7) blocks (range 8–10). Each block consisted of 224 word presentations, 200 of which were Go stimuli and 24 of which were No-go stimuli (12 Repeat No-gos and 12 Congruent No-gos). All stimuli were presented for 400 ms, followed by an inter-stimulus interval of 1600 ms. The duration of each block was, therefore, approximately 7.5 min. Stimuli were presented in a pseudo-random order, with a minimum of three Go trials between any two No-go trials. Stimuli appeared 0.25° over a white fixation cross and on a gray background. Although the results are not reported here, pupil diameter was recorded throughout task performance (Eyelink 1000, SR Research). Participants used a table-mounted head-rest which fixed their distance from the computer monitor at 80 cm for the entire duration of the task. They were also instructed to maintain fixation at the fixation cross during task performance in order to minimize eye movements.
The EAT contains three main trial-types: correct “Go trials,” where an incongruent Go stimulus was followed by a correct “A” button press; “unaware errors,” where either type of No-go stimulus (Repeat or Congruent) was followed by a failure to withhold an “A” button press (i.e., an error press) and no subsequent awareness press; and, most importantly, “aware errors,” where an initial error press to a No-go stimulus was followed by an awareness press before the onset of the next stimulus. Trials where the awareness press occurred after the onset of the next stimulus were counted as an aware error when calculating participants' average behavioral measures of error awareness, but were omitted from all ERP analyses. All mean values below are quoted ± SD. In order to maximize trial numbers in our analyses, and because there was no significant difference in average Aware RT between Congruent No-go trials (564.6 ± 93 ms) and Repeat No-go trials (543.4 ± 76 ms; p = 0.11), we did not distinguish between the two trial types in any analyses.
EEG acquisition and processing
Continuous EEG was acquired using an ActiveTwo system (BioSemi, Netherlands) from 64 scalp electrodes, configured to the standard 10/20 setup and digitized at 512 Hz. Vertical and horizontal eye movements were recorded using two vertical electro-occulogram (EOG) electrodes placed above and below the left eye and two horizontal EOG electrodes placed at the outer canthus of each eye, respectively. EEG data were processed using Matlab via the EEGLAB toolbox (Delorme and Makeig, 2004). Continuous EEG data were re-referenced offline to the average reference, high-pass filtered to 0.5 Hz, low-pass filtered up to 95 Hz and notch-filtered at 50 Hz. Noisy EEG channels were interpolated using spherical spline interpolation. Response-locked data were epoched from 400 ms before to 1600 ms after correct Go responses and error presses, and were baseline-corrected relative to the interval −400 to −200 ms. Waveforms locked to the speeded awareness press were also calculated by epoching data on aware error trials from 500 ms before to 100 ms after this event, using the same pre-error press baseline period. Preliminary artifact rejection was performed using an epoch rejection algorithm in the Fully Automated Statistical Thresholding for EEG artifact Rejection (FASTER) toolbox (Nolan et al., 2010), which identifies artifactual epochs based on their deviation from the mean of each channel, their variance and their amplitude range. Any epoch which exceeded a threshold of ±3 standard deviations on any of these measures was discarded. Data from all electrodes were then subjected to temporal ICA using infomax (Bell and Sejnowski, 1995) and implemented in EEGLAB (Delorme and Makeig, 2004). ICs dominated by EOG artifacts or other noise transients were identified by the FASTER automatic ICA component rejection feature (Nolan et al., 2010), again applying a threshold of ±3 standard deviations to several IC measures including the median IC gradient, spectral slope and correlation with EOG activity. ICs found to violate any of these criteria were subtracted from the EEG.
Inspection of the grand-average response-locked ERP on aware error trials revealed a large positivity maximal at CPz/Pz at a latency of approximately 400 ms post-error, consistent with the classic Pe (Falkenstein et al., 2000; Overbeek et al., 2005). This component was not present on unaware error trials. The ICA decompositions were subsequently employed to parse neural activity on aware error trials related to the Pe and error awareness from that related specifically to the introduction of the speeded awareness press. The initial ICA decomposition was conducted on response-locked data including correct Go trials and all commission errors, but only aware error trials and the corresponding IC activation time-courses therein were used for the selection of Pe ICs, since the Pe was only present in this condition. Previous research across different neuroimaging modalities has implicated multiple candidate brain regions in error awareness and in generating the Pe (van Veen and Carter, 2002; Hermann et al., 2004; Hester et al., 2005; van Boxtel et al., 2005; Klein et al., 2007; O'Connell et al., 2007). It is, therefore, unlikely that ICA decomposition would delineate one distinct IC capturing all the variance in this component. For this reason, we did not limit our search for Pe ICs to one IC per participant. Pe ICs were selected manually for each participant (see Onton et al., 2006 for manual IC selection applied to the P300 component). For an IC to warrant selection, it was required to have a positive peak within the average latency range of the Pe (200–600 ms) when back-projected to original EEG space, and a scalp weighting which was comparable to the average Pe topography for that participant within that latency range (see Results for description of an automated IC selection procedure which produced very similar results). As a further constraint on the selection process, we used the DIPFIT 2 plugin for EEGLAB to localize the equivalent dipole locations of all IC scalp maps. Any IC which was localized to left motor or pre-motor cortex (contralateral to the responding hand) was excluded from consideration. A mean of 2.96 ± 1.0 ICs were selected per participant for further analysis, and their activation profiles summed to estimate variation in the EEG uniquely related to the Pe component for that participant (hereafter referred to as “PeC”). Figure 2A shows the average PeC topography and time-course across all participants when back-projected to original EEG-space, and Figure 3C highlights individual PeC topographies and time-courses for a sample of four individual participants.
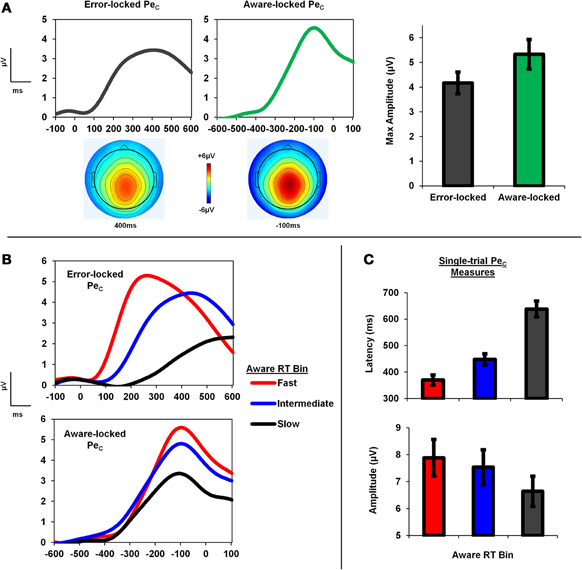
Figure 2. PeC is locked to awareness, not error commission. (A) Group average topography and time-course of the PeC when locked to both the error press and subsequent awareness press on aware error trials. Note the identical topographies, but greater component amplitude when locked to the timing of the awareness response. (B) PeC waveforms binned according to Aware RT and locked to the initial error press and subsequent awareness press. (C) Single-trial PeC latency increased as Aware RT slowed, and single-trial PeC amplitude decreased.
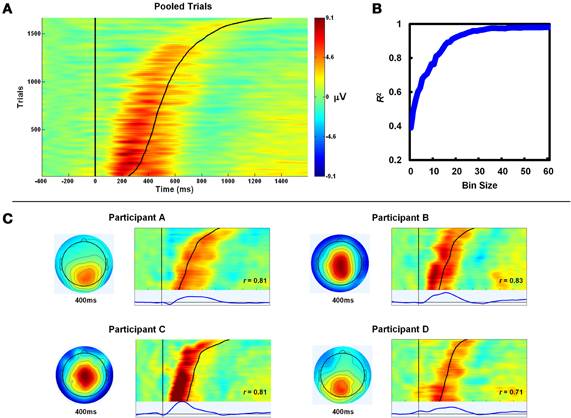
Figure 3. PeC latency correlates with the timing of awareness. (A) Single-trial aware error PeC waveforms locked to the erroneous response, pooled across participants and sorted by Aware RT (black line). For visualization, trials were smoothed across bins of 30 trials with a Gaussian-weighted moving average. Note how PeC peak latency closely tracks Aware RT. (B) To minimize the effect of noise in the single-trial measures on the observed relationship, the pooled single-trials were again sorted by Aware RT and, through repeated iterations, averaged across bins of increasing size (1–60; see text for details). The variance in Aware RT explained by Pe latency (R2) increased with bin size up to approximately 25 trials. (C) Topographies and trial sortings (including average component waveforms) for a subset of four participants. R-values at inset refer to correlation coefficients between single-trial PeC latency and Aware RT for that participant.
Measures and analysis
The task yielded several behavioral measures of interest. Accuracy was calculated as the percentage of correct withholds over all No-go trials. Error Awareness was calculated as the percentage of Aware Errors out of all commission errors made. Error RT was defined as the latency between stimulus onset and error press, and calculated for both aware errors and unaware errors. Lastly, Aware RT was defined as the latency of the speeded awareness response relative to the preceding error press. For both RT measures, trials which were characterized by outlier values of ± 3 standard deviations from the mean were excluded from all ERP analyses.
In all cases the Pe was measured by averaging the activation profile of a cluster of centro-parietal electrodes (CPz, CP1, CP2, Pz, P1, P2), within predefined latency windows which varied between analyses. For the initial comparison of average PeC waveforms locked separately to the error press and the awareness press, PeC amplitude was defined as the maximum amplitude 200–600 ms post-error press in the former, and the maximum amplitude in the 400 ms window preceding the awareness press in the latter. Peak amplitude measures were employed here to facilitate the direct comparison of component amplitude between waveform-types; a mean amplitude measure was not appropriate because any chosen latency window over which to average would not have been directly comparable across waveforms which are locked to events with independent temporal distributions. All further analyses focused exclusively on waveforms locked to the error press. For analyses examining such waveforms averaged across trials, component amplitude was defined as the mean voltage from 200 ms to 600 ms post-error. By contrast, single-trial measurements were taken from a latency window that extended from 200 ms post-error press to the slowest awareness press for each participant (mean = 1196 ± 174 ms after error press), and so varied across participants. Single-trial PeC latency and amplitude were defined as the timing and amplitude, respectively, of the maximum voltage within this broad latency range on each trial. For all post-ICA analyses, a low-pass filter of 6 Hz was applied to the data in order to improve measure reliability (Spencer, 2004).
Primary analyses focused on the comparison of PeC waveforms locked to both the error press and subsequent awareness press in order to determine the event to which the PeC was most closely time-locked. We then quantified the strength of the relationship between the PeC and the timing of awareness via within-subjects, trial-by-trial correlations of PeC latency with Aware RT. We also employed receiver-operating-characteristic (ROC) curve analysis to determine the degree to which information contained in the PeC could be used to accurately classify commission error trials as with or without awareness (see Results for details).
A key advantage of ICA decomposition is that it also allows for the complete removal of the variance in the EEG associated with each distinct IC. This is seen most often when ICA is employed for the identification and removal of eye-blink and other ocular artifacts (e.g., Viola et al., 2009), though the same principle applies to ICs which are uniquely related to specific cognitive processes. This enabled us to completely remove all variance associated with the PeC from aware error ERP waveforms and compare the residual potentials to those evoked on unaware error trials. In order to avoid the possible confounding influence of differing trial numbers across conditions when directly comparing the aware and unaware traces, aware error trials included in this analysis (mean trial count after artifact rejection = 64.7 ± 17.4) were randomly matched for number of unaware error trials (mean trial count after artifact rejection = 32.8 ± 19.6). Measures were extracted for each of 100 iterations of this random trial-matching procedure, and statistical analysis was carried out on the average measures across all iterations. For this analysis, three participants were excluded because they committed less than 10 unaware errors over the entire testing session.
Statistical tests consisted of bivariate correlations (Pearson's r), paired-samples t-tests and repeated-measures analyses of variance (ANOVAs) where appropriate. Greenhouse–Geisser corrected degrees of freedom were used in cases of violated sphericity with corrected p-values reported.
Results
Behavior
Relevant behavioral measures from Study 1 are highlighted in Table 1. Mean Error RT on aware error trials was significantly faster than mean correct Go RT (t25 = 4.03, p < 0.001), which in turn was faster than mean Error RT on unaware error trials (t25 = 3.97, p = 0.001). It is also noteworthy that there was considerably greater within-subject variability (SD) in Aware RT (236.3 ± 64.5 ms) compared to Go RT (143.6 ± 40.5 ms) and Error RT on both aware (119.5 ± 33.4 ms), and unaware error trials (124/5 ± 60.7 ms; all p < 0.001). Trial-by-trial variance in Error RT did not relate to variance in Aware RT (mean within-subjects r = −0.01 ± 0.03).
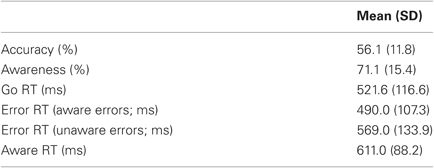
Table 1. Study 1 behavioral measures.
PeC latency correlates with the timing of error awareness
We first sought to determine whether the PeC was better related to the timing of initial error commission or to the timing of error signaling, and examined this question by comparing component amplitude in the average aware error waveforms locked to the initial error press and the subsequent awareness press. We reasoned that the weaker the temporal relationship between the PeC and a given event is, the lower the amplitude of the respective average waveform should be due to increased latency jitter. We found that peak PeC amplitude in the average waveforms locked to the awareness press (5.33 ± 3.06 μV) was significantly greater than peak amplitude as measured from the error-locked waveforms (4.17 ± 2.24 μV; t25 = 4.48, p < 0.001; Figure 2A).
To explore the relationship between the PeC and Aware RT, single-trial PeC latency and amplitude values on aware errors were sorted according to Aware RT, and divided into three bins consisting of Fast, Intermediate, and Slow Aware RT trials. A One-Way repeated-measures ANOVA revealed a significant main effect of bin on PeC latency [F(1.5, 37.9) = 104.64, p < 0.001], driven by faster latencies in the Fast compared to the Slow Aware RT bins as revealed by planned post-hoc contrasts (t25 = 11.77, p < 0.001; Figure 2C). A separate ANOVA also revealed a significant main effect of Aware RT bin on PeC amplitude [F(1.7, 43.4) = 23.81, p < 0.001], which was due to larger component amplitudes in the Fast compared to the Slow bins (t25 = 5.68, p < 0.001; see Figure 2C).
To better quantify the strength of the relationship between the PeC and the timing of the speeded awareness press we conducted within-subjects, trial-by-trial correlations of PeC latency with Aware RT. On average, mean single-trial PeC latency (487 ± 109 ms) occurred significantly earlier than mean Aware RT measured across the same trials (573 ± 90 ms; t25 = 4.36, p < 0.001). As Figure 3A illustrates, however, there was a robust trial-by-trial correlation between both measures (mean r = 0.60 ± 0.21; t25 = 14.75, p < 0.001). Hence, single-trial PeC latency accounted for 36% of the variance in Aware RT. To verify the effects of filtering on this result, we repeated the same analysis using a higher cut-off for the low-pass filter (30 Hz). This change produced a comparable but smaller correlation between single-trial PeC latency and Aware RT (mean r = 0.49 ± 0.19), indicating the use of a 6 Hz low-pass filter helped to eliminate noise in the single-trial measures. As is frequently the case with RT measures, the distributions of PeC latency and Aware RT were both positively skewed and this may have partly driven the strength of the observed correlation between these variables. To rule out this possibility, their distributions were log-transformed and the correlation coefficients recalculated. Transformation had no effect on the strength of the relationship between these measures (mean r-value using log-transformed distributions: 0.59 ± 0.21).
For comparison, the single-trial, within-subjects correlation coefficients were also calculated using the original Pe waveforms, with all measures defined identically to those employed above. The results showed that the isolation of Pe ICs led to a stronger relationship between peak latency and Aware RT than was observed using the original Pe waveforms (mean r-value: 0.54 ± 0.23) although the difference did not reach statistical significance (t25 = 1.67, p = 0.11).
We also replicated our within-subjects correlational findings using PeCs which were selected using completely objective criteria. For this analysis, all ICs for a given participant were back-projected to EEG space before calculating mean signal amplitude (averaged over the relevant Pe channels defined above) and scalp topography, across the relevant Pe latency window (200–600 ms post-error), for each IC. Spatial correlations between the resulting topographies of each IC and that participant's raw Pe topography, averaged across the same latency range, were subsequently calculated. Both values (spatial correlation and mean amplitude) for each IC were normalized relative to the mean and standard deviation across all ICs for that participant (converted into z-scores), and a combined score was derived for each IC by obtaining the average of the two z-scores. By basing automatic IC selection on this combined score, we placed equal weight on both criteria employed during the manual IC selection process: (1) topographic similarity with the original Pe component, and (2) a readily apparent positive peak within the latency range of the Pe. Using an arbitrary threshold score of +1.5 z, a mean of 2.5 (±1.2) ICs were selected by this procedure, which was slightly lower than the number of ICs selected manually (t25 = 2.13, p < 0.05). A robust correlation between the single-trial latency of the automatically selected PeCs and Aware RT was observed within-participants (mean r-value: 0.58 ± 0.24) which was slightly lower but statistically equivalent to the strength of the relationship observed between these measures after manual IC selection (t25 = 1.25, p = 0.22).
Despite the combination of ICA and low-pass filtering, measuring peak component latency in the single-trial can be inaccurate because of the inherent noise in the EEG at this level of analysis (e.g., Spencer, 2004). Noise may, therefore, have diminished the sensitivity of the within-subjects correlational analyses toward revealing the true strength of the relationship between PeC latency and Aware RT. In an effort to circumvent this issue, all single-trial aware error traces were pooled across subjects, sorted by Aware RT and, through repeated iterations, averaged across bins of increasing size (1–60). Separate linear regression analyses were conducted for each iteration with PeC latency as the predictor variable and Aware RT as the dependent variable. Here, PeC latency was defined as the latency of the maximum voltage of the average PeC waveform in each bin, between 200 and1600 ms post-error. Hypothetically, including more trials in this averaging process by increasing bin size should eliminate more of the noise in the single-trial waveforms, and hence should provide a truer representation of the strength of the PeC latency/Aware RT relationship. As can be seen in Figure 3B, employing larger bin sizes substantially increased the strength of the relationship between PeC latency and Aware RT, to a point where they shared greater than 95% of their variance (>25 trials per bin).
PeC predicts error awareness
We employed a receiver operating characteristic (ROC) curve analysis (see, for example, Quiroga et al., 2005; Einhauser et al., 2010; Steinhauser and Yeung, 2010) to quantify how well the PeC could predict error awareness on a trial-by-trial basis. For this analysis, all IC weights manually selected for the PeCs were also back-projected to EEG-space for the unaware error condition. Classification accuracy was quantified as the area under the curve (AUC; also referred to as Az) of True Positive rate (percentage aware error trials correctly classified) plotted against False Positive rate (percentage unaware error trials incorrectly classified) across all levels of discrimination threshold: accuracy is 50% if classification is at chance based on the information contained in the PeC, and 100% if classification is perfect. Separate ROC analyses were conducted for each participant on mean component amplitude information in discrete time bins along the whole PeC time-course (window width of 20 ms, moving in 20 ms increments), comparing aware versus unaware error traces. Extracted measures were similar to those for earlier ERP analyses: maximum classification accuracy over the entire time-course (analogous to maximum component amplitude), and the latency at which this occurred relative to error press. Any cases with extracted classification accuracy or latency values exceeding ±3 SD from the mean were excluded.
Average maximum classification accuracy across participants was 75.2 ± 7.2%. The temporal evolution of awareness-predictive activity closely matched the time-course of the average PeC waveform on aware error trials (see Figure 4A). Further, average latency of maximum classification accuracy was 445.4 ± 131.2 ms post-error, which is statistically equivalent to the peak latency of the PeC when derived from the average component waveforms on aware error trials (432.1 ± 99.8 ms; t21 < 1, p = 0.6).
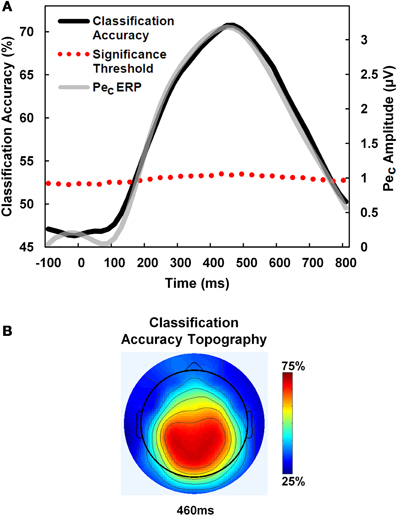
Figure 4. PeC amplitude predicts error awareness. A receiver-operating-characteristic (ROC) curve classifier analysis was employed to predict error awareness using the PeC. (A) Classification accuracy (black line) using pooled single-trials across participants rose above a bootstrapped significance threshold (dotted red line; see text for details) just 180 ms after error commission, and closely traced the time-course of the average PeC on aware errors (gray line). (B) Classification accuracy was maximal over centro-parietal electrodes.
We also examined the earliest latency post-error at which PeC amplitude significantly predicted error awareness. For this analysis, all aware and unaware error trials were pooled across participants and permutation testing was employed to calculate a bootstrapped significance threshold for each discrete ROC time bin along the PeC time-course. For each time bin, component amplitude values from all trials were randomly assigned to aware and unaware conditions according to the relative proportion of each trial type in the overall pool, and a value for classification accuracy was calculated for that bin. This was repeated 1000 times to estimate a permuted distribution of accuracy values for each time bin representing the null hypothesis that accuracy was not greater than chance. If the observed classification accuracy for a time bin derived from the unshuffled trials was greater than 1.96 standard deviations above the mean of the permuted distribution, then component amplitude at that time point was said to significantly predict error awareness at p < 0.05. Using this method, we found that the earliest latency at which the PeC could reliably predict awareness was 180 ms post-error (see Figure 4A).
Between-subjects correlations
Between-subjects bivariate correlations were also carried out to test for relationships between the task-related behavioral measures of error awareness (mean Aware RT; Error Awareness) and our hypothesized neural indices of the emergence of awareness (mean single-trial PeC latency and amplitude; see Figure 5). The single-trial measures were used here because they provide a better reflection of the characteristics and dynamics of each participant's PeC; the average waveforms, by contrast, lose substantial amounts of information pertaining to component amplitude and latency, which may significantly distort or obscure any observed correlations. Outlier participants specific to each correlation were classified as those with studentized deleted residuals above or below 3, and excluded from that analysis.
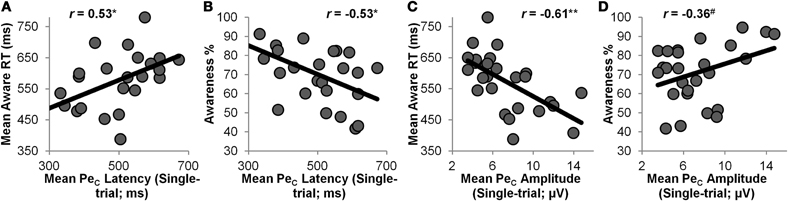
Figure 5. Between-subjects correlations. Mean single-trial PeC latency was positively correlated with mean Aware RT (A) and negatively correlated with % error awareness over the entire task (B); mean single-trial PeC amplitude showed the opposite trends, correlating negatively with Aware RT (C) and positively with % awareness (D). *= p < 0.01, ** = p < 0.001, # = p < 0.1.
Mean single-trial PeC latency was positively correlated with mean Aware RT (r = 0.53, p < 0.01), and negatively correlated with participants' Error Awareness (r = −0.53, p < 0.01). This indicates that participants whose PeCs peaked relatively early were also faster at indicating awareness that they had committed an error, and were generally aware of a greater number of the errors they committed. In addition, mean single-trial PeC amplitude showed a strong negative correlation with mean Aware RT (r = −0.61, p < 0.001), and was weakly positively correlated with Error Awareness (r = 0.36, p = 0.075). Hence, participants with high-amplitude PeCs were faster at indicating error awareness, and were aware of a greater proportion of the errors they committed.
PeC removal from aware errors
Working under the hypothesis that the Pe reflects the emergence of error awareness, we reasoned that if selected PeCs truly contained all of the variation in the EEG related to the Pe component and were subsequently removed from the original aware error waveforms, there should be no difference between the average response-locked ERPs elicited by errors made with and without awareness. The amplitude of the original aware error ERP within the latency range of the Pe (mean amplitude: 4.01 ± 2.3 μV) was substantially reduced when all variance associated with the manually selected PeCs was removed (1.42 ± 1.1 μV; t22 = 8.64, p < 0.001) but a small, statistically significant difference in the amplitude of the aware and unaware (0.82 ± 1.4 μV) error waveforms was still observed (t22 = 2.38, p < 0.05; Figure 6). Although this suggests that IC selection did not capture the Pe component in its entirety, the difference in amplitude between these waveforms was not substantial (0.6 μV).
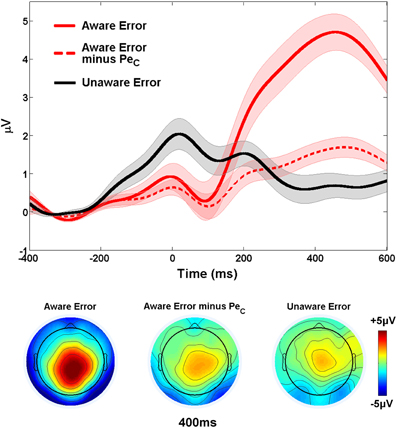
Figure 6. Validation of Study 1 PeCs. The difference in waveform amplitude between aware and unaware errors within the relevant PeC latency range was substantially reduced when all variance related to the PeC was removed from aware error traces. Shaded regions around waveforms represent error bars (SEM).
Study 2
To completely rule out the possibility that the observed PeC latency/Aware RT correlation in Study 1 was driven by the requirement of an overt, speeded motor response to indicate awareness, a second study that included two EAT conditions was conducted. In condition 1, participants completed the same version of the task reported in Study 1; in condition 2 the same participants completed the EAT without the requirement to signal their errors. One concern when selecting relevant ICs in Study 1 related to the fact that Pe-related activity extends to central scalp locations, and hence may not have been dissociated via ICA from any central motor-related activity. Study 2, by contrast, allowed for the derivation of a set of IC weights in condition 2 that were completely uncontaminated by neural activity related to motor-preparation or task-switching and could subsequently be applied to the EEG data from condition 1 for estimation of the PeC.
Materials and Methods
A separate cohort of 16 participants took part in Study 2. One was excluded due to an insufficient number of aware error trials for analysis (<10), and an additional participant was excluded because they did not have an observable Pe component. This resulted in a final sample of 14 participants (four male) with a mean age of 23.6 ± 3.9 years, who met the same inclusion criteria as used in Study 1.
Task design and setup was identical to Study 1, except here all participants completed five blocks of the primary task (“Report” condition) and five blocks in which no awareness press was required even when they were aware of committing an error (“No-Report” condition; order of completion counter-balanced across participants). It was, therefore, impossible to differentiate aware from unaware errors in the No-Report condition, though we can infer, based on the results of the present study and other research employing the EAT (e.g., O'Connell et al., 2007; Shalgi et al., 2009), that the majority of errors in this condition were aware errors. Study 2 therefore, yielded two main trial-types of interest: aware errors, derived from the Report condition and defined as in Study 1 (mean trial count = 27.9 ± 10.9 after artifact rejection); and No-Report errors, defined as any error of commission in the No-Report condition (mean = 35.8 ± 11.0). There were too few unaware errors in the Report condition for reliable analysis (mean = 11.9 ± 9.5).
EEG acquisition and pre-processing followed the procedures employed in Study 1, with the exception that only response-locked data from correct Go trials and No-Report errors were decomposed via ICA. IC weights from this decomposition were then applied to the response-locked aware error data from the Report condition, and Pe ICs were manually selected based on the resulting IC activation time-courses and scalp topographies in the manner outlined previously. A mean of 3.0 ± 1.4 ICs were selected per participant for further analysis. Figure 7A shows the average time-course and topography of the resulting PeCs, across participants, when back-projected to original EEG-space. Single-trial and average component waveform measures were defined in an identical manner to Study 1.
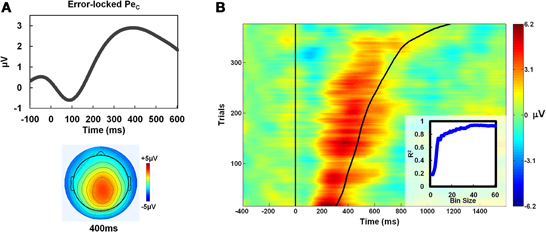
Figure 7. Replication of PeC/Aware RT correlation. (A) Group average topography and time-course of the error-locked PeC in Study 2, where PeCs were selected using ICA weights derived from a control condition which did not require an awareness press, were comparable to those observed in Study 1 (see Figure 2). (B) The relationship between PeC latency and Aware RT reported in Study 1 (see Figure 3) was also apparent in Study 2. This relationship was similarly strengthened as bin size increased using the iterative trial smoothing procedure (shown at inset; compare to Figure 3B).
Primary analyses of the Study 2 data were restricted to aware error trials and focused on replicating the within-subjects correlation effects between PeC latency and Aware RT found in Study 1. Correlation coefficients were calculated for these analyses using original and log-transformed distributions (see Study 1 Materials and methods). The limited trial count for aware errors in Study 2 prevented the binning of trials by Aware RT as in Study 1. Further analyses of the Study 2 data focused on determining whether or not we successfully isolated relevant Pe ICs by comparing average waveforms from aware error and No-Report error trials both with and without inclusion of the manually selected PeCs (see Study 2 Results for details). These analyses employed the iterative randomized trial-matching procedure described previously, here matching No-Report errors for number of aware errors.
Results
Relevant behavioral measures from Study 2 (Table 2) were comparable to those observed in Study 1.
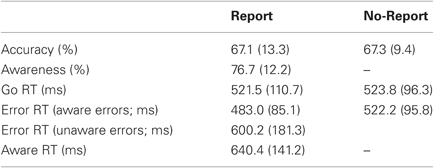
Table 2. Study 2 behavioral measures; mean (SD).
As illustrated by Figure 7B, the relationship between PeC latency and Aware RT reported in Study 1 was also apparent in Study 2. Within-subjects correlations between these measures showed a robust relationship (mean r = 0.54 ± 0.20) that was comparable to that observed in Study 1. This was also the case when the same correlation coefficients were calculated from log-transformed distributions (mean r = 0.56 ± 0.19). Hence, deriving IC weights from the No-Report condition and applying these to the Report condition for Pe IC selection did not affect the strength of the relationship between PeC latency and the timing of the awareness response. The iterative trial smoothing procedure employed on the pooled aware error traces in Study 1 also yielded similar results in Study 2: employing larger bin sizes for averaging substantially increased the strength of the PeC latency/Aware RT relationship, to the point where they shared greater than 90% of their variance (Figure 7B; inset).
We also replicated our within-subjects correlational findings from Study 2 using the automated IC selection protocol outlined previously. A mean of 2.9 (±1.4) ICs were selected by this procedure, which was equivalent to the number of ICs selected manually for Study 2 (t13 < 1, p = 0.80). A robust correlation between the single-trial latency of the automatically selected PeCs and Aware RT was observed within-participants (mean r-value: 0.53 ± 0.23) which, as in Study 1, was slightly lower but statistically equivalent to the strength of the relationship observed between these measures after manual IC selection (t13 < 1, p = 0.81).
Because an unknown number of No-Report error trials are actually unaware errors which do not elicit a Pe component, it was expected that mean amplitude of the average Pe ERP on aware error trials should be greater than the mean amplitude of average No-Report error waveforms. However, we again reasoned that if all Pe ICs were successfully selected and subsequently removed from these original aware error and No-Report error waveforms there should be no difference between the mean amplitudes extracted from the two trial-types, since the variance related to error awareness which was initially driving the amplitude differences should now be eliminated from the data. To address this question, a 2 × 2 repeated-measures ANOVA tested for ERP amplitude differences with factors of trial-type (aware error vs. No-Report error) and ERP-type (with-PeC vs. without-PeC). This analysis (see Figure 8) revealed main effects of trial-type [F(1, 13) = 9.09, p = 0.01; driven by greater mean amplitudes on aware error trials compared to no-report error trials] and ERP-type [F(1, 13) = 10.16, p < 0.01; driven by greater mean amplitudes in ERPs with-PeC compared to without-PeC], and a significant trial-type X ERP-type interaction [F(1, 13) = 10.34, p < 0.01]. Post-hoc comparisons revealed this interaction to be driven by greater amplitudes on aware error trials (mean amplitude = 4.17 ± 2.57 μV) as opposed to no-report error trials (2.22 ± 2.59 μV) when ERPs incorporated variance related to the PeC (t13 = 4.11, p = 0.001), while there was no difference between trial-types when PeCs were subtracted from the ERPs (1.78 ± 1.50 μV vs. 1.07 ± 1.14 μV; t13 = 1.45, p = 0.2). Hence, the selected Pe ICs were highly relevant to error awareness.
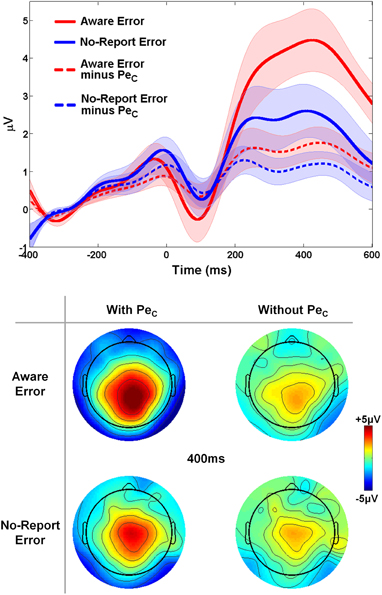
Figure 8. Validation of Study 2 PeCs. The difference in PeC amplitude between aware and no-report errors was eliminated when all variance related to the PeC was removed from both traces. Shaded regions around waveforms represent error bars (SEM).
Lastly, we tested whether or not the PeCs were contaminated by neural activity related to motor execution. In order to isolate neural activity specific to the awareness press, aware error minus No-Report error difference waveforms (low-pass filtered to 20 Hz) were derived from average error-locked ERPs both with and without PeCs. Lateralized neural activity from 200 ms before to 100 ms after the mean Aware RT for each participant (mean = 614.4 ± 132.3 ms) was examined by comparing mean ERP amplitudes across this window at a selection of electrodes corresponding to left (C3, C5, CP5) and right (C4, C6, CP6) motor regions. Amplitude differences were tested via 2 × 2 repeated-measures ANOVA with factors of lateralization (left vs. right hemisphere) and ERP-type (with-PeC vs. without-PeC), which revealed no significant main effect of ERP-type [F(1, 13) = 1.89, p = 0.19], no main effect of lateralization [F(1, 13) < 1, p = 0.36; though trends suggested more positive amplitudes over left compared to right hemisphere; see Figure 9] and, critically, no lateralization X ERP-type interaction [F(1, 13) < 1, p = 0.96]. Hence, the presence of lateralized activity over motor regions was not contingent on the inclusion or removal of the PeC, suggesting PeCs were uncontaminated by motor-related neural activity.
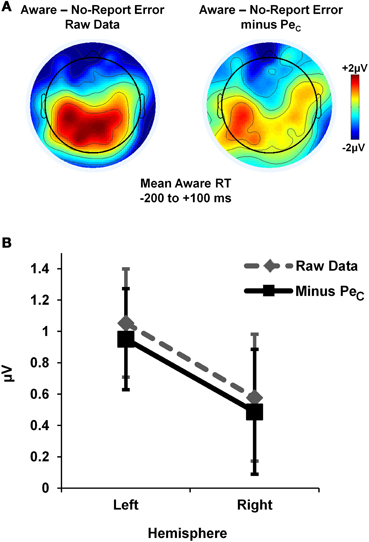
Figure 9. Study 2 PeCs did not include lateralised motor activity. Motor-evoked activity unique to the awareness press was isolated by deriving error-locked difference waveforms for aware minus no-report errors. Average topographies within a broad Aware RT latency range suggested the presence of lateralized activity (A), which was not affected by the removal of all variance associated with the PeC from the difference waveforms (B).
Discussion
In the present study, participants performed a modified version of the EAT Go/No-go response inhibition task (Hester et al., 2005, 2012) in which error awareness was indicated via a speeded manual response separate from that used for Go stimuli. This aspect of study design provided an opportunity to test the hypothesis that the Pe component reflects the emergence of error awareness by examining the relationship between the Pe and the timing of the awareness response, but the potential for motor activity to confound such an analysis presented a significant methodological challenge. After employing ICA to isolate activity uniquely related to the Pe (the “PeC”), we demonstrated for the first time that Pe latency closely tracked the latency at which participants indicated awareness. This effect was replicated in a second study, in which Pe ICs were derived from a control condition which did not require an explicit awareness response. The intimate relationship between the Pe and error awareness was further illustrated by findings that the mean amplitude and latency of this component were related to behavioral measures of error awareness between-subjects, and that Pe waveforms could be used to reliably predict error awareness at the single-trial level. Our results highlight the utility of ICA as a methodological control and the benefit of employing a speeded awareness press as a measure of the timing of error awareness, while also having implications for interpreting the functional significance of the Pe.
Isolating the Pe
Despite our use of dipole source modeling to constrain the process, the selection of ICs based on information contained in their topographies and time-courses is somewhat subjective (Onton et al., 2006). The question of whether or not we successfully isolated relevant Pe ICs and avoided those related to extraneous neural signals is therefore an important one. Comparison of error trials with and without awareness suggested that, even after PeC removal from aware error waveforms, a small but significant amount of residual variance remained in the EEG which differentiated the two trial-types within the latency range of the Pe. ICA effectively decomposes activity in the EEG into orthogonal components which have discrete underlying neural generators. Given the highly heterogeneous collection of candidate Pe generators and the generally conservative nature of our IC selection process, it is perhaps unsurprising that the selected PeCs did not account for all of the variation in the EEG which was related to the Pe. Nevertheless, we are confident that our IC selection yielded PeCs that reflect the dynamics of the original Pe component and are highly relevant to error awareness. A strong relationship was observed between PeC latency and Aware RT which was slightly stronger than that observed in the raw data (a result replicated using completely objective IC selection criteria), and we found that PeC amplitude in the single-trial could be used to accurately classify error trials as with or without awareness. PeC latency and amplitude were also significantly related to error awareness at the between-subjects level: participants whose PeC peaked earlier and was of greater amplitude were faster at indicating error awareness and were also aware of a greater percentage of the errors they committed. These findings all suggest that the PeC in the present study represents a neural signal which is tightly coupled to error awareness. In our second study, we demonstrated that any lateralized motor-related activity specifically introduced by the speeded awareness press was still present in the EEG when PeCs were subtracted from the data, and hence did not affect the observed relationship between the PeC and the timing of error awareness.
These findings highlight the utility of ICA as a methodological tool which can be used to parse neural activity related to distinct cognitive processes from other stimulus- or response-evoked signals. In the domain of error awareness, we have demonstrated that this tool can be employed effectively to isolate the Pe component from the potential confounds associated with a speeded awareness press, and hence rendered this important behavioral measure readily accessible to future ERP studies.
Pe Functional Significance
By building a speeded awareness response into our experimental design, we have shown that the latency of the Pe component is closely tied to the moment at which the participant first signals awareness of their actions. Our results have implications for interpreting the functional significance of the Pe. Previous research has often struggled to disambiguate whether the Pe reflects processes that lead to the emergence of error awareness, or is instead one of the consequences of error awareness (Overbeek et al., 2005; but, see Steinhauser and Yeung, 2010). Two novel findings of the present study suggest that the Pe reflects the real-time emergence of error awareness and not one of its sequelae. Firstly, the evolution of the PeC comfortably preceded any overt indication of awareness: On average the PeC peaked 80–90 ms before the average awareness response. We also found that single-trial PeC amplitude was a significant predictor of the presence or absence of error awareness from a latency of up to 400 ms before the average timing of the speeded awareness response (and just 180 ms after initial error commission). Hence, information contained early in the time-course of the PeC was predictive of whether or not error awareness would ultimately be achieved. These findings are consistent with the hypothesis that the Pe component reflects conscious recognition that an error has occurred (Nieuwenhuis et al., 2001; Endrass et al., 2005), but also suggest that the emergence of awareness, as reflected in the Pe, is a dynamic and cumulative process which begins at an early stage after error commission. The latter analysis also represents an important replication and extension of the previous finding that single-trial Pe amplitude, as derived by logistic regression classifier analysis as opposed to the present ICA-based approach, was predictive of individual error signaling (Steinhauser and Yeung, 2010).
Recent research (Steinhauser et al., 2008; Steinhauser and Yeung, 2010) has conceptualized the emergence of error awareness as a “decision process,” in which awareness is only achieved after sufficient evidence of initial error commission has been accumulated to pass an independent decision threshold (the response criterion). Response criterion was explicitly manipulated in one recent ERP study (Steinhauser and Yeung, 2010) and the findings supported the possibility that Pe amplitude indexes the strength of accumulated evidence, which in turn informs decisions about the accuracy of the preceding response. A potential corollary of this model which was not addressed in that paper is that Pe peak latency marks the time at which the criterion has been met, and hence should be closely tied to the timing of error awareness (assuming a reasonably consistent delay between the decision threshold being passed and categorical decision output being generated). Our findings of a strong relationship between PeC latency and Aware RT are entirely consistent with this hypothesis, and complement those of Steinhauser and Yeung (2010) in highlighting the importance of both amplitude and latency characteristics of the Pe in predicting error awareness.
An interesting question that arises from our study is whether Pe peak latency marks the culmination of the accumulation process or whether evidence accumulation continues after the response criterion has been passed. Although we cannot adjudicate conclusively between these alternatives, two aspects of our data would appear to support the former possibility. First, we found that peak ROC classification accuracy was coincident with PeC peak latency and declined immediately thereafter. Second, the time-lag between PeC peak latency and the subsequent awareness press (80–90 ms on average) is consistent with empirical estimates in non-human primates (Roitman and Shadlen, 2002; Gold and Shadlen, 2007) of the time it takes for the crossing of a perceptual decision threshold to be transmuted into an overt behavioral response, albeit in a different response modality.
One consequence of the assumption that the proposed evidence accumulation process does indeed cease upon crossing the response criterion is that peak Pe amplitude should reflect the level of the response criterion itself. Interpreting our PeC amplitude results in this regard is more complicated. A fundamental characteristic of computational frameworks which model decision processes is that a lower criterion should equate to faster RTs, and this has been found for error signaling latency using a connectionist model of error detection (Steinhauser et al., 2008). Our results may appear to the contrary insofar as PeC amplitude was diminished for trials on which Aware RT was comparatively slow; hence, trials which might theoretically be characterized by a high response criterion were instead marked by particularly low PeC amplitudes. This within-subjects amplitude effect was also reflected in our between-subjects correlations, where participants with the largest Pe components (and, perhaps, the highest response criteria) were actually fastest at indicating error awareness. However, models of perceptual decision-making also posit the onset latency of evidence accumulation and the quality of the decision evidence itself to be other critical parameters affecting the RT distribution (Ratcliff and Smith, 2010). The extent to which these factors may interact with response criterion in driving variability in the latency of error signaling is unknown, and it is difficult to draw concrete inferences from our PeC amplitude effects without measuring them in some way. Further, it should be noted that the neural mechanisms for accumulating evidence about sensory events versus internal monitoring processes may not be the same (cf. Steinhauser and Yeung, 2010), and so the same principles may not apply to both phenomena. Generally, our findings serve to highlight some of the complexities inherent in interpreting the emergence of error awareness in a decision-making framework, and warrant further exploration in studies specifically designed to systematically manipulate relevant parameters of the decision process.
Utility of Speeded Awareness Signaling
Although speeded error signaling has been used previously in behavioral and computational modeling studies of error detection (Rabbitt et al., 1978; Rabbitt and Vyas, 1981; Rabbitt, 1990, 2002; Steinhauser et al., 2008), only one ERP study to our knowledge has employed a measure analogous to our speeded awareness press (Ullsperger and von Cramon, 2006). This study did not explore the relationship between the latency of this measure and the Pe in significant detail. A number of important issues are raised by the use of a speeded awareness press in the present research which should be considered when studying the electrophysiology of error awareness, and suggest that this measure is preferable to a delayed awareness response.
A high majority of ERP studies on error awareness have measured the Pe component as the amplitude of the average waveform locked to the initial erroneous response. By this method, many studies have reported significant differences in Pe morphology across a range of clinical groups (e.g., Brazil et al., 2009; O'Connell et al., 2009a; Olvet et al., 2010; Larson et al., 2011; Luijten et al., 2011; Perez et al., in press; Peterburs et al., 2012) and genotypes (Frank et al., 2007; Althaus et al., 2010; Biehl et al., 2011), and via pharmacological manipulation (Bartholow et al., 2012). In many cases these differences have been reported in the absence of an explicit indication of error awareness, and the present results highlight an important limitation of characterizing the Pe in this way. We have convincingly demonstrated via within-subjects, trial-by-trial correlational analyses that the Pe is better-related to the timing of error awareness, as indexed by Aware RT, than to the timing of initial error commission. Hence, the amplitude of the average error-locked Pe waveform will be partly determined by the amount of variability in the timing of error awareness. As a consequence, previously observed amplitude effects on the Pe may in fact be partly or even exclusively due to differences in the timing of awareness, and not to failures of awareness per se. A truer representation of component amplitude from the average waveform will necessarily be gleaned when trials are locked to the timing of error awareness, and not to the initial erroneous response as has traditionally been the case. This subtle distinction may have important implications for the interpretation of awareness deficits in clinical populations.
Behaviorally, we replicated previous studies (Endrass et al., 2005; O'Connell et al., 2007) in showing that aware errors were characterized by significantly faster initial RTs than correct Go trials, which in turn were faster than responses on unaware error trials. These differences have been interpreted as reflecting the possibility that aware errors are predominantly driven by failures of response inhibition, whereas unaware errors are precipitated by lapses of attention (O'Connell et al., 2007, 2009b; Shalgi et al., 2007). However, our Aware RT measure was characterized by substantial intra-subject variability, and its distribution was highly positively skewed. These characteristics indicate that a proportion of aware error trials are marked by very late error awareness, which may potentially be indicative of an attentional lapse as opposed to inhibitory failure. Aware RT represents a potentially useful measure for future studies to disentangle possible sub-types of aware errors, which may be characterized by distinct neural signatures and antecedent conditions and could not be distinguished using a delayed indication of awareness. Generally, these findings also point to the emergence of error awareness as being a highly variable process, and more complex than its usual characterization in the ERP literature as a binary, “present-or-absent” phenomenon would suggest.
The question of what actually drives the substantial variability in the timing of awareness signaling has not been addressed in the present study. Recent research has demonstrated that fluctuations in baseline attentional state in the inter-target interval can predict upcoming performance trends (Eichele et al., 2008; O'Connell et al., 2009c; MacDonald et al., 2011; Murphy et al., 2011). It may be the case that these markers are also related to fluctuations in the timing of error awareness. Further, a critical issue in performance monitoring research lies in trying to link the unique contributions of both the implicit and conscious recognition processes underlying error detection. One potential question for future research relates to the extent to which early, pre-conscious error detection mechanisms, as indexed by the ERN, drive the subsequent timing of error awareness, as indexed in our study by PeC latency and Aware RT. Although the ERN is not typically modulated by error awareness (though see Wessel et al., 2011), one recent study found that ERN amplitude was modestly correlated with Pe amplitude on a trial-by-trial basis (Hughes and Yeung, 2011). This suggests that the two may be at least partially related. In addition, medial-frontal theta power (4–7 Hz), which has been proposed to reflect the recruitment of cognitive control (Cavanagh et al., 2009; Cohen et al., 2009; Cohen and Cavanagh, 2011) and to drive the ERN (Luu et al., 2004), has recently been shown to dynamically adjust response criterion according to changing levels of response conflict (Cavanagh et al., 2011). As previously described, response criterion is an important determinant of error signaling latency in connectionist computational models of error detection (Steinhauser et al., 2008), and it is feasible that fluctuations in the recruitment of control, as indexed by medial-frontal theta power, may be one mechanism by which variation in the timing of awareness arises. Further research in these areas is warranted.
Conclusions
The present study employed a novel variant of the EAT, which included a speeded manual response to indicate error awareness, in order to explore the relationship between the Pe component and the precise timing of error awareness. After isolating the Pe from other stimulus- and response-evoked signals using ICA, we demonstrated via within-subjects single-trial analyses that this component's peak latency is tightly related to the latency of the awareness response, as opposed to the timing of initial error commission. Further, component amplitude and latency correlated with behavioral indices of error awareness at the between-subjects level, and single-trial component amplitude was shown to reliably classify trials as with or without awareness up to 400 ms before the average timing of the awareness response. These results highlight the intimate association between the Pe and the emergence of error awareness, and also the utility of employing a speeded awareness press as an index of the timing of awareness.
Conflict of Interest Statement
The authors declare that the research was conducted in the absence of any commercial or financial relationships that could be construed as a potential conflict of interest.
Acknowledgments
This research was supported by an Irish Research Council for Science, Engineering, and Technology (IRCSET) “Embark Initiative” grant awarded to Peter R. Murphy, an ARC Fellowship to Robert Hester (FT110100088), and an IRCSET “Empower” Fellowship to Redmond G. O'Connell. The authors also acknowledge funding support via the HEA PRTLI Cycle 3 program of the EU Structural Funds and the Irish Government's National Development Plan 2002–2006. We thank Hugh Nolan and Simon Kelly for their assistance with aspects of data analysis and Misha Byrne for assistance with figure design.
References
Althaus, M., Groen, Y., Wijers, A. A., Minderaa, R. B., Kema, I. P., Dijck, J. D., and Hoekstra, P. J. (2010). Variants of the SLC6A3 (DAT1) polymorphism affect performance monitoring-related cortical evoked potentials that are associated with ADHD. Biol. Psychol. 85, 19–32.
Arieli, A., Sterkin, A., Grinvald, A., and Aertsen, A. (1996). Dynamics of ongoing activity: explanation of the large variability in evoked cortical responses. Science 273, 1868–1871.
Bartholow, B. D., Henry, E. A., Lust, S. A., Saults, J. S., and Wood, P. K. (2012). Alcohol effects on performance monitoring and adjustment: affect modulation and impairment of evaluative cognitive control. J. Abnorm. Psychol. 121, 173–186.
Bell, A. J., and Sejnowski, T. J. (1995). An information-maximization approach to blind separation and blind deconvolution. Neural Comput. 7, 1129–1159.
Biehl, S. C., Dresler, T., Reif, A., Scheuerpflug, P., Deckert, J., and Herrmann, M. J. (2011). Dopamine transporter (DAT1) and dopamine receptor D4 (DRD4) genotypes differentially impact on electrophysiological correlates of error processing. PLoS One 6:e28396. doi: 10.1371/journal.pone.0028396
Bland, A. R., Mushtaq, F., and Smith, D. V. (2011). Exploiting trial-to-trial variability in multimodal experiments. Front. Hum. Neurosci. 5:80. doi: 10.3389/fnhum.2011.00080
Botvinick, M. M., Cohen, J. D., and Carter, C. S. (2004). Conflict monitoring and anterior cingulate cortex: an update. Trends Cogn. Sci. 8, 539–546.
Brazil, I. A., de Bruijn, E. R., Bulten, B. H., von Borries, A. K., van Lankveld, J. J., Buitelaar, J. K., and Verkes, R. J. (2009). Early and late components of error monitoring in violent offenders with psychopathy. Biol. Psychiatry 65, 137–143.
Cavanagh, J. F., Cohen, M. X., and Allen, J. J. (2009). Prelude to and resolution of an error: EEG phase synchrony reveals cognitive control dynamics during action monitoring. J. Neurosci. 29, 98–105.
Cavanagh, J. F., Wiecki, T. V., Cohen, M. X., Figueroa, C. M., Samanta, J., Sherman, S. J., and Frank, M. J. (2011). Subthalamic nucleus stimulation reverses mediofrontal influence over decision threshold. Nat. Neurosci. 14, 1462–1467.
Cohen, M. X., and Cavanagh, J. F. (2011). Single-trial regression elucidates the role of prefrontal theta oscillations in response conflict. Front. Psychol. 2:30. doi: 10.3389/fpsyg.2011.00030
Cohen, M. X., van Gaal, S., Ridderinkhof, K. R., and Lamme, V. A. (2009). Unconscious errors enhance prefrontal-occipital oscillatory synchrony. Front. Hum. Neurosci. 3:54. doi: 10.3389/neuro.09.054.2009
Colebatch, J. G. (2007). Bereitschaftspotential and movement-related potentials: origin, significance, and application in disorders of human movement. Mov. Disord. 22, 601–610.
Debener, S., Ullsperger, M., Siegel, M., and Engel, A. K. (2006). Single-trial EEG-fMRI reveals the dynamics of cognitive function. Trends Cogn. Sci. 10, 558–563.
Delorme, A., and Makeig, S. (2004). EEGLAB: an open source toolbox for analysis of single-trial EEG dynamics including independent component analysis. J. Neurosci. Methods 134, 9–21.
Dhar, M., Wiersema, J. R., and Pourtois, G. (2011). Cascade of neural events leading from error commission to subsequent awareness revealed using EEG source imaging. PLoS One 6:e19578. doi: 10.1371/journal.pone.0019578
Eichele, H., Juvodden, H. T., Ullsperger, M., and Eichele, T. (2010). Mal-adaptation of event-related EEG responses preceding performance errors. Front. Hum. Neurosci. 4:65. doi: 10.3389/fnhum.2010.00065
Eichele, T., Debener, S., Calhoun, V. D., Specht, K., Engel, A. K., Hugdahl, K., von Cramon, D. Y., and Ulsperger, M. (2008). Prediction of human errors by maladaptive changes in event-related brain networks. Proc. Natl. Acad. Sci. U.S.A. 105, 6173–6178.
Einhauser, W., Koch, C., and Carter, O. L. (2010). Pupil dilation betrays the timing of decisions. Front. Hum. Neurosci. 4:18. doi: 10.3389/fnhum.2010.00018
Endrass, T., Franke, C., and Kathmann, N. (2005). Error awareness in a saccade countermanding task. J. Psychophysiol. 19, 275–280.
Falkenstein, M., Hohnsbein, J., and Hoormann, J. (1995). “Event-related potential correlates of errors in reaction tasks,” in Perspectives of Event-related Potentials Research, eds G. Karmos, M. Molnar, V. Scépe, I. Czigler, and J. E. Desmedt (Amsterdam: Elsevier), 287–296.
Falkenstein, M., Hohnsbein, J., Hoorman, J., and Blanke, L. (1990). “Effects of errors in choice reaction tasks on the ERP under focused and divided attention,” in Psychophysiological Brain Research, eds C. H. M. Brunia, A. W. K. Gaillard, and A. Kok. (Tilberg, Netherlands: Tilberg University Press), 192–195.
Falkenstein, M., Hohnsbein, J., Hoormann, J., and Blanke, L. (1991). Effects of crossmodal divided attention on late ERP components. II. Error processing in choice reaction tasks. Electroencephalogr. Clin. Neurophysiol. 78, 447–455.
Falkenstein, M., Hoormann, J., Christ, S., and Hohnsbein, J. (2000). ERP components on reaction errors and their functional significance: a tutorial. Biol. Psychol. 51, 87–107.
Frank, M. J., D'Lauro, C., and Curran, T. (2007). Cross-task individual differences in error processing: neural, electrophysiological, and genetic components. Cogn. Affect. Behav. Neurosci. 7, 297–308.
Gehring, W. J., Goss, B., Coles, M. G., Meyer, D. E., and Donchin, E. (1993). A neural system for error detection and compensation. Psychol. Sci. 4, 385–390.
Gold, J. I., and Shadlen, M. N. (2007). The neural basis of decision making. Annu. Rev. Neurosci. 30, 535–574.
Hermann, M., Rommler, J., Ehlis, A., Heidrich, A., and Fallgatter, A. (2004). Source localisation (LORETA) of the error-related negativity (ERN) and positivity (Pe). Cogn. Brain Res. 20, 294–299.
Hester, R., Foxe, J. J., Molholm, S., Shpaner, M., and Garavan, H. (2005). Neural mechanisms involved in error processing: a comparison of errors made with and without awareness. Neuroimage 27, 602–608.
Hester, R., Nandam, L. S., O'Connell, R. G., Wagner, J., Strudwick, M., Nathan, P. J., Mattingley, J. B., and Bellgrove, M. A. (2012). Neurochemical enhancement of error awareness. J. Neurosci. 32, 2619–2627.
Holroyd, C. B., and Coles, M. G. (2002). The neural basis of human error processing: reinforcement learning, dopamine, and the error-related negativity. Psychol. Rev. 109, 679–709.
Holroyd, C. B., Niuwenhuis, S., Mars, R. B., and Coles, M. G. H. (2004). “Anterior cingulate cortex, selection for action, and error processing,” in Cognitive Neuroscience of Attention, ed M. I. Posner (New York, NY: Guilford), 219–231.
Hughes, G., and Yeung, N. (2011). Dissociable correlates of response conflict and error awareness in error-related brain activity. Neuropsychologia 49, 405–415.
Klein, T. A., Endrass, T., Kathmann, N., Neumann, J., Von Cramon, D. Y., and Ullsperger, M. (2007). Neural correlates of error awareness. Neuroimage 34, 1774–1781.
Larson, M. J., Fair, J. E., Farrer, T. J., and Perlstein, W. M. (2011). Predictors of performance monitoring abilities following traumatic brain injury: the influence of negative affect and cognitive sequelae. Int. J. Psychophysiol. 82, 61–68.
Larson, M. J., and Perlstein, W. M. (2009). Awareness of deficits and error processing after traumatic brain injury. Neuroreport 20, 1486–1490.
Leuthold, H., and Sommer, W. (1999). ERP correlates of error processing in spatial S-R compatibility tasks. Clin. Neurophysiol. 110, 342–357.
Luijten, M., van Meel, C. S., and Franken, I. H. (2011). Diminished error processing in smokers during smoking cue exposure. Pharmacol. Biochem. Behav. 97, 514–520.
Luu, P., Tucker, D. M., and Makeig, S. (2004). Frontal midline theta and the error-related negativity: neuropsychological mechanisms of action regulation. Clin. Neurophysiol. 115, 1821–1835.
MacDonald, J. S., Mathan, S., and Yeung, N. (2011). Trial-by-trial variations in subjective attentional state are reflected in ongoing prestimulus EEG alpha oscillations. Front. Psychol. 2:82. doi: 10.3389/fpsyg.2011.00082
Makeig, S., Debener, S., Onton, J., and Delorme, A. (2004). Mining event-related brain dynamics. Trends Cogn. Sci. 8, 204–210.
Mintz, A. R., Addington, J., and Addington, D. (2004). Insight in early psychosis: a 1-year follow-up. Schizophr. Res. 67, 213–217.
Murphy, P. R., Robertson, I. H., Balsters, J. H., and O'Connell, R. G. (2011). Pupillometry and P3 index the locus coeruleus-noradrenergic arousal function in humans. Psychophysiology 48, 1532–1543.
Nieuwenhuis, S., Ridderinkhof, K. R., Blom, J., Band, G. P., and Kok, A. (2001). Error-related brain potentials are differentially related to awareness of response errors: evidence from an antisaccade task. Psychophysiology 38, 752–760.
Nolan, H., Whelan, R., and Reilly, R. B. (2010). FASTER: fully automated Statistical thresholding for EEG artifact rejection. J. Neurosci. Methods 192, 152–162.
O'Connell, R. G., Bellgrove, M. A., Dockree, P. M., Lau, A., Hester, R., Garavan, H., Fitzgerald, M., Foxe, J. J., and Robertson, I. H. (2009a). The neural correlates of deficient error awareness in attention-deficit hyperactivity disorder (ADHD). Neuropsychologia 47, 1149–1159.
O'Connell, R. G., Dockree, P. M., Bellgrove, M. A., Kelly, S. P., Hester, R., Garavan, H., Robertson, I. H., and Foxe, J. J. (2007). The role of cingulate cortex in the detection of errors with and without awareness: a high-density electrical mapping study. Eur. J. Neurosci. 25, 2571–2579.
O'Connell, R. G., Dockree, P. M., Bellgrove, M. A., Turin, A., Ward, S., Foxe, J. J., and Robertson, I. H. (2009b). Two types of action error: electrophysiological evidence for separable inhibitory and sustained attention neural mechanisms producing error on Go/No-go tasks. J. Cogn. Neurosci. 21, 93–104.
O'Connell, R. G., Dockree, P. M., Robertson, I. H., Bellgrove, M. A., Foxe, J. J., and Kelly, S. P. (2009c). Uncovering the neural signature of lapsing attention: electrophysiological signals predict errors up to 20s before they occur. J. Neurosci. 29, 8604–8611.
O'Keeffe, F. M., Dockree, P. M., and Robertson, I. H. (2004). Poor insight in traumatic brain injury mediated by impaired error processing?: evidence from electrodermal activity. Brain Res. Cogn. Brain Res. 22, 101–112.
Olvet, D. M., Klein, D. N., and Hajcak, G. (2010). Depression symptom severity and error-related brain activity. Psychiatry Res. 179, 30–37.
Onton, J., Westerfield, M., Townsend, J., and Makeig, S. (2006). Imaging human EEG dynamics using independent component analysis. Neurosci. Biobehav. Rev. 30, 808–822.
Overbeek, T. J. M., Nieuwenhuis, S., and Ridderinkhof, K. R. (2005). Dissociable components of error processing: on the functional significance of the Pe vis-à-vis the ERN/Ne. J. Psychophysiol. 19, 319–329.
Perez, V. B., Ford, J. M., Roach, B. J., Woods, S. W., McGlashan, T. H., Srihari, V. H., Loewy, R. L., Vinogradov, S., and Mathalon, D. H. (in press). Error monitoring dysfunction across the illness course of schizophrenia. J. Abnorm. Psychol. doi: 10.1037/a0025487. [E-pub ahead of print].
Peterburs, J., Gajda, K., Koch, B., Schwarz, M., Hoffmann, K. P., Daum, I., and Bellebaum, C. (2012). Cerebellar lesions alter performance monitoring on the antisaccade task – an event-related potentials study. Neuropsychologia 50, 379–389.
Quiroga, R. Q., Reddy, L., Kreiman, G., Koch, C., and Fried, I. (2005). Invariant visual representation by single neurons in the human brain. Nature 435, 1102–1107.
Rabbitt, P. (1966b). Errors and error correction in choice-response tasks. J. Exp. Psychol. 71, 264–272.
Rabbitt, P., Cumming, G., and Vyas, S. (1978). Some errors of perceptual analysis in visual search can be detected and corrected. Q. J. Exp. Psychol. 30, 319–332.
Rabbitt, P., and Vyas, S. (1981). Processing a display even after you make a response to it: how perceptual errors can be corrected. Q. J. Exp. Psychol. A. 33, 223–239.
Ratcliff, R., and Smith, P. L. (2010). Perceptual discrimination in static and dynamic noise: the temporal relation between perceptual encoding and decision making. J. Exp. Psychol. Gen. 139, 70–94.
Ridderinkhof, K. R., Ramautar, J. R., and Wijnen, J. G. (2009). To P(E) or not to P(E): a P3-like ERP component reflecting the processing of response errors. Psychophysiology 46, 531–538.
Ridderinkhof, K. R., Ullsperger, M., Crone, E. A., and Nieuwenhuis, S. (2004). The role of the medial frontal cortex in cognitive control. Science 306, 443–447.
Roitman, J. D., and Shadlen, M. N. (2002). Response of neurons in the lateral intraparietal area during a combined visual discrimination reaction time task. J. Neurosci. 22, 9475–9489.
Shalgi, S., Barkan, I., and Deouell, L. Y. (2009). On the positive side of error processing: error-awareness positivity revisited. Eur. J. Neurosci. 29, 1522–1532.
Shalgi, S., O'Connell, R. G., Deouell, L. Y., and Robertson, I. H. (2007). Absent minded but accurate: delaying responses increases accuracy but decreases error awareness. Exp. Brain Res. 182, 119–124.
Spencer, K. M. (2004). “Averaging, detection, and classification of single-trial ERPs,” in Event-related Potentials: A Methods Handbook, ed T. C. Handy (Cambridge, MA: MIT Press), 209–228.
Steinhauser, M., Maier, M., and Hubner, R. (2008). Modeling behavioral measures of error detection in choice tasks: response monitoring versus conflict monitoring. J. Exp. Psychol. Hum. Percept. Perform. 34, 158–176.
Steinhauser, M., and Yeung, N. (2010). Decision processes in human performance monitoring. J. Neurosci. 30, 15643–15653.
Ullsperger, M., Harsay, H. A., Wessel, J. R., and Ridderinkhof, K. R. (2010). Conscious perception of errors and its relation to the anterior insula. Brain Struct. Funct. 214, 629–643.
Ullsperger, M., and von Cramon, D. Y. (2006). How does error correction differ from error signaling? An event-related potential study. Brain Res. 1105, 102–109.
van Boxtel, G., van der Molen, M., and Jennings, J. (2005). Differential involvement of the anterior cingulate cortex in performance monitoring during a stop-signal task. J. Psychophysiol. 19, 1–10.
van Veen, V., and Carter, C. S. (2002). The timing of action-monitoring processes in the anterior cingulate cortex. J. Cogn. Neurosci. 14, 593–602.
Viola, F. C., Thorne, J., Edmonds, B., Schneider, T., Eichele, T., and Debener, S. (2009). Semi-automatic identification of independent components representing EEG artifact. Clin. Neurophysiol. 120, 868–877.
Wessel, J. R., Danielmeier, C., and Ullsperger, M. (2011). Error awareness revisited: accumulation of multimodal evidence from central and autonomic nervous systems. J. Cogn. Neurosci. 23, 3021–3036.
Keywords: error positivity, EEG, error awareness, error processing, performance monitoring
Citation: Murphy PR, Robertson IH, Allen D, Hester R and O'Connell RG (2012) An electrophysiological signal that precisely tracks the emergence of error awareness. Front. Hum. Neurosci. 6:65. doi: 10.3389/fnhum.2012.00065
Received: 31 January 2012; Accepted: 12 March 2012;
Published online: 28 March 2012.
Edited by:
Tilmann A. Klein, Max Planck Institute for Human Cognitive and Brain Sciences, GermanyReviewed by:
Marco Steinhauser, University of Konstanz, GermanySander Nieuwenhuis, Leiden University, Netherlands
Copyright: © 2012 Murphy, Robertson, Allen, Hester and O'Connell. This is an open-access article distributed under the terms of the Creative Commons Attribution Non Commercial License, which permits non-commercial use, distribution, and reproduction in other forums, provided the original authors and source are credited.
*Correspondence: Peter R. Murphy, Trinity College Institute of Neuroscience, Lloyd Building, Trinity College Dublin, Dublin 2, Ireland. e-mail:bXVycGh5cDdAdGNkLmll