 Solveig Walløe
 Bente Pakkenberg
 Katrine Fabricius
- Research Laboratory for Stereology and Neuroscience, Bispebjerg and Frederiksberg Hospitals, University of Copenhagen, Copenhagen, Denmark
Our knowledge of the relationship between brain structure and cognitive function is still limited. Human brains and individual cortical areas vary considerably in size and shape. Studies of brain cell numbers have historically been based on biased methods, which did not always result in correct estimates and were often very time-consuming. Within the last 20–30 years, it has become possible to rely on more advanced and unbiased methods. These methods have provided us with information about fetal brain development, differences in cell numbers between men and women, the effect of age on selected brain cell populations, and disease-related changes associated with a loss of function. In that this article concerns normal brain rather than brain disorders, it focuses on normal brain development in humans and age related changes in terms of cell numbers. For comparative purposes a few examples of neocortical neuron number in other mammals are also presented.
Introduction
The accumulation of data from quantitative stereological postmortem studies of the brain has significantly increased our knowledge about the central nervous system. Our laboratory and others have reported estimates of different types of cells in the neocortex. The number of neurons is widely considered to be a major determinant of neural function and of behavior. Brain size tends to increase with body size, but brains are relatively larger in mammals and birds than in reptiles. It has been proposed that neurons are responsible for the evolution of intelligence, in that species with larger brains and more neurons generally have a larger range and versatility of behaviors than those with smaller brains (Lefebvre et al., 2004; Sol et al., 2005). Complex cognitive capabilities are observed in a variety of animals. Complex vocal learning has been found in five distantly related groups of mammals (humans, bats, elephants, cetaceans [dolphins and whales], and pinnipeds [seals and sea lions]) (Esser, 1994; Boughman, 1998; Janik, 2000; Poole et al., 2005; Sanvito et al., 2007) and three distantly related groups of birds (parrots, songbirds, and hummingbirds) (Thorpe, 1961; Marler and Tamura, 1964; Nottebohm, 1972; Dooling et al., 1987; Baptista and Schuchmann, 1990; Gaunt et al., 1994). Self-recognition has been seen in primates and other mammals including three species of dolphins (Delfour and Marten, 2001). The use of tools is not exclusively limited to higher primates (Lefebvre et al., 2004) but has also been observed in dolphins (Delfour and Marten, 2001) and birds (Mundinger, 1980).
Much of modern neuroscience is concerned with extracting information about the content, arrangement, and connectivity of neural systems and their cell or cellular components. Often this information has been obtained from two-dimensional images of three-dimensional structures. This leads to problems in that information about the 3-D organization is lost. Previous methods involved assumptions about the size and/or shape of the sectioned profiles, e.g., that all neurons are of a certain shape of equal size and isotropically oriented (e.g., Weibel and Gomez, 1962; Rose and Rohrlich, 1987). Assumptions of this type are seldom true and can lead to systematic deviations from true estimates that cannot be corrected from the data itself.
Stereology is sampling with geometrical probes with the goal of making estimates of structural parameters. The amount of sampling can always be adjusted to a level that is efficient with respect to precision and effort (see e.g., Gundersen et al., 1988a,b; West, 2012; Mouton, 2014).
In human brain research, knowing cell numbers in selected areas can provide important information about neurodegenerative brain diseases. Modern stereological design based methods are constructed to make the quantitative descriptions of structural parameters without assumptions about shape, size, orientation, or distribution of cells. This approach has been revolutionary for the estimation of structural parameters in the brain. Recently developed stereological methods are now available for obtaining estimates of e.g., volume, surface area, particle number, and particle size. The “unbiasedness” of a stereological estimator relies heavily on proper knowledge about the structure of interest and the characteristics of the tissue. Total number can always be obtained properly using the fractionator technique or the disector/Cavalieri combination provided that all cells can potentially be identified (though not all cells will be sampled) and the sampling at all levels is carried out correctly (Gundersen, 1986; West and Gundersen, 1990). However, all estimates of volume or size are sensitive to changes in the dimension of the tissue related to histological processing; e.g., shrinkage, and must be taken into account.
In that this article is about cell numbers in the normal brain neocortex and cerebellum rather than brain disorders, it focuses on normal brain development and age related changes in humans. For comparative purposes, a few examples of neocortical neuron number in other mammals are discussed.
Human Brain Development
Development of the human brain is characterized by a rapid phase of growth from conception to the second year of life. During early intrauterine life, the brain increases from about 15 gr at week 14 to about 52 gr at week 20 (247%), compared with a much smaller relative increase from 366 gr at week 36–409 gr at term (12%) (Larroche, 1977; Guihard-Costa and Larroche, 1990). The rapid initial growth of the central nervous system exceeds that of other body tissues; brain weight makes up 15–16% of body weight at 26 weeks of gestation (130/800 gr) and 12% of body weight at birth (409/3500 gr) (Guihard-Costa and Larroche, 1990), whereas in adults the brain represents only 2% of body weight (1.33/65 kg) This pattern is consistent with other mammals in which rapid growth of the brain also occurs prior to general body growth. In humans, the brain attains ~80% of its adult weight during the first 2–3 postnatal years. At the time of birth, the brain is ~30% of its adult size in humans (409/1325 gr), whereas it is 65 and 41% in related species such as the macaque monkey and chimpanzee, respectively (Prechtl, 1986; Jensen, 1996). Thus, man is a perinatal brain developer, with the maximal brain growth extending from the last half of gestation into the second and third year of life (Dobbing and Sands, 1973). The formation of the human neocortex is critically important because disturbances in the formation of cells can cause congenital brain disorders and result in adverse effects on brain morphology (i.e., abnormal proliferation, differentiation, and/or migration of cells), including quantitative changes such as decreases in the number of neurons at a specific location of their final destination.
Delineations of Developmental Zones
The neocortex forms within the dorsal walls of the telencephalic vesicles, where neurogenesis is initiated in an epithelial sheet of dividing progenitor cells (Kornack, 2000). Before the onset of neurogenesis, these progenitors divide symmetrically to make more of themselves, establishing a progenitor pool. Once neurogenesis begins, some progenitor cells switch to asymmetric division to produce the first postmitotic neurons (Rakic, 1972; Kornack, 2000). The post mitotic neuron will leave the ventricular zone (VZ) by post mitotic migration along radial glial cell fibers and settle just outside the VZ, where they form the preplate and later the cortical plate (CP). After the onset of neurogenesis, dividing cells start to appear at the basal border of the VZ. Accumulation of these intermediate or “basal” progenitors creates a distinct new compartment above the VZ, which was named the subventricular zone (SVZ) (Byron et al., 2008). Originally the SVZ was thought to generate mainly glia, but later it was shown that early SVZ progenitors are largely neurogenic and many cortical neurons originate from the SVZ in mice, monkeys, and humans (Letinic et al., 2002; Brazel et al., 2003; Rakic, 2003; Zecevic et al., 2005). As the CP grows, it differentiates into an inner subplate (SP) and an outer marginal zone (MZ) that becomes the agranular layer I of the mature cerebral cortex (Rakic, 1972; Kornack, 2000). The initial post mitotic neurons settle within deep cortical layers, whereas subsequent neurons settle in more superficial cortical layers, thereby establishing the layers designated layers VI-II. As neurogenesis stops around embryonic day 125, symmetric cell division replaces the progenitor cell pool in the VZ with undifferentiated post mitotic neurons (Kornack, 2000). Subsequently, cell division stops in the VZ and post mitotic neurons are eventually replaced with ependymal cells (Kornack, 2000). Thus, due to the inside-out development of the neocortex, with its prominent proliferative zone around the VZ, it is easy to establish and delineate the developing intermediate zone (IZ). At this stage, the region consists of migrating cells and ingrowing axons and will later develop into white matter. Therefore, the cell density in the IZ is less than the VZ and is separated from the SP by the presence of horizontal axons at the SP border. The SP disappears by the sixth postnatal month (Kostovic and Judas, 1995).
First Period: 13–20 Weeks of Gestation
During this period, the CP/MZ is characterized by a rapid exponential growth in cell number, that reaches 5.87 × 10⁹ cells at 20 weeks of gestation (Samuelsen et al., 2003). This finding is in agreement with the qualitative observation of the secondary consolidation of the CP during 16–18 weeks of gestation (Kostovic and Judas, 1995). From week 13 to 20 of gestation, the SP includes three different developmental stages: SP formation at 13–15 weeks, the expansive phase at 16–18 weeks, and the stationary phase at 19–20 weeks. During these periods, neurons mature in the SP and form connections with ingrowing afferents from the brainstem, basal forebrain, thalamus, and ipsilateral and contralateral cortices (Kostovic and Judas, 1995).
Second Period: From Mid-Gestation to Term
Neurogenesis in humans was generally assumed to be complete at mid-gestation (Rakic, 1972, 1988). However, fetal neurogenesis is not complete at 20 weeks of gestation and may in fact continue for another few weeks. This is supported by the data from Samuelsen et al. (2003) where the total cell numbers in the prospective neocortex increases during the second period, from 7.02 × 10⁹ cells at 22 weeks of gestation to 29.4 × 10⁹ cells at term. Furthermore, a subpopulation of GABAergic neurons migrates from the ganglionic eminence of the ventral forebrain to the dorsal forebrain at around 20 weeks of gestation. These clones of GABAergic neurons appear in the human fetal cerebral cortex (Letinic et al., 2002). The SP is composed of ~2.0 × 10⁹ cells at 22 weeks of gestation, and reaches a maximum of around 3.6 × 10⁹ cells at 35 weeks of gestation. Thus, in terms of total cell number, the SP is in a dynamic phase with regard to neuron number from 22 to 35 weeks of gestation. An initial growth in total cell number takes place between 20 and 35 weeks, after which the total cell number declines. The SP is thus a transitional zone that begins to disappear after 35 weeks of gestation. At term, however, the SP still contains about 3 × 10⁹ cells, suggesting that cellular interactions between immature neurons and incoming fibers in this zone could be influenced by early postnatal events (Samuelsen et al., 2003). Figure 1 shows the increase in total cell number in the CP/MZ in 15 normal human fetuses between 18 and 42 weeks of gestation (modified from Samuelsen et al., 2003). To illustrate the different developmental zones, coronal sections of a 24-, 25-, and 40-week-old human fetus at the level of the basal ganglia are shown in Figure 2. At term the total neocortical numbers are 20 × 109 neurons and 5.5 × 10⁹ glial cells (Larsen et al., 2006). In sum, there is a dramatic increase in the cell numbers from 13 to 40 weeks of gestation. These numbers can serve as a normative reference in the analysis of normal fetal development. At term, the neocortical neurons are in large parts formed while the glial cell numbers continue to increase well into the first years of life.
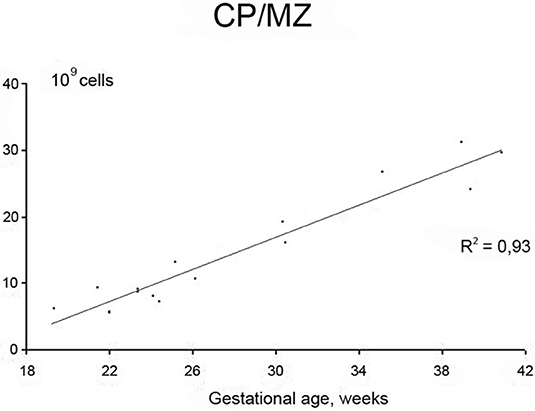
Figure 1. Increase in total cell number in the cortical plate (CP)/marginal zone (MZ) in 15 normal human fetuses between 18 and 42 weeks of gestation. Modified from Samuelsen et al. (2003).
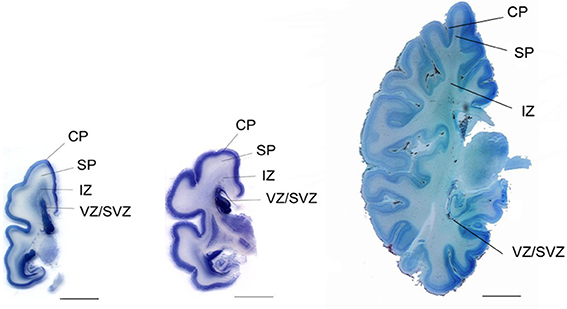
Figure 2. Coronal section of a 24-week (left), 25-week (middle), and 40-week-old human fetus at the level of the basal ganglia. CP, cortical plate; SP, subplate; IZ, intermediate zone; VZ/SVZ, ventricular zone/subventricular zone. Scale bar = 1 cm.
Estimates of the Total Number of Neocortical Neurons in the Adult Human Brain
It is well established that males, on average, have brains that are ~150 grams larger than those of females. However, the relationship between total neuron number and brain size was not known until total number of neurons were estimated in 94 normal Danish individuals between 18 and 93 years of age using stereological methods (Pakkenberg and Gundersen, 1997). It was found that the total number of neocortical neurons in females was ~19 × 109, whereas in males it was ~23 × 109, which accounts for a sex-related difference of 16%. However, this difference should be seen in view of the fact, that the total number of neocortical neurons varies among individuals by more than a factor of two, with a range of 118% (14.7–32.0 × 10⁹ neurons), i.e., there is considerable overlap between men and women.
With age, reductions occurred in neocortical volume, surface area, white matter, archicortex volume, and brain weight. These occurred concomitant with a large increase in the ventricular system. There were no changes in gray matter volume or neocortical thickness. Average volume and numerical neuronal density of the four lobes of the neocortex are shown in Table 1 (modified from Pakkenberg and Gundersen, 1997). After correcting for sex and age differences, neocortical neuron number is the dominant factor in determining the size of other brain structures. Neuronal density does not vary as a function of either sex or age (Table 1). Sex and age are the main determinants of the total neocortical neuron number, whereas body size, per se, has no influence. The change in total number of neocortical neurons from age 18 to 93 years is 9.5%, resulting in an average “loss” of about 85,000 neurons per day or ~1 per second. This age-dependent neuronal decrease is equivalent for both sexes. Finally, Fabricius et al. (2013) found that the total neocortical neuron number in individuals between 94 and 105 years of age (seven females, one male) is the same in very old females compared with younger women, group 1: 65–75 years (n = 8), and group 2: 76–85 years (n = 8). Although the total neuron number was the same in the 3 groups, the variance of the estimates increased substantially with age, indicating that apart from their high age, the variance in cell numbers suggests a relatively inhomogeneous sample. The estimates of neocortical neuron number from 18 to 105 years of age are shown in Figure 3. It was concluded, that either these very old subjects were born with more neurons than their peers, or some individuals lose fewer neurons over time as they age. Having a high neocortical neuron number may give a biological advantage that could be related to longevity.
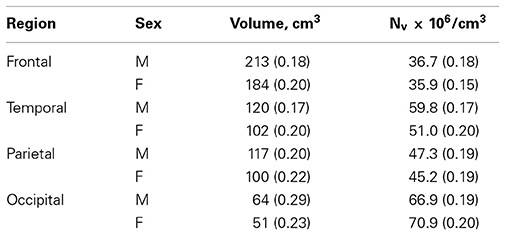
Table 1. Geometric mean and CV (in parentheses) for volume, and numerical density (Nv) in the four subdivisions of the human neocortex.
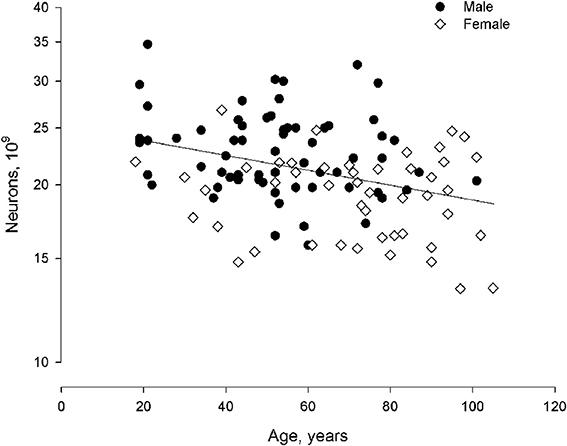
Figure 3. Total neuron number (non-equidistant logarithmic scale) as a function of age (linear scale: 18–105 years) in human males and females. In a larger material it would be expected that the curve flattens as we grow very old.
Total Neocortical Glial Cell Number in the Normal Adult Brain
The total number of neocortical glial cells was estimated (Pelvig et al., 2008) in some of the same brains used for estimating neocortical neuron number (Pakkenberg and Gundersen, 1997). Pelvig et al. (2008), Table 2 included the neocortices of 13 Caucasian males and 18 females (range: 18–93 years of age), and differentiated between astrocytes, oligodendrocytes, microglia, and neurons in each of the four neocortical lobes (Pelvig et al., 2008). The mean total numbers were ~21.0 × 10⁹ oligodendrocytes in females and 28.8 × 10⁹ oligodendrocytes in males, 4.8 × 10⁹ astrocytes in females and 7.8 × 10⁹ astrocytes in males, and 1.8 × 10⁹ microglia in females and 2.0 × 10⁹ microglia in males. The total glial cell numbers were 27.9 × 10⁹ in females and 38.9 × 10⁹ in males, so males have ~28% more neocortical glial cell number than females. In brains of equal size, there were no sex-related differences in neuron or glial numbers (Pelvig et al., 2008). The number of oligodendrocytes showed a significant 27% decrease during adult life and a strong correlation to the total number of neurons. The total astrocyte number is constant through life. The mean total neuron and glial cell numbers in the neocortex and cerebellum is shown in Figure 4. Finally, brains of equal size have the same number of glial cells. The different subpopulations of glial cells behave differently as a function of age. Generally, the number of glia cells has a higher biological variance than the number of neurons.
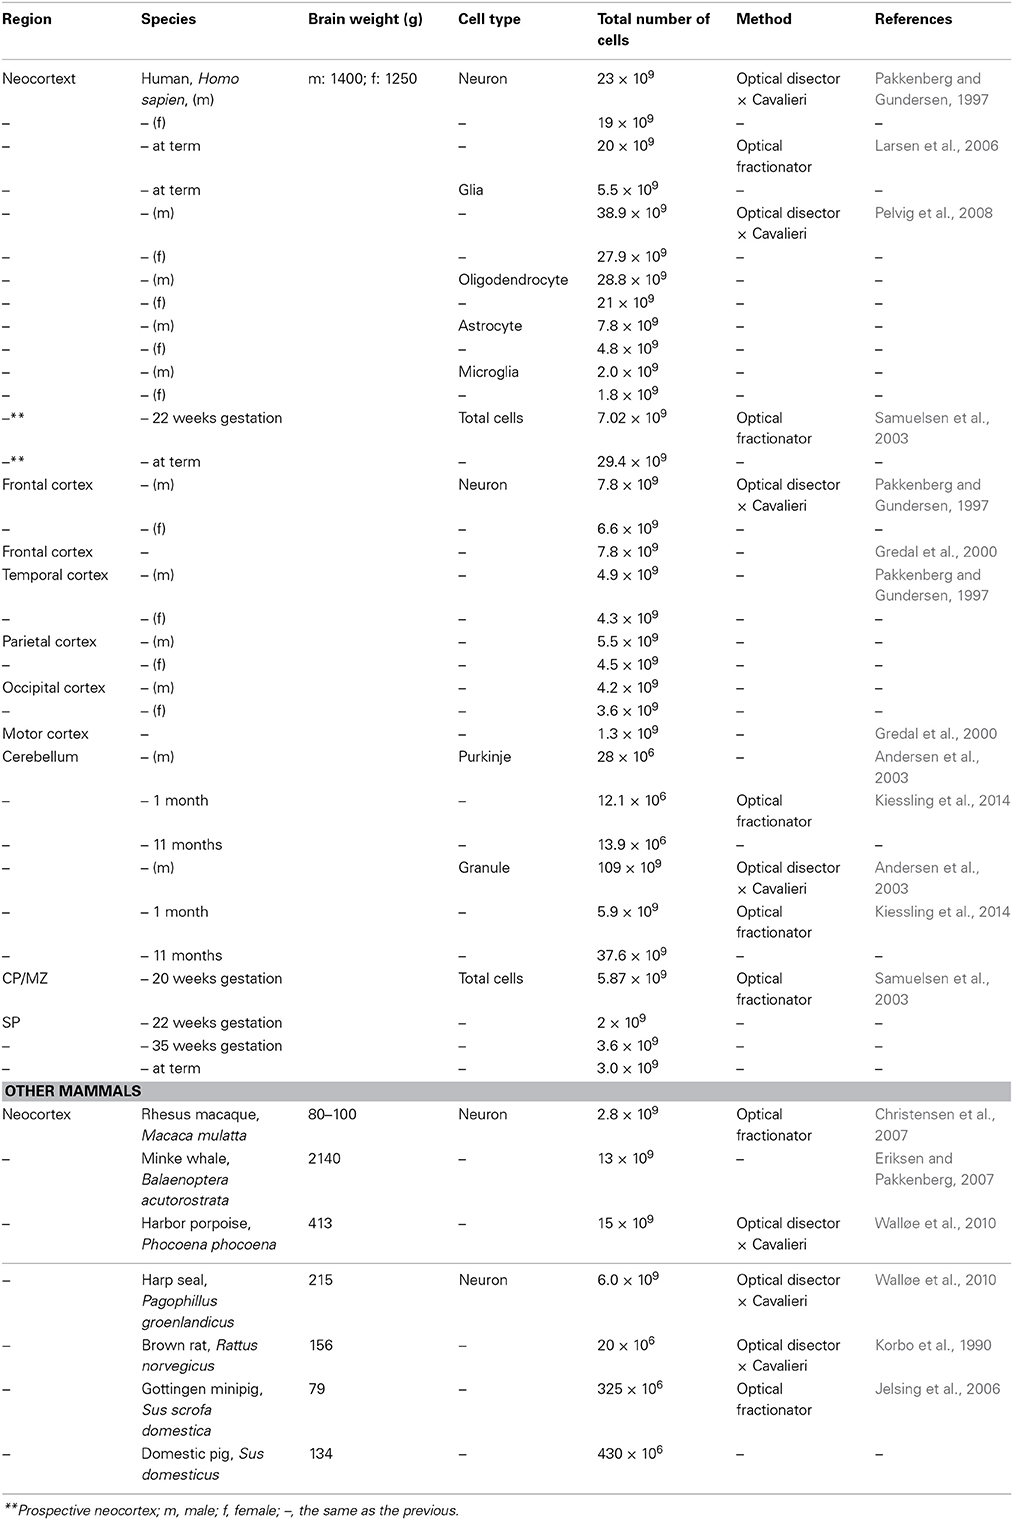
Table 2. Summary of the cell number presented in this paper.
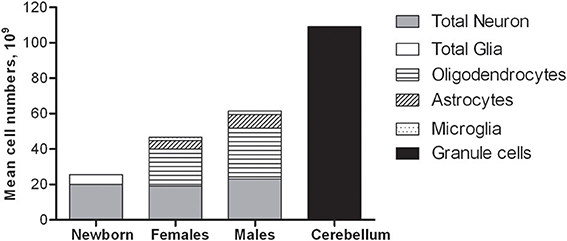
Figure 4. Mean total neuron and glial cell number in the human neocortex and cerebellum.
The Human Cerebellum
Applying stereological methods for cell counting to postmortem cerebella from 14 children who died between the first postnatal day and 11 months of age, Kiessling et al. (2014) found a statistically significant age-related increase in the total number of granule cells from 5.9 × 10⁹ at 1 month to 37.6 × 10⁹ at month 10/11 per cerebellar half. They did not find a difference in the total number of Purkinje cells (12.1 × 10⁶ at month 1 vs. 13.9 × 10⁶ at month 10/11 per cerebellar half). The number of granule cells per Purkinje cell in the human cerebellum increases from 485 at postnatal month 1 to 2700 at month 10/11. They concluded that these data indicate that the human cerebellum have a much higher functional plasticity during the first year of life than previously thought.
Unbiased stereological methods haves also been applied to cerebella from 19 normal Caucasian males aged 19–84 years (Andersen et al., 2003). Total volume of the cerebellar cortex and white matter, cerebellar surface area, total Purkinje and granule cell number, and the distribution of the mean volume of Purkinje cells and their nuclei were estimated in the anterior lobe, the posterior lobe, the flocculonodular lobe, and vermis. Across age, it was found that global white matter decreased by 26%, the mean volume of Purkinje cell bodies decreased by 33%, and there was no decrease in volume of Purkinje cell nuclei. Furthermore, a 16% total cerebellar volume loss was seen without a concomitant neuron loss. No global Purkinje or granule cell loss was found with age, with total Purkinje cell number being 28 × 106 and total granule cell number being 109 × 109. However, with age a significant loss of both Purkinje and granule cells were seen in the anterior lobe. Furthermore, a 30% loss of volume, mostly due to cortical volume loss, was observed in the anterior lobe (Andersen et al., 2003).
In sum, ~85% of the cerebellar granule cells are generated postnatally in humans. Most regions in the human cerebellum show only minor age related morphological changes. The anterior lobe is a major exception, with a 40% reduction in the total number of granule and Purkinje cells and a 28% loss of cortical volume, mainly due to reductions in the granule cell layer. The anterior lobe is functionally related to the spinal cord and is mainly concerned with posture, muscle tone, and gait, that is, motor functions, which are often affected by aging. Globally, cerebellar white matter volume is significantly reduced with age and is affected to almost the same degree (26%) as white matter in the cerebral hemispheres (28%).
Total Cell Number in the Cerebrum
Interest has been shown to the total number of cells in the normal brain (Herculano-Houzel and Lent, 2005; Herculano-Houzel et al., 2007; Herculano-Houzel, 2011). Using a non-stereological method, the isotrophic fractionator, Azevedo et al. (2009) found the total number of cells in four brains from 50-, 51-, 54-, and 71- year-old males, deceased from non-neurological causes and without cognitive impairment to have on average 86.1 ± 8.1 billion NeuN-positive cells (“neurons”) and 84.6 ± 9.8 billion NeuN-negative (“non-neuronal”) cells. Using a fractionator sampling scheme and optical disector probes (Gundersen et al., 1988b; West et al., 1991; West, 1993), we estimated the total number of neurons and glial cells in the cerebrum of four normal Danish subjects. Subjects were between 62 and 71 years of age (three males, one female) and had been included in another study. The results, which are shown in Table 3, are within the normal range though in the lower end. This could be due to age and a small sample size. The results by Azevedo et al. (2009), excluding cerebellum, is within normal numbers. The isotrophic fractionator method can thus offer reliable total numbers when total numbers are of interest, provided the cells can be identified correctly by a staining method. Using stereological methods, the anatomical brain structures, and the specific regions are preserved and total numbers can be combined with estimates of regional brain volumes, surfaces, fiber length, cell distances, pathological markers etc. Further, the brain can be used repeatedly in new studies and with new scientific issues, which is of special importance in human brain research, where the tissue is so valuable. In sum, the biological variance in the number of cells from brain to brain, in both selected brain regions and the entire hemisphere, is high. This is so, even for brains of approximately the same age. It is thus difficult to give an average for humans because of rather large differences between males and females (~15%) and with age (~10%) (Pakkenberg and Gundersen, 1997).
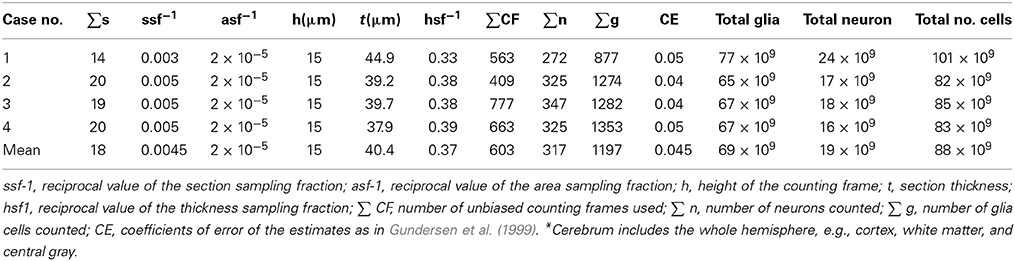
Table 3. Details of the stereological procedure for determining total number of cells in the human cerebrum* using the optical fractionator method.
Other Mammals
A prominent aspect of the human brain compared with brains of other species is its large size and high number of neurons (Figure 5). For comparison we have included estimates of the total number of neocortical neurons from other mammals, using similar modern stereological methods. The numbers are shown in Table 2. Relatively speaking, the human brain is the biggest primate brain, being three times larger than the brain of great apes. Large mammals such as elephants and whales have larger brains than humans, but only because brain weight is linearly correlated with body weight in mammals (Armstrong, 1990). Primate neocortical size increases predictably, as overall brain size increases, and the human neocortex follows this scaling rule. The prefrontal cortex makes up nearly 30% of the entire neocortex in humans, 17% in chimpanzees, and about 10% in small primates such as the M. maurus (11%) or marmoset (9%) (Brodmann, 1912). A chimpanzee-to-human brain warping study based on a limited set of homologies showed selective expansion of human prefrontal and lateral temporal association cortices (Avant et al., 2006). The human frontal cortex displays a higher ratio of glia to neurons than in other anthropoid primates. Sherwood et al. (2006) estimated cell densities using optical disectors in layer II/III of dorsolateral prefrontal cortex (area 9L) in the left hemisphere of brain samples representing 18 anthropoid primate species. They found that the human frontal cortex displays a higher ratio of glia to neurons than in other anthropoid primates. This relative increase in glia conformed to allometric scaling expectations, when taking the large increase of the human brain into consideration. They suggested that the relatively greater numbers of glia in the human neocortex relate to the energetic costs of maintaining larger dendritic arbors and long-range projecting axons in the context of a large brain. Comparing the spatial organization of neurons in the cortex of humans and great apes, Semendeferi et al. (2011) found differences in the frontal pole between humans and apes. The so-called horizontal spacing distance between neurons was 30% larger in humans compared to other species including bonobo, chimpanzee, gorilla, orangutan, and gibbon. Thus in many ways the prefrontal cortex separates humans from other mammals. These results are supported by estimates of neuron numbers. With an average bilateral total neuron number of ~7.8 × 10⁹ in the frontal cortex and ~1.3 × 10⁹ in the motor cortex (Gredal et al., 2000), average neocortical neuron number in the human prefrontal cortex is thus ~6.5 × 10⁹ or close to one-third of the number of all neocortical neurons. Compared with other living primate species, relatively more of the human cerebral cortex is dedicated to conceptual and other forms of higher-order cognitive processing as opposed to perceptual processing (Rilling, 2013).
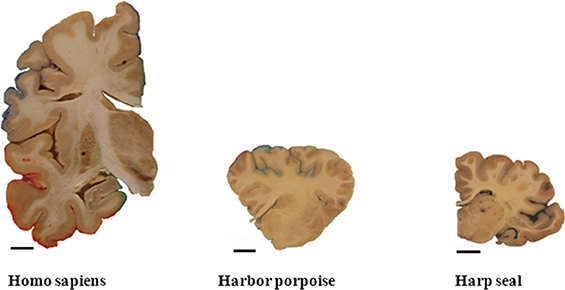
Figure 5. A prominent aspect of the human brain compared with brains of other species is its large size. Coronal sections through a hemisphere of an adult human, an adult harbor porpoise, and an adult harp seal brain (Part of the picture is with courtesy of Walløe et al., 2010). Scale bar = 1 cm.
Discussion
Our knowledge about the relationship between brain structure and cognitive function is limited by the considerable variability of the brain in size and shape, including the size of individual cortical areas, and the fact that most historical data were collected by potentially biased methods. Within the last 20–30 years, it has become possible to obtain more reliable data with unbiased stereological methods. These methods have provided us with new information about, for example, differences in cell number between men and women, the effect of age on selected brain cell populations, and disease-related changes associated with a loss of function (Pakkenberg and Gundersen, 1997; Andersen et al., 2003; Fabricius et al., 2007; Karlsen and Pakkenberg, 2011; Fabricius et al., 2013). Normal neocortical neuron numbers were found in chronic alcoholics (Jensen and Pakkenberg, 1993; Fabricius et al., 2007, 2013). This finding can have a major impact on the treatment of chronic alcoholism in that brain cells are not lost even after years of excessive alcohol consumption. The patients can therefore expect that brain function can be restored to normal if the abuse is terminated, even in subjects with a long history of alcohol abuse. Other studies provide notable results, including the observation that neocortical neuron number is normal in severely demented individuals with Alzheimer's diseases (Regeur et al., 1994; Pelvig et al., 2003), whereas total neocortical neuron number is significantly reduced in individuals dying from Acquired Immune Deficiency Syndrome (AIDS) without dementia (Oster et al., 1995). The stereological methods are also highly relevant to comparative neurology where such data can be used to illuminate the human brain's place in nature. Future research will undoubtedly provide additional knowledge about the human brain, its complexity, and changes caused by disease.
Conflict of Interest Statement
The authors declare that the research was conducted in the absence of any commercial or financial relationships that could be construed as a potential conflict of interest.
References
Andersen, B. B., Gundersen, H. J., and Pakkenberg, B. (2003). Aging of the human cerebellum: a stereological study. J. Comp. Neurol. 466, 356–365. doi: 10.1002/cne.10884
Avant, B. B., Schoenemann, P. T., and Gee, J. C. (2006). Lagrangian frame diffeomorphic image registration: morphometric comparison of human and chimpanzee cortex. Med. Image Anal. 10, 397–412. doi: 10.1016/j.media.2005.03.005
Azevedo, F. A. C., Carvalho, L. R. B., Grinberg, L. T., Farfel, J. M., Ferretti, R. E. L., Leite, R. E. P., et al. (2009). Equal numbers of neuronal and non-neuronal cells make the human brain an isometrically scaled-up primate brain. J. Comp. Neurol. 513, 532–541. doi: 10.1002/cne.21974
Baptista, L. F., and Schuchmann, K. L. (1990). Song learning in the Anna hummingbird (Calypte Anna). Ethology 84, 15–26.
Boughman, J. W. (1998). Vocal learning by greater spear-nosed bats. Proc. R. Soc. B 265, 227–233. doi: 10.1098/rspb.1998.0286
Brazel, C. Y., Romanko, M. J., Rothstein, R. P., and Levison, S. W. (2003). Roles of the mammalian subventricular zone in brain development. Prog. Neurobiol. 69, 49–69. doi: 10.1016/S0301-0082(03)00002-9
Brodmann, K. (1912). Neue ergebnisse über die vergleichende histologische lokalisation der grosshirnrinde mit besonderer berüksichtigung des stirnhirns. Suppl. Anat. Anz. 41, 157–216.
Byron, I., Blakemore, C., and Rakic, P. (2008). Development of the human cerebral cortex: boulder committee revisited. Nat. Rev. Neurosci. 9, 110–122. doi: 10.1038/nrn2252
Christensen, J. R., Larsen, K. B., Lisanby, S. H., Scalia, J., Arango, V., Dwork, A. J., et al. (2007). Neocortical and hippocampal neuron and glial cell numbers in the rhesus monkey. Anat. Rec. (Hoboken) 290, 330–340. doi: 10.1002/ar.20504
Delfour, F., and Marten, K. (2001). Mirror image processing in three marine mammal species: killer whales (orcinus orca), false killer whales (pseudorca crassidens) and california sea lions (zalophus californianus). Behav. Process. 53, 181–190. doi: 10.1016/S0376-6357(01)00134-6
Dobbing, J., and Sands, J. (1973). Quantitative growth and development of human brain. Arch. Dis. Child. 48, 757–767. doi: 10.1136/adc.48.10.757
Dooling, R. J., Gephart, B. F., Price, P. H., McHale, C., and Brauth, S. E. (1987). Effects of deafening on the contact calls of the budgerigar (Melopsittacus undulatus). Anim. Behav. 35, 1264–1266. doi: 10.1016/S0003-3472(87)80190-2
Eriksen, N., and Pakkenberg, B. (2007). Total neocortical cell number in the mysticete brain. Anat. Rec. (Hoboken) 290, 83–95. doi: 10.1002/ar.20404
Esser, K. H. (1994). Audio-vocal learning in a non-human mammal: the lesser spear-nosed bat Phyllostomus discolor. Neuroreport 5, 1718–1720. doi: 10.1097/00001756-199409080-00007
Fabricius, K., Jacobsen, J. S., and Pakkenberg, B. (2013). Effect of age on neocortical brain cells in 90+ year old human females–a cell counting study. Neurobiol. Aging 34, 91–99. doi: 10.1016/j.neurobiolaging.2012.06.009
Fabricius, K., Pakkenberg, H., and Pakkenberg, B. (2007). No changes in neocortical cell volumes or glial cell neumbers in chronic alcoholic subjects compared to control subjects. Alcohol Alcohol. 42, 400–406. doi: 10.1093/alcalc/agm007
Gaunt, S. L. L., Baptista, L. F., Sanchez, J. E., and Hernandez, D. (1994). Song learning as evidenced of song sharing in two humminbirds speices (Colibri coruscans and C. thalassinus). Auk 111, 87–103.
Gredal, O., Pakkenberg, H., Karlsborg, M., and Pakkenberg, B. (2000). Unchanged total number of neurons in motor cortex and neocortex in amyotrophic lateral sclerosis: a stereological study. J. Neurosci. Methods 95, 171–176. doi: 10.1016/S0165-0270(99)00175-2
Guihard-Costa, A., and Larroche, J.-C. (1990). Differential growth between the fetal brain and its infratentorial part. Early Hum. Dev. 23, 27–40. doi: 10.1016/0378-3782(90)90126-4
Gundersen, H. J. (1986). Stereology of arbitrary particles. A review of unbiased number and size estimators and the presentation of some new ones, in memory of William R. Thompson. J. Microsc. 143, 3–45.
Gundersen, H. J., Bendtsen, T. F., Korbo, L., Marcussen, N., Møller, A., Nielsen, K., et al. (1988a). Some new, simple and efficient stereological methods and their use in pathological research and diagnosis. APMIS 96, 379–394. doi: 10.1111/j.1699-0463.1988.tb05320.x
Gundersen, H. J., Jensen, E. B., Kieu, K., and Nielsen, J. (1999). The efficiency of systematic sampling in stereology–reconsidered. J. Microsc. 193(pt 3), 199–211.
Gundersen, H. J. G., Bagger, P., Bendtsen, T. F., Evans, S. M., Korbo, L., Marcussen, N., et al. (1988b). The new stereological tools: disector, fractionators, nucleator and point sampled intercepts and their use in pathological research and diagnosis. APMIS 96, 857–881. doi: 10.1111/j.1699-0463.1988.tb00954.x
Herculano-Houzel, S. (2011). Brains matter, bodies maybe not: the case for examining neuron numbers irrespective of body size. Ann. N.Y. Acad. Sci. 125, 191–199. doi: 10.1111/j.1749-6632.2011.05976.x
Herculano-Houzel, S., Collins, C. E., Wong, P., and Kaas, J. H. (2007). Cellular scaling rules for primate brains. Proc. Natl. Acad. Sci. U.S.A. 104, 3562–3567. doi: 10.1073/pnas.0611396104
Herculano-Houzel, S., and Lent, R. (2005). Isotrophic fractionator: a simple, rapid method for the quantification of total cell and neuron numbers in the brain. J. Neurosci. 25, 2518–2521. doi: 10.1523/JNEUROSCI.4526-04.2005
Janik, V. M. (2000). Whistle matching in wild bottlenose dolphins (tursiops truncatus). Science 289, 1355–1357. doi: 10.1126/science.289.5483.1355
Jelsing, J., Nielsen, R., Olsen, A. K., Grand, N., Hemmingsen, R., and Pakkenberg, B. (2006). The postnatal development of neocortical neurons and glial cells in the göttingen minipig and the domestic pig brain. J. Exp. Biol. 209, 1454–1462. doi: 10.1242/jeb.02141
Jensen, E. B., and Pakkenberg, B. (1993). Do alcoholics drink their neurons away? Lancet 342, 1201–1204.
Karlsen, A. S., and Pakkenberg, B. (2011). Total numbers of neurons and glial cells in cortex and basal ganglia of aged brains with down syndrome–a stereological study. Cereb. Cortex 21, 2519–2524. doi: 10.1093/cercor/bhr033
Kiessling, M., Büttner, A., Butti, C., Müller-Starck, J., Milz, S., Hof, P., et al. (2014). Cerebellar granule cells are generated postnatally in humans. Brain Struct. Funct. 219, 1271–1286. doi: 10.1007/s00429-013-0565-z
Korbo, L., Pakkenberg, B., Ladefoged, O., Gundersen, H. J. G., Arlien-Søborg, P., and Pakkenberg, H. (1990). An efficient method for estimating the total number of neurons in rat brain cortex. J. Neurosci. Methods 31, 93–100. doi: 10.1016/0165-0270(90)90153-7
Kornack, D. R. (2000). Neurogenesis and the evolution of cortical diversity: mode, tempo, and partitioning during development and persistence in adulthood. Brain Behav. Evol. 55, 336–344. doi: 10.1159/000006668
Kostovic, I., and Judas, M. (1995). Ultrasound and the Fetal Brain. New York, NY: The Parthenon Publishing Group.
Larsen, C. C., Bonde, L. K., Bogdanovic, N., Laursen, H., Graem, N., Samuelsen, G. B., et al. (2006). Total numbers of cells in the human newborn telencephalic wall. Neuroscience 139, 999–1003. doi: 10.1016/j.neuroscience.2006.01.005
Lefebvre, L., Reader, S. M., and Sol, D. (2004). Brains, innovations and evolution in brids and primates. Brain Behav. Evol. 63, 233–246. doi: 10.1159/000076784
Letinic, K., Zoncu, R., and Rakic, P. (2002). Origins of GABAergic neurons in the human neocortex. Nature 417, 645–649. doi: 10.1038/nature00779
Marler, P., and Tamura, M. (1964). Culturally transmitted patterns of vocal behavior in sparrows. Science 146, 1483–1486. doi: 10.1126/science.146.3650.1483
Mouton, P. R. (2014). Neurostereology: Unbiased Stereology of Neural Systems. Oxford, UK: Wiley Blackwell. doi: 10.1002/9781118444177
Mundinger, P. C. (1980). Animal cultures and a general theory of cultural evolution. Ethol. Sociobiol. 1, 183–223. doi: 10.1016/0162-3095(80)90008-4
Oster, S., Christoffersen, P., Gundersen, H. J., Nielsen, J. O., Pedersen, C., and Pakkenberg, B. (1995). Six billion neurons lost in AIDS. A stereological study of the neocortex. APMIS 103, 525–529.
Pakkenberg, B., and Gundersen, H. J. (1997). Neocortical neuron number in humans: effect of sex and age. J. Comp. Neurol. 384, 312–320.
Pelvig, D. P., Pakkenberg, H., Regeur, L., Oster, S., and Pakkenberg, B. (2003). Neocortical glial cell numbers in alzheimer's disease. A stereological study. Dement. Geriatr. Cogn. Disord. 16, 212–219. doi: 10.1159/000072805
Pelvig, D. P., Pakkenberg, H., Stark, A. K., and Pakkenberg, B. (2008). Neocortical glial cell numbers in human brains. Neurobio. Aging 29, 1754–1762. doi: 10.1016/j.neurobiolaging.2007.04.013
Poole, J. H., Tyack, P. L., Stoeger-Horwath, A. S., and Watwood, S. (2005). Elephants are capable of vocal learning. Nature 434, 455–456. doi: 10.1038/434455a
Prechtl, H. F. (1986). New perspectives in early human development. Eur. J. Obstet. Gynecol. Reprod. Biol. 21, 347–355. doi: 10.1016/0028-2243(86)90014-6
Rakic, P. (1972). Mode of cell migration to the superficial layers of fetal monkey neocortex. J. Comp. Neurol. 145, 61–83. doi: 10.1002/cne.901450105
Rakic, P. (1988). Specification of cerebral cortical areas. Science 241, 170–176. doi: 10.1126/science.3291116
Rakic, P. (2003). Developmental and evolutionary adaptations of cortical radial glia. Cereb. Cortex 13, 541–549. doi: 10.1093/cercor/13.6.541
Regeur, L., Jensen, G. B., Pakkenberg, H., Evans, S. M., and Pakkenberg, B. (1994). No global neocortical nerve cell loss in brains from patients with senile dementia of alzheimer's type. Neurobiol. Aging 15, 347–352. doi: 10.1016/0197-4580(94)90030-2
Rilling, J. K. (2013). Comparative primate neuroimaging: insights into human brain evolution. Trends Cogn. Sci. 18, 46–55. doi: 10.1016/j.tics.2013.09.013
Rose, R. D., and Rohrlich, D. (1987). Counting sectioned cells via mathematical reconstruction. J. Comp. Neurol. 263, 365–386. doi: 10.1002/cne.902630305
Samuelsen, G. B., Larsen, K. B., Bogdanovic, N., Laursen, H., Graem, N., Larsen, J. F., et al. (2003). The changing number of cells in the human fetal forebrain and its subdivisions: a stereological analysis. Cereb. Cortex 13, 115–122. doi: 10.1093/cercor/13.2.115
Sanvito, S., Galimberti, F., and Miller, E. H. (2007). Observational evidences of vocal learning in southern elephant seals. Ethology 113, 137–146. doi: 10.1111/j.1439-0310.2006.01306.x
Semendeferi, K., Teffer, K., Buxhoeveden, D. P., Park, M. S., Bludau, S., Amunts, K., et al. (2011). Spatial organization of neurons in the frontal pole sets humans apart from great apes. Cereb. Cortex 21, 1485–1497. doi: 10.1093/cercor/bhq191
Sherwood, C. C., Stimpson, C. D., Raghanti, M. A., Wildman, D. E., Uddin, M., Grossman, L. I., et al. (2006). Evolution of increased glia-neuron ratios in the human frontal cortex. Proc. Natl. Acad. Sci. U.S.A. 103, 13606–13611. doi: 10.1073/pnas.0605843103
Sol, D., Duncan, R. P., Blackburn, T. M., Cassey, P., and Lefebvre, L. (2005). Big brains, enhanced cognition, and response of birds to novel environments. Proc. Natl. Acad. Sci. U.S.A. 102, 5460–5465. doi: 10.1073/pnas.0408145102
Walløe, S., Eriksen, N., Dabelsteen, T., and Pakkenberg, B. (2010). A neurological comparative study of the harp seal (Pagophilus groenlandicus) and harbor porpoise (Phocoena phocoena) brain. Anat Rec (Hoboken) 293, 2129–2135. doi: 10.1002/ar.21295
Weibel, E. R., and Gomez, D. M. (1962). A principle for counting tissue structures on random sections. J. Appl. Physiol. 17, 343–348.
West, M. (2012). Basic Stereology for biologists and neuroscientists. New York, NY: Cold Spring Harbor; Cold Spring Harbor Laboratory Press.
West, M. J. (1993). New stereological methods for counting neurons. Neurobiol. Aging 14, 275–285. doi: 10.1016/0197-4580(93)90112-O
West, M. J., and Gundersen, H. J. (1990). Unbiased stereological estimation of the number of neurons in the human hippocampus. J. Comp. Neurol. 296, 1–22. doi: 10.1002/cne.902960102
West, M. J., Slomianka, L., and Gundersen, H. J. (1991). Unbiased stereological estimation of the total number of neurons in the subdivisiond of the rat hippocampus using the optical fractionator. Anat. Rec. 231, 482–497.
Keywords: human brain, cell numbers, development, neocortex, stereology
Citation: Walløe S, Pakkenberg B and Fabricius K (2014) Stereological estimation of total cell numbers in the human cerebral and cerebellar cortex. Front. Hum. Neurosci. 8:508. doi: 10.3389/fnhum.2014.00508
Received: 04 April 2014; Accepted: 24 June 2014;
Published online: 15 July 2014.
Edited by:
Chet C. Sherwood, George Washington University, USAReviewed by:
Christoph Schmitz, Ludwig-Maximilians-University of Munich, GermanyNicole Barger, University of California, USA
Copyright © 2014 Walløe, Pakkenberg and Fabricius. This is an open-access article distributed under the terms of the Creative Commons Attribution License (CC BY). The use, distribution or reproduction in other forums is permitted, provided the original author(s) or licensor are credited and that the original publication in this journal is cited, in accordance with accepted academic practice. No use, distribution or reproduction is permitted which does not comply with these terms.
*Correspondence: Katrine Fabricius, Research Laboratory for Stereology and Neuroscience, Bispebjerg and Frederiksberg Hospitals, Bispebjerg Bakke 23, Copenhagen, NV 2400, Denmark e-mail:a2F0cmluZWZhYnJpY2l1c0Bob3RtYWlsLmNvbQ==