 Vessela Stamenova1*
 Janine M. Jennings2
 Shaun P. Cook3
 Lisa A. S. Walker4
 Andra M. Smith4
 Patrick S. R. Davidson4
- 1Rotman Research Institute, Baycrest – University of Toronto, Toronto, ON, Canada
- 2Department of Psychology, Wake Forest University, Winston-Salem, NC, USA
- 3Department of Psychology, Millersville University, Millersville, PA, USA
- 4School of Psychology, Faculty of Social Sciences, Ottawa Hospital Research Institute, University of Ottawa, Ottawa, ON, Canada
A corrigendum on
Training recollection in healthy older adults: clear improvements on the training task, but little evidence of transfer
by Stamenova, V., Jennings, J. M., Cook, S. P., Walker, L. A., Smith, A. M., and Davidson, P. S. R. (2014). Front. Hum. Neurosci. 8:898. doi: 10.3389/fnhum.2014.00898
Due to errors that were noticed recently in the California Verbal Learning Test-II (CVLT-II) scoring software version 1.0.0 with the software occasionally mis-counting items, we have recalculated all CVLT scores and re-run all relevant analyses. This update was completed with a software update (to version 1.0.2) (see http://pearsonassessmentsupport.com/support/index.php?View=entry&EntryID=741).
The majority of the statistical effects remain the same as in the original publication, except for two.
These are:
Section: Predictors of training gains
1. For the regression, the initial analysis showed that adding the additional variables led to a significant increase in prediction. Now this result is marginally significant, at p = 0.056. The initial increase was by 45% and now it is by 44%.
2. In the same regression, Model 2 Digit Span Backward was initially statistically significant at p = 0.049, but after corrections now p = 0.058. We state that this effect is marginally significant. Because of this initially significant effect, in a partial correlation conducted later on section entitled: Do those participants who show the greatest gains in training also show the greatest improvements on the transfer tasks?, we controlled for Digit Span backwards scores. We chose to still control for these scores, given that the significant test is so close to the cut-off.
No other effect changes were observed in any of our analyses involving the CVLT. The values, however, have changed slightly and we have updated those values in Tables 3, 4 of the manuscript.
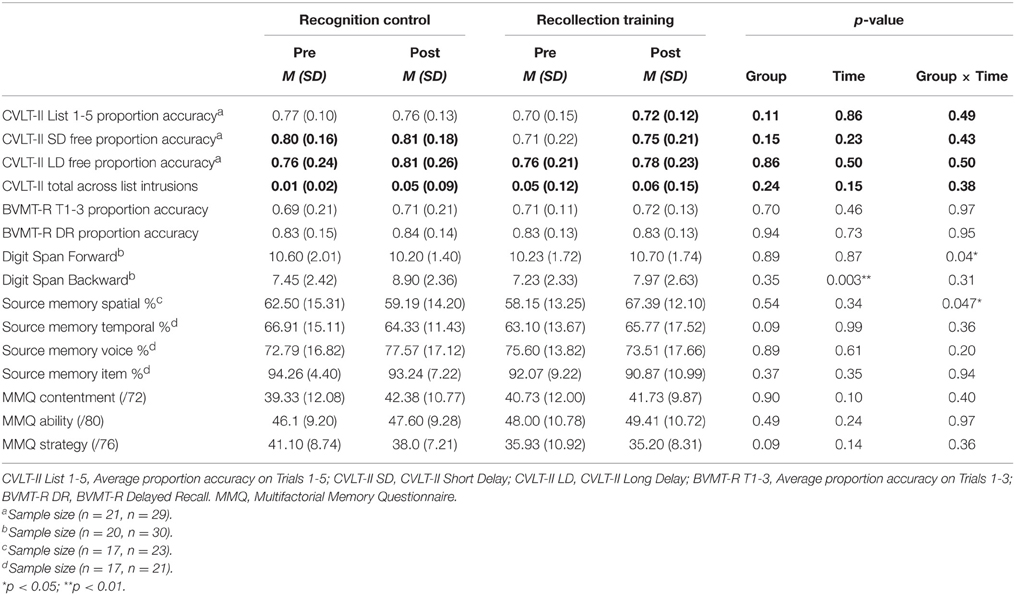
Table 3. Pre- and post-training scores on transfer measures.
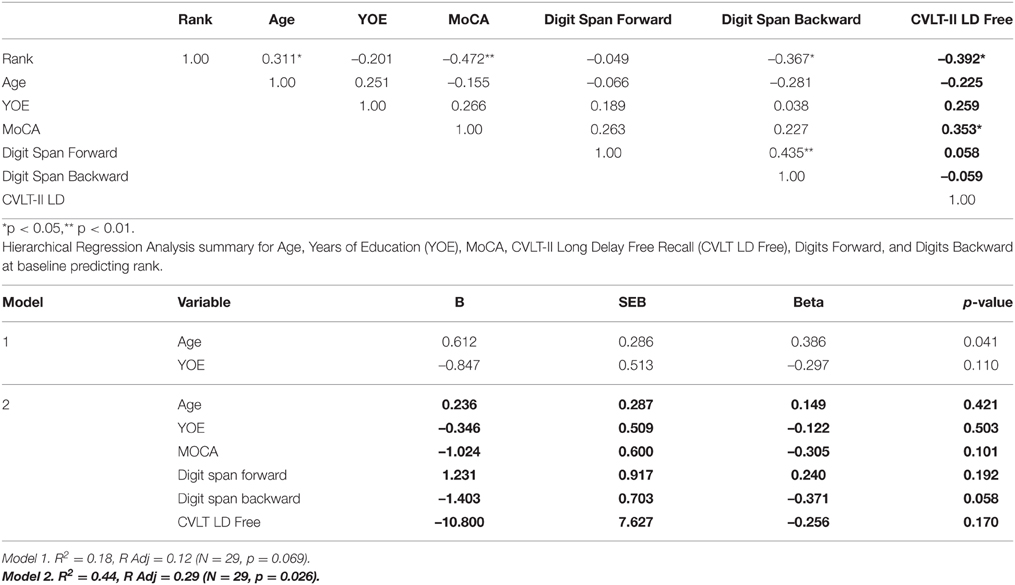
Table 4. Intercorrelations for Rank, MoCA, CVLT-II Long Delay Free Recall Proportion Accuracy (CVLT LD), and Digits Backward at baseline.
Overall, given the changes affect only one of our outcome measures and the fact that the results with this outcome measure have changed only for two statistical tests, we believe that the correction does not affect the scientific validity of the results.
Please see below the relevant changes made, with bold font for the edited or inserted text.
In section “Predictors of Training Gains,”
The regression results are summarized in Table 4; Multiple R for the first block of regressors (age and YOE) was close to statistical significance, F(2, 29) = 2.96, p = 0.069; multiple R for the next block of regressors was significant F(6, 29) = 3.00, p = 0.026. The demographic variables (Age and YOE) explained 18% of the variance, while adding the cognitive status scores in block 2 of the analysis increased the amount of variability explained to 44%. This increase is marginally significant by the F change test F(4, 23) = 2.66, p = 0.056. Among the demographic variables, only age was significant, while among the cognitive status, Digit Span Backwards (p = 0.058) was marginally statistically significant, followed by the MoCA (p = 0.101), which was marginally significant.
In section “Do those participants who show the greatest gains in training also show the greatest improvements on the transfer tasks?,” last sentence:
There was, however, a significant correlation between the change in Spatial Source Memory and rank, r = –0.37, p (one-tailed) = 0.048, df = 19.
Please see below relevant changes made to Tables 3, 4.
Conflict of Interest Statement
The authors declare that the research was conducted in the absence of any commercial or financial relationships that could be construed as a potential conflict of interest.
Keywords: aging, memory, rehabilitation, recollection, familiarity
Citation: Stamenova V, Jennings JM, Cook SP, Walker LAS, Smith AM and Davidson PSR (2015) Corrigendum: Training recollection in healthy older adults: clear improvements on the training task, but little evidence of transfer. Front. Hum. Neurosci. 9:658. doi: 10.3389/fnhum.2015.00658
Received: 04 November 2015; Accepted: 19 November 2015;
Published: 01 December 2015.
Edited by:
Guido P. H. Band, Leiden University, NetherlandsReviewed by:
Kristin Flegal, University of Glasgow, ScotlandCopyright © 2015 Stamenova, Jennings, Cook, Walker, Smith and Davidson. This is an open-access article distributed under the terms of the Creative Commons Attribution License (CC BY). The use, distribution or reproduction in other forums is permitted, provided the original author(s) or licensor are credited and that the original publication in this journal is cited, in accordance with accepted academic practice. No use, distribution or reproduction is permitted which does not comply with these terms.
*Correspondence: Vessela Stamenova, dnN0YW1lbm92YUByZXNlYXJjaC5iYXljcmVzdC5vcmc=