 Zafer Iscan
 Maria Nazarova
 Tommaso Fedele
 Evgeny Blagovechtchenski
 Vadim V. Nikulin
- 1Centre for Cognition and Decision Making, National Research University Higher School of Economics, Moscow, Russia
- 2Research Center of Neurology, Moscow, Russia
- 3Department of Neurosurgery, University Hospital of Zurich, University of Zurich, Zurich, Switzerland
- 4Laboratory of Neuroscience and Molecular Pharmacology, Institute of Translational Biomedicine, Saint Petersburg State University, Saint Petersburg, Russia
- 5Neurophysics Group, Department of Neurology, Charité – University Medicine Berlin, Berlin, Germany
Inter- and intra-subject variability of the motor evoked potentials (MEPs) to TMS is a well-known phenomenon. Although a possible link between this variability and ongoing brain oscillations was demonstrated, the results of the studies are not consistent with each other. Exploring this topic further is important since the modulation of MEPs provides unique possibility to relate oscillatory cortical phenomena to the state of the motor cortex probed with TMS. Given that alpha oscillations were shown to reflect cortical excitability, we hypothesized that their power and variability might explain the modulation of subject-specific MEPs to single- and paired-pulse TMS (spTMS, ppTMS, respectively). Neuronal activity was recorded with multichannel electroencephalogram. We used spTMS and two ppTMS conditions: intracortical facilitation (ICF) and short-interval intracortical inhibition (SICI). Spearman correlations were calculated within and across subjects between MEPs and the pre-stimulus power of alpha oscillations in low (8–10 Hz) and high (10–12 Hz) frequency bands. Coefficient of quartile variation was used to measure variability. Across-subject analysis revealed no difference in the pre-stimulus alpha power among the TMS conditions. However, the variability of high-alpha power in spTMS condition was larger than in the SICI condition. In ICF condition pre-stimulus high-alpha power variability correlated positively with MEP amplitude variability. No correlation has been observed between the pre-stimulus alpha power and MEP responses in any of the conditions. Our results show that the variability of the alpha oscillations can be more predictive of TMS effects than the commonly used power of oscillations and we provide further support for the dissociation of high and low-alpha bands in predicting responses produced by the stimulation of the motor cortex.
Introduction
While single-pulse TMS (spTMS) allows studying corticospinal excitability (Kujirai et al., 1993; Nakamura et al., 1997; Chen et al., 1998; Sanger et al., 2001; Chen, 2004), paired-pulse TMS (ppTMS) (Kujirai et al., 1993) provides a possibility to gain additional information about intracortical inhibitory/excitatory processes. One of the intensely discussed issues in sp- and ppTMS research, strongly affecting its sensitivity, and reproducibility (Goldsworthy et al., 2016) is a large trial-to-trial variability of the responses to TMS including motor evoked potentials (MEPs; Ellaway et al., 1998; Zarkowski et al., 2006; Mitchell et al., 2007; Sauseng et al., 2009; Jung et al., 2010; Mäki and Ilmoniemi, 2010; Takemi et al., 2013; Berger et al., 2014) or phosphene sensation (Romei et al., 2008). Importantly, it was also shown that average TMS-electroencephalogram (EEG) responses are reproducible across subjects in case of a stable position of a stimulating coil (Lioumis et al., 2009; Casarotto et al., 2010). In the previous studies, it has been found that the variability of the responses to TMS may be associated with the ongoing brain oscillations (Zarkowski et al., 2006; Sauseng et al., 2009; Mäki and Ilmoniemi, 2010; Dugué et al., 2011; Takemi et al., 2013; Berger et al., 2014). However, the results of these studies were rather heterogeneous: in several early publications a negative correlation between alpha power and the amplitude of MEP during spTMS was reported (Zarkowski et al., 2006; Sauseng et al., 2009). In several other studies no association of the responsiveness to TMS with power in either frequency band was observed (Mäki and Ilmoniemi, 2010; Berger et al., 2014). On the other hand, alternative approaches to probing oscillatory dynamics based on EEG connectivity (Ferreri et al., 2011; Giambattistelli et al., 2014), EEG-EMG coherence analysis (Keil et al., 2014; Schulz et al., 2014) or phase-locking with TMS pulse (Mäki and Ilmoniemi, 2010; Dugué et al., 2011; Berger et al., 2014; Kundu et al., 2014) provided additional insights into the MEP variability.
Compared to rather large number of TMS-EEG studies dedicated to spTMS (Zarkowski et al., 2006; Sauseng et al., 2009; Mäki and Ilmoniemi, 2010; Dugué et al., 2011; Berger et al., 2014), very few were performed with ppTMS (Takemi et al., 2013), yet since short-interval intracortical inhibition (SICI) and intracortical facilitation (ICF) phenomena are known to have primarily intracortical origin (Kujirai et al., 1993; Chen, 2004), they might be more tightly related to cortical oscillations.
Another important question is whether the degree of oscillatory neuronal variability by itself can relate with MEP produced by sp and ppTMS. During the last several years a number of studies specifically focused on the role of brain activity fluctuations and their functional relevance to behavioral and clinical outcomes (Mizuno et al., 2010; Bosl et al., 2011; Hohlefeld et al., 2012; Garrett et al., 2013b; Schlee et al., 2014). The variability of ongoing neuronal activity is thought to reflect intricate synaptic organization of the cortex (Poil et al., 2012; Shew and Plenz, 2013). Moreover, temporal structure of neuronal oscillations is far from being purely stochastic and demonstrates scale-free patterns (Palva et al., 2013). Functional significance of variability in cortical oscillations stems from the findings showing its relationship to behavioral variability (Palva et al., 2013; Smit et al., 2013). Clinically, changes in EEG alpha variability were shown in patients with tinnitus (Schlee et al., 2014) and epilepsy (Larsson et al., 2005) and appeared to be important for the outcome after brain trauma (Hebb et al., 2007). Interestingly, temporal variability in alpha oscillations may be genetically predetermined (Linkenkaer-Hansen et al., 2007) and thus can be associated with the across-subjects variability of the responses to TMS, which is another highly discussed topic in TMS research. This would be in agreement with our recent findings that long-range temporal correlations in the amplitude dynamics of alpha EEG oscillations during rest correlate with the strength of ICF (Fedele et al., 2016). A possibility to use neuronal variability to predict inter-subject difference of the TMS responses is also clinically relevant due to the growing evidence that spTMS and ppTMS phenomena changes may have a diagnostic value in many neurological and psychiatric disorders such as stroke (Bütefisch et al., 2008; Oh et al., 2010; Lioumis et al., 2012), dystonia (Bütefisch et al., 2005; Beck et al., 2009), or schizophrenia (Strube et al., 2014). In this sense particularly interesting is a connection between the variability of TMS responses with respect to the variability of cortical alpha oscillations as they are thought to reflect cortical excitability (Neuper et al., 2006).
Given all the considerations presented above, in the present study we hypothesized that: (1) Not only power but also the variability of alpha oscillations would be predictive of TMS responses. (2) Pre-stimulus alpha oscillations would relate more closely to MEP variability in ppTMS than in spTMS protocols.
Materials and Methods
Participants
Seventeen right-handed healthy volunteers (six females) between 19 and 34 years of age (mean: 24 ± 4, SD) participated in the experiment after giving a written informed consent in accordance with the Declaration of Helsinki. Subjects were screened for contraindications to TMS (Rossi et al., 2009) before the consenting process. The experiments were approved by the Local Ethics Committee of National Research University Higher School of Economics, Moscow.
TMS Coil Positioning and Determination of Threshold
A MagPro X100 (MagVenture) stimulator connected to a water-cooled MCF-B65 induction coil with 75-mm wing radius was used to produce biphasic TMS pulses. A frameless TMS navigation system (Localite TMS Navigator, Localite GmbH) was used for MRI-guided navigation, which ensures consistent coil position and orientation in a 3D space through the sequence of stimulations. TMS coil position was optimized accordingly to individual MR scan (1.5 T MRI scanner; T1 weighted; 1 mm thickness; sagittal orientation; acquisition matrix 256 × 256; MR-scanner Siemens Magnetom Avanto). Stimulation targeted the left primary motor cortex [i.e., motor knob (Yousry et al., 1997)], a “hot spot” for the motor representation of the right abductor pollicis brevis (APB) muscle. The resting motor threshold (RMT) for the given “hot spot” was determined as a minimal stimulator output evoking contralateral APB MEPs of minimum 50 μV in a resting muscle, in 5 out of 10 given stimuli (Rossini et al., 1994).
Protocol
Three blocks of stimuli (101–114 trials each) were delivered: single-pulse (SP) TMS and two ppTMS protocols: short-interval cortical inhibition (SICI) and ICF. The inter-stimulus intervals (ISIs) for the paired-pulse stimuli were set at 2 ms or 12 ms for SICI and ICF protocols, respectively. The intensity of 110% of RMT was used for spTMS pulses and for the test pulses (S2) in ICF and SICI protocols. Conditioning pulses (S1) for both paired-pulse paradigms had 90% RMT intensity. The interval between the stimuli (or pairs of stimuli) varied randomly from 3 to 10 s and the inter-condition interval varied between 1 to 5 min. We provide the following reasons for determining inter-stimulus intervals. Firstly, we aimed at having a large variability of the intervals in order to avoid the anticipation effect. Secondly, as we used the same distribution for delays in all subjects, the results are unlikely to be due to the chosen inter-stimulus delays but rather would reflect genuine impact of oscillatory activity on cortical excitability. The three blocks were performed in a random order across participants. During all the conditions the coil was held by the operator who constantly monitored its position and orientation with respect to the target using navigation system. Subjects were seated in a comfortable armchair with elbows flexed at 90° and prone hands in a relaxed position, eyes were open and fixed at the mark on the opposite wall.
EEG and EMG Acquisition
In order to measure EEG, we used BrainAmp DC (Brain Products, Germany) amplifier. 91-electrode BrainCap Fast’n Easy Standard Electrode Cap (Brain Products) was used with TMS-compatible electrodes. The reference electrode was at the bridge of the nose, and ground electrode was placed on the left cheekbone. Three electrooculographic (EOG) electrodes were placed above the nasion and below the outer canthi of the eyes as indicated in (Schlögl et al., 2007). The impedance of each electrode was kept < 5 kΩ throughout the experiment. All data were recorded in the frequency band 0.016–1000 Hz and digitized at a sampling rate of 5 kHz. For the latter analysis the data was re-referenced to a common average electrode.
MEPs to single- and paired-pulse TMS (SP, SICI, ICF) were recorded from the right APB muscle with surface bipolar EMG, using Ag–AgCl bipolar electrodes in a belly–tendon montage and were also recorded with the BrainAmp DC amplifier.
MEP
EMG activity was high-pass filtered with a fourth order Butterworth high-pass filter (cut-off frequency at 10 Hz) and with the band-stop filter at 50 Hz to remove power-line noise. MEP peaks were identified within the range of 20–62 ms from the onset of the TMS stimulus for the three conditions (SP, SICI, and ICF). This range was sufficient to include MEPs in all subjects. Peak-to-peak measures of the largest positive–negative deflection were used as the MEP amplitudes. Visual inspection was also performed in parallel to remove possible artifactual trials.
Preprocessing
Electroencephalographic recordings were segmented using TMS event marker. Pre-stimulus segment was 1200 ms (-1210 ms to -10 ms). Channels with excessive amount of noise were excluded from further analysis (maximum 15 channels per subject). Blink-related artifacts in EEG were removed with fastICA algorithm (Hyvärinen, 1999). After the blink removal, we rejected noisy trials according to the variance criteria. For the further analysis we used a pre-stimulus length of 1000 ms for EEG data. The variance of EEG data in each trial was calculated and then a distribution was built. Trials exceeding 99% of the distribution were rejected. Channels with more than 20% artifactual trials were removed (instead of the trials). MEPs corresponding to these trials were excluded from the analysis as well. On average, the percentage of the missing channel was between 15 and 18% for different TMS conditions.
Power of Pre-stimulus Alpha Oscillations
Pre-stimulus alpha power was estimated from the spectrum calculated with Fast Fourier Transform (FFT), Hanning window (duration 1000-ms immediately preceding TMS pulse in spTMS or conditioning pulse in ppTMS). For the single-trial analysis the power was calculated separately for each pre-stimulus interval. For the across-subjects analysis, the power was averaged across all trials in each condition, electrode and subject. As has been performed in previous studies (Klimesch et al., 1998; Pfurtscheller et al., 2000; Frenkel-Toledo et al., 2013), we considered power in low-alpha (8–10 Hz) and high-alpha (10–12 Hz) sub-bands which might reflect different neuronal processes. Mean substitution method was used for the missing channel values for across subject analysis.
Variability of Power and MEP Amplitudes
The variability was estimated from single trials both for the amplitude of MEPs and for the pre-stimulus alpha power obtained in each subject, electrode and condition. It was quantified with the coefficient of quartile variation (CQV) (Bonett, 2006) – a descriptive statistic based on quartiles’ information:
In (1), Q1 and Q3 denote the first (lower) and third (upper) quartiles of the data, respectively. Quartiles are the points that divide any ranked data set into four equal groups. Each group contains a quarter of the data. Q3 - Q1 is defined as the interquartile range and it is a measure of the spread. Let vectors Pj = p1, p2…pn contain pre-stimulus power values from n trials in a given subject, condition and jth-electrode (j = 1,2… E, where E is the number of EEG electrodes). CQV will then be applied iteratively to all vectors Pj thus leading to E estimates of CQV. Similarly, CQV was also calculated for the amplitude of MEPs (but only for one bipolar EMG electrode). For each jth EEG electrode, CQV of the pre-stimulus power was then correlated with CQV of MEP amplitudes (across subjects) to study the relationship between neuronal variability in the cortex and the variability in motor responses. In general, CQV has an advantage compared to frequently used coefficient of variation since it is less sensitive to the deviations from normality (Bonett, 2006).
Statistical Analysis
We calculated a repeated measures analysis of variance (ANOVA) in order to compare the CQV of MEP amplitudes among the three TMS conditions. We computed Wilcoxon signed rank test for the comparison of pre-stimulus alpha power among the three TMS conditions. Using the same test, we compared the CQV of pre-stimulus alpha power and CQV of MEP amplitudes between the TMS conditions.
We computed a Spearman correlation of MEP amplitudes between conditions. Besides, we computed a Spearman correlation between alpha power and the amplitude of MEPs for each EEG channel and condition within and across subjects. Within-subject correlations are based on single trial analysis where the power of alpha oscillations is correlated with the corresponding MEP amplitude in each channel, subject, and condition. Moreover, in order to address a relationship between cortical and peripheral variabilities, correlations were computed between the CQV of alpha power versus CQV of MEP amplitudes for each EEG channel and condition across subjects (see above the description of CQV).
In order to take into account multiple comparisons (calculation of tests for many channels), for both Wilcoxon signed rank test and Spearman correlations across subjects, a significance was estimated using cluster-based permutation statistics (Maris and Oostenveld, 2007).
The analysis was performed with custom scripts implemented in Matlab (The MathWorks Inc., Natick, MA, USA).
Results
SICI and ICF Strength
ppTMS protocols led to robust SICI and ICF phenomena across subjects. ICF protocol resulted in the increase of MEPs amplitudes compared to MEPs amplitudes during SP condition (ICF/SP mean 2.34 ± 0.29). Likewise, SICI protocol resulted in the significant attenuation of MEPs compared to the SP (SICI/SP mean: 0.49 ± 0.07, Figure 1). This was statistically verified with the t-tests comparing normalized MEPs against the distribution with unitary mean (∗∗∗P < 0.001, Figure 1).
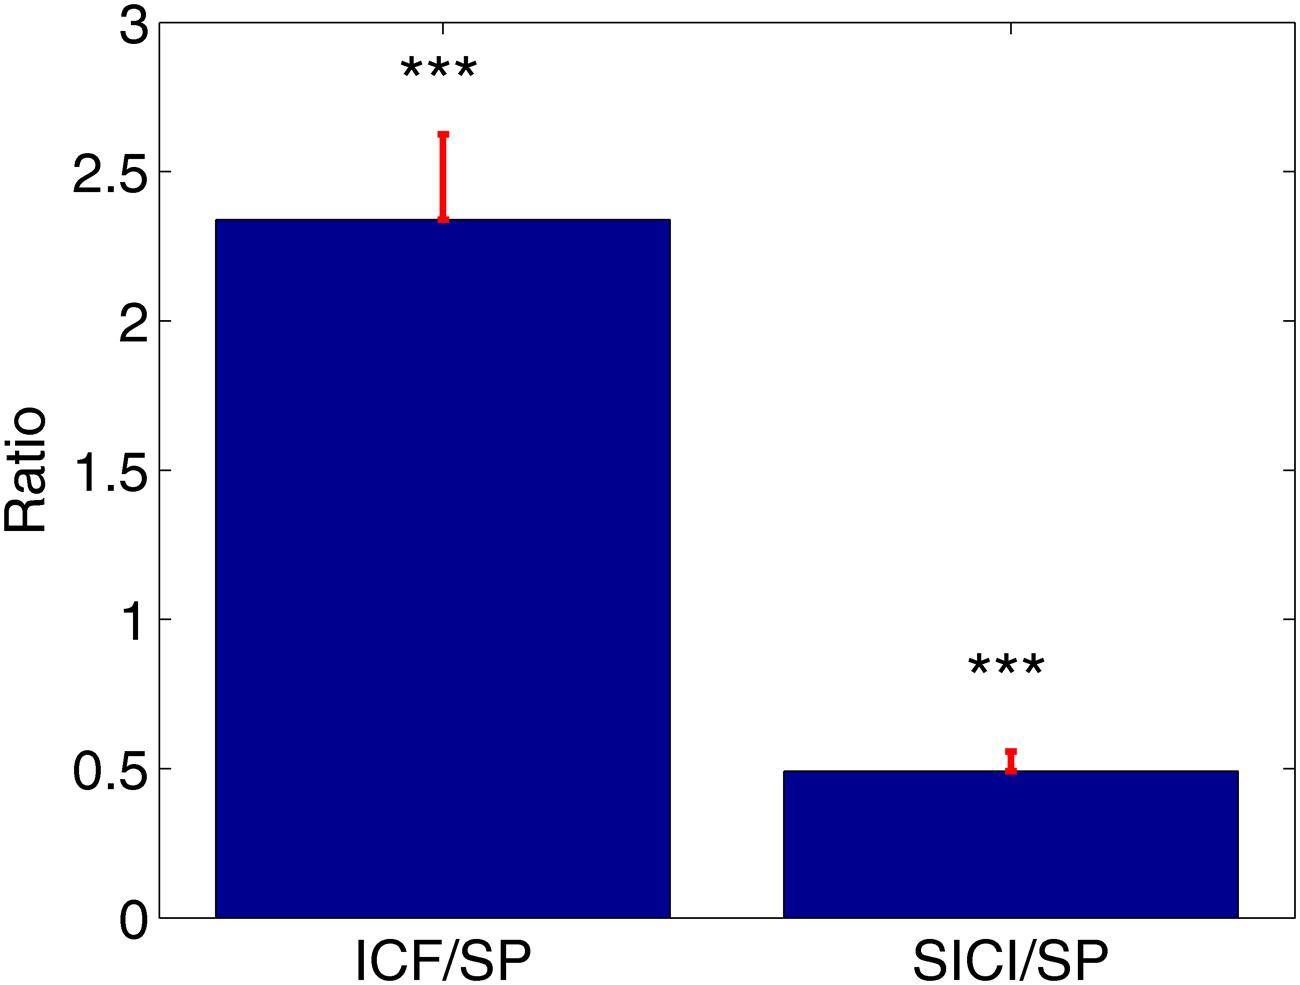
FIGURE 1. The average value of the normalized motor evoked potentials (MEPs) with corresponding standard errors. Intracortical facilitation (ICF)/single-pulse (SP) = 2.34, short-interval intracortical inhibition (SICI)/single-pulse (SP) = 0.49, ∗∗∗P < 0.001.
Differences between SP, SICI, and ICF Conditions across Subjects
Differences in Variability (CQV) of MEPs
The variability of MEPs was quantified with CQV. In Figure 2, CQV values of MEP amplitudes across subjects are presented.
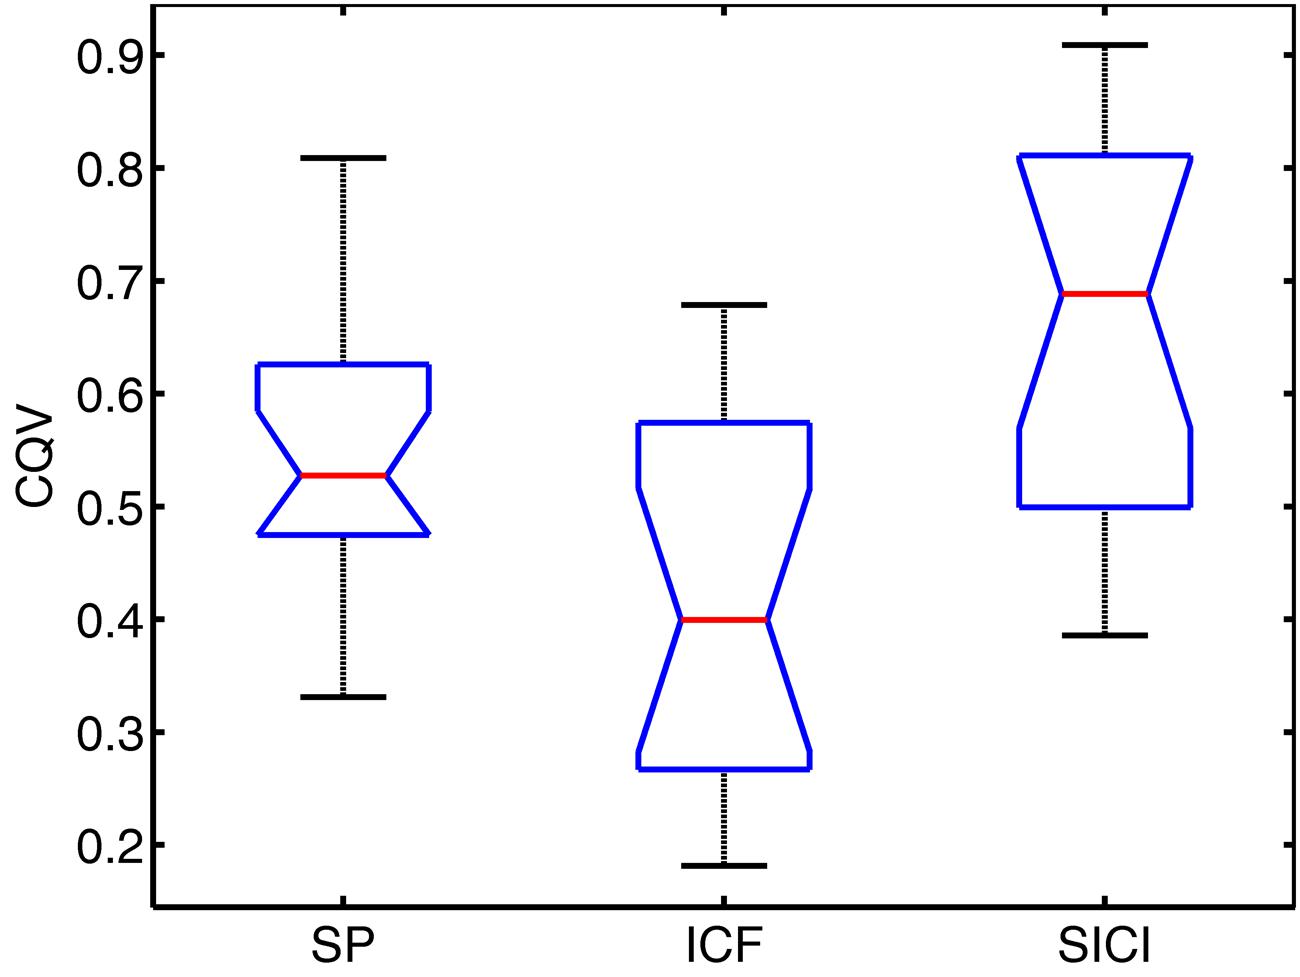
FIGURE 2. Notched boxplots for coefficient of quartile variation (CQV) in each TMS condition. Red lines show the median values. Bottom and top lines of the boxes represent the lower and upper quartiles of the data, respectively. Lower and upper whiskers denote the minimum and maximum CQV values, respectively. Notches show 95% confidence interval of the median value.
Repeated measures ANOVA showed significant differences among conditions (P < 0.001). Pairwise comparisons have been performed with Wilcoxon signed-rank test: significantly higher variability of MEPs amplitudes across subjects (assessed with CQV) was observed for SP compared to ICF sessions (P = 0.005), SICI had higher CQV compared to SP sessions (P = 0.008) and compared to ICF sessions (P < 0.002).
CQV of MEP amplitudes between the conditions showed significant positive correlations across subjects between SP and SICI conditions only: SP-ICF (R = 0.36, P = 0.162); SP-SICI (R = 0.64, P = 0.007); ICF-SICI (R = 0.33, P = 0.198).
Differences in Pre-stimulus Alpha Power among Conditions
We compared pre-stimulus alpha power between the three conditions using Wilcoxon signed rank test with cluster-based permutation statistics (see Materials and Methods). There were no differences of the alpha power between any of the TMS conditions (SP vs. SICI vs. ICF).
Differences in Variability (CQV) of Alpha Power between the Conditions
Variability (CQV) of the alpha power differed between SP and SICI conditions. Figure 3 shows that the CQV of the alpha power in 10–12 Hz frequency range was significantly higher in SP than in SICI condition (P < 0.05). The difference was most pronounced in the right fronto-central area. There were no differences in CQV of alpha power in 8–10 Hz between any of the conditions.
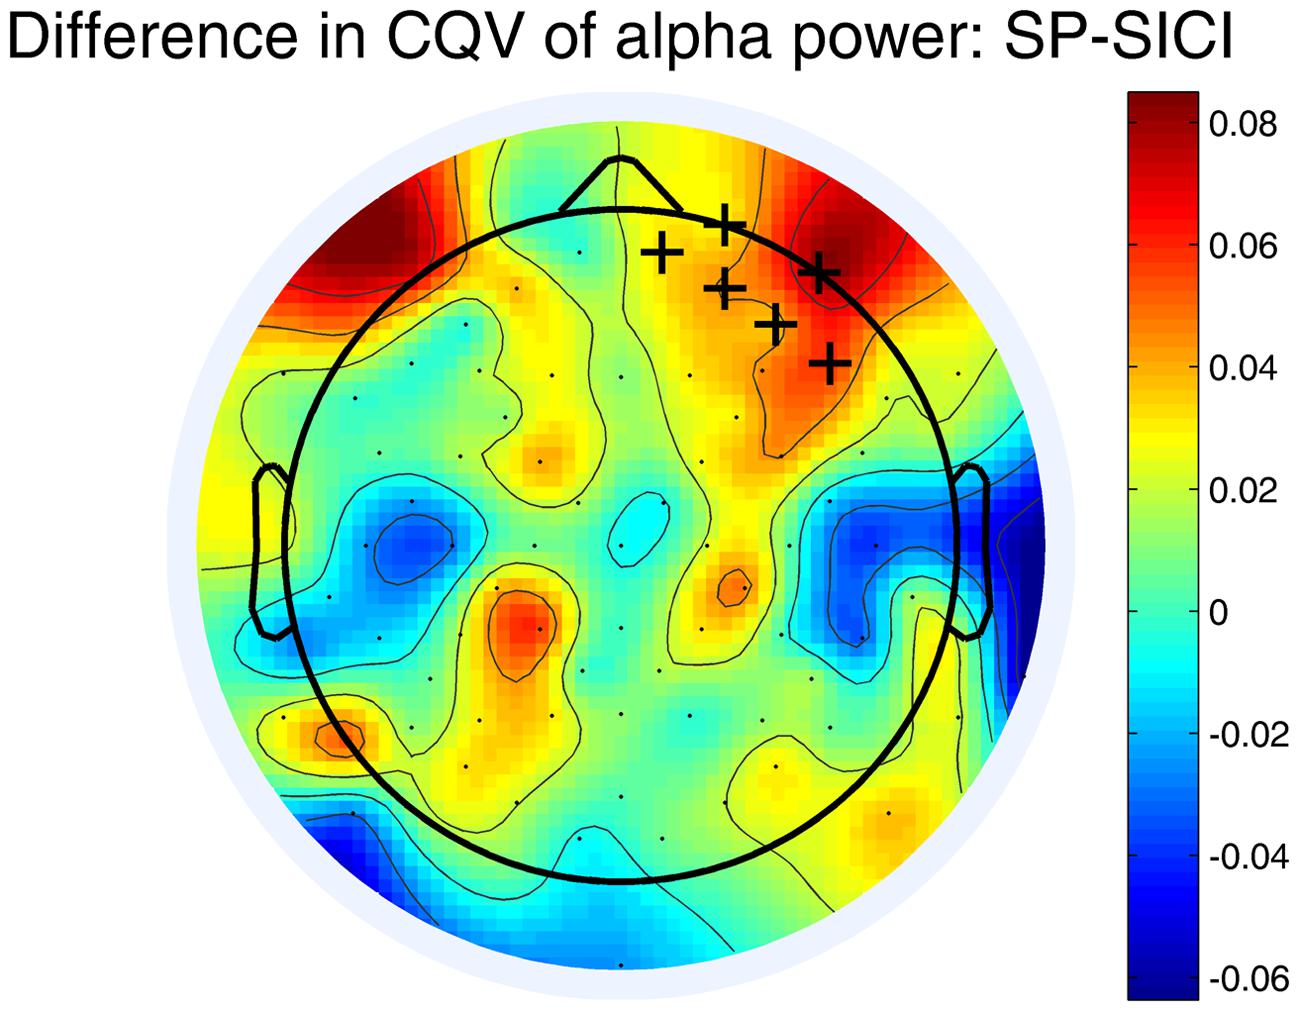
FIGURE 3. Differences in CQV of the alpha-power (10–12 Hz) between SP and SICI conditions. Crosses indicate the channels belonging to a significant cluster (P < 0.05) where CQV of alpha power in SP condition is higher. A color shows the difference between the CQVs (SP-SICI).
Correlation between Pre-stimulus Alpha Oscillations and MEPs
Correlation between Alpha Power and the Amplitude of MEPs within Subjects
In single-trial analysis Spearman correlations between EEG alpha power (8–10, 10–12 Hz) and the amplitude of MEPs did not reveal consistently similar channels with significant correlations across subjects. In Figure 4, a number of subjects with significant correlations is presented for each EEG channel, TMS condition and alpha band. Note that although there are some scattered clusters of electrodes, the number of subjects with significant correlations at each electrode location is not large, i.e., <5 subjects, (<30%). In addition one can see that the correlations with both signs can be present, thus, not demonstrating a consistent tendency between the oscillatory power and the amplitude of MEPs.
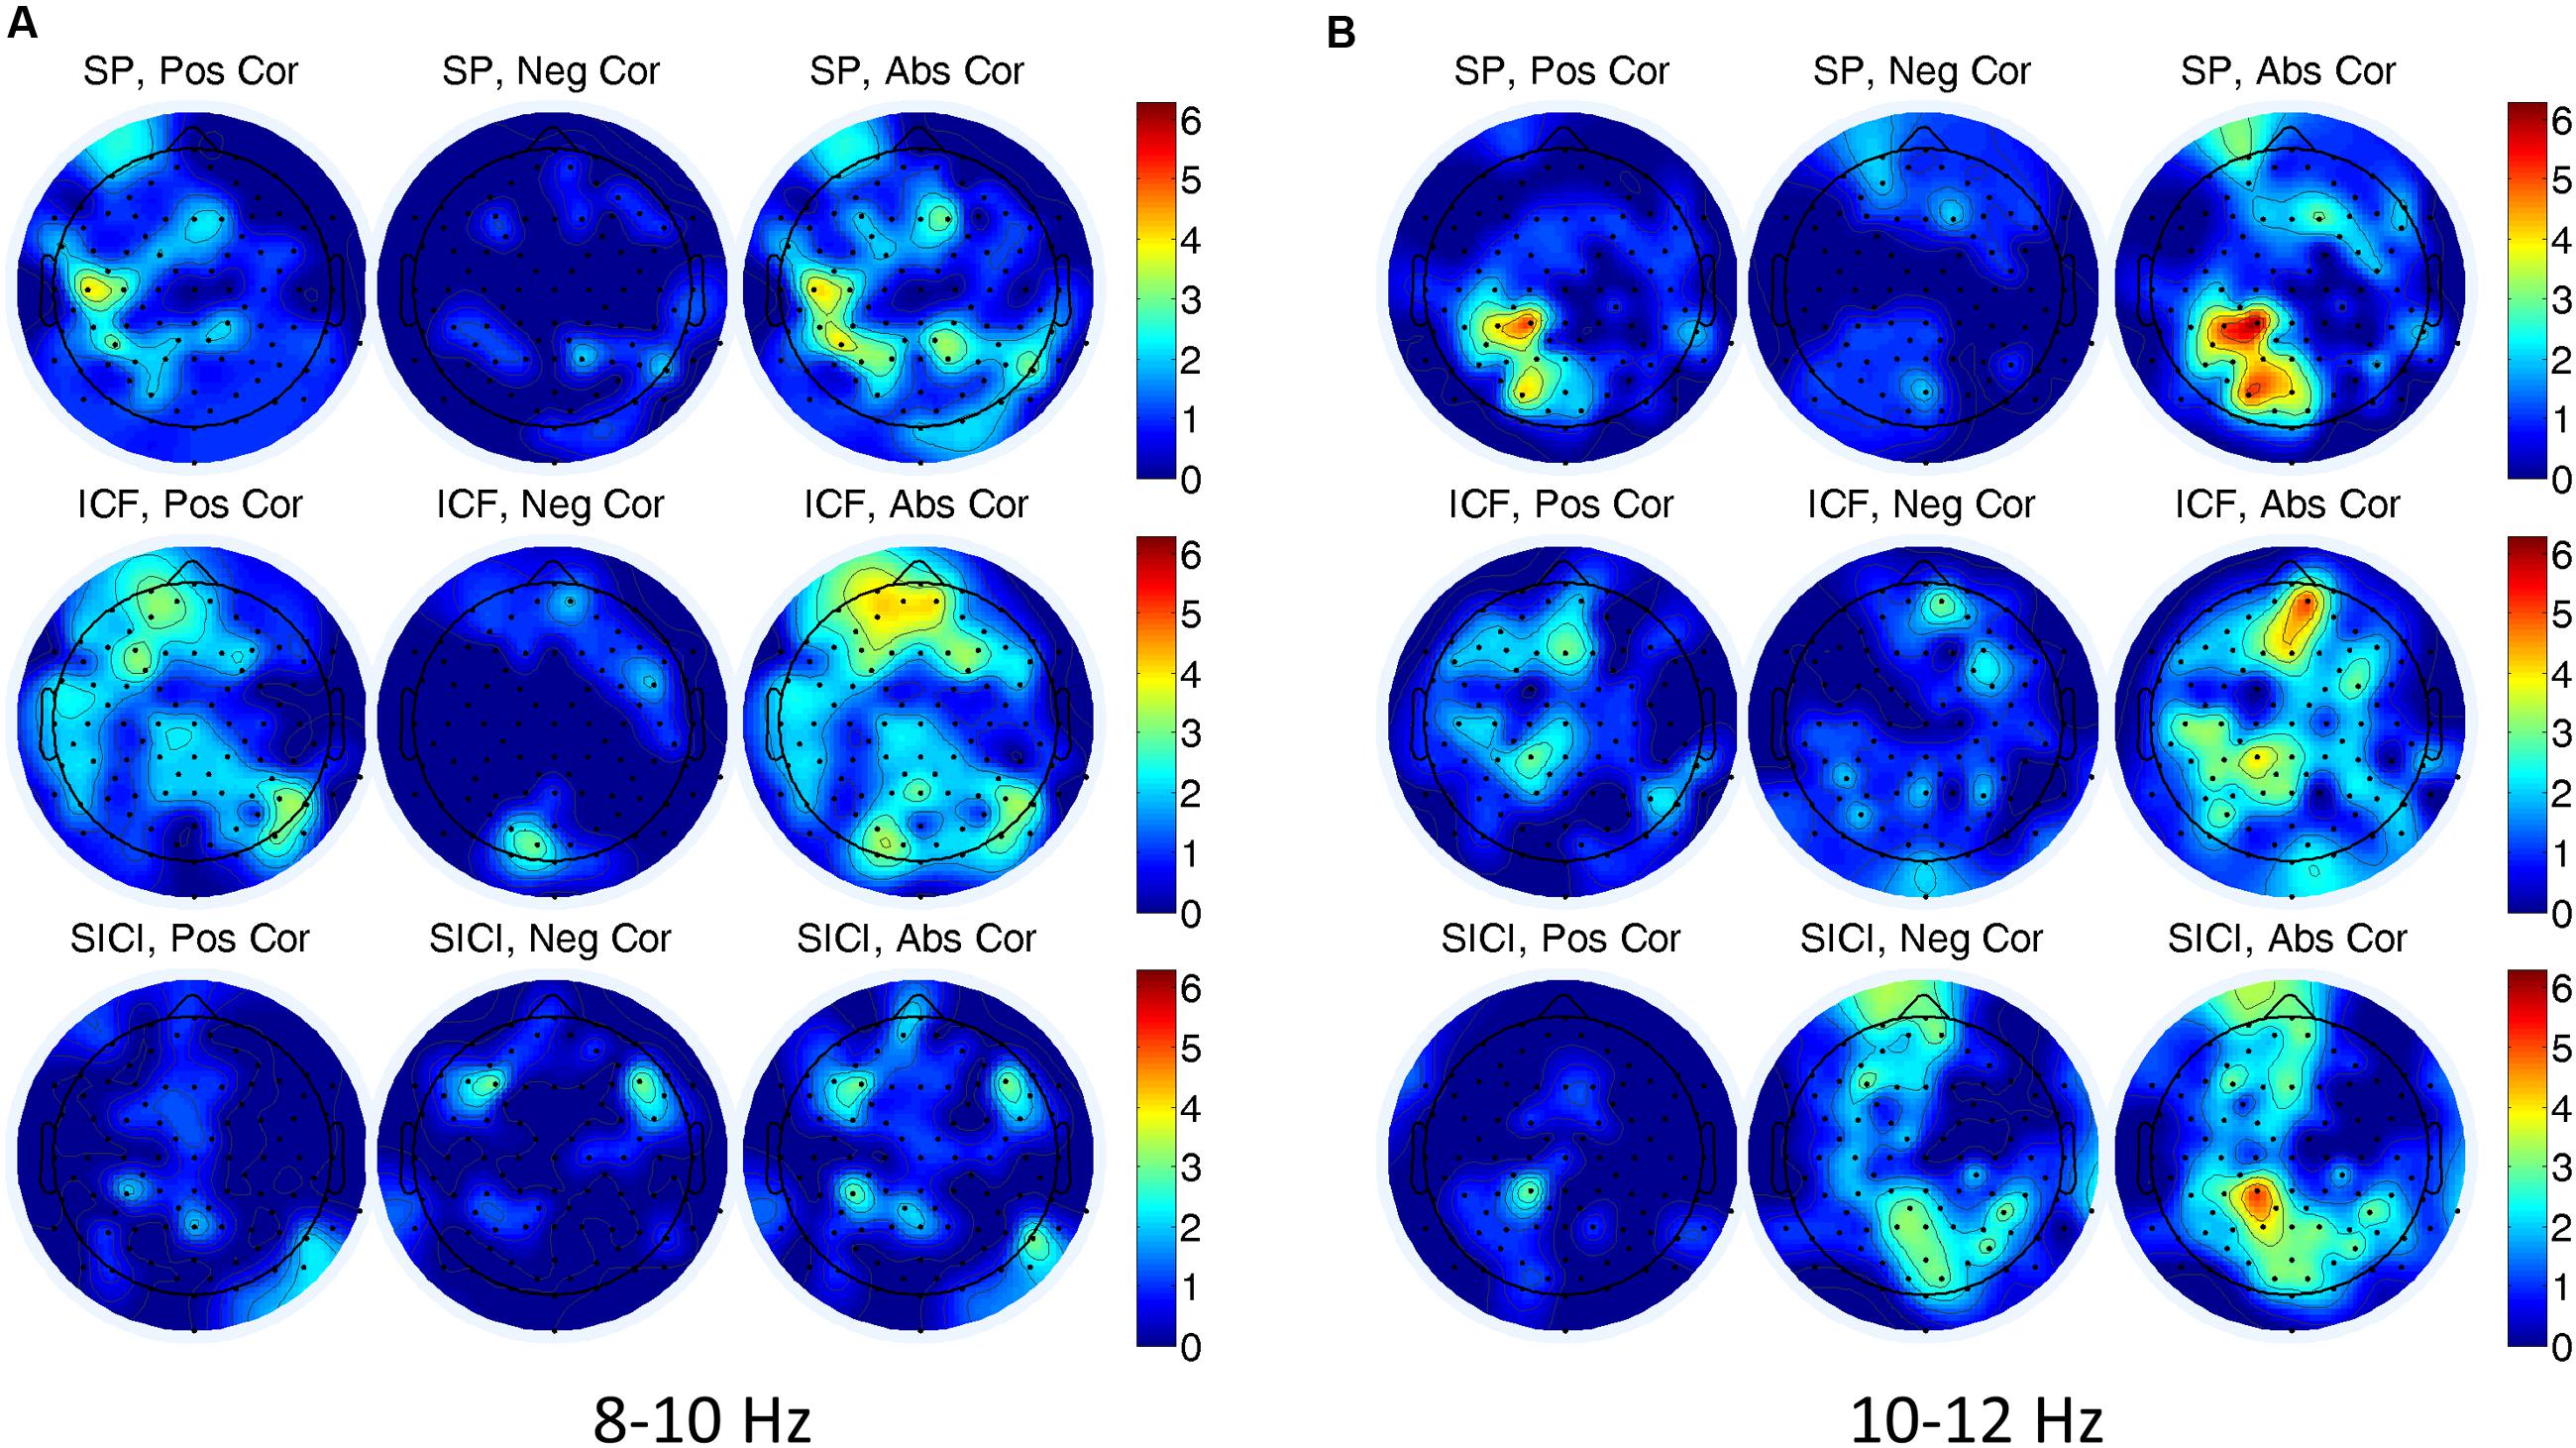
FIGURE 4. Number of subjects having significant (P < 0.05) correlations between electroencephalogram (EEG) alpha power and the amplitude of MEPs for (A) 8–10 Hz, and (B) 10–12 Hz frequency bands in three TMS conditions. In (A,B) left, center, and right correspond to the number of the subjects for positive, negative, and absolute-value correlations, respectively. A color designates the number of subjects showing a significant correlation.
Correlation between Alpha Power and the Amplitude of MEPs across Subjects
We computed a Spearman correlation between oscillatory pre-stimulus power and the amplitude of MEPs across subjects using cluster-based permutation statistics. No correlation of the alpha power (averaged across all trials separately for each subject and condition) with the MEP amplitudes across subjects was detected in any TMS condition (SP, SICI, ICF) or in alpha frequency sub-bands. In addition, no correlation of the alpha power was found with the MEPs variability (i.e., CQV of MEP amplitudes during three TMS conditions).
Correlation between Variability (CQV) of Alpha Power and Variability (CQV) of MEPs across Subjects
Finally we assessed a relationship between the variability at both cortical and peripheral levels using cluster-based permutation statistics. Only for ICF condition we found a significant positive correlation between both CQVs (P < 0.05). This finding indicates that higher variability of high-alpha (10–12 Hz) power was associated with higher variability of MEP amplitudes (Figure 5). As in the case of the other comparisons, there were no significant correlations for low-alpha (8–10 Hz) band in any of the TMS conditions.
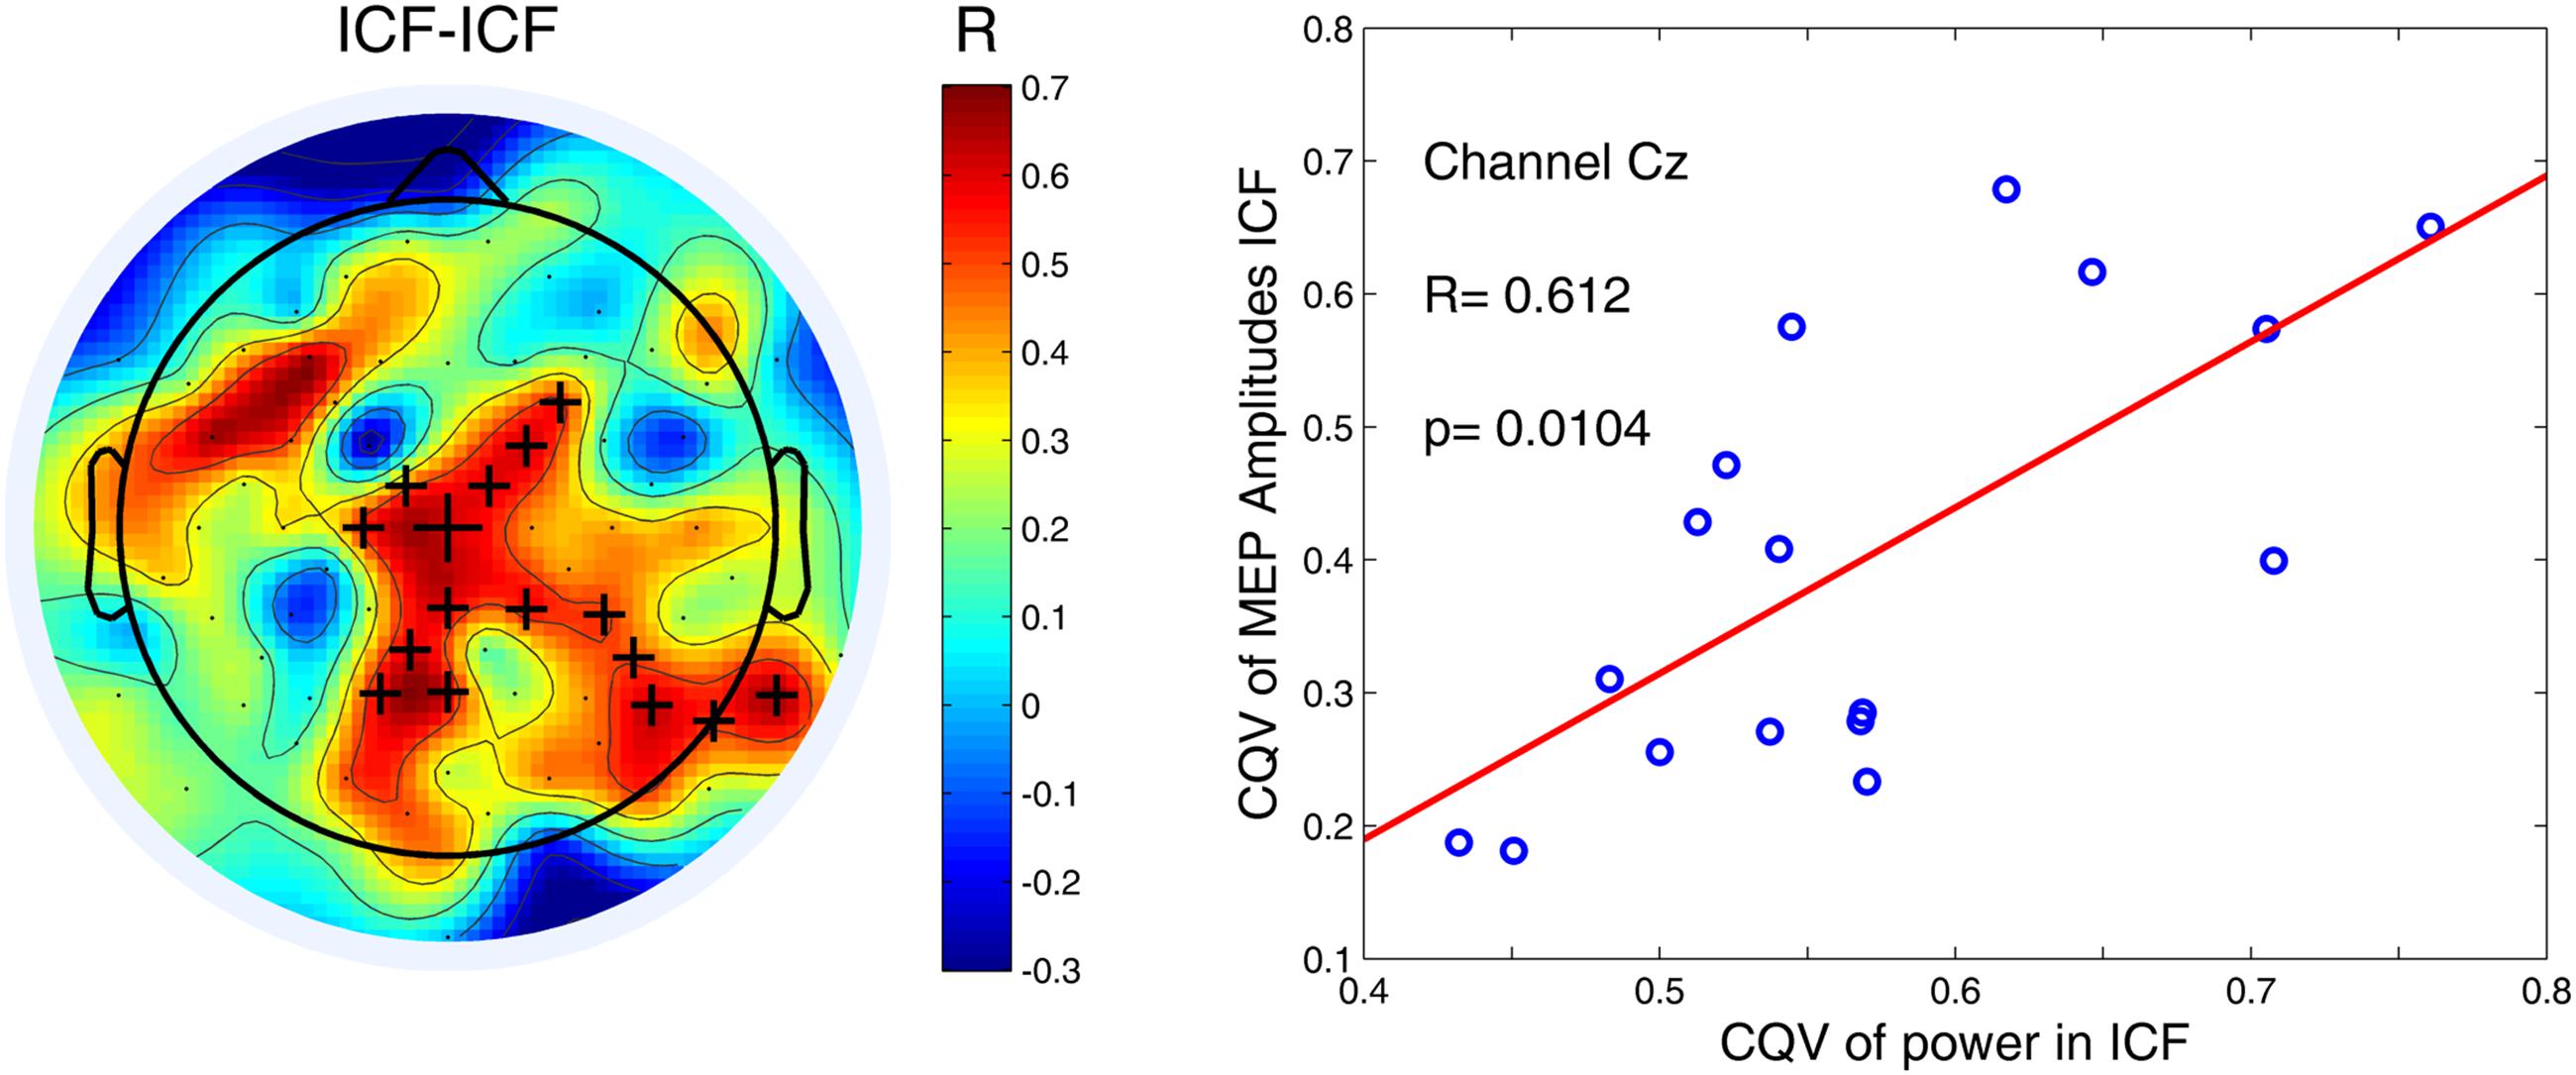
FIGURE 5. Variability of high-alpha (10–12 Hz) power in the 1000-ms time window for ICF condition was positively correlated with variability of MEP amplitudes. Black crosses indicate channels that belong to a significant cluster (P < 0.05). An exemplary scatter plot is given for one of the channels (denoted by the largest cross) from a significant cluster.
Although our main intention for the study was to investigate the relevance of the alpha oscillations for cortical excitability, we also calculated correlations between power of delta (1–3 Hz) and theta (4–7 Hz) oscillations and parameters of MEPs. There were no significant correlations across subjects between power in these bands and MEPs amplitudes or between oscillatory-power CQV and MEP CQV.
Discussion
There were four main findings of this study. Firstly, we showed that trial-to-trial variability of the MEP amplitudes differed significantly among three TMS conditions. Secondly, we also found a significant difference of trial-to-trial variability of the high-alpha (10–12 Hz) power in the 1000-ms pre-stimulus EEG for SP-SICI comparison (SP > SICI). At the same time, for alpha power no difference among TMS conditions was observed. Thirdly, neither single trial analysis, nor across-subjects approach revealed any significant correlation between pre-stimulus alpha-power and MEP amplitudes. Finally, in the ICF condition larger variability of the high-alpha power in the pre-stimulus EEG was positively correlated with higher variability of MEP amplitudes.
Below we discuss possible explanations of these findings and their significance for the understanding of the within- and across-subject variability of the motor responses in TMS studies.
The Strength of SICI and ICF across Subjects
Both SICI and ICF were pronounced across subjects but also demonstrated considerable variability, which agrees with previous studies in healthy volunteers (Chen, 2004; Arias et al., 2014; Premoli et al., 2014). Importantly, we found a significant difference in the variability of MEP responses among TMS sessions in the following order: SICI > SP > ICF. A plausible explanation for such difference might be due to the decrease of MEP-amplitude variability with the increase of the MEP amplitude, as previously was shown for spTMS paradigm utilizing different stimulation intensity (Klein-Flügge et al., 2013).
Trial-to-Trial Variability of Alpha-Power in the Pre-stimulus EEG between TMS Sessions
We have not observed significant differences in the pre-stimulus alpha power across conditions, indicating that there were no changes in the overall generation of alpha oscillations often observed for different experimental conditions including attention (Hanslmayr et al., 2011; Klimesch, 2012; Samaha et al., 2016), sensorimotor performance (Pfurtscheller et al., 1997; Ritter et al., 2009; Babiloni et al., 2014) or differences between normal subjects and patients (Zoon et al., 2013; Schlee et al., 2014). However, we found significant differences between TMS conditions in the pre-stimulus alpha power variability, which was larger in SP compared to SICI condition in the right fronto-central region. The fronto-central alpha was reported to be involved both in emotional (Segrave et al., 2011; Cantisani et al., 2015; Brzezicka et al., 2016) and sensorimotor processes (Chung et al., 2012), which might in our case reflect an induced modulation of the motor system at the high levels by TMS depending on the stimulation condition. Such off-line effects of the prolonged TMS sessions with non-regular inter-stimulus intervals were already reported in several recent studies (Julkunen et al., 2012; Pellicciari et al., 2015; Fedele et al., 2016). Interestingly, the difference of the pre-stimulus EEG alpha power variability was opposite to the direction of the MEP variability, indicating that at least across conditions large variability of the peripheral measures should not necessarily mirror neuronal variability at the cortical level. A possible explanation of the less variable pre-stimulus alpha power during SICI comparing to spTMS condition might be a stabilizing effect of SICI condition activating GABA(A) interneurons (Russmann et al., 2009; Ziemann et al., 2015) circuit, however, such hypothesis is lacking a proof yet. In general, a variability of the brain signals is thought to provide additional information on cortical dynamics when comparing healthy subjects and patients (Nenadovic et al., 2008; Schlee et al., 2014) and for predicting behavioral outcome both at motor (Garrett et al., 2013a,b; Smit et al., 2013) and sensory levels (Misic et al., 2010; Garrett et al., 2013b; Palva et al., 2013).
Correlation of the Pre-stimulus Alpha-Power and MEP Amplitudes
One of the goals of the present study was to investigate possible relationships between pre-stimulus power of oscillations and MEP amplitudes during prolonged spTMS and ppTMS sessions. Such dependencies are relevant for the development of brain-state triggered stimulation (Walter et al., 2012; Gharabaghi et al., 2014), which can be a new promising therapeutic methodology (Gharabaghi et al., 2014; Karabanov et al., 2016; Zrenner et al., 2016). In this study, we primarily investigated the hypothesis about the inverse relationship between pre-stimulus alpha-power and MEP amplitude, which was proposed in a few previous publications (Zarkowski et al., 2006; Sauseng et al., 2009), but was not supported in several others (Mäki and Ilmoniemi, 2010; Berger et al., 2014). Such connection is consistent with the research in animals demonstrating a correlation between alpha power and firing rate in sensorimotor regions (Haegens et al., 2011) and studies in visual system in humans reporting inhibitory role of alpha band for visual stimuli detection and phosphene threshold (Romei et al., 2008, 2010). Although in some subjects our single-trial analysis revealed significant correlations between pre-stimulus alpha power and MEPs amplitudes, the location of electrodes and the sign of correlation was not consistent when comparing different subjects. In addition, electrodes with significant correlations did not form extended clusters and were rather isolated, indicating a predominantly stochastic character of these correlations. Across-subjects correlations were not significant either, showing that subject-specific levels of alpha activity could not predict MEP amplitude in any of the studied TMS conditions. Considering that such correlation was previously reported only for a small number of subjects: four (Zarkowski et al., 2006) and six (Sauseng et al., 2009), we might claim that our study on 17 healthy volunteers combined with other studies performed on greater number of subjects (Mäki and Ilmoniemi, 2010; Berger et al., 2014) has rather negative support to the hypothesis about the relationship between the pre-stimulus alpha power and MEP amplitudes in the prolonged non-repetitive TMS sessions.
It is interesting to observe that the variability of MEPs on a single trial level is in contrast to reproducible average MEP responses in ppTMS paradigms (Orth et al., 2003; Fleming et al., 2012; Hermsen et al., 2016) and to TMS-evoked EEG responses (Lioumis et al., 2009). Averaging of the single responses (MEPs or TMS-evoked responses) acts as a low-pass filter thus removing neuronal variability on the scale of seconds. Consequently, the average responses reflect rather subjects specific synaptic configuration of the stimulated neuronal networks demonstrating response reproducibility when measurements are performed over the duration of the experiment.
Variability of Alpha Power Correlates with Variability of MEP Amplitudes in ICF Condition
One of the most remarkable findings of the study is a relationship between two levels of trial-to-trial variability in ICF condition: variability of the high-alpha power over central and right parieto-occipital areas correlated positively with MEP amplitudes variability. Firstly, such a link between central and peripheral levels of the variability corresponds to the previous research connecting brain signal variability with the behavioral variability of both afferent (Boly et al., 2007; Sadaghiani et al., 2009; Palva et al., 2013) and efferent (Smit et al., 2013) processes. Secondly, this finding may be considered as another support for a recently proposed hypothesis that trial-to-trial variability of MEP amplitudes may be by itself an informative measurement of the neuronal state (Conforto et al., 2012). Such hypothesis is in agreement with a well-known role of the variability in the biological systems from the widely used heart rate variability (Chouchou and Desseilles, 2014; França da Silva et al., 2016) to the firing rate variability serving an important role in action preparation (Churchland et al., 2010; Klein-Flügge et al., 2013). A presence of the correlation between central and peripheral variabilities only for ICF condition could be explained by the fact that ICF phenomenon is likely to be based on multiple synaptic connections (Di Lazzaro and Ziemann, 2013; Ziemann et al., 2015). Therefore, it is more spatially distributed in the brain compared to a more local SICI phenomenon (Di Lazzaro et al., 2006). Alpha oscillations, recorded with EEG, also have rather wide spatial distribution and, thus, are more likely to relate to similarly broad ICF neuronal networks than to more spatially specific SICI networks. This observation would also fit recent results, where it was possible to predict ICF but not SP or SICI strength with the EEG neuronal dynamics recorded during rest (Fedele et al., 2016). Moreover, there were no correlations of MEP CQVs in ICF and SP or SICI conditions across subjects which might further support the specificity of a link between cortical and peripheral variability in ICF but not in other conditions.
Interestingly, all our significant results were found for the upper alpha (10–12 Hz) frequency band. In general this agrees with the findings indicating that low (8–10 Hz) and high-alpha (10–12 Hz) sub-bands may be associated with different neuronal processes (Klimesch, 1999; Moore et al., 2008). Thus, low-alpha sub-band may mostly relate to general tonic alertness, while task-specific sensorimotor processes are more associated with high-alpha sub-band (Babiloni et al., 2014).
While we did not find a considerable evidence for the previously reported link between the pre-stimulus EEG alpha power and MEP amplitudes either within-or across-subjects, we were able to demonstrate an importance of a pre-stimulus alpha-power variability for ppTMS phenomena, thus, providing a further support for the hypothesis that ongoing neuronal variability may modulate cortical motor output.
Limitations of the Study
For both studied ppTMS phenomena only one ISI (2 ms for SICI and 12 for ICF) among several commonly used (Bütefisch et al., 2008; Stagg et al., 2011; Lioumis et al., 2012) was chosen. Importantly, we observed robust ICF and SICI in our subjects, thus making their values suitable for the correlations with the cortical oscillations. Investigation of alternative ISI could be a topic of other studies since each ISI requires a separate EEG experiment due to a large number of the required epochs.
Because of the residual scalp EMG in some of our subjects, we were not able to investigate beta oscillations which are known to be relevant for motor processing. However, our results on alpha rhythm already provide a novel link between the variability in the cortical oscillations and motor responses as tested with ppTMS.
At this stage of the study we did not investigate TMS-EEG responses. Firstly, it was due to our original intention to investigate a relationship between ongoing neuronal oscillations and cortical excitability as probed with MEPs in ppTMS phenomena. Secondly, since our amplifiers did not have a technical possibility to be gated during the TMS pulse, we observed considerable artifacts in the post-stimulus interval thus preventing us from analyzing TMS-evoked responses.
Author Contributions
ZI processed and analyzed the data, and wrote the manuscript. MN designed the study, collected the data and wrote the manuscript. ZI and MN contributed equally to the study. TF wrote codes for the pre-processing and analysis of the data. EB designed the study and collected the data. VN designed and supervised the study, wrote the manuscript.
Funding
The study has been funded by the Russian Academic Excellence Project ‘5-100’.
Conflict of Interest Statement
The authors declare that the research was conducted in the absence of any commercial or financial relationships that could be construed as a potential conflict of interest.
The reviewer PL declared a past collaboration with one of the authors (MN) to the handling Editor, who ensured that the process met the standards of a fair and objective review.
References
Arias, P., Robles-García, V., Corral-Bergantiños, Y., Espinosa, N., Mordillo-Mateos, L., Grieve, K., et al. (2014). Balancing the excitability of M1 circuitry during movement observation without overt replication. Front. Behav. Neurosci. 8:316. doi: 10.3389/fnbeh.2014.00316
Babiloni, C., Del Percio, C., Arendt-Nielsen, L., Soricelli, A., Romani, G. L., Rossini, P. M., et al. (2014). Cortical EEG alpha rhythms reflect task-specific somatosensory and motor interactions in humans. Clin. Neurophysiol. 125, 1936–1945. doi: 10.1016/j.clinph.2014.04.021
Beck, S., Shamim, E. A., Pirio, R. S., Schubert, M., and Hallett, M. (2009). Inter-hemispheric inhibition is impaired in mirror dystonia. Eur. J. Neurosci. 29, 1634–1640. doi: 10.1111/j.1460-9568.2009.06710.x
Berger, B., Minarik, T., Liuzzi, G., Hummel, F. C., and Sauseng, P. (2014). EEG oscillatory phase-dependent markers of corticospinal excitability in the resting brain. Biomed. Res. Int. 2014, 936096. doi: 10.1155/2014/936096
Boly, M., Balteau, E., Schnakers, C., Degueldre, C., Moonen, G., Luxen, A., et al. (2007). Baseline brain activity fluctuations predict somatosensory perception in humans. Proc. Natl. Acad. Sci. U.S.A. 104, 12187–12192. doi: 10.1073/pnas.0611404104
Bonett, D. G. (2006). Confidence interval for a coefficient of quartile variation. Comput. Stat. Data Anal. 50, 2953–2957. doi: 10.1016/j.csda.2005.05.007
Bosl, W., Tierney, A., Tager-Flusberg, H., and Nelson, C. (2011). EEG complexity as a biomarker for autism spectrum disorder risk. BMC Med. 9:18. doi: 10.1186/1741-7015-9-18
Brzezicka, A., Kamiński, J., Kamińska, O. K., Wołyńczyk-Gmaj, D., and Sedek, G. (2016). Frontal EEG alpha band asymmetry as a predictor of reasoning deficiency in depressed people. Cogn. Emot. doi: 10.1080/02699931.2016.1170669 [Epub ahead of print].
Bütefisch, C. M., Boroojerdi, B., Chen, R., Battaglia, F., and Hallett, M. (2005). Task-dependent intracortical inhibition is impaired in focal hand dystonia. Mov. Disord. 20, 545–551. doi: 10.1002/mds.20367
Bütefisch, C. M., Weβling, M., Netz, J., Seitz, R. J., and Hömberg, V. (2008). Relationship between interhemispheric inhibition and motor cortex excitability in subacute stroke patients. Neurorehabil. Neural Repair 22, 4–21. doi: 10.1177/1545968307301769
Cantisani, A., Koenig, T., Horn, H., Müller, T., Strik, W., Walther, S., et al. (2015). Psychomotor retardation is linked to frontal alpha asymmetry in major depression. J. Affect. Disord. 188, 167–172. doi: 10.1016/j.jad.2015.08.018
Casarotto, S., Romero Lauro, L. J., Bellina, V., Casali, A. G., Rosanova, M., Pigorini, A., et al. (2010). EEG responses to TMS are sensitive to changes in the perturbation parameters and repeatable over time. PLoS ONE 5:e10281. doi: 10.1371/journal.pone.0010281
Chen, R. (2004). Interactions between inhibitory and excitatory circuits in the human motor cortex. Exp. Brain Res 154, 1–10. doi: 10.1007/s00221-003-1684-1
Chen, R., Tam, A., Bütefisch, C., Corwell, B., Ziemann, U., Rothwell, J. C., et al. (1998). Intracortical inhibition and facilitation in different representations of the human motor cortex. J. Neurophysiol. 80, 2870–2881.
Chouchou, F., and Desseilles, M. (2014). Heart rate variability: a tool to explore the sleeping brain? Front. Neurosci. 8:402. doi: 10.3389/fnins.2014.00402
Chung, Y. G., Kang, J. H., and Kim, S. P. (2012). Correlation of fronto-central phase coupling with sensorimotor rhythm modulation. Neural Netw. 36, 46–50. doi: 10.1016/j.neunet.2012.08.006
Churchland, M. M., Yu, B. M., Cunningham, J. P., Sugrue, L. P., Cohen, M. R., Corrado, G. S., et al. (2010). Stimulus onset quenches neural variability: a widespread cortical phenomenon. Nat. Neurosci. 13, 369–378. doi: 10.1038/nn.2501
Conforto, A. B., Moraes, M. S., Amaro, E., Young, W. B., Lois, L. A., Gonçalves, A. L., et al. (2012). Increased variability of motor cortical excitability to transcranial magnetic stimulation in migraine: a new clue to an old enigma. J. Headache Pain 13, 29–37. doi: 10.1007/s10194-011-0379-4
Di Lazzaro, V., Pilato, F., Oliviero, A., Dileone, M., Saturno, E., Mazzone, P., et al. (2006). Origin of facilitation of motor-evoked potentials after paired magnetic stimulation: direct recording of epidural activity in conscious humans. J. Neurophysiol. 96, 1765–1771. doi: 10.1152/jn.00360.2006
Di Lazzaro, V., and Ziemann, U. (2013). The contribution of transcranial magnetic stimulation in the functional evaluation of microcircuits in human motor cortex. Front. Neural Circuits 7:18. doi: 10.3389/fncir.2013.00018
Dugué, L., Marque, P., and VanRullen, R. (2011). The phase of ongoing oscillations mediates the causal relation between brain excitation and visual perception. J. Neurosci. 31, 11889–11893. doi: 10.1523/JNEUROSCI.1161-11.2011
Ellaway, P. H., Davey, N. J., Maskill, D. W., Rawlinson, S. R., Lewis, H. S., and Anissimova, N. P. (1998). Variability in the amplitude of skeletal muscle responses to magnetic stimulation of the motor cortex in man. Electroencephalogr. Clin. Neurophysiol. 109, 104–113. doi: 10.1016/S0924-980X(98)00007-1
Fedele, T., Blagovechtchenski, E., Nazarova, M., Iscan, Z., Moiseeva, V., and Nikulin, V. V. (2016). Long-range temporal correlations in the amplitude of alpha oscillations predict and reflect strength of intracortical facilitation: combined TMS and EEG study. Neuroscience 331, 109–119. doi: 10.1016/j.neuroscience.2016.06.015
Ferreri, F., Pasqualetti, P., Määttä, S., Ponzo, D., Ferrarelli, F., Tononi, G., et al. (2011). Human brain connectivity during single and paired pulse transcranial magnetic stimulation. Neuroimage 54, 90–102. doi: 10.1016/j.neuroimage.2010.07.056
Fleming, M. K., Sorinola, I. O., Newham, D. J., Roberts-Lewis, S. F., and Bergmann, J. H. M. (2012). The effect of coil type and navigation on the reliability of transcranial magnetic stimulation. IEEE Trans. Neural Syst. Rehabil. Eng. 20, 617–625. doi: 10.1109/TNSRE.2012.2202692
França da Silva, A. K., Penachini da Costa de Rezende Barbosa, M., Marques Vanderlei, F., Destro Christofaro, D. G., and Marques Vanderlei, L. C. (2016). Application of heart rate variability in diagnosis and prognosis of individuals with diabetes mellitus: systematic review. Ann. Noninvasive Electrocardiol. 21, 223–235. doi: 10.1111/anec.12372
Frenkel-Toledo, S., Bentin, S., Perry, A., Liebermann, D. G., and Soroker, N. (2013). Dynamics of the EEG power in the frequency and spatial domains during observation and execution of manual movements. Brain Res. 1509, 43–57. doi: 10.1016/j.brainres.2013.03.004
Garrett, D. D., Kovacevic, N., McIntosh, A. R., and Grady, C. L. (2013a). The modulation of BOLD variability between cognitive states varies by age and processing speed. Cereb. Cortex 23, 684–693. doi: 10.1093/cercor/bhs055
Garrett, D. D., Samanez-Larkin, G. R., MacDonald, S. W. S., Lindenberger, U., McIntosh, A. R., and Grady, C. L. (2013b). Moment-to-moment brain signal variability: a next frontier in human brain mapping? Neurosci. Biobehav. Rev. 37, 610–624. doi: 10.1016/j.neubiorev.2013.02.015
Gharabaghi, A., Kraus, D., Leão, M. T., Spüler, M., Walter, A., Bogdan, M., et al. (2014). Coupling brain-machine interfaces with cortical stimulation for brain-state dependent stimulation: enhancing motor cortex excitability for neurorehabilitation. Front. Hum. Neurosci. 8:122. doi: 10.3389/fnhum.2014.00122
Giambattistelli, F., Tomasevic, L., Pellegrino, G., Porcaro, C., Melgari, J. M., Rossini, P. M., et al. (2014). The spontaneous fluctuation of the excitability of a single node modulates the internodes connectivity: a TMS-EEG study. Hum. Brain Mapp. 35, 1740–1749. doi: 10.1002/hbm.22288
Goldsworthy, M. R., Hordacre, B., and Ridding, M. C. (2016). Minimum number of trials required for within- and between-session reliability of TMS measures of corticospinal excitability. Neuroscience 320, 205–209. doi: 10.1016/j.neuroscience.2016.02.012
Haegens, S., Nácher, V., Luna, R., Romo, R., and Jensen, O. (2011). α-Oscillations in the monkey sensorimotor network influence discrimination performance by rhythmical inhibition of neuronal spiking. Proc. Natl. Acad. Sci. U.S.A. 108, 19377–19382. doi: 10.1073/pnas.1117190108
Hanslmayr, S., Gross, J., Klimesch, W., and Shapiro, K. L. (2011). The role of alpha oscillations in temporal attention. Brain Res. Rev. 67, 331–343. doi: 10.1016/j.brainresrev.2011.04.002
Hebb, M. O., McArthur, D. L., Alger, J., Etchepare, M., Glenn, T. C., Bergsneider, M., et al. (2007). Impaired percent alpha variability on continuous electroencephalography is associated with thalamic injury and predicts poor long-term outcome after human traumatic brain injury. J. Neurotrauma 24, 579–590. doi: 10.1089/neu.2006.0146
Hermsen, A. M., Haag, A., Duddek, C., Balkenhol, K., Bugiel, H., Bauer, S., et al. (2016). Test-retest reliability of single and paired pulse transcranial magnetic stimulation parameters in healthy subjects. J. Neurol. Sci. 362, 209–216. doi: 10.1016/j.jns.2016.01.039
Hohlefeld, F. U., Huebl, J., Huchzermeyer, C., Schneider, G.-H., Schönecker, T., Kühn, A. A., et al. (2012). Long-range temporal correlations in the subthalamic nucleus of patients with Parkinson’s disease. Eur. J. Neurosci. 36, 2812–2821. doi: 10.1111/j.1460-9568.2012.08198.x
Hyvärinen, A. (1999). Fast and robust fixed-point algorithms for independent component analysis. IEEE Trans. Neural Netw. 10, 626–634. doi: 10.1109/72.761722
Julkunen, P., Säisänen, L., Hukkanen, T., Danner, N., and Könönen, M. (2012). Does second-scale intertrial interval affect motor evoked potentials induced by single-pulse transcranial magnetic stimulation? Brain Stimul. 5, 526–532. doi: 10.1016/j.brs.2011.07.006
Jung, N. H., Delvendahl, I., Kuhnke, N. G., Hauschke, D., Stolle, S., and Mall, V. (2010). Navigated transcranial magnetic stimulation does not decrease the variability of motor-evoked potentials. Brain Stimul. 3, 87–94. doi: 10.1016/j.brs.2009.10.003
Karabanov, A., Thielscher, A., and Siebner, H. R. (2016). Transcranial brain stimulation: closing the loop between brain and stimulation. Curr. Opin. Neurol. 29, 397–404. doi: 10.1097/WCO.0000000000000342
Keil, J., Timm, J., Sanmiguel, I., Schulz, H., Obleser, J., and Schönwiesner, M. (2014). Cortical brain states and corticospinal synchronization influence TMS-evoked motor potentials. J. Neurophysiol. 111, 513–519. doi: 10.1152/jn.00387.2013
Klein-Flügge, M. C., Nobbs, D., Pitcher, J. B., and Bestmann, S. (2013). Variability of human corticospinal excitability tracks the state of action preparation. J. Neurosci. 33, 5564–5572. doi: 10.1523/JNEUROSCI.2448-12.2013
Klimesch, W. (1999). EEG alpha and theta oscillations reflect cognitive and memory performance: a review and analysis. Brain Res. Rev. 29, 169–195. doi: 10.1016/S0165-0173(98)00056-3
Klimesch, W. (2012). Alpha-band oscillations, attention, and controlled access to stored information. Trends Cogn. Sci. 16, 606–617. doi: 10.1016/j.tics.2012.10.007
Klimesch, W., Russegger, H., Doppelmayr, M., and Pachinger, T. (1998). A method for the calculation of induced band power: implications for the significance of brain oscillations. Electroencephalogr. Clin. Neurophysiol. Potentials Sect. 108, 123–130. doi: 10.1016/S0168-5597(97)00078-6
Kujirai, T., Caramia, M. D., Rothwell, J. C., Day, B. L., Thompson, P. D., Ferbert, A., et al. (1993). Corticocortical inhibition in human motor cortex. J. Physiol. 471, 501–519. doi: 10.1113/jphysiol.1993.sp019912
Kundu, B., Johnson, J. S., and Postle, B. R. (2014). Prestimulation phase predicts the TMS-evoked response. J. Neurophysiol. 112, 1885–1893. doi: 10.1152/jn.00390.2013
Larsson, P. G., Kostov, H., Andersen, P., Andersson, S. A., Basar, E., Gonder, A., et al. (2005). Lower frequency variability in the alpha activity in EEG among patients with epilepsy. Clin. Neurophysiol. 116, 2701–2706. doi: 10.1016/j.clinph.2005.07.019
Linkenkaer-Hansen, K., Smit, D. J. A., Barkil, A., van Beijsterveldt, T. E. M., Brussaard, A. B., Boomsma, D. I., et al. (2007). Genetic contributions to long-range temporal correlations in ongoing oscillations. J. Neurosci. 27, 13882–13889. doi: 10.1523/JNEUROSCI.3083-07.2007
Lioumis, P., Kicic, D., Savolainen, P., Makela, J. P., and Kahkonen, S. (2009). Reproducibility of TMS-Evoked EEG responses. Hum. Brain Mapp. 30, 1387–1396. doi: 10.1002/hbm.20608
Lioumis, P., Mustanoja, S., Bikmullina, R., Vitikainen, A.-M., Kičić, D., Salonen, O., et al. (2012). Probing modifications of cortical excitability during stroke recovery with navigated transcranial magnetic stimulation. Top. Stroke Rehabil. 19, 182–192. doi: 10.1310/tsr1902-182
Mäki, H., and Ilmoniemi, R. J. (2010). EEG oscillations and magnetically evoked motor potentials reflect motor system excitability in overlapping neuronal populations. Clin. Neurophysiol. 121, 492–501. doi: 10.1016/j.clinph.2009.11.078
Maris, E., and Oostenveld, R. (2007). Nonparametric statistical testing of EEG-and MEG-data. J. Neurosci. Methods 164, 177–190. doi: 10.1016/j.jneumeth.2007.03.024
Misic, B., Mills, T., Taylor, M. J., and McIntosh, A. R. (2010). Brain noise is task dependent and region specific. J. Neurophysiol. 104, 2667–2676. doi: 10.1152/jn.00648.2010
Mitchell, W. K., Baker, M. R., and Baker, S. N. (2007). Muscle responses to transcranial stimulation in man depend on background oscillatory activity. J. Physiol. 583, 567–579. doi: 10.1113/jphysiol.2007.134031
Mizuno, T., Takahashi, T., Cho, R. Y., Kikuchi, M., Murata, T., Takahashi, K., et al. (2010). Assessment of EEG dynamical complexity in Alzheimer’s disease using multiscale entropy. Clin. Neurophysiol. 121, 1438–1446. doi: 10.1016/j.clinph.2010.03.025
Moore, R. A., Gale, A., Morris, P. H., and Forrester, D. (2008). Alpha power and coherence primarily reflect neural activity related to stages of motor response during a continuous monitoring task. Int. J. Psychophysiol. 69, 79–89. doi: 10.1016/j.ijpsycho.2008.03.003
Nakamura, H., Kitagawa, H., Kawaguchi, Y., and Tsuji, H. (1997). Intracortical facilitation and inhibition after transcranial magnetic stimulation in conscious humans. J. Physiol. 498, 817–823. doi: 10.1113/jphysiol.1997.sp021905
Nenadovic, V., Hutchison, J. S., Dominguez, L. G., Otsubo, H., Gray, M. P., Sharma, R., et al. (2008). Fluctuations in cortical synchronization in pediatric traumatic brain injury. J. Neurotrauma 25, 615–627. doi: 10.1089/neu.2007.0474
Neuper, C., Würtz, M., and Pfurtscheller, G. (2006). Chapter 14 ERD/ERS patterns reflecting sensorimotor activation and deactivation. Prog. Brain Res. 159, 211–222. doi: 10.1016/S0079-6123(06)59014-4
Oh, B.-M., Kim, D.-Y., and Paik, N.-J. (2010). Disinhibition in the unaffected hemisphere is related with the cortical involvement of the affected hemisphere. Int. J. Neurosci. 120, 512–515. doi: 10.3109/00207451003760114
Orth, M., Snijders, A. H., and Rothwell, J. C. (2003). The variability of intracortical inhibition and facilitation. Clin. Neurophysiol. 114, 2362–2369. doi: 10.1016/S1388-2457(03)00243-8
Palva, J. M., Zhigalov, A., Hirvonen, J., Korhonen, O., Linkenkaer-Hansen, K., and Palva, S. (2013). Neuronal long-range temporal correlations and avalanche dynamics are correlated with behavioral scaling laws. Proc. Natl. Acad. Sci. U.S.A. 110, 3585–3590. doi: 10.1073/pnas.1216855110
Pellicciari, M. C., Miniussi, C., Ferrari, C., Koch, G., and Bortoletto, M. (2015). Ongoing cumulative effects of single TMS pulses on corticospinal excitability: an intra- and inter-block investigation. Clin. Neurophysiol. 127, 621–628. doi: 10.1016/j.clinph.2015.03.002
Pfurtscheller, G., Neuper, C., and Krausz, G. (2000). Functional dissociation of lower and upper frequency mu rhythms in relation to voluntary limb movement. Clin. Neurophysiol. 111, 1873–1879. doi: 10.1016/S1388-2457(00)00428-4
Pfurtscheller, G. U., Neuper, C., Andrew, C., and Edlinger, G. (1997). Foot and hand area mu rhythms. Int. J. Psychophysiol. 26, 121–135. doi: 10.1016/S0167-8760(97)00760-5
Poil, S.-S., Hardstone, R., Mansvelder, H. D., and Linkenkaer-Hansen, K. (2012). Critical-state dynamics of avalanches and oscillations jointly emerge from balanced excitation/inhibition in neuronal networks. J. Neurosci. 32, 9817–9823. doi: 10.1523/JNEUROSCI.5990-11.2012
Premoli, I., Castellanos, N., Rivolta, D., Belardinelli, P., Bajo, R., Zipser, C., et al. (2014). TMS-EEG signatures of GABAergic neurotransmission in the human cortex. J. Neurosci. 34, 5603–5612. doi: 10.1523/JNEUROSCI.5089-13.2014
Ritter, P., Moosmann, M., and Villringer, A. (2009). Rolandic alpha and beta EEG rhythms’ strengths are inversely related to fMRI-BOLD signal in primary somatosensory and motor cortex. Hum. Brain Mapp. 30, 1168–1187. doi: 10.1002/hbm.20585
Romei, V., Brodbeck, V., Michel, C., Amedi, A., Pascual-Leone, A., and Thut, G. (2008). Spontaneous fluctuations in posterior alpha-band EEG activity reflect variability in excitability of human visual areas. Cereb. Cortex 18, 2010–2018. doi: 10.1093/cercor/bhm229
Romei, V., Gross, J., and Thut, G. (2010). On the role of prestimulus alpha rhythms over occipito-parietal areas in visual input regulation: correlation or causation? J. Neurosci. 30, 8692–8697. doi: 10.1523/JNEUROSCI.0160-10.2010
Rossi, S., Hallett, M., Rossini, P. M., and Pascual-Leone, A. (2009). Safety, ethical considerations, and application guidelines for the use of transcranial magnetic stimulation in clinical practice and research. Clin. Neurophysiol. 120, 2008–2039. doi: 10.1016/j.clinph.2009.08.016
Rossini, P. M., Barker, A. T., Berardelli, A., Caramia, M. D., Caruso, G., Cracco, R. Q., et al. (1994). Non-invasive electrical and magnetic stimulation of the brain, spinal cord and roots: basic principles and procedures for routine clinical application. Report of an IFCN committee. Electroencephalogr. Clin. Neurophysiol. 91, 79–92. doi: 10.1016/0013-4694(94)90029-9
Russmann, H., Lamy, J.-C., Shamim, E. A., Meunier, S., and Hallett, M. (2009). Associative plasticity in intracortical inhibitory circuits in human motor cortex. Clin. Neurophysiol. 120, 1204–1212. doi: 10.1016/j.clinph.2009.04.005
Sadaghiani, S., Hesselmann, G., and Kleinschmidt, A. (2009). Distributed and antagonistic contributions of ongoing activity fluctuations to auditory stimulus detection. J. Neurosci. 29, 13410–13417. doi: 10.1523/JNEUROSCI.2592-09.2009
Samaha, J., Sprague, T. C., and Postle, B. R. (2016). Decoding and reconstructing the focus of spatial attention from the topography of alpha-band oscillations. J. Cogn. Neurosci. 28, 1090–1097. doi: 10.1162/jocn_a_00955
Sanger, T. D., Garg, R. R., and Chen, R. (2001). Interactions between two different inhibitory systems in the human motor cortex. J. Physiol. 530, 307–317. doi: 10.1111/j.1469-7793.2001.0307l.x
Sauseng, P., Klimesch, W., Gerloff, C., and Hummel, F. C. (2009). Spontaneous locally restricted EEG alpha activity determines cortical excitability in the motor cortex. Neuropsychologia 47, 284–288. doi: 10.1016/j.neuropsychologia.2008.07.021
Schlee, W., Schecklmann, M., Lehner, A., Kreuzer, P. M., Vielsmeier, V., Poeppl, T. B., et al. (2014). Reduced variability of auditory alpha activity in chronic tinnitus. Neural Plast. 2014:436146. doi: 10.1155/2014/436146
Schlögl, A., Keinrath, C., Zimmermann, D., Scherer, R., Leeb, R., and Pfurtscheller, G. (2007). A fully automated correction method of {EOG} artifacts in {EEG} recordings. Clin. Neurophysiol. 118, 98–104. doi: 10.1016/j.clinph.2006.09.003
Schulz, H., Ubelacker, T., Keil, J., Müller, N., and Weisz, N. (2014). Now I am ready-now i am not: the influence of pre-TMS oscillations and corticomuscular coherence on motor-evoked potentials. Cereb. Cortex 24, 1708–1719. doi: 10.1093/cercor/bht024
Segrave, R. A., Cooper, N. R., Thomson, R. H., Croft, R. J., Sheppard, D. M., and Fitzgerald, P. B. (2011). Individualized alpha activity and frontal asymmetry in major depression. Clin. EEG Neurosci. 42, 45–52. doi: 10.1177/155005941104200110
Shew, W. L., and Plenz, D. (2013). The functional benefits of criticality in the cortex. Neuroscientist 19, 88–100. doi: 10.1177/1073858412445487
Smit, D. J. A., Linkenkaer-Hansen, K., and de Geus, E. J. C. (2013). Long-range temporal correlations in resting-state α oscillations predict human timing-error dynamics. J. Neurosci. 33, 11212–11220. doi: 10.1523/JNEUROSCI.2816-12.2013
Stagg, C., Bestmann, S., Constantinescu, A., Moreno, L., Allman, C., Mekle, R., et al. (2011). Relationship between physiological measures of excitability and levels of glutamate and GABA in the human motor cortex. J. Physiol. 589, 5845–5855. doi: 10.1113/jphysiol.2011.216978
Strube, W., Wobrock, T., Bunse, T., Palm, U., Padberg, F., Malchow, B., et al. (2014). Impairments in motor-cortical inhibitory networks across recent-onset and chronic schizophrenia: a cross-sectional TMS Study. Behav. Brain Res. 264, 17–25. doi: 10.1016/j.bbr.2014.01.041
Takemi, M., Masakado, Y., Liu, M., and Ushiba, J. (2013). Event-related desynchronization reflects downregulation of intracortical inhibition in human primary motor cortex. J. Neurophysiol. 110, 1158–1166. doi: 10.1152/jn.01092.2012
Walter, A., Murguialday, A. R., Rosenstiel, W., Birbaumer, N., and Bogdan, M. (2012). Coupling BCI and cortical stimulation for brain-state-dependent stimulation: methods for spectral estimation in the presence of stimulation after-effects. Front. Neural Circuits 6:87. doi: 10.3389/fncir.2012.00087
Yousry, T. A., Schmid, U. D., Alkadhi, H., Schmidt, D., Peraud, A., Buettner, A., et al. (1997). Localization of the motor hand area to a knob on the precentral gyrus. A new landmark. Brain 120, 141–157. doi: 10.1093/brain/120.1.141
Zarkowski, P., Shin, C. J., Dang, T., Russo, J., and Avery, D. (2006). EEG and the variance of motor evoked potential amplitude. Clin. EEG Neurosci. 37, 247–251. doi: 10.1177/155005940603700316
Ziemann, U., Reis, J., Schwenkreis, P., Rosanova, M., Strafella, A., Badawy, R., et al. (2015). TMS and drugs revisited 2014. Clin. Neurophysiol. 126, 1847–1868. doi: 10.1016/j.clinph.2014.08.028
Zoon, H. F. A., Veth, C. P. M., Arns, M., Drinkenburg, W. H. I. M., Talloen, W., Peeters, P. J., et al. (2013). EEG alpha power as an intermediate measure between brain-derived neurotrophic factor Val66Met and depression severity in patients with major depressive disorder. J. Clin. Neurophysiol. 30, 261–267. doi: 10.1097/WNP.0b013e3182933d6e
Keywords: brain stimulation, variability, paired-pulse, motor evoked potentials, electroencephalography, oscillations
Citation: Iscan Z, Nazarova M, Fedele T, Blagovechtchenski E and Nikulin V V (2016) Pre-stimulus Alpha Oscillations and Inter-subject Variability of Motor Evoked Potentials in Single- and Paired-Pulse TMS Paradigms. Front. Hum. Neurosci. 10:504. doi: 10.3389/fnhum.2016.00504
Received: 04 August 2016; Accepted: 26 September 2016;
Published: 07 October 2016.
Edited by:
Mikhail Lebedev, Duke University, USAReviewed by:
Faranak Farzan, University of Toronto, CanadaPantelis Lioumis, University of Helsinki, Finland
Copyright © 2016 Iscan, Nazarova, Fedele, Blagovechtchenski and Nikulin. This is an open-access article distributed under the terms of the Creative Commons Attribution License (CC BY). The use, distribution or reproduction in other forums is permitted, provided the original author(s) or licensor are credited and that the original publication in this journal is cited, in accordance with accepted academic practice. No use, distribution or reproduction is permitted which does not comply with these terms.
*Correspondence: Zafer Iscan, emlzY2FuQGhzZS5ydQ==
†These authors share first authorship and have contributed equally to the study.