 Stefanie Maurer1
 Katrin Giglhuber1
 Nico Sollmann1Anna Kelm1Sebastian Ille1Theresa Hauck1Noriko Tanigawa2Florian Ringel1Tobias Boeckh-Behrens3Bernhard Meyer1
 Sandro M. Krieg1*
- 1Department of Neurosurgery, Klinikum Rechts der Isar, Technische Universität München, Munich, Germany
- 2Faculty of Linguistics, Philology, and Phonetics, University of Oxford, Oxford, UK
- 3Section of Neuroradiology, Department of Radiology, Klinikum Rechts der Isar, Technische Universität München, Munich, Germany
Background: Besides motor and language function, tumor resections within the frontal and parietal lobe have also been reported to cause neuropsychological impairment like prosopagnosia.
Objective: Since non-navigated transcranial magnetic stimulation (TMS) has previously been used to map neuropsychological cortical function, this study aims to evaluate the feasibility and spatial discrimination of repetitive navigated TMS (rTMS) mapping for detection of face processing impairment in healthy volunteers. The study was also designed to establish this examination for preoperative mapping in brain tumor patients.
Methods: Twenty healthy and purely right-handed volunteers (11 female, 9 male) underwent rTMS mapping for cortical face processing function using 5 Hz/10 pulses. Both hemispheres were investigated randomly with an interval of 2 weeks between mapping sessions. Fifty-two predetermined cortical spots of the whole hemispheres were mapped after baseline measurement. The task consisted of 80 portraits of popular persons, which had to be named while rTMS was applied.
Results: In 80% of all subjects rTMS elicited naming errors in the right middle middle frontal gyrus (mMFG). Concerning anomia errors, the highest error rate (35%) was achieved in the bilateral triangular inferior frontal gyrus (trIFG). With regard to similarly or wrongly named persons, we observed 10% error rates mainly in the bilateral frontal lobes.
Conclusion: It seems feasible to map the cortical face processing function and to generate face processing impairment via rTMS. The observed localizations are well in accordance with the contemporary literature, and the mapping did not interfere with rTMS-induced language impairment. The clinical usefulness of preoperative mapping has to be evaluated subsequently.
Introduction
Although complete resection of brain tumors leads to a superior oncological outcome, any neurological deficit must be avoided in order to provide the best quality of life for the patients (Stummer et al., 2008; Capelle et al., 2013). Thus, neurosurgeons strongly focus on the preservation of postoperative motor or language function and have developed several techniques to achieve this aim (Sanai et al., 2008; De Benedictis et al., 2010; Szélenyi et al., 2010; Fernández Coello et al., 2013). Yet, besides motor and language deterioration, tumor resections within the frontal and parietal lobe were also reported to cause a significant number of patients with neuropsychological impairment (Sanai et al., 2012). However, since preoperative mapping of cortical motor function was recently shown to actually improve patient outcome as well as the extent of resection, non-invasive preoperative mapping of neuropsychological functions seems a highly reasonable approach (Krieg et al., 2014a). Since the accuracy of functional magnetic resonance imaging (fMRI) suffers severely in the vicinity of tumoral lesions, another technique seems promising: transcranial magnetic stimulation (TMS). TMS has gained broader acceptance among neurosurgeons since it was fused with neuronavigation as navigated TMS (nTMS). In recent years, several studies have been published on the use of nTMS for preoperative mapping of motor and language function and showed a good correlation with intraoperative direct cortical stimulation (DCS) (Picht et al., 2009, 2012, 2013; Tarapore et al., 2012, 2013; Krieg et al., 2012b, 2014b; Sollmann et al., 2015).
There were many studies published on the neuropsychological impairment of facial processing, so-called prosopagnosia (Sergent and Signoret, 1992; DeGutis et al., 2007; Sorger et al., 2007). In general, facial processing involves a lot of different, not only cortically located subfunctions. For instance, sensory components like the somatosensory cortex, visual pathways like the occipital face area (OFA) or the fusiform face area (FFA), memory-associated structures like the hippocampus, or emotional aspects, like those processed in the amygdala, have been associated with facial processing (Atkinson and Adolphs, 2011). Furthermore, researchers were already able to detect anatomical locations for prosopagnosia in brain-damaged patients (Sergent and Villemure, 1989; Young et al., 1993; Barton, 2014).
Another important item is the differentiation between language-related errors including semantic retrieval concerning facial processing and errors generated without just involving important language pathways.
This study evaluates the feasibility and spatial discrimination of repetitive nTMS (rTMS) mapping for detection of cortical face processing areas in a cohort of healthy volunteers (Van Honk and Schutter, 2004; Pitcher et al., 2007; Atkinson and Adolphs, 2011). In this regard it has already been shown that rTMS seems feasible for precisely mapping cortical calculation function in healthy subjects (Maurer et al., 2016). Therefore, the current study focuses on three issues:
1. The feasibility of locating facial processing via rTMS per se.
2. Exploring whether differences in neuronal processing between the two hemispheres and the different stimulation spots can be detected as a measure for spatial resolution.
3. Evaluating whether our findings for cortical localization of face processing match with those of the current literature.
Hence, in this study, we provide the first steps of establishing this new technique for neurosurgeons and neuroscientists.
Methods
Study Subjects
Twenty healthy volunteers who suffered from no cerebral pathology were enrolled (Table 1). No volunteer was taking any kind of medication. Inclusion criteria were German as mother tongue, right-handedness (Edinburgh handedness test), and age above 18 years. Exclusion criteria were general TMS and magnetic resonance imaging (MRI) contraindications (Rossi et al., 2009).
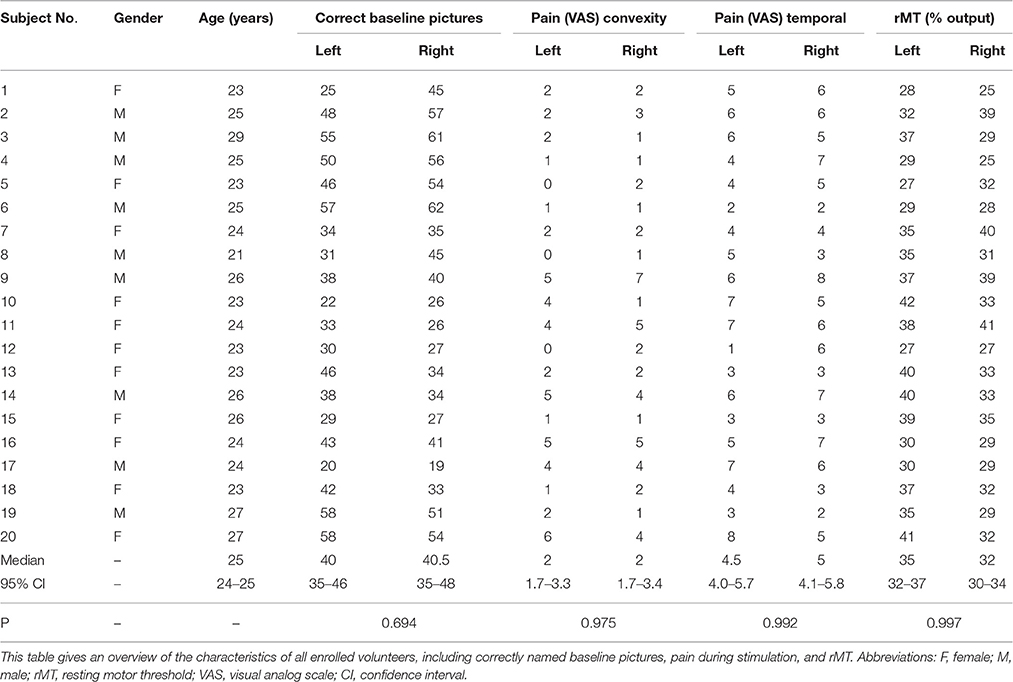
Table 1. Cohort characteristics.
Study Design
All volunteers underwent two rTMS mapping sessions. Both hemispheres were investigated randomly with an interval of 13–16 days between the mappings of each hemisphere. All mappings were conducted by the first author.
Ethics
Written informed consent was provided by all volunteers prior to rTMS. Approval was obtained by the local ethics committee of our university (Ethics Committee Registration Number 5811/13) and in accordance with the Declaration of Helsinki.
MRI Acquisition
Prior to the first rTMS mapping, all subjects underwent MRI. This was performed on a 3 Tesla scanner in combination with an 8-channel phased array head coil (Achieva 3 T, Philips Medical Systems, the Netherlands B.V.). For anatomical co-registration, our scanning protocol consisted of a three-dimensional gradient echo sequence (TR/TE 9/4 ms, 1 mm3 isovoxel covering the whole head, 6 min 58 s acquisition time) without intravenous contrast administration. Afterwards, the 3D dataset was transmitted to the rTMS system by using the DICOM standard.
rTMS Mapping
Experimental Setup
This setup was applied identically for all participants: rTMS mapping was performed two times using the Nexstim eXimia NBS system version 4.3 and a NexSpeech® module (Nexstim Plc., Helsinki, Finland) via 3D T1-weighted MRI (please see “Supplemental data”).
Facial Processing Task
Our data set consisted of 80 portraits/photos of popular persons in culture, entertainment, sports, and politics and was compiled in a way that volunteers between the age of 20–30 years were able to recognize and name them. The photos were selected by the first author prior to the first mapping out of the Internet or obtained from existing databases. The 80 pictures were presented in a randomized way on a 15-inch screen 20 inches in front of the volunteer. Participant answers had to be given in German. A baseline test was performed by every volunteer prior to every rTMS mapping. All falsely named, misnamed, or wrongly pronounced pictures out of the 80 items were counted and excluded from the consecutive rTMS sequence, as outlined in Table 1. (Please see “Supplemental data”).
Facial Processing Mapping Procedure
Each picture was shown on a screen for 700 ms with a fixed inter-picture interval (IPI) of 3 s and 0 ms picture-to-trigger interval (PTI) (Baptiste and Fehlings, 2006). The PTI is defined as the time from displaying the picture on the screen to the start of the rTMS pulse train. Every mapping session as well as the baseline was video-recorded for objective post hoc analysis (Lioumis et al., 2012; Picht et al., 2013). Each baseline picture had to be recognized before being used for the subsequent mapping session. Local pain or discomfort (e.g., in more painful temporal brain regions or the whole convexity of the hemisphere) during the mapping procedure was evaluated via a visual analog scale (VAS) and the volunteers were asked afterwards to rate the pain from 0 (no pain) to 10 points (maximal imaginable pain) (Table 1).
Stimulated Points
Every volunteer underwent rTMS mapping of both hemispheres on 52 predetermined cortical spots which were tagged on the 3D MRI prior to all mappings. The localizations of the stimulated spots were projected on the cortical parcellation system (CPS) published by Corina et al. (2005; Figure 1). Some CPS regions contained multiple stimulation points, for instance the angular gyrus (AnG) with 6 spots in total. Every spot was stimulated three times.
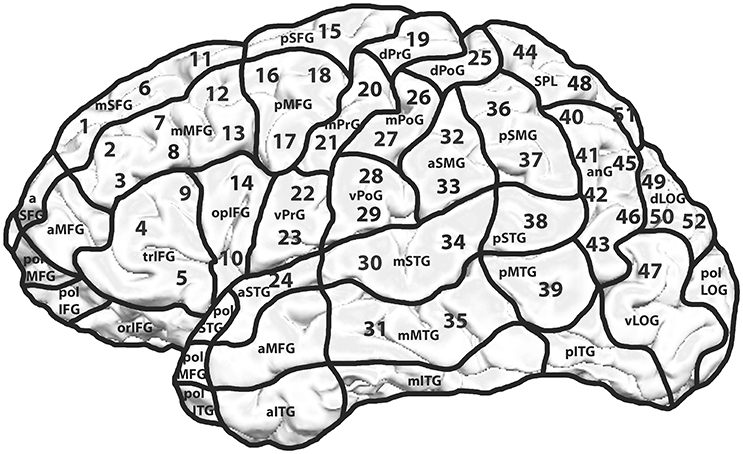
Figure 1. Mapping template including the cortical parcellation system (CPS) and the 52 stimulated spots. Mapping template with 52 predetermined spots over both hemispheres. Each cortical spot was stimulated 3 times using 5 Hz/10 pulses. The hemispheres were examined in a randomized way with an interval of 2 weeks between the two mappings. The CPS and its cortical areas are presented as published by Corina et al. (2005).
Data Analysis
Each video of the recorded rTMS sessions was analyzed as described in previous publications (Picht et al., 2013; Sollmann et al., 2013; Krieg et al., 2014b). In any given case, the investigator was blinded to all stimulated cortical spots as well as to all previous results. Any impairment of face processing or language performance was compared to the baseline, and the rTMS-induced errors were categorized into the following error types:
- error distribution for all error types
- anomia (no answer at all during stimulation)
- hesitation errors (delayed answer during stimulation)
- “similar person errors”
- “wrong person errors”
A named person was considered similar when the outward appearance was similar to the appearance of the displayed person. For example, Marilyn Monroe was displayed but Madonna was the given answer to this picture. In cases of completely different outward appearance, such as different gender, the answer was noted as wrong person. An example of this would be displaying the picture of Marilyn Monroe while the subject is naming it Bud Spencer. If at least one out of the three stimulations per spot evoked any error, the associated cortical region was considered positive for an error for the facial processing task.
The error rates (ER) were evaluated in the following ways:
(1) ER for all errors per total number of stimulations; therefore, the ER describes the actual number of mistakes or errors per specified category, expressed as a percentage.
(2) Number of subjects who generated errors per all stimulated subjects.
Moreover, the individual stimulation points were assigned to different lobes (frontal: spot = SP 1–23; parietal: SP 25–29, 32, 33, 36, 37, 40–46, 48, 51; occipital: SP 49, 50, 52; temporal: SP 24, 30, 31, 34, 35, 38, 39, 47).
Statistical Analysis
By the use of a Chi-squared test, all generated errors of all stimulations within the right vs. the left hemisphere were compared. We also tested the differences in ER between the two hemispheres using the Mann-Whitney-Wilcoxon test for nonparametric distribution. In this case we compared the ER for all errors of all subjects, separated for each task (GraphPad Prism 6.04, La Jolla, CA, USA). The level of significance was 0.05 (two-sided) for every statistical test. The ER was defined as the quotient of the number of rTMS-induced face processing errors divided by the number of facial processing tasks, rTMS pulses, or number of subjects.
Results
Performance during rTMS Mapping
The mapping was tolerated well by all volunteers. Table 1 provides an overview of subject and mapping characteristics.
Error Rate Relative to All Stimulations
Error Distribution for All Error Types
Table 2 gives an overview of the different error types. We generated the highest ER (42%) in the right middle middle frontal gyrus (mMFG) (SP 8) as well as in the left hemisphere's triangular inferior frontal gyrus (trIFG) (SP 4; ER 30%; Tables 2, 3). The overall ER of both hemispheres was 18%, respectively. There was no statistically significant difference in the ER between both hemispheres (p = 0.34).
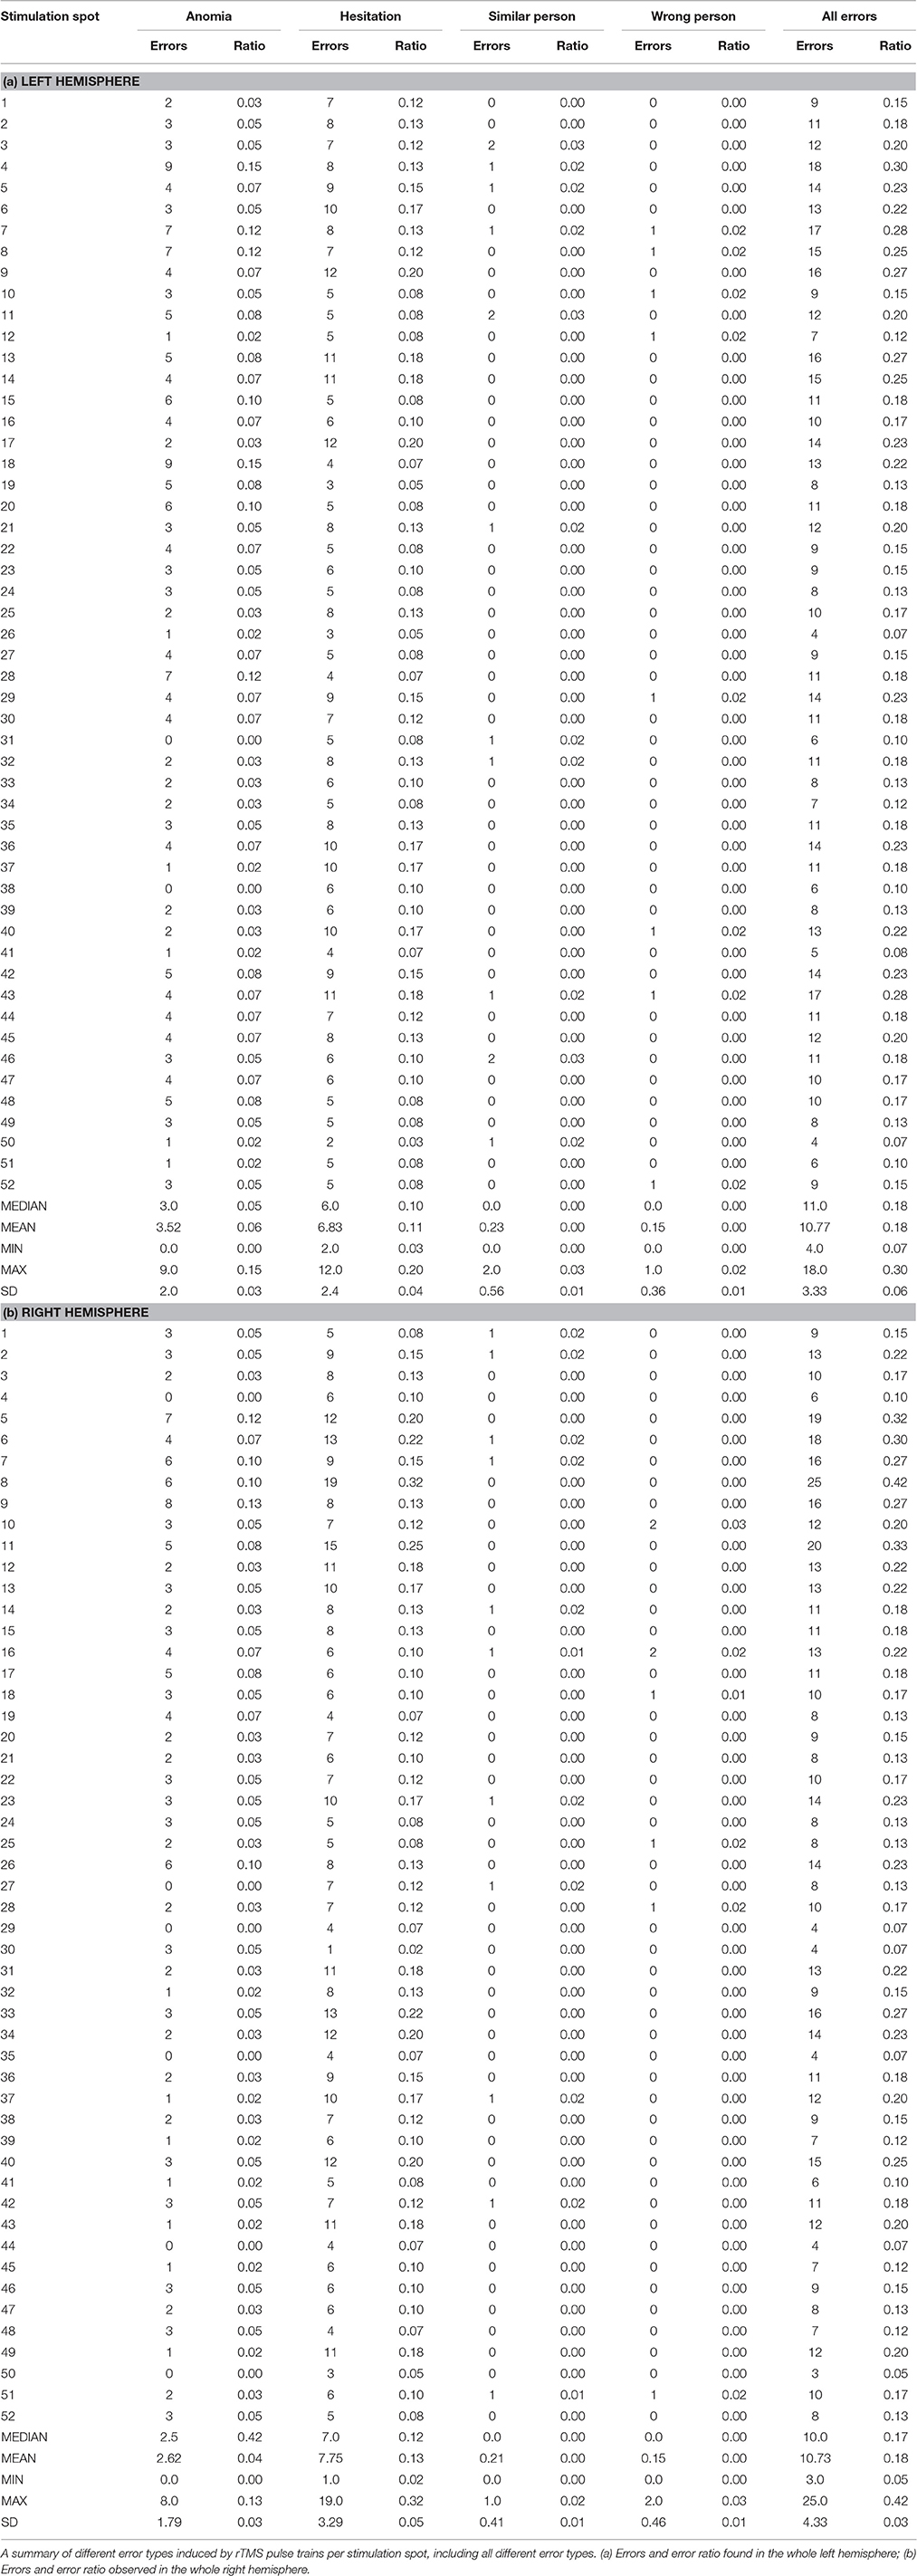
Table 2. Different errors per stimulation point.
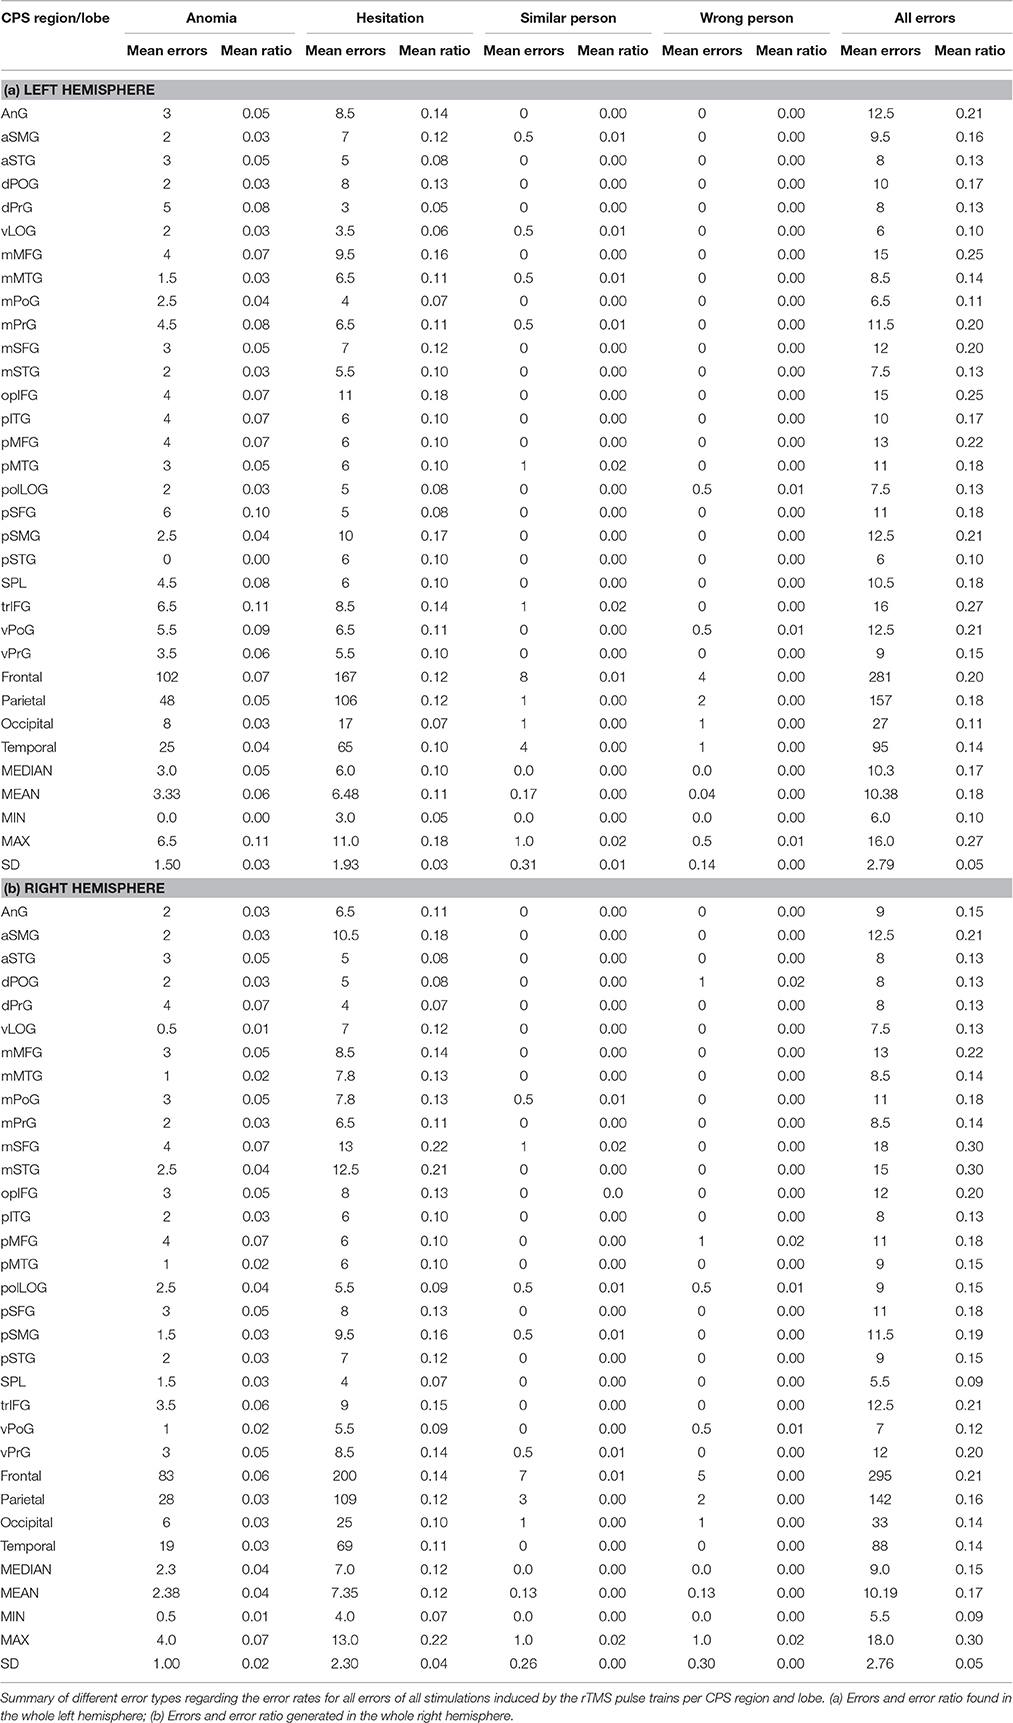
Table 3. Different error rates for all stimulations per cortical parcellation system (CPS) region and lobe.
Anomia
The highest ER was in the right trIFG (SP 9; ER 13%). The left hemisphere showed the highest ER in the trIFG (SP 4) and in the posterior middle frontal gyrus (pMFG) (SP 18; ER 15% each; Tables 2, 3).
Hesitations
The highest ER was 32% in the right mMFG (SP 8). The left hemisphere's trIFG (SP 9) and pMFG (SP 17) each had an ER of 20% (Tables 2, 3).
Similar Person
The right hemisphere generated an ER of 2% mainly in the frontal and parietal lobe. Regarding the left hemisphere, we observed the highest ER of 3% in the mMFG (SP 3), the middle superior frontal gyrus (mSFG) (SP 11), and the posterior middle temporal gyrus (pMTG) (SP 46) (Tables 2, 3).
Wrong Person
In terms of the right hemisphere, we achieved the highest ER of 3% in the frontal lobe. Furthermore, we generated a high ER for the left hemisphere in every lobe with 2% each (Tables 2, 3).
Error Rate Relative to All Subjects
Error Distribution for All Error Types
We observed the highest ER in the right mMFG (SP 8) with 80%, and in the left trIFG (SP 4 & 9), each of which had an ER of 65% (Tables 4, 5, Figures 2, 3A).
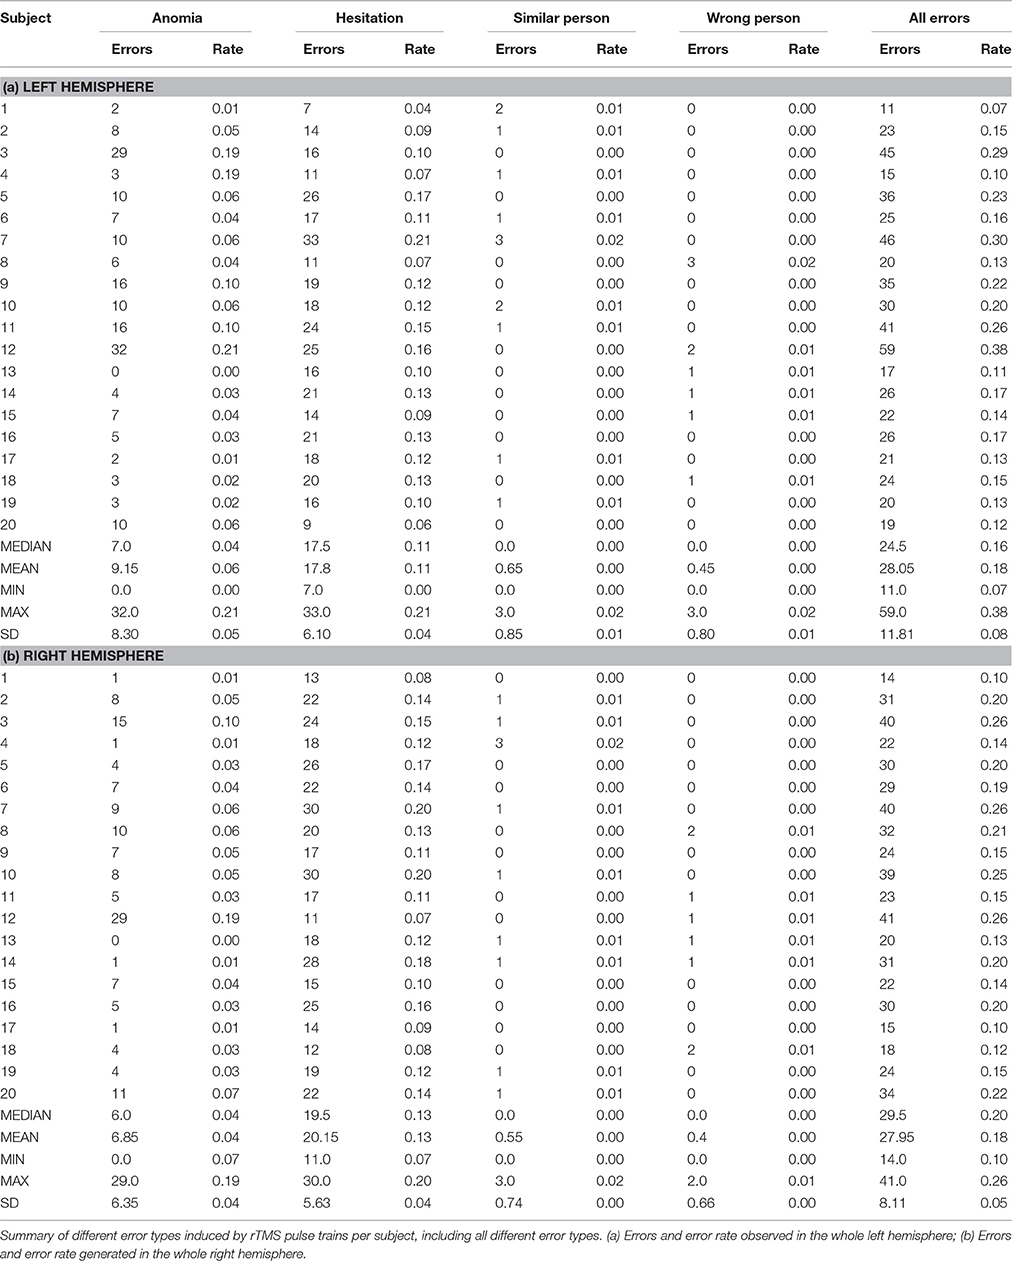
Table 4. Different errors per subject.
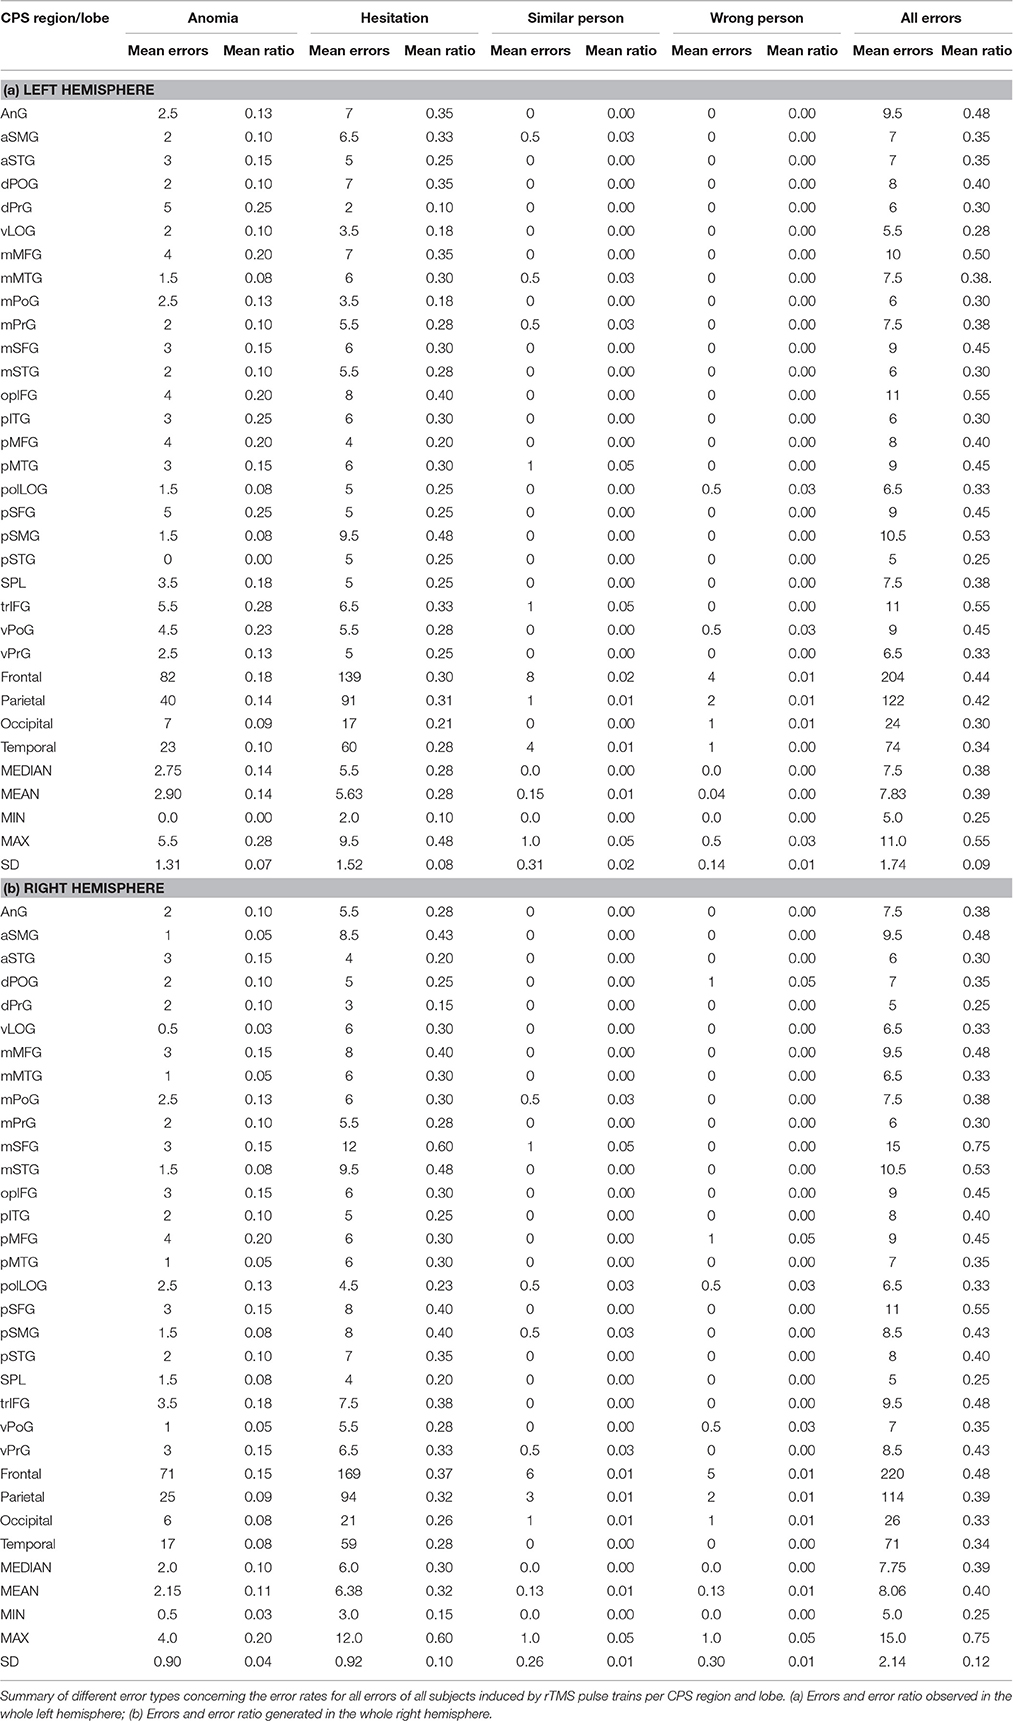
Table 5. Different error rates for all subjects per cortical parcellation system (CPS) region and lobe.
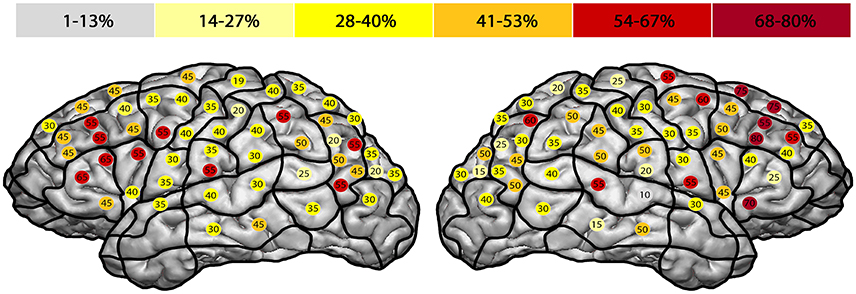
Figure 2. Error rate in entire facial processing task. This template illustrates the error rate for all errors of all subjects in the entire facial processing task. Gray represents the lowest observed error rate and dark red the highest. The highest error rates were observed in the right middle middle frontal gyrus (mMFG; stimulation point 8) with 80%, and in the left triangular inferior frontal gyrus (trIFG; stimulation points 4 & 9) with an error rate of 65% each.
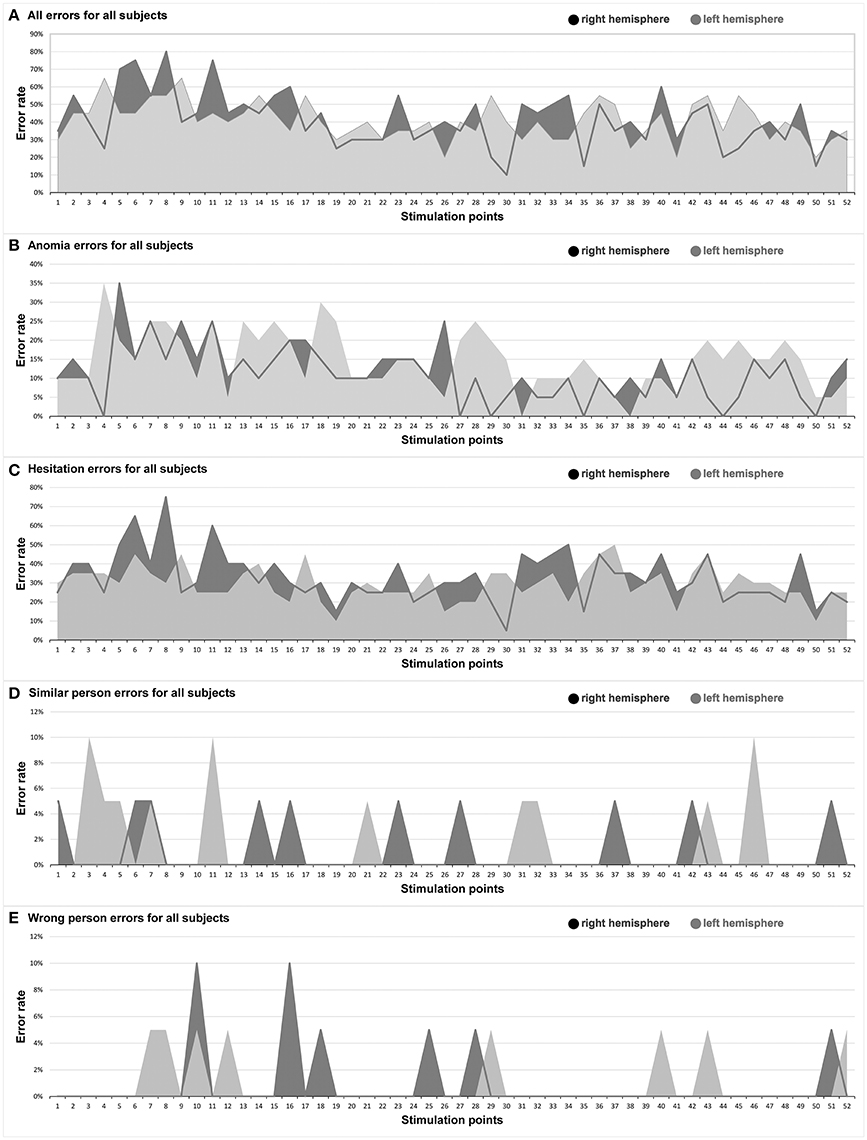
Figure 3. Hemispheric comparison. This graph illustrates the hemispheric comparison separated in each different error type in the entire facial processing mapping. Dark gray: right hemisphere, light gray: left hemisphere. (A) All errors for all subjects; (B) Anomia errors for all subjects; (C) Hesitation errors for all subjects; (D) Similar person errors for all subjects; (E) Wrong person errors for all subjects.
Anomia
The right hemisphere generated the highest ER of 35% in the trIFG (SP 5), and it was 35% in the left trIFG (SP 4) as well (Tables 4, 5, Figures 3B, 4). When comparing the left to the right hemisphere, we could not show any statistically significant difference (p = 0.77).
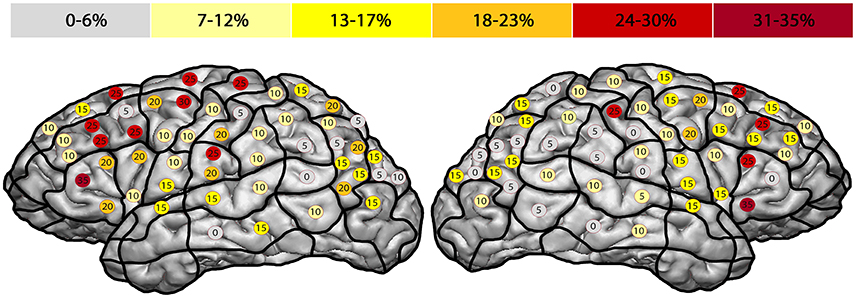
Figure 4. Anomia errors. This template shows the error rate for all anomia errors of all subjects. The highest error rates were observed in both hemispheres' triangular inferior frontal gyri, each of which had an error rate of 35% (trIFG; stimulation points 4 & 5).
Hesitations
The highest ER of 75% was observed in the right mMFG (SP 8). Additionally, we generated a maximum ER of 50% in the left posterior supramarginal gyrus (pSMG) (SP 37) (Tables 4, 5, Figures 3C, 5). Regarding the comparison of both hemispheres, we could not show any statistically significant difference (p = 0.21).
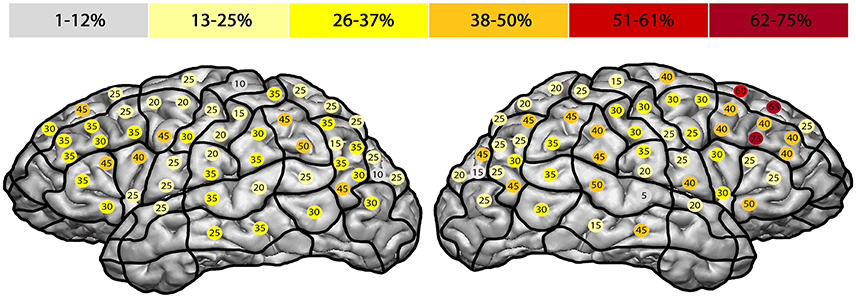
Figure 5. Hesitation errors. This template outlines the error rates for all hesitation errors in the facial processing task. The highest error rate of 75% was found in the right middle middle frontal gyrus (mMFG; stimulation point 8), followed by the left posterior supramarginal gyrus (50%) (pSMG; stimulation point 37).
Similar Person
The highest ER of this type was observed mainly in the right frontal lobe (10%). In the left hemisphere, we observed the highest ER (10%) in the mMFG (SP 3), mSFG (SP 11), and the pMTG (SP 46) (Tables 4, 5, Figure 3D). We could not show any statistically significant difference between both hemispheres (p = 0.64).
Wrong Person
The highest ER (10%) was seen in the right opercular inferior frontal gyrus (opIFG) (SP 10) and pMFG (SP 16). The left hemisphere showed a comparable ER (5%) across spots belonging to all four lobes (Tables 4, 5, Figure 3E). Again, we did not observe any statistically significant difference between hemispheres (p = 0.82).
Discussion
Facial processing has been previously examined in various studies by non-navigated TMS (Pitcher et al., 2007; Atkinson and Adolphs, 2011; Solomon-Harris et al., 2013), by fMRI (Keenan et al., 2000; Gauthier et al., 2000; Hadjikhani and De Gelder, 2002), and in several brain lesion studies (Hier et al., 1983; Young et al., 1993; Rapcsak et al., 1998; Barton, 2014; Busigny et al., 2014). Nonetheless, nTMS, with its much higher spatial resolution and therefore increased usefulness for neuroscientists, has not been used in this context before.
Feasibility of Locating Cortical Regions Involved in Facial Processing
The central aim of this study is to demonstrate that rTMS is feasible for locating the specific cortical areas involved in the face processing function. Although rTMS does not allow to affect deeper brain structures, the observed superficial cortical localizations, especially in the bilateral frontal lobe, as well as in the temporal and parietal lobe, correlate with those noted in the current literature (Atkinson and Adolphs, 2011; Barton, 2014; Gomez et al., 2015; Yang et al., 2016). Furthermore, our results indicate a more important role of the right frontal lobe in visual facial processing than previously expected. Nonetheless, the exact localization of facial processing remains debatable since it involves a large variety of subfunctions and structures, including visual pathways like the OFA, memory-associated structures like the hippocampus, sensory components like the somatosensory cortex, or emotional aspects, such as those processed in the amygdala (Atkinson and Adolphs, 2011). This study provides two different facts to the scientific community: (1) rTMS could serve as an additional modality for this endeavor, maybe by serving as a seed region for diffusion tensor imaging (DTI) fiber tracking (Frey et al., 2012; Krieg et al., 2012a), and (2) since rTMS is less affected by brain tumors (Ille et al., 2015), we suggest that it could be feasible for cortical delineation of facial-processing-related areas in brain tumor patients as a stand-alone technique.
Previous studies discussed the importance of a “strict feed-forward hierarchical model of face perception” (Atkinson and Adolphs, 2011) with the OFA as the principle of a cortical network, including the FFA and the superior temporal sulcus (Dubois et al., 1999; Klopp et al., 1999; Atkinson and Adolphs, 2011; Jonas et al., 2012). However, recent neuroimaging or non-navigated TMS studies presented different findings with even more cortical areas involved in facial processing (Campanella et al., 2001; Renzi et al., 2013). Campanella et al. (2001) showed in a positron emission tomography (PET) activation study that besides the fusiform gyrus (FG), the left hemisphere's inferior frontal gyrus (IFG) and middle frontal gyrus (MFG), as well as the supramarginal gyrus (SMG) construct a facial processing network (Campanella et al., 2001). These findings are in accordance with our localizations in the frontal and parietal lobe (Figures 2–5). Renzi et al. (2013) furthermore reported on bilateral prefrontal activation for different aspects of facial processing using rTMS over the MFG and IFG (Renzi et al., 2013). In direct comparison, our study included a higher number of healthy volunteers.
When further analyzing the ER of our study, they were mostly not generated in areas that are typically associated with language, except for the left trIFG (SP 4 & 9) (Figures 2, 4; Tables 2–5). This circumstance can be regarded as further evidence for the feasibility of locating a distinctive face processing function via rTMS rather than an artifact of rTMS language mapping. Moreover, we differentiated precisely whether the errors were elicited because of possible language impairment or due to face processing impairment. Additionally, and to reduce the false positive errors due to language impairment, the volunteers were asked subsequently whether they felt unable to speak properly or unable to recognize faces. None of the participants said that he or she felt unable to speak, but in the interim unable to recognize and therefore name well-known faces.
Comparison of the Different Error Types and Their Localization
All Errors for All Error Types
The highest ER were generated in the bilateral frontal lobes, with a considerably higher ER in the right hemisphere (Figure 2; Tables 2–5). We also detected high ER in the bilateral AnG, especially within the right side, even higher than in the adjoining OFA or superior temporal gyrus (STG). That might be another reference to the versatility of cortical face processing, and an indication that contradicts the discussed hierarchical system that includes just the OFA, the STG, and the FG (Dubois et al., 1999; Klopp et al., 1999; Atkinson and Adolphs, 2011; Jonas et al., 2012).
Anomia
The highest ER was found in the bilateral frontal lobe, especially in the trIFG (SP 4, 5, 9; Figures 3B, 4; Tables 2–5). But when we compare both whole hemispheres, we observed a maximum ER of 11% in the right hemisphere and a higher ER of 15% in the left hemisphere. Although the study was designed to eliminate possible language-related errors by differentiating whether the mistakes were generated due to language impairment or disability to speak, this might be related to the fact that anomia is often more associated to the language function, which is primarily located in the left hemisphere.
Hesitation Errors
The highest ER was observed in the right hemisphere's mMFG (SP 8; Figures 3C, 5; Tables 2–5). Additionally, when comparing both hemispheres, we detected maximum ER in the right hemisphere of 33% in total, and 30% in the left hemisphere. In direct comparison to anomia errors and the question of whether these errors could have been made because of language impairment, we again observed more positive error localizations in the hemisphere that is non-dominant for language (Figure 5).
Similar and Wrong Person Errors
In general, low error rates with a maximum of 10% were elicited (Figures 3D,E; Tables 2–5). Yet, subjects reported after stimulation that they often were unable to recognize and name a person and that the famous face suddenly felt unknown to them. In this case the volunteers generally did not respond to the presented picture at all. Thus, it was difficult in this mapping setting to evoke errors in terms of wrongly identified persons. Instead, many more hesitation errors and anomias were observed (Figures 4, 5).
Differences between the Two Hemispheres and Cortical Regions
Additionally, to the commonly assumed localizations of facial processing in the occipitotemporal areas, the literature also provides more diverse cortical localizations (Haxby et al., 1994; Rapcsak et al., 2001; Renzi et al., 2013). Haxby et al. (1994) analyzed facial processing in a PET study by examining changes in regional cerebral blood flow (PET-rCBF). Besides their findings for face matching in the bilateral FG and the occipital and occipitotemporal cortex, they also identified the right prefrontal area and the IFG as localizations for facial processing (Haxby et al., 1994). These results confirm our observed localizations (Figure 2; Tables 2–5). As mentioned above, Renzi et al. (2013) were able to influence configurable processing of faces by using rTMS over the right IFG (Renzi et al., 2013). Rapcsak et al. (2001) tested face memory impairment in patients with focal frontal lobe lesions (Rapcsak et al., 2001). The patients showed face memory impairment compared with a cohort of control subjects, leading the researchers to conclude that the prefrontal cortices play an important role in face memory processing.
Feasibility of Preoperative Mapping in Brain Tumor Patients
Several studies have reported neuropsychological and cognitive impairment in terms of facial processing following brain damage or surgical resection of brain tumors (Hier et al., 1983; Rapcsak et al., 1998, 2001; Barton, 2014). Sanai et al. (2012) published a study with 119 glioma patients who underwent aggressive surgical glioma resection (Sanai et al., 2012); 8.4% of the patients suffered from new postoperative neuropsychological impairment, including prosopagnosia. Sergent and Villemure (1989) furthermore reported prosopagnosia in a right hemispherectomized female patient (Sergent and Villemure, 1989). Her other intellectual and cognitive functions were normal or just marginally impaired, but she was not able to identify familiar faces at all.
Besides the feasibility of using rTMS for neuropsychological or neuroscience research, this technique might also be useful for neurosurgeons regarding preoperative mapping of important neuropsychological functions in brain tumor patients (Maurer et al., 2016).
Limitations
Due to the test algorithm we used, we are not able to completely determine whether the evoked errors in face processing were due to induced impairment of face processing or due to impairment of language or visual function.
Another limitation of mapping cortical neuropsychological functions is that some regions of the brain cannot be reached by rTMS.
In this context, the combination of rTMS with DTI fiber tracking or fMRI might be a promising modality, as already published for motor function (Krieg et al., 2012a; Frey et al., 2014) and language function (Ille et al., 2015).
Moreover, intraoperative validation is lacking for the mapping of neuropsychological functions but should be the next step.
Conclusions
rTMS seems feasible for locating the cortical facial processing function and evoking prosopagnosia-like symptoms. Having the limitations of rTMS in mind, the observed localizations are in accordance with the current literature. Moreover, rTMS could serve as a useful adjunct to other established modalities.
Author Contributions
SM: manuscript preparation, data acquisition, data handling, data analysis, statistics, literature review. NT: data handling, data analysis, statistics. SK: manuscript preparation, data handling, data analysis, study supervision, statistics, literature review. All others: data handling, manuscript revision, study supervision.
Funding
The study was completely financed by institutional grants of the Department of Neurosurgery and the Section of Neuroradiology, Technische Universität München.
Conflict of Interest Statement
SK and FR are consultants for BrainLAB AG (Feldkirchen, Germany). SK is a consultant for Nexstim Plc (Helsinki, Finland). The authors declare that the research was conducted in the absence of any commercial or financial relationships that could be construed as a potential conflict of interest. The study was completely financed by institutional grants of the Department of Neurosurgery and the Section of Neuroradiology, Technische Universität München.
Supplementary Material
The Supplementary Material for this article can be found online at: http://journal.frontiersin.org/article/10.3389/fnhum.2017.00004/full#supplementary-material
Abbreviations
aMTG, anterior middle temporal gyrus; AnG, angular gyrus; CI, confidence interval; CPS, cortical parcellation system; DCS, direct cortical stimulation; DTI, diffusion tensor imaging; ER, error rate; FFA, fusiform face area; FG, fusiform gyrus; fMRI, functional magnetic resonance imaging; IFG, inferior frontal gyrus; IPI, inter-picture interval; ITG, inferior temporal gyrus; MFG, middle frontal gyrus; mMFG, middle middle frontal gyrus; mPoG, middle postcentral gyrus; MRI, magnetic resonance imaging; mSFG, middle superior frontal gyrus; MTG, middle temporal gyrus; nTMS, navigated transcranial magnetic stimulation; OFA, occipital face area; opIFG, opercular inferior frontal gyrus; orIFG, orbital part of the inferior frontal gyrus; PET, positron emission tomography; pMFG, posterior middle frontal gyrus; pMTG, posterior middle temporal gyrus; polLOG, polar lateral occipital gyrus; polSFG, polar superior frontal gyrus; polSTG, polar superior temporal gyrus; pSMG, posterior supramarginal gyrus; PTI, picture-to-trigger interval; TMS, transcranial magnetic stimulation; trIFG, triangular inferior frontal gyrus; rMT, resting motor threshold; rTMS, repetitive navigated transcranial magnetic stimulation; SD, standard deviation; SP, stimulation point; SFG, superior frontal gyrus; SMG, supramarginal gyrus; STG, superior temporal gyrus; vPrG, ventral precentral gyrus; VAS, visual analog scale.
References
Atkinson, A. P., and Adolphs, R. (2011). The neuropsychology of face perception: beyond simple dissociations and functional selectivity. Philos. Trans. R. Soc. Lond. B. Biol. Sci. 366, 1726–1738. doi: 10.1098/rstb.2010.0349
Baptiste, D. C., and Fehlings, M. G. (2006). Pathophysiology of cervical myelopathy. Spine J. 6, 190–197. doi: 10.1016/j.spinee.2006.04.024
Barton, J. J. (2014). Higher cortical visual deficits. Continuum (Minneap. Minn). 20, 922–941. doi: 10.1212/01.con.0000453311.29519.67
Busigny, T., Van Belle, G., Jemel, B., Hosein, A., Joubert, S., and Rossion, B. (2014). Face-specific impairment in holistic perception following focal lesion of the right anterior temporal lobe. Neuropsychologia 56, 312–333. doi: 10.1016/j.neuropsychologia.2014.01.018
Campanella, S., Joassin, F., Rossion, B., De Volder, A., Bruyer, R., and Crommelinck, M. (2001). Association of the distinct visual representations of faces and names: a PET activation study. Neuroimage 14, 873–882. doi: 10.1006/nimg.2001.0877
Capelle, L., Fontaine, D., Mandonnet, E., Taillandier, L., Golmard, J. L., Bauchet, L., et al. (2013). Spontaneous and therapeutic prognostic factors in adult hemispheric World Health Organization Grade II gliomas: a series of 1097 cases: clinical article. J. Neurosurg. 118, 1157–1168. doi: 10.3171/2013.1.JNS121
Corina, D. P., Gibson, E. K., Martin, R., Poliakov, A., Brinkley, J., and Ojemann, G. A. (2005). Dissociation of action and object naming: evidence from cortical stimulation mapping. Hum. Brain Mapp. 24, 1–10. doi: 10.1002/hbm.20063
De Benedictis, A., Moritz-Gasser, S., and Duffau, H. (2010). Awake mapping optimizes the extent of resection for low-grade gliomas in eloquent areas. Neurosurgery 66, 1074–1084; discussion 1084. doi: 10.1227/01.neu.0000369514.74284.78
DeGutis, J. M., Bentin, S., Robertson, L. C., and D'esposito, M. (2007). Functional plasticity in ventral temporal cortex following cognitive rehabilitation of a congenital prosopagnosic. J. Cogn. Neurosci. 19, 1790–1802. doi: 10.1162/jocn.2007.19.11.1790
Dubois, S., Rossion, B., Schiltz, C., Bodart, J. M., Michel, C., Bruyer, R., et al. (1999). Effect of familiarity on the processing of human faces. Neuroimage 9, 278–289. doi: 10.1006/nimg.1998.0409
Fernández Coello, A., Moritz-Gasser, S., Martino, J., Martinoni, M., Matsuda, R., and Duffau, H. (2013). Selection of intraoperative tasks for awake mapping based on relationships between tumor location and functional networks. J. Neurosurg. 119, 1380–1394. doi: 10.3171/2013.6.JNS122470
Frey, D., Schilt, S., Strack, V., Zdunczyk, A., Rösler, J., Niraula, B., et al. (2014). Navigated transcranial magnetic stimulation improves the treatment outcome in patients with brain tumors in motor eloquent locations. Neuro Oncol. 16, 1365–1372. doi: 10.1093/neuonc/nou110
Frey, D., Strack, V., Wiener, E., Jussen, D., Vajkoczy, P., and Picht, T. (2012). A new approach for corticospinal tract reconstruction based on navigated transcranial stimulation and standardized fractional anisotropy values. Neuroimage 62, 1600–1609. doi: 10.1016/j.neuroimage.2012.05.059
Gauthier, I., Tarr, M. J., Moylan, J., Skudlarski, P., Gore, J. C., and Anderson, A. W. (2000). The fusiform “face area” is part of a network that processes faces at the individual level. J. Cogn. Neurosci. 12, 495–504. doi: 10.1162/089892900562165
Gomez, J., Pestilli, F., Witthoft, N., Golarai, G., Liberman, A., Poltoratski, S., et al. (2015). Functionally defined white matter reveals segregated pathways in human ventral temporal cortex associated with category-specific processing. Neuron 85, 216–227. doi: 10.1016/j.neuron.2014.12.027
Hadjikhani, N., and De Gelder, B. (2002). Neural basis of prosopagnosia: an fMRI study. Hum. Brain Mapp. 16, 176–182. doi: 10.1002/hbm.10043
Haxby, J. V., Horwitz, B., Ungerleider, L. G., Maisog, J. M., Pietrini, P., and Grady, C. L. (1994). The functional organization of human extrastriate cortex: a PET-rCBF study of selective attention to faces and locations. J. Neurosci. 14, 6336–6353.
Hier, D. B., Mondlock, J., and Caplan, L. R. (1983). Recovery of behavioral abnormalities after right hemisphere stroke. Neurology 33, 345–350. doi: 10.1212/WNL.33.3.345
Ille, S., Sollmann, N., Hauck, T., Maurer, S., Tanigawa, N., Obermueller, T., et al. (2015). Combined noninvasive language mapping by navigated transcranial magnetic stimulation and functional MRI and its comparison with direct cortical stimulation. J. Neurosurg. 123, 212–225. doi: 10.3171/2014.9.JNS14929
Jonas, J., Descoins, M., Koessler, L., Colnat-Coulbois, S., Sauvée, M., Guye, M., et al. (2012). Focal electrical intracerebral stimulation of a face-sensitive area causes transient prosopagnosia. Neuroscience 222, 281–288. doi: 10.1016/j.neuroscience.2012.07.021
Keenan, J. P., Wheeler, M. A., Gallup, G. G. Jr., and Pascual-Leone, A. (2000). Self-recognition and the right prefrontal cortex. Trends Cogn. Sci. 4, 338–344. doi: 10.1016/S1364-6613(00)01521-7
Klopp, J., Halgren, E., Marinkovic, K., and Nenov, V. (1999). Face-selective spectral changes in the human fusiform gyrus. Clin. Neurophysiol. 110, 676–682. doi: 10.1016/S1388-2457(98)00039-X
Krieg, S. M., Buchmann, N. H., Gempt, J., Shiban, E., Meyer, B., and Ringel, F. (2012a). Diffusion tensor imaging fiber tracking using navigated brain stimulation–a feasibility study. Acta Neurochir. (Wien). 154, 555–563. doi: 10.1007/s00701-011-1255-3
Krieg, S. M., Sabih, J., Bulubasova, L., Obermueller, T., Negwer, C., Janssen, I., et al. (2014a). Preoperative motor mapping by navigated transcranial magnetic brain stimulation improves outcome for motor eloquent lesions. Neuro Oncol. 16, 1274–1282. doi: 10.1093/neuonc/nou007
Krieg, S. M., Shiban, E., Buchmann, N., Gempt, J., Foerschler, A., Meyer, B., et al. (2012b). Utility of presurgical navigated transcranial magnetic brain stimulation for the resection of tumors in eloquent motor areas. J. Neurosurg. 116, 994–1001. doi: 10.3171/2011.12.JNS111524
Krieg, S. M., Sollmann, N., Hauck, T., Ille, S., Meyer, B., and Ringel, F. (2014b). Repeated mapping of cortical language sites by preoperative navigated transcranial magnetic stimulation compared to repeated intraoperative DCS mapping in awake craniotomy. BMC Neurosci. 15:20. doi: 10.1186/1471-2202-15-20
Lioumis, P., Zhdanov, A., Mäkelä, N., Lehtinen, H., Wilenius, J., Neuvonen, T., et al. (2012). A novel approach for documenting naming errors induced by navigated transcranial magnetic stimulation. J. Neurosci. Methods 204, 349–354. doi: 10.1016/j.jneumeth.2011.11.003
Maurer, S., Tanigawa, N., Sollmann, N., Hauck, T., Ille, S., Boeckh-Behrens, T., et al. (2016). Non-invasive mapping of calculation function by repetitive navigated transcranial magnetic stimulation. Brain Struct. Funct. 221, 3927–3947. doi: 10.1007/s00429-015-1136-2
Picht, T., Krieg, S. M., Sollmann, N., Rösler, J., Niraula, B., Neuvonen, T., et al. (2013). A comparison of language mapping by preoperative navigated transcranial magnetic stimulation and direct cortical stimulation during awake surgery. Neurosurgery 72, 808–819. doi: 10.1227/NEU.0b013e3182889e01
Picht, T., Mularski, S., Kuehn, B., Vajkoczy, P., Kombos, T., and Suess, O. (2009). Navigated transcranial magnetic stimulation for preoperative functional diagnostics in brain tumor surgery. Neurosurgery 65, 93–98. doi: 10.1227/01.neu.0000348009.22750.59
Picht, T., Schulz, J., Hanna, M., Schmidt, S., Suess, O., and Vajkoczy, P. (2012). Assessment of the influence of navigated transcranial magnetic stimulation on surgical planning for tumors in or near the motor cortex. Neurosurgery 70, 1248–1256; discussion 1256–1257. doi: 10.1227/NEU.0b013e318243881e
Pitcher, D., Walsh, V., Yovel, G., and Duchaine, B. (2007). TMS evidence for the involvement of the right occipital face area in early face processing. Curr. Biol. 17, 1568–1573. doi: 10.1016/j.cub.2007.07.063
Rapcsak, S. Z., Kaszniak, A. W., Reminger, S. L., Glisky, M. L., Glisky, E. L., and Comer, J. F. (1998). Dissociation between verbal and autonomic measures of memory following frontal lobe damage. Neurology 50, 1259–1265. doi: 10.1212/WNL.50.5.1259
Rapcsak, S. Z., Nielsen, L., Littrell, L. D., Glisky, E. L., Kaszniak, A. W., and Laguna, J. F. (2001). Face memory impairments in patients with frontal lobe damage. Neurology 57, 1168–1175. doi: 10.1212/WNL.57.7.1168
Renzi, C., Schiavi, S., Carbon, C. C., Vecchi, T., Silvanto, J., and Cattaneo, Z. (2013). Processing of featural and configural aspects of faces is lateralized in dorsolateral prefrontal cortex: a TMS study. Neuroimage 74, 45–51. doi: 10.1016/j.neuroimage.2013.02.015
Rossi, S., Hallett, M., Rossini, P. M., and Pascual-Leone, A. (2009). Safety, ethical considerations, and application guidelines for the use of transcranial magnetic stimulation in clinical practice and research. Clin. Neurophysiol. 120, 2008–2039. doi: 10.1016/j.clinph.2009.08.016
Sanai, N., Martino, J., and Berger, M. S. (2012). Morbidity profile following aggressive resection of parietal lobe gliomas. J. Neurosurg. 116, 1182–1186. doi: 10.3171/2012.2.JNS111228
Sanai, N., Mirzadeh, Z., and Berger, M. S. (2008). Functional outcome after language mapping for glioma resection. N. Engl. J. Med. 358, 18–27. doi: 10.1056/NEJMoa067819
Sergent, J., and Signoret, J. L. (1992). Varieties of functional deficits in prosopagnosia. Cereb. Cortex 2, 375–388. doi: 10.1093/cercor/2.5.375
Sergent, J., and Villemure, J. G. (1989). Prosopagnosia in a right hemispherectomized patient. Brain 112 (Pt 4), 975–995. doi: 10.1093/brain/112.4.975
Sollmann, N., Ille, S., Hauck, T., Maurer, S., Negwer, C., Zimmer, C., et al. (2015). The impact of preoperative language mapping by repetitive navigated transcranial magnetic stimulation on the clinical course of brain tumor patients. BMC Cancer 15:261. doi: 10.1186/s12885-015-1299-5
Sollmann, N., Picht, T., Mäkelä, J. P., Meyer, B., Ringel, F., and Krieg, S. M. (2013). Navigated transcranial magnetic stimulation for preoperative language mapping in a patient with a left frontoopercular glioblastoma. J. Neurosurg. 118, 175–179. doi: 10.3171/2012.9.JNS121053
Solomon-Harris, L. M., Mullin, C. R., and Steeves, J. K. E. (2013). TMS to the “occipital face area” affects recognition but not categorization of faces. Brain Cogn. 83, 245–251. doi: 10.1016/j.bandc.2013.08.007
Sorger, B., Goebel, R., Schiltz, C., and Rossion, B. (2007). Understanding the functional neuroanatomy of acquired prosopagnosia. Neuroimage 35, 836–852. doi: 10.1016/j.neuroimage.2006.09.051
Stummer, W., Reulen, H. J., Meinel, T., Pichlmeier, U., Schumacher, W., Tonn, J. C., et al. (2008). Extent of resection and survival in glioblastoma multiforme: identification of and adjustment for bias. Neurosurgery 62, 564–576. doi: 10.1227/01.neu.0000317304.31579.17
Szélenyi, A., Bello, L., Duffau, H., Fava, E., Feigl, G. C., Galanda, M., et al. (2010). Intraoperative electrical stimulation in awake craniotomy: methodological aspects of current practice. Neurosurg. Focus 28, E7. doi: 10.3171/2009.12.FOCUS09237
Tarapore, P. E., Findlay, A. M., Honma, S. M., Mizuiri, D., Houde, J. F., Berger, M. S., et al. (2013). Language mapping with navigated repetitive TMS: proof of technique and validation. Neuroimage 82, 260–272. doi: 10.1016/j.neuroimage.2013.05.018
Tarapore, P. E., Tate, M. C., Findlay, A. M., Honma, S. M., Mizuiri, D., Berger, M. S., et al. (2012). Preoperative multimodal motor mapping: a comparison of magnetoencephalography imaging, navigated transcranial magnetic stimulation, and direct cortical stimulation. J. Neurosurg. 117, 354–362. doi: 10.3171/2012.5.JNS112124
Van Honk, J., and Schutter, D. J. (2004). Transcranial magnetic stimulation and processing of facial threats. Am. J. Psychiatry 161:928; author reply 928–929. doi: 10.1176/appi.ajp.161.5.928
Yang, H., Susilo, T., and Duchaine, B. (2016). The anterior temporal face area contains invariant representations of face identity that can persist despite the loss of right FFA and OFA. Cereb. Cortex. 26, 1096–1107. doi: 10.1093/cercor/bhu289
Keywords: brain mapping, repetitive navigated transcranial magnetic stimulation, face processing, neuropsychology, preoperative mapping
Citation: Maurer S, Giglhuber K, Sollmann N, Kelm A, Ille S, Hauck T, Tanigawa N, Ringel F, Boeckh-Behrens T, Meyer B and Krieg SM (2017) Non-invasive Mapping of Face Processing by Navigated Transcranial Magnetic Stimulation. Front. Hum. Neurosci. 11:4. doi: 10.3389/fnhum.2017.00004
Received: 16 August 2016; Accepted: 04 January 2017;
Published: 23 January 2017.
Edited by:
Juliana Yordanova, Bulgarian Academy of Sciences, BulgariaReviewed by:
Anthony Joseph Ryals, University of North Texas, USAFilippo Brighina, University of Palermo, Italy
Copyright © 2017 Maurer, Giglhuber, Sollmann, Kelm, Ille, Hauck, Tanigawa, Ringel, Boeckh-Behrens, Meyer and Krieg. This is an open-access article distributed under the terms of the Creative Commons Attribution License (CC BY). The use, distribution or reproduction in other forums is permitted, provided the original author(s) or licensor are credited and that the original publication in this journal is cited, in accordance with accepted academic practice. No use, distribution or reproduction is permitted which does not comply with these terms.
*Correspondence: Sandro M. Krieg, c2FuZHJvLmtyaWVnQHR1bS5kZQ==