 Saad Arif
 Muhammad Jawad Khan
 Noman Naseer
 Keum-Shik Hong
 Hasan Sajid1,2
- 1School of Mechanical and Manufacturing Engineering, National University of Sciences and Technology, Islamabad, Pakistan
- 2National Center of Artificial Intelligence (NCAI), Islamabad, Pakistan
- 3Department of Mechatronics Engineering, Air University, Islamabad, Pakistan
- 4School of Mechanical Engineering, Pusan National University, Busan, South Korea
A passive brain–computer interface (BCI) based upon functional near-infrared spectroscopy (fNIRS) brain signals is used for earlier detection of human drowsiness during driving tasks. This BCI modality acquired hemodynamic signals of 13 healthy subjects from the right dorsolateral prefrontal cortex (DPFC) of the brain. Drowsiness activity is recorded using a continuous-wave fNIRS system and eight channels over the right DPFC. During the experiment, sleep-deprived subjects drove a vehicle in a driving simulator while their cerebral oxygen regulation (CORE) state was continuously measured. Vector phase analysis (VPA) was used as a classifier to detect drowsiness state along with sleep stage-based threshold criteria. Extensive training and testing with various feature sets and classifiers are done to justify the adaptation of threshold criteria for any subject without requiring recalibration. Three statistical features (mean oxyhemoglobin, signal peak, and the sum of peaks) along with six VPA features (trajectory slopes of VPA indices) were used. The average accuracies for the five classifiers are 90.9% for discriminant analysis, 92.5% for support vector machines, 92.3% for nearest neighbors, 92.4% for both decision trees, and ensembles over all subjects’ data. Trajectory slopes of CORE vector magnitude and angle: m(|R|) and m(∠R) are the best-performing features, along with ensemble classifier with the highest accuracy of 95.3% and minimum computation time of 40 ms. The statistical significance of the results is validated with a p-value of less than 0.05. The proposed passive BCI scheme demonstrates a promising technique for online drowsiness detection using VPA along with sleep stage classification.
Introduction
Invasive and noninvasive techniques are used in brain–computer interface (BCI) for the detection and measurement of brain activities using different BCI modalities (Sun et al., 2020; Tortora et al., 2020). Invasive BCI is based upon placing electrodes inside the brain cortex under direct interaction with neurons and hence requires complex surgery, medical conditions, and greater risk of infections (Yoo et al., 2018; Alkawadri, 2019; Romanelli et al., 2019). Nowadays, partially invasive techniques like electrocorticography (ECoG) are more in use. In ECoG, the electrode array is placed inside the skull and directly above the cortex. It requires easier surgery, and medical conditions like the infectious risk are very less (Romanelli et al., 2019). Furthermore, it provides the best signal quality, and good temporal and spatial resolution (Volkova et al., 2019). However, the availability of subjects is still a difficult task for invasive BCI techniques. Contrarily, noninvasive BCIs are more commonly used due to no surgery requirements and the absence of medical risks (Sosnik and Ben Zur, 2020).
Noninvasive BCIs use either electrophysiological signal or hemodynamic response phenomenon-based modalities. Electrophysiological BCI modalities are electroencephalography (EEG), electrooculography (EOG), electrocardiography (ECG), and electromyography (EMG), which record neuronal brain activity, eye movement, heart rate, and muscle movement, respectively (Turnip et al., 2011; Nicolas-Alonso and Gomez-Gil, 2012; Nguyen et al., 2017). Hemodynamic response-based modalities use functional neuroimaging models like functional near-infrared spectroscopy (fNIRS) and functional magnetic resonance imaging (fMRI), which record brain activity from changes in blood flow and blood oxygen levels in the active areas due to neuronal firing (Ni et al., 2017; Lasek-Bal et al., 2018; Yoo et al., 2018; Al-Zubaidi et al., 2019). Another functional BCI modality is magnetoencephalography (MEG), which is based upon recording the magnetic field in response to the electrical activity of neurons at active regions of the brain (Welvaert and Rosseel, 2014; Naseer and Hong, 2015). EEG and fNIRS BCIs are more widely used in detecting brain activity due to their low cost and better performance features (Borragan et al., 2018; Wascher et al., 2018; Rupp et al., 2019). Hybrid BCIs are also used, which include combinations of EEG, fNIRS, ECG, EOG, EMG, or other techniques depending upon which activities are to be recorded simultaneously for a specific task (Ahn et al., 2016; Choi et al., 2017; Nguyen et al., 2017; Hong et al., 2018). Among functional techniques, fNIRS is more safe, reliable, low-cost, portable, and easy to set up and has a good spatial resolution (Wolpaw et al., 2002; Ramadan and Vasilakos, 2017; Zhao et al., 2018). It measures changes in concentration of oxygenated hemoglobin (ΔHbO), deoxygenated hemoglobin (ΔHbR), total hemoglobin or cerebral blood volume (ΔHbT), and cerebral oxygen exchange (ΔCOE) as a measure of brain activity in active regions resulted from neuronal consumption of glucose, measured by optical sensors using near-infrared light signals that are directly introduced into the scalp, and hence, it is free from noise and electrical interference (Tanveer et al., 2019; Wang et al., 2019; Khan M.N.A. et al., 2020; Khan R.A. et al., 2020).
Brain activities are recorded and classified under active, reactive, and passive states of BCI (Zander and Kothe, 2011). Active BCI records brain activity generated due to intentional actions like mental computation tasks, motor imagery, and motion intents. Reactive BCI records brain activity produced in response to some external stimuli like audio, video, touch, or pain signal introduction (Hong and Khan, 2017; Khan and Hong, 2017; Khan M.J. et al., 2018). Active and reactive brain signals can be more easily generated and detected, unlike passive brain activities. Passive brain activities are produced unintentionally by a human brain under certain body conditions like drowsiness, sleep, fatigue, stress, loss of attention, or focus (Khan and Hong, 2015; Tanveer et al., 2019; Dunbar et al., 2020). These passive states imply very crucial effects when arising during high attention-seeking tasks like vehicle driving. Drowsiness or sleep during driving causes severe accidents worldwide (Philip and Åkerstedt, 2006; Ismail et al., 2009). Conventional techniques to detect drowsiness may include measuring the eye blink rate, heart rate, or head movement with increased chances of false detections. However, a passive BCI system is more preferred to detect drowsiness conditions from brain signals, and an activity can be well estimated earlier and in a precise manner. fNIRS-based BCI is also used to detect brain states due to fatigue or sleep loss (Ioannides, 2018). This activity is recorded from the prefrontal cortex (PFC) and specifically from dorsolateral PFC (DPFC) (Khan and Hong, 2015; Tanveer et al., 2019). Studies have shown rapid and increased brain activity in the DPFC region under brain state transitions from wakefulness to non-rapid eye movement (NREM) sleep stages (Khan and Hong, 2015; Bernardi et al., 2018). This results in increased concentrations of ΔHbO and decreases in ΔCOE, which indicates sleep as a refreshing process (Khero et al., 2019; Oniz et al., 2019). During driving, these rapid changeovers between sleep stages (as experienced when a person is consistently nodding off) could be devastating and must be recorded at an earlier stage to avoid life losses (Fonseca et al., 2018; Dai et al., 2020).
This study investigates a novel drowsiness detection scheme using hemodynamic activities of the brain with a passive BCI. Hemodynamic brain signals are acquired from the right DPFC using eight channels of the fNIRS system. All the hemodynamic signals are plotted upon vector phase analysis (VPA) to get the cerebral oxygen regulation (CORE) status of the brain. Sleep stage-based threshold circles are employed on VPA, which resulted from systematically proposed criteria. The criteria deduce radii of sleep stage (N1, N2, and N3) threshold circles from sample data of wakefulness (W) stage of the subject. As CORE status is constantly monitored over VPA against threshold circles, drowsiness activity is detected when the CORE trajectory crosses threshold circles in specific octants of VPA. The universality and validity of proposed threshold circle criteria for any subject is the core and fundamental objective of this work. The criteria of threshold circles are validated over fNIRS data of 13 subjects. A total of nine features are used for training and classification, out of which six features are extracted from VPA and three statistical features from ΔHbO signal. Five machine learning classifiers [discriminant analysis (DA), support vector machines (SVM), decision trees (DT), k-nearest neighbors (kNN), and ensembles] are used to classify the data of all the subjects according to the proposed scheme. Slopes of CORE vector magnitude and angle are the best feature pair along with the SVM classifier to perform well overall.
Materials and Methods
Subjects/Participants
To collect this drowsiness dataset (Khan and Hong, 2015; Tanveer et al., 2019), 13 healthy male subjects (mean age: 28.5 ± 4.8 years) were recruited. Two of them were left-handed, and all had normal or corrected-to-normal vision. Neither of them was reported to have any psychiatric, visual, or neurological disorder. All the participants willingly consented when details about the experimental procedure were explained. The study was reviewed and approved by Pusan National University Institutional Review Board.
Experimental Procedure
The experiment was conducted in the morning before which all subjects were sleep-deprived for 10 h the night before. Participants were subjected to car driving in a simulated environment with medium traffic and pedestrian density. Brain signals for 5 min were collected for baseline adjustment during initial driving trials for environment familiarization. Each subject drove the car for almost 1 h in which fNIRS signals were collected for 30 ± 5 min when they were visually observed to be near drowsy. Biomarkers for the drowsy state were placed when a change in facial expressions or eye closure was observed due to sleep loss or fatigue. Subjects remained seated in comfortable chairs and were asked to minimize head or muscle movements to avoid motion-related artifacts in brain signals. Figure 1 shows the flow diagram of the experimental procedure.
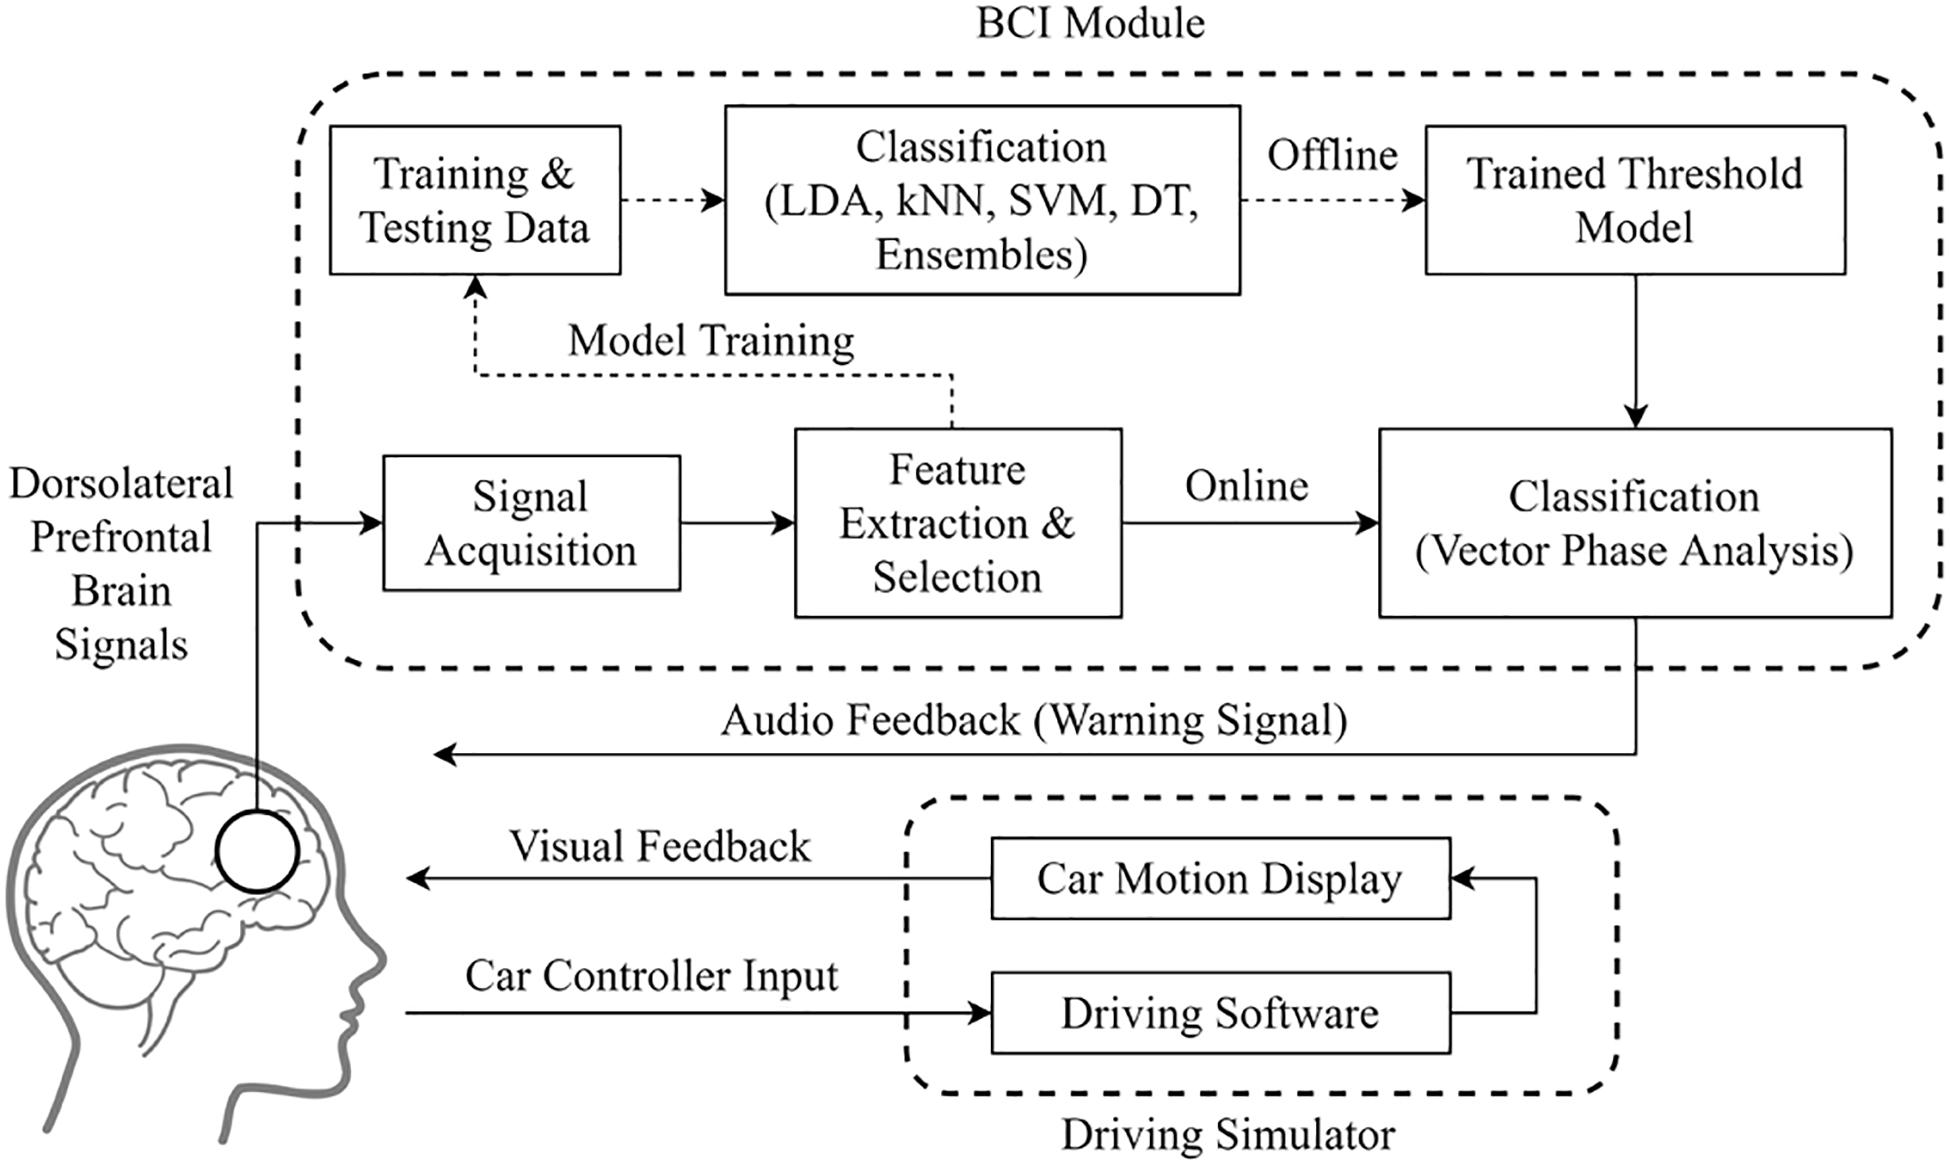
Figure 1. Experimental setup and its flowchart for drowsiness detection.
Sensor Configuration
Seven sources with 16 detectors of the near-infrared range were used to make combinational pairs of 28 channels to acquire fNIRS signals over various brain locations. Optodes for these 28 channels were placed at PFC and DPFC according to the international 10–20 system. The distance between adjacent detectors was 3 cm, and the distance between source and detector was 2.1 cm. These 28 channels were further divided into three regions (A, B, and C). Region A comprises channels 1–8, which were placed at the right DPFC as shown in Figure 2. Channels 9–20 were regarded as region B and placed at PFC. Channels 21–28 were placed at left DPFC and specified as region C. Right DPFC (region A) is proved to be more suitable and effective for drowsiness-related activity detection (Khan and Hong, 2015; Tanveer et al., 2019). In this research work, fNIRS data from channels 1–8 (region A) are focused on sleep detection in online passive BCI applications.
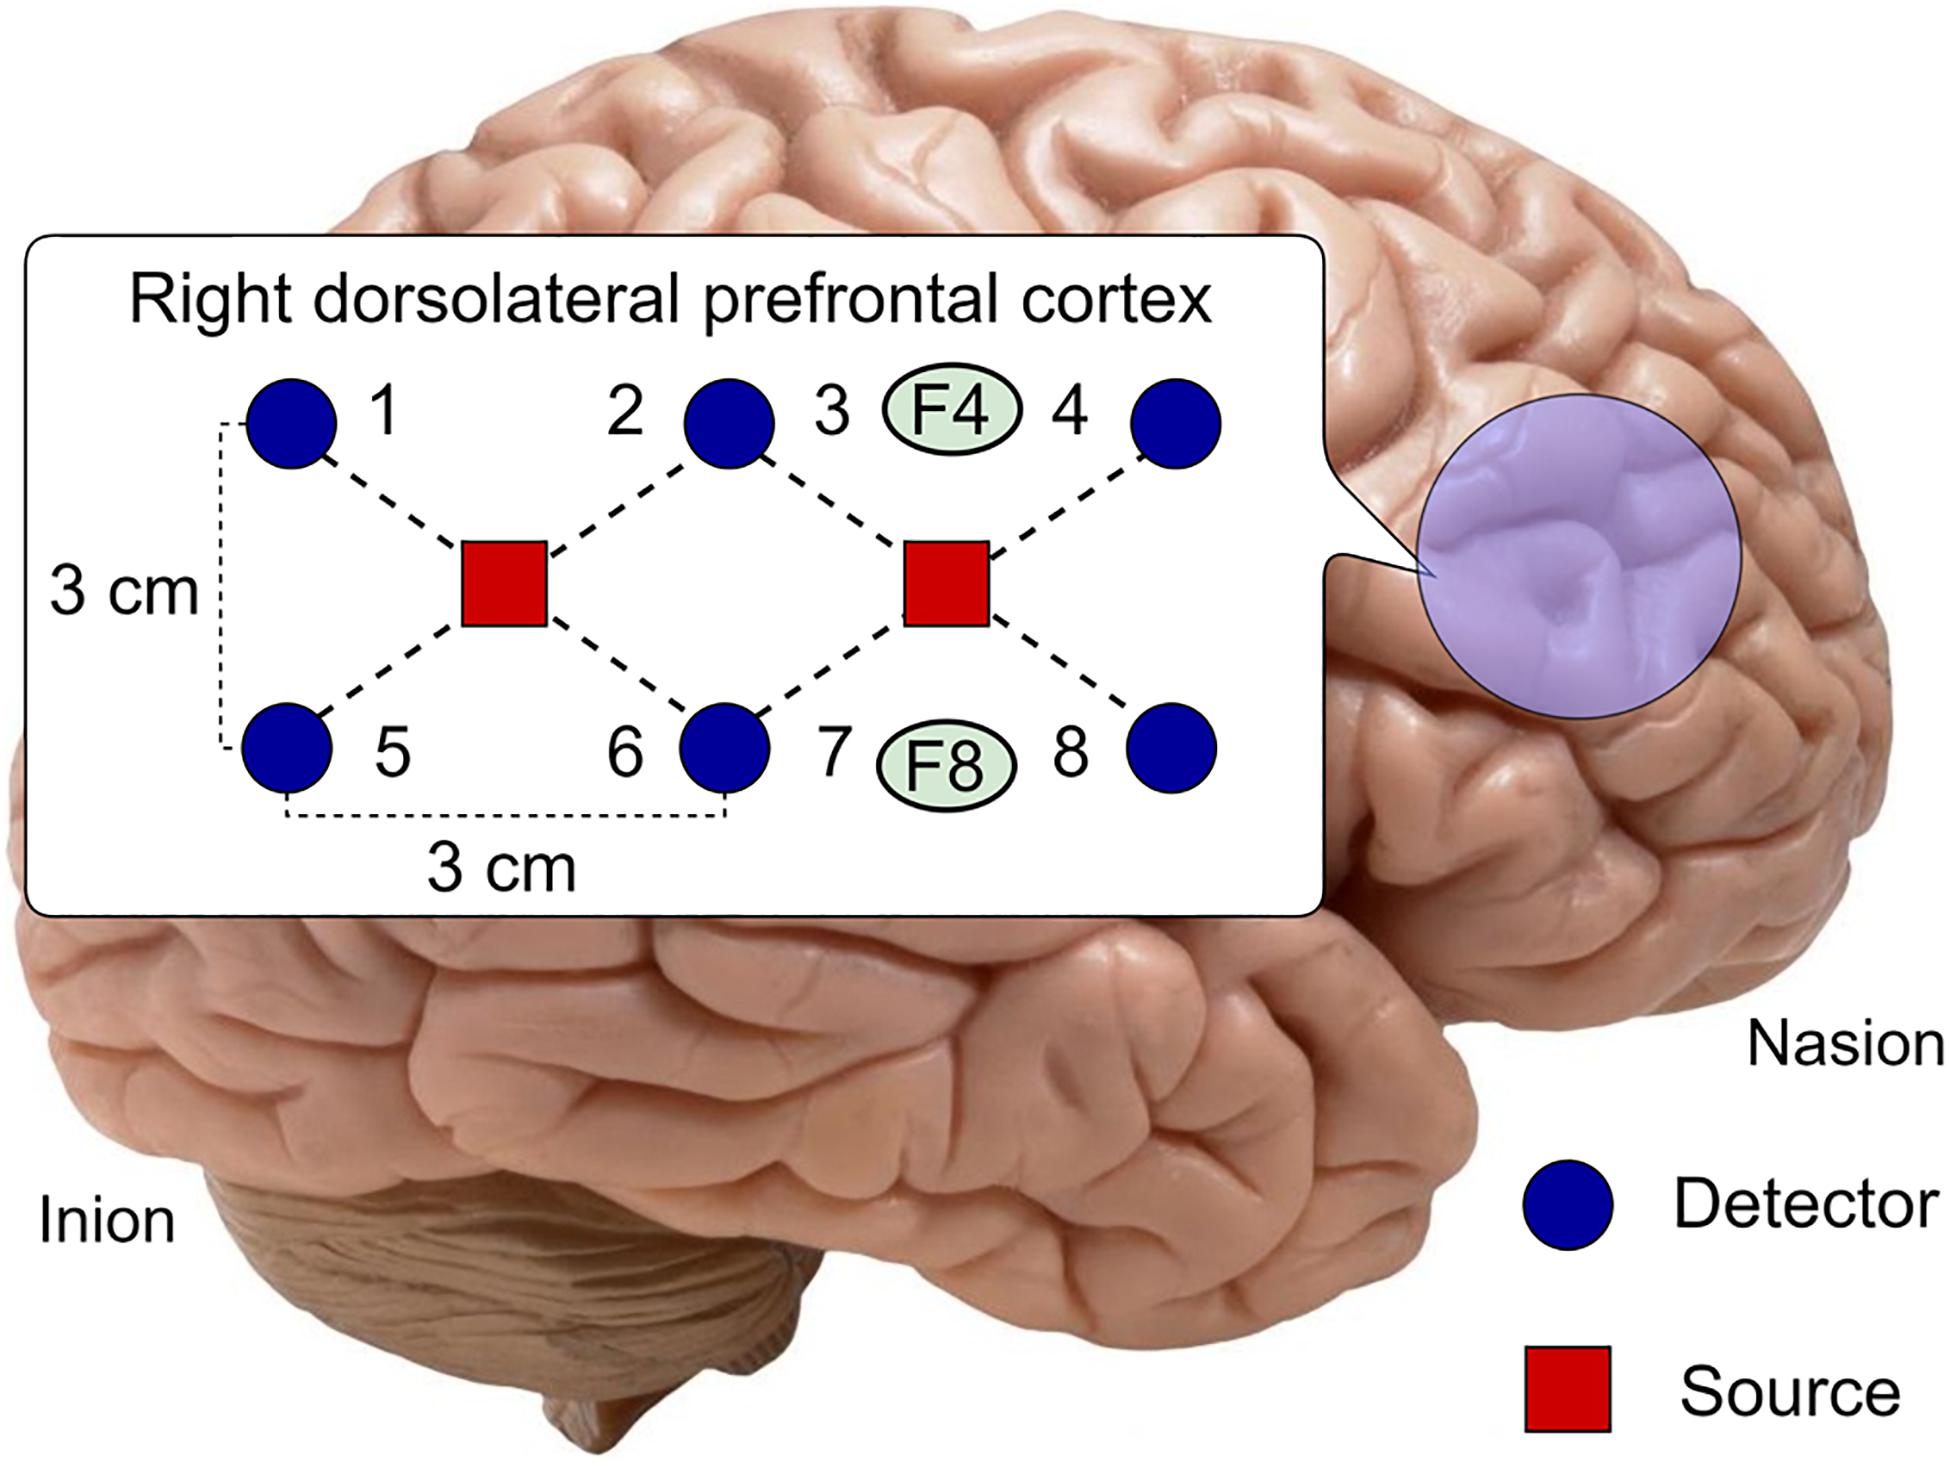
Figure 2. Optode placement at Region A (right dorsolateral prefrontal cortex), channels 1–8.
Signal Acquisition and Processing
A continuous-wave imaging system (DYNOT, NIRx Medical Technologies, United States) was used for fNIRS brain signal acquisition. Data were obtained at a sampling frequency of 1.81 Hz with near-infrared lights of 760 and 830 nm wavelengths. Motion-related and other artifacts were removed from the acquired data by applying Gaussian filters (Bhutta et al., 2014; Khan and Hong, 2015; Zafar and Hong, 2018). Band rejection of ranges 0.3∼0.4, 1∼1.2, and <0.01 Hz were used for respiration, heartbeat, and Mayer-wave artifact removal, respectively. Oxygenated and deoxygenated hemoglobin concentration changes (ΔHbO and ΔHbR, respectively) were obtained by converting raw intensity values of two different wavelengths by using modified Beer–Lambert law (MBLL). The MBLL is stated as,
where A is the absorbance of light (optical density), Iin is the incident intensity of light, Iout is the detected density of light, α is the specific extinction coefficient in μM–1 cm–1, c is the absorber concentration in μM, l is the distance between the source and the detector in cm, d is the differential path-length factor (DPF), and η is the loss of light due to scattering.
Vector Phase Analysis
If the hemodynamic indicators of fNIRS signals (ΔHbO and ΔHbR) are mapped as orthogonal axes in an orthogonal vector coordinate plane, then they give rise to a very promising scheme regarded as VPA method as shown in Figure 3. When this orthogonal coordinate plane is rotated by an angle of π /4 rad counterclockwise, then it adds up new useful components in this vector plane: ΔHbT and ΔCOE (due to neurovascular coupling) (Yoshino and Kato, 2012; Hong and Naseer, 2016; Hong et al., 2018; Zafar and Hong, 2018; Nazeer et al., 2020a). These indices are defined as,
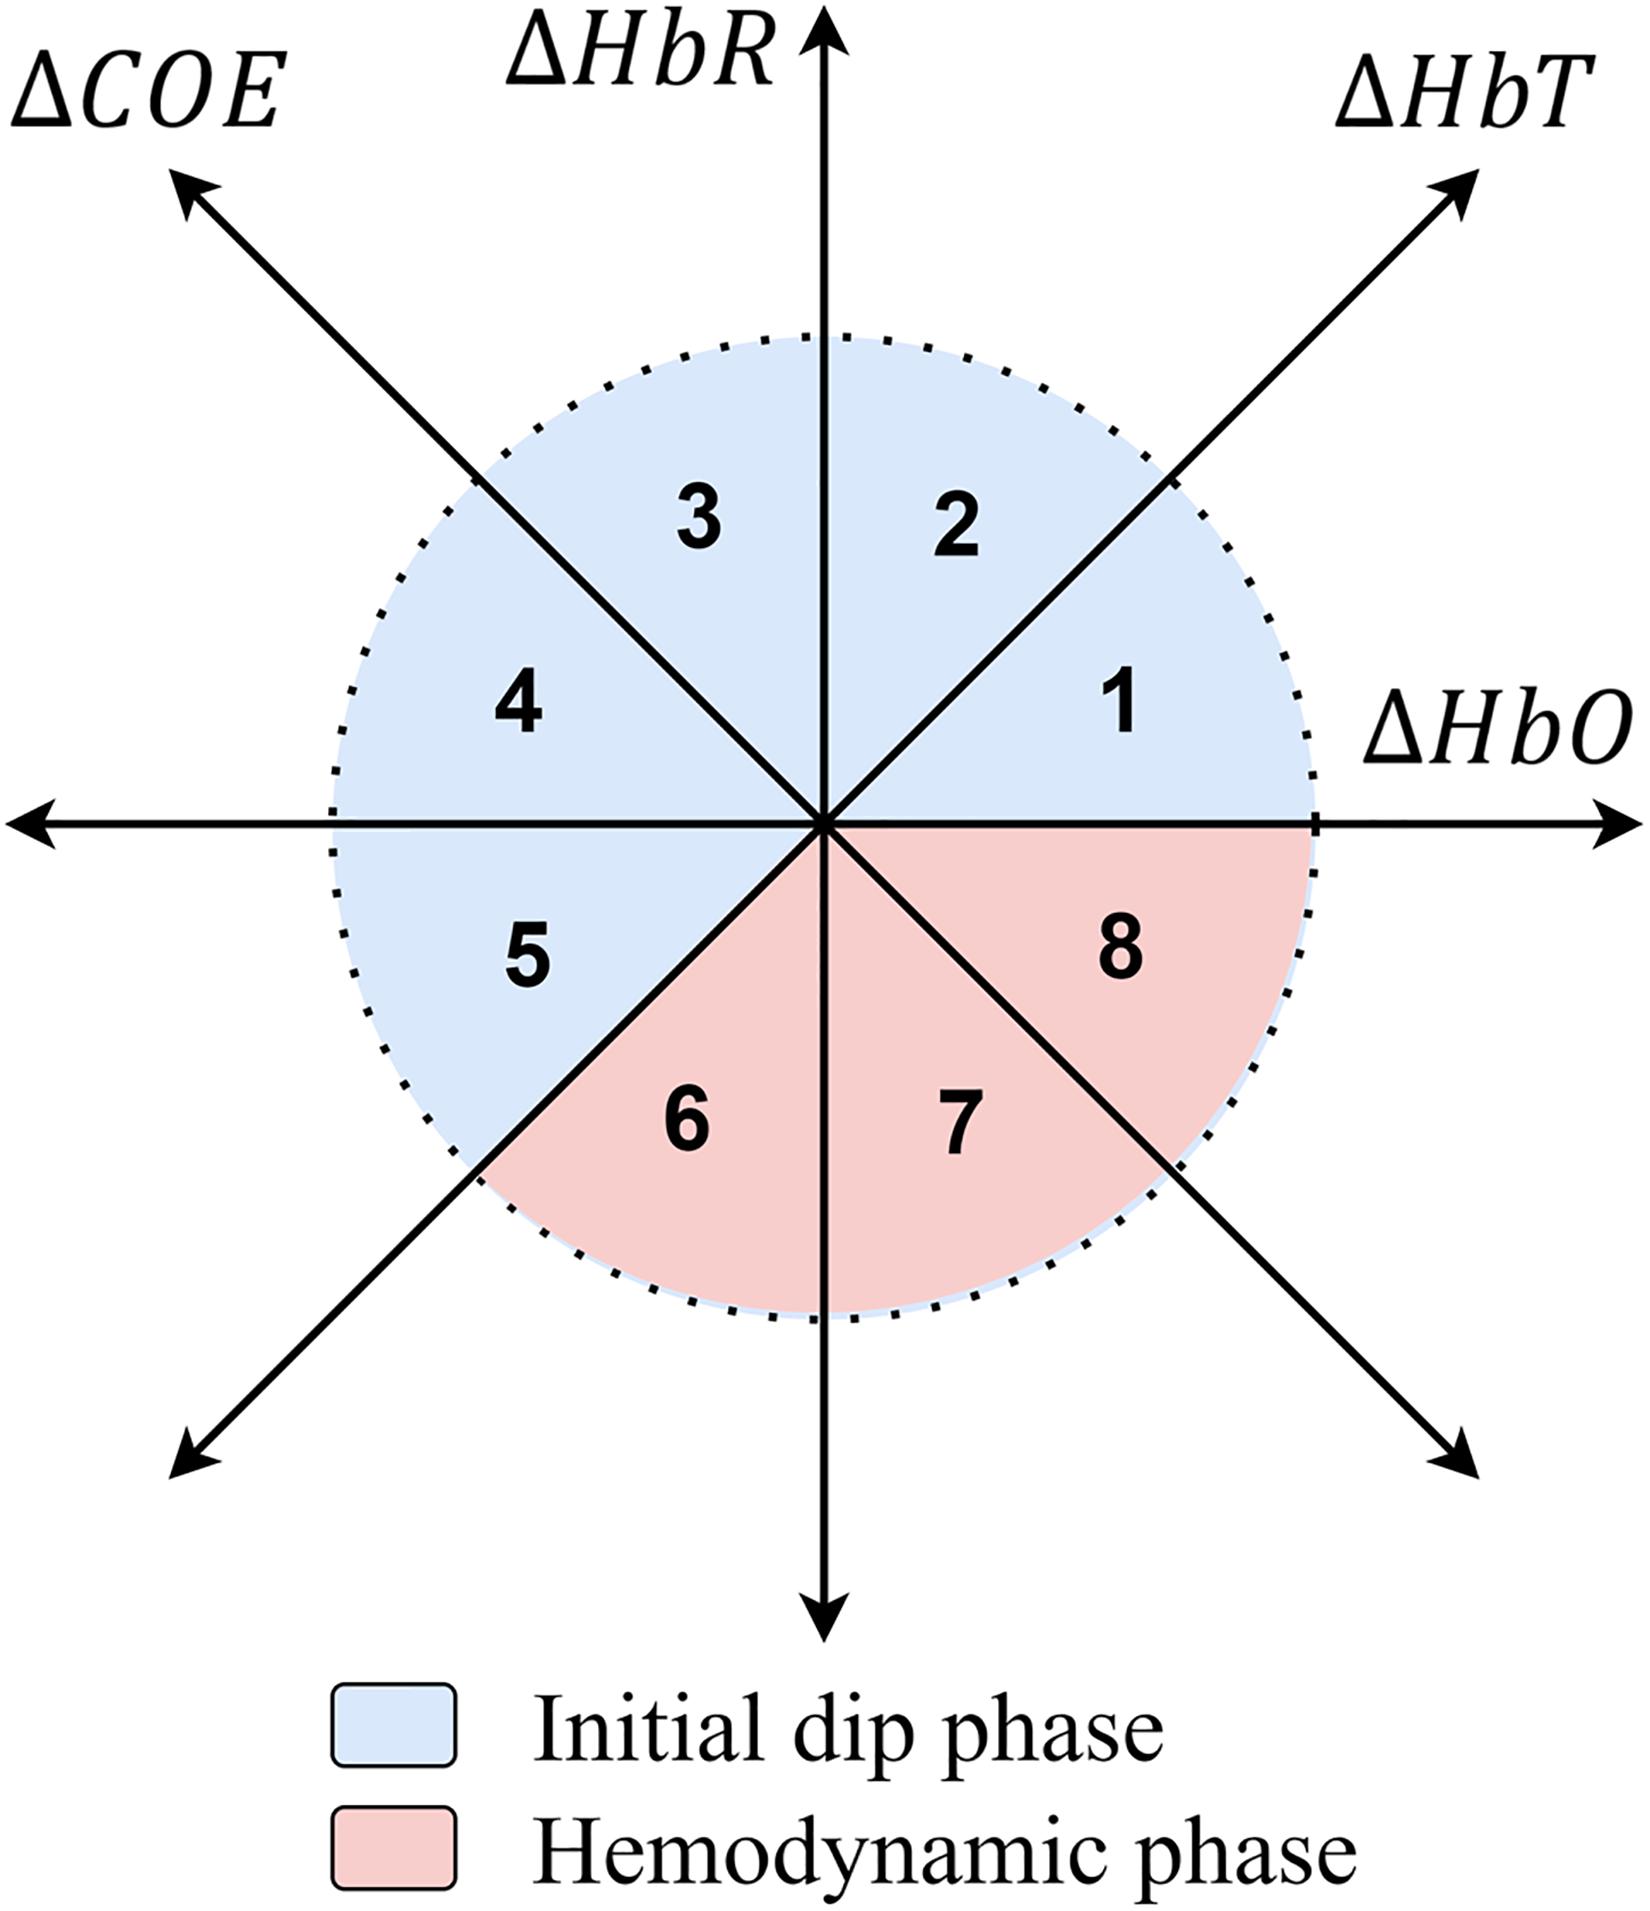
Figure 3. Vector phase diagram (Hong and Naseer, 2016).
The relationship among all these four hemodynamic indices is given in the following mathematical notation.
Any point on this vector coordinate plane holds a value-based upon four indices ΔHbO, ΔHbR, ΔHbT, and ΔCOE; and its distance from the origin specifies a vector R that reveals information about CORE (Yoshino and Kato, 2012; Hong and Naseer, 2016; Nazeer et al., 2020a). The magnitude |R| and angle ∠R of vector R are stated below.
Based upon axes of this vector coordinate plane, it is divided into eight octants, each of which represents specific hemodynamic features of the fNIRS brain signal as shown in Figure 3. These octants are referred to as phases indicating oxygenated (oxic) and deoxygenated (capnic) states of the brain. Increased and decreased blood oxygenation refers to hyperoxic (HerOx) and hypoxic (HyOx) states (Dart et al., 2017), while increased and decreased blood deoxygenation refers to hypercapnic (HerCap) and hypocapnic (HyCap) states of the brain, respectively (Smith et al., 2017). All these CORE states and hemodynamic signal features in these phases are tabulated in Table 1.
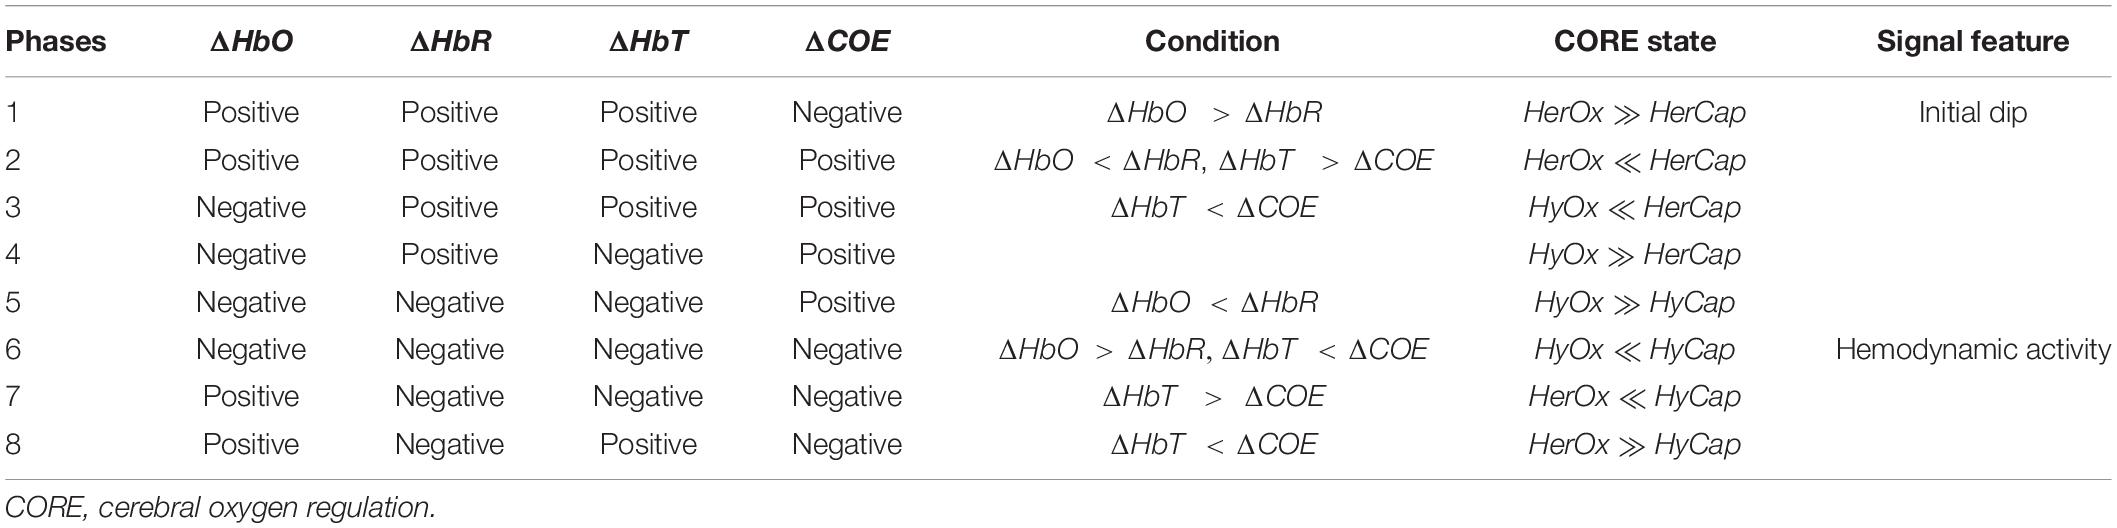
Table 1. Characteristics of different phases in the vector phase diagram.
Sleep Stage-Based Threshold Circles
Long sleep deprivation may cause brain sleep or hallucinations while a person seems awake. In such cases, drowsiness can instantly lead the human brain through various sleep stages (Craik et al., 2019; Ko et al., 2020). Moreover, in such a condition of drowsiness, if the brain is being forced to focus, then it can result in frequent state changeovers between wakefulness and sleep stages, for example, repetitively nodding off while driving in a drowsy state. Drowsiness is interrelated with sleep in terms of physical symptoms and effects on human brain hemodynamics. Sleep stages are NREM sleep and rapid eye movement (REM) sleep. NREM has further three stages: N1, N2, and N3 representing light sleep, medium sleep, and deep sleep, respectively (Ahn et al., 2016; Oniz et al., 2019). The sleep cycle starts when wakefulness is followed by NREM stages and REM sleep (Van Wyk et al., 2019; Chi et al., 2020). The main feature of drowsiness is slow rolling eye movements (SREM), which are associated with the N1 stage or light sleep. fNIRS studies have investigated brain hemodynamics during various sleep stages and discussed CORE dynamics related to sleep (Oniz et al., 2019). It is conceived that there is a relationship between hemodynamics of sleep stages and W. If CORE dynamics of W is known, then CORE of sleep stages can be deduced from it according to a somewhat fixed relationship as shown in (10). Mean CORE status during W of any subject can be accessed by collecting |R| of fNIRS brain signal for a specific duration and taking its mean. Mean |R| of NREM sleep stages can be deduced from mean |R| of W stage according to the following relationships.
where represents ,,,, which are the sample means of phase diagram vectors’ magnitude for W, N1, N2, and N3, stages, respectively; and n is the number of samples used for mean values computation from the respective sample spaces.
Eqs. (9, 10) give the radii of threshold circles for W and NREM stages in the vector phase diagram as shown in Figure 4. These threshold circles along with the VPA diagram are employed to detect drowsiness activity when the fNIRS brain signal trajectory follows a specific pattern according to CORE states. Eq. (9) is evaluated for all eight channels of right DPFC for each subject with sample space spanning over 5 min of W state. Once is obtained, Eq. (10) is evaluated for all channels of each subject to obtain ,,.
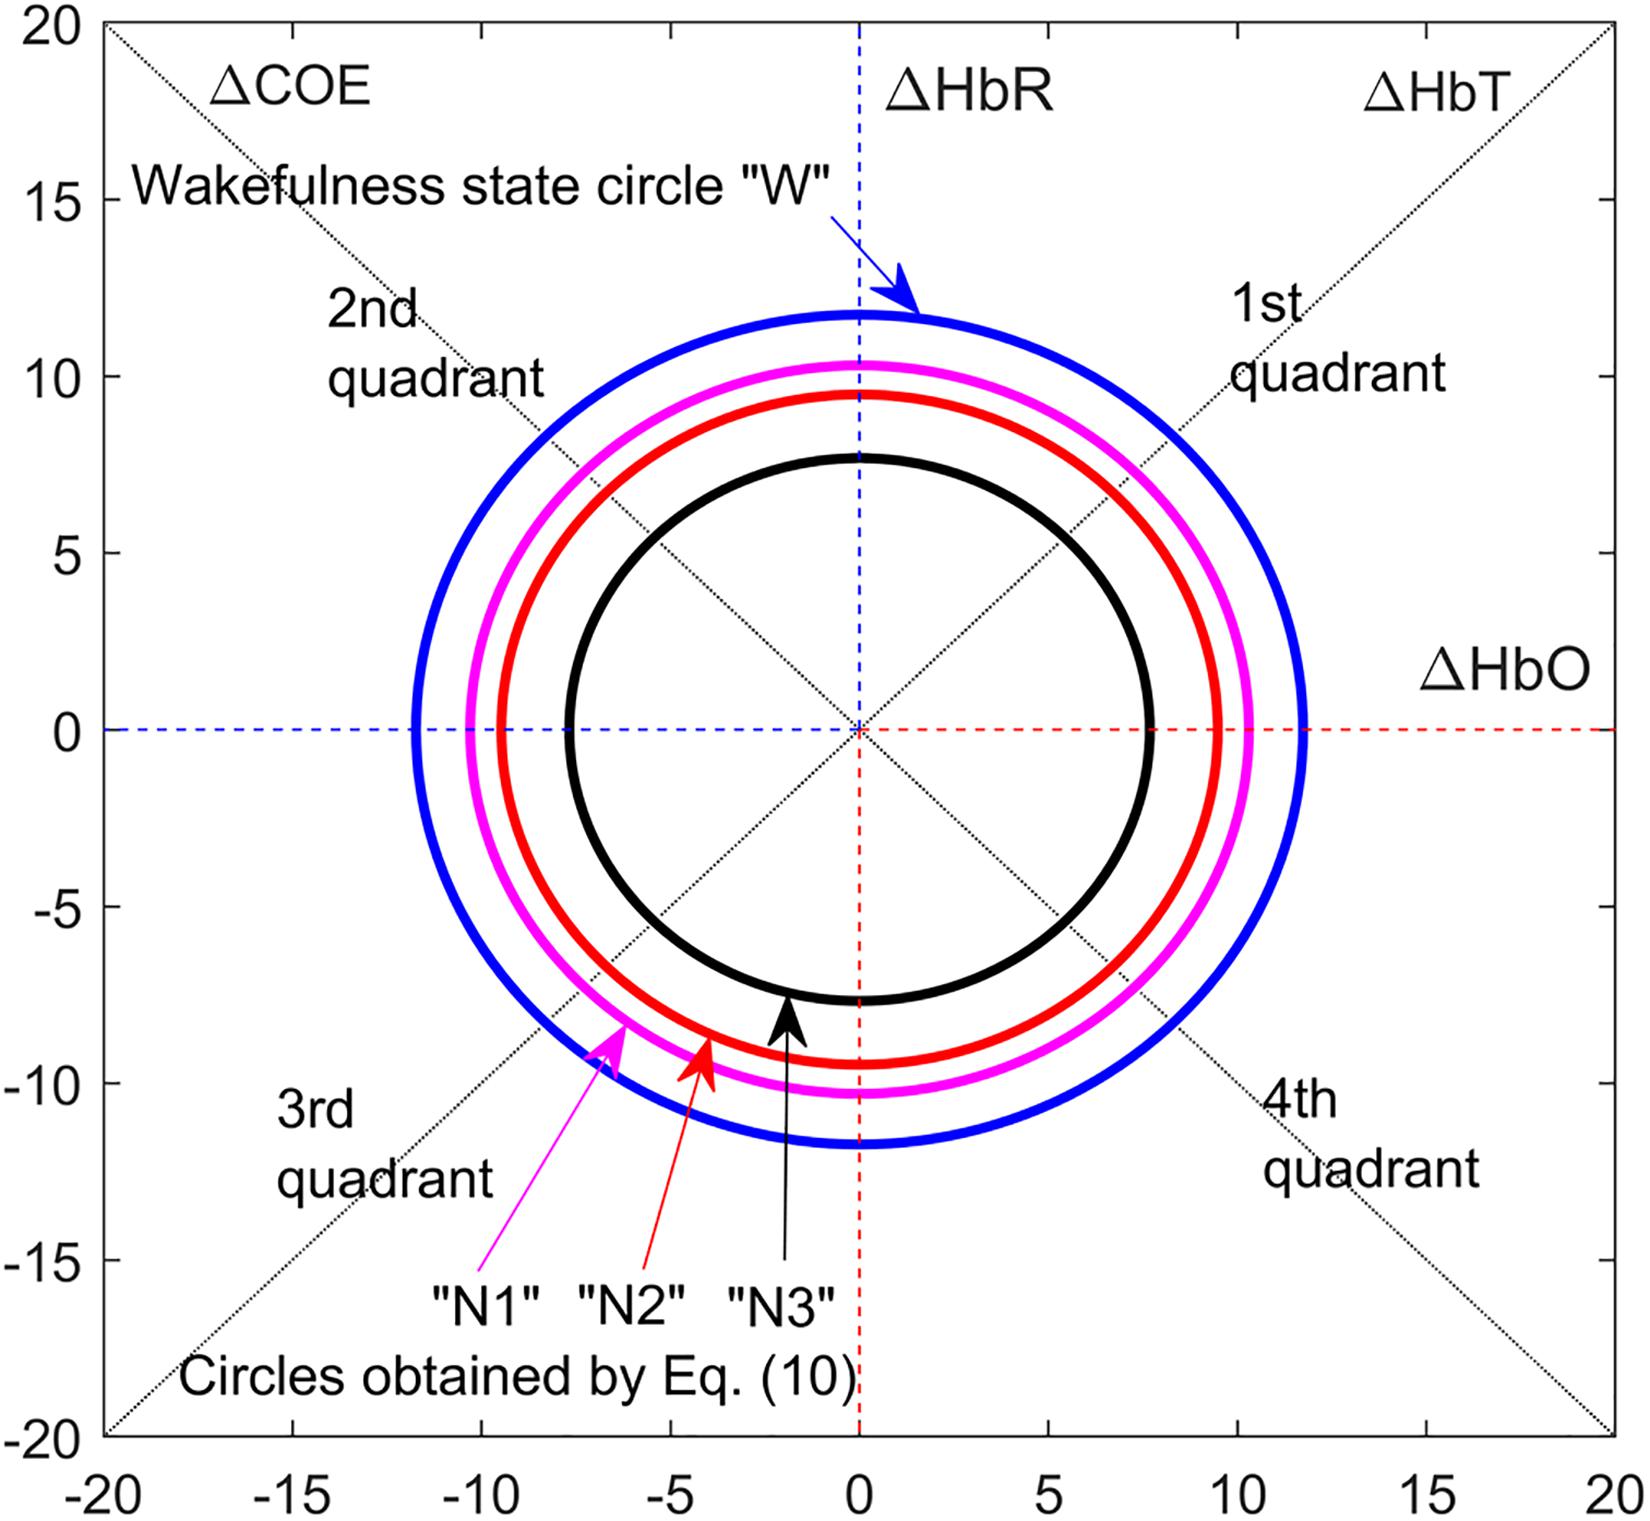
Figure 4. Threshold circles of wakefulness and non-rapid eye movement (NREM) sleep stages employed for drowsiness detection and sleep stage classification, obtained from Eqs. (9, 10).
Vector Phase Analysis Trajectory Pattern for Drowsiness Detection
During wakefulness, focus/attention-seeking tasks, neurons consume more glucose, resulting in increased ΔCOE, and the brain experiences HerCap as well as HyOx CORE states (Skalski and Dobrakowski, 2020; Tung et al., 2020). So the VPA trajectory mostly remains in phases 3 and 4 of the vector phase diagram (second quadrant). Loss of focus/attention or drowsiness results in a decrease in mental activity, and hence, a decrease in ΔCOE is observed. The brain experiences HerOx as well as HyCap CORE states, and the VPA trajectory mostly remains in phases 7 and 8 of the vector phase diagram (fourth quadrant). It has been noted that transitioning from wakefulness to sleep increases the oxygen levels in the blood (Khero et al., 2019; Oniz et al., 2019), so ΔHbO rises as well as ΔCOE falls gradually. Eventually, the brain has higher ΔHbO and lower ΔHbR levels by the end of sleep (Oniz et al., 2019). The key to early detection of drowsiness activity is to capture this CORE state transition from HyOx and HerCap to HerOx and HyCap states (Chuang et al., 2018; Lin et al., 2020). At each instance, CORE state points are plotted upon vector phase diagram using Eqs. (7, 8), and a trajectory is obtained. To detect drowsiness activity, an angle criterion and a magnitude criterion for this trajectory are defined as shown below.
where n is the number of samples required to find the mean angle and mean magnitude for the duration of 0–5 s time window, which is reported to be the shortest to find the drowsiness activity (Khan and Hong, 2015). It is to be noted that the angle criterion is of primary importance here, and it must be satisfied before the magnitude criterion holds. Drowsiness activity is successfully detected when relationships (11) and (12) hold and the VPA trajectory crosses the threshold circle of W state in phases 7 and 8 of the vector phase diagram as shown in the section “Results.”
Feature Space and Classification
To standardize the threshold circle criteria as a standard framework for any subject to detect activity online, comprehensive testing and validation are need (Koo and Choi, 2020). So to further test and justify this criterion based on sleep stages, multiclass classification is done with various classifiers and different feature spaces (Kang et al., 2020; Sung et al., 2020). As drowsiness detection is intended from VPA, six features were selected by keeping in view the promising information of vector phase diagram, which are trajectory slopes of VPA indices and parameters; m(ΔHbO), m(ΔHbR), m(ΔHbT), m(ΔCOE), m(∠R), and m(|R|). Other three statistical features were extracted from ΔHbO time signal, namely, signal mean (M), signal peak (P), and the sum of peaks (SoP), which were reported to be the best suitable features of fNIRS signal for binary class classification of drowsiness activity (Khan and Hong, 2015; Tanveer et al., 2019; Nazeer et al., 2020a). All features were computed for the 0–5 s time window for all subjects according to the following relations.
where k is the sample vector for 0–5 s time window with N as the last sample in it, X is the variable for six parameters of the vector phase diagram and m(ΔX) is slope or gradient of these parameters over k, and Mk is the mean value of ΔHbO in k. P was calculated as the maximum value of local maximums of ΔHbO in k by using max and findpeaks functions of MATLAB 9.5 (MathWorks, United States). SoP was computed as a summation of local maximums calculated above.
After feature extraction, feature scaling was done in the range [a b]=[−1 1] for all features by using min–max normalization as stated below.
where Y is original value and Y′ is rescaled/normalized value of the feature in the said range.
These rescaled features are further employed in multiclass classifiers for training and testing the dataset using DT, DA, SVM, kNN (Zhu et al., 2019; Ali and Park, 2020; Kim et al., 2020; Li et al., 2020), and ensemble classifiers. For better classification of samples in the respective classes, the value of k is set to 1 in the kNN classifier. To cater to the nonlinearity with SVM classifier, fine Gaussian SVM is used with radial basis function kernel and c=0.5. The dataset comprises all observations from all channels of region A for all subjects. For training and testing of the data and to analyze the performance of all classifiers, 10-fold cross-validation is used to find an optimal separation between W, N1, N2, and N3 stages in this four-class classification problem. The multiclass classification performance evaluation is validated with the help of the confusion matrix, receiver operating characteristic (ROC) curves, and their area under the curve (AUC). The parameters true-positive rate (TPR), false-negative rate (FNR), true-negative rate (TNR), false-positive rate (FPR), positive predictive value (PPV), and false discovery rate (FDR) are calculated to find out sensitivity, miss rate, specificity, fall-out, and precision using following equations, respectively.
Results
This study proposes a novel online classification technique for the early detection of driver drowsiness using VPA. The outermost threshold circle is based on the mean CORE vector magnitude of the wakefulness state , which can vary subject-wise and can be deduced from initial baseline data. For this purpose, five trials per subject were performed at different time instants, where each trial period was 5 min followed by significant rest time to avoid fatigue effect. While inner threshold circles are based on mean CORE vector magnitude of NREM sleep stages N1, N2, and N3, ,, and are dependent upon the W circle according to a fixed relationship as in Eq. (10). CORE state points based upon ΔHbO and ΔHbR are continuously being plotted over vector phase diagram, and a continuous VPA trajectory is obtained as shown in Figure 5. Drowsiness activity is detected when the VPA trajectory crosses the W state threshold circle in phases 7 and 8 of the vector phase diagram according to the criterion of Eqs. (11, 12), showing a decrease in ΔCOE, which is an indicator of transition from W to NREM sleep. Trajectory computation and its slope assessment are done over a margin of 5 s to avoid false detection through this scheme. The results obtained using the proposed scheme for all the channels of region A of Subject 1 are shown in Figure 5. The active channels are highlighted with shaded boxes in which a trajectory crosses the threshold circles in the fourth quadrant of the phase diagram, indicating drowsiness activity detection.
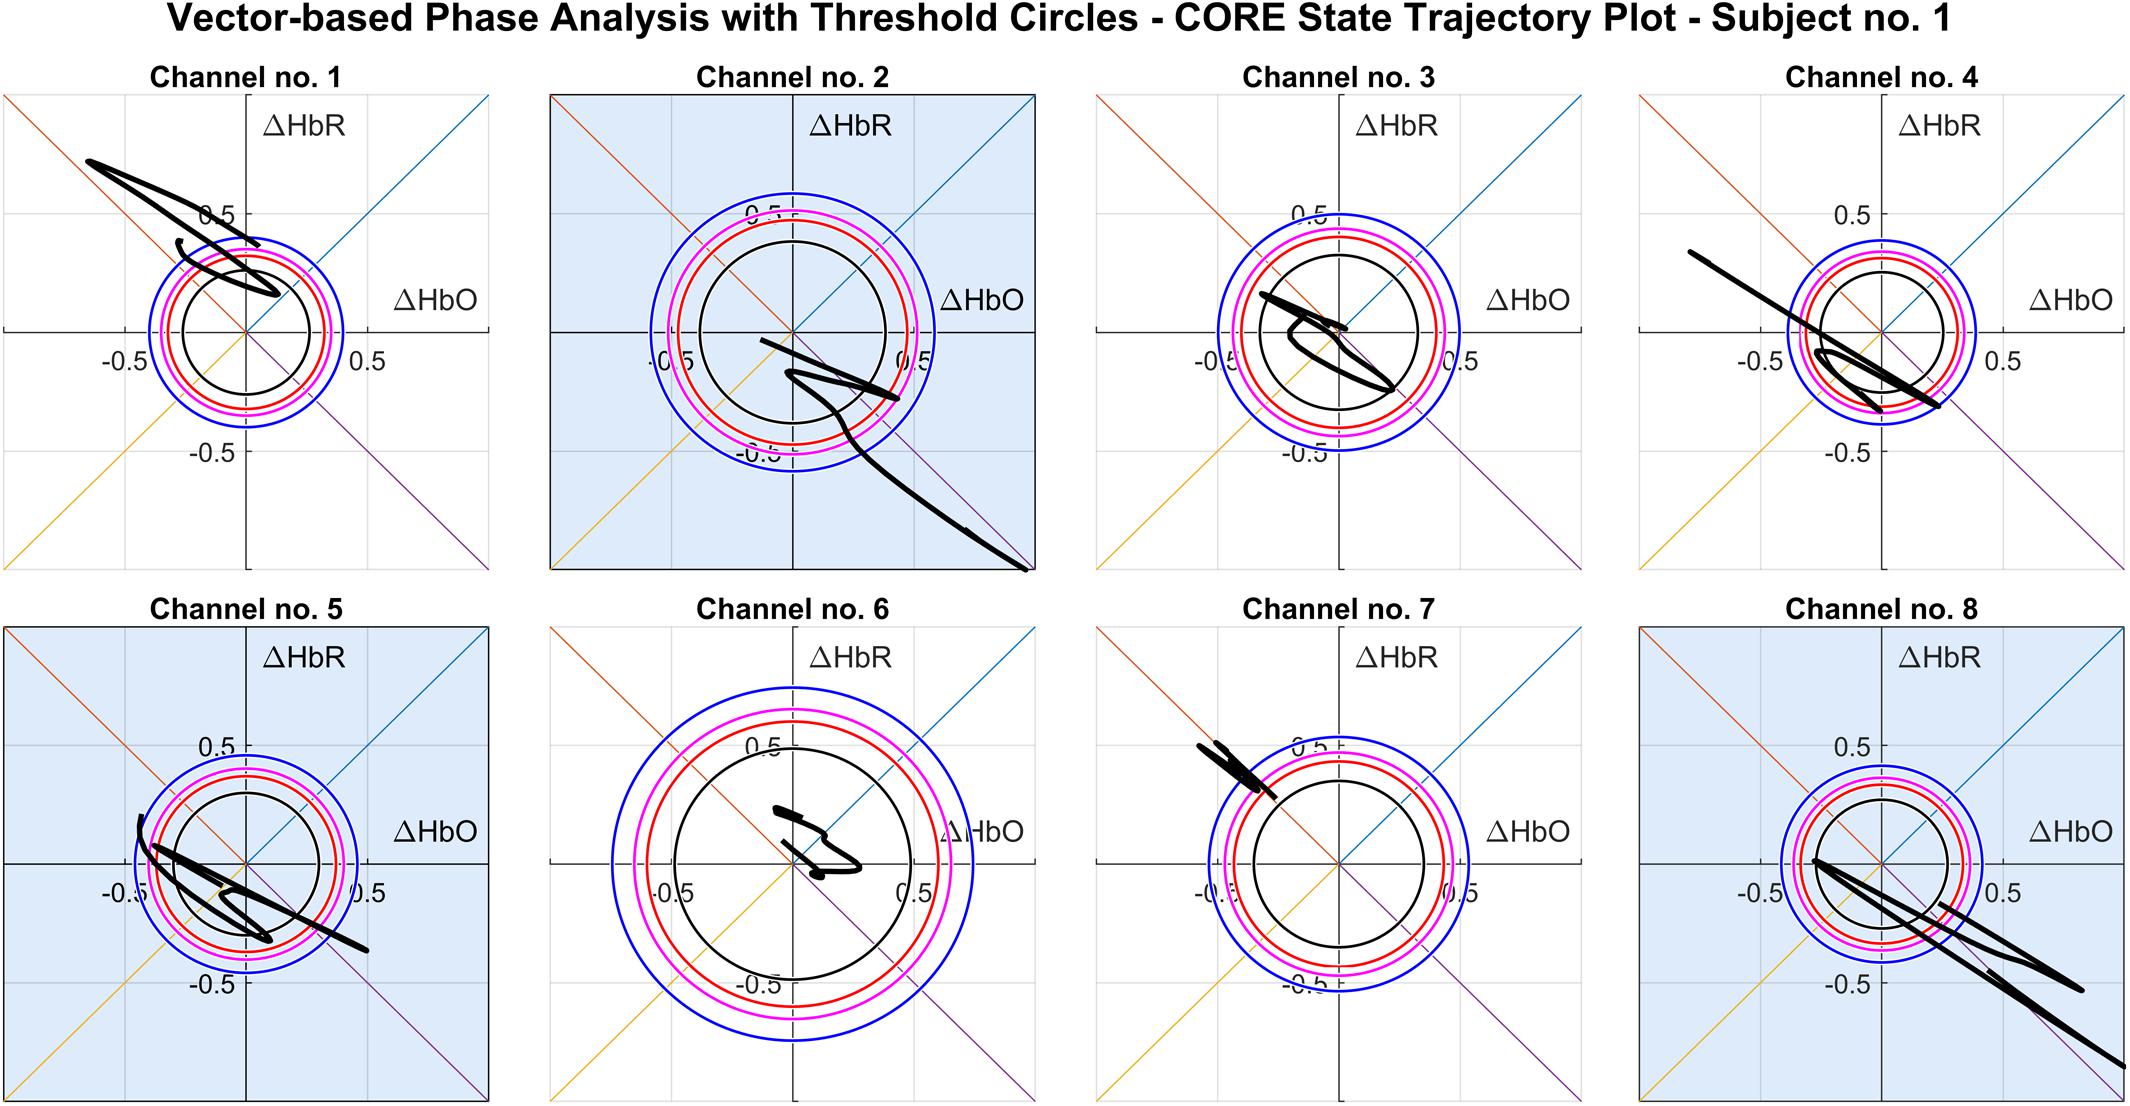
Figure 5. Vector phase analysis (VPA) trajectories of all channels (Subject 1) obtained by plotting Eqs. (7, 8) at the drowsiness stage. The shaded boxes show the active detection channels in which trajectory has crossed the W threshold circle in the fourth quadrant according to the magnitude and angle criterion.
The active channels and consequently the precise brain region for drowsiness detection can be identified using this proposed novel scheme. Upon further assessment of active channels for all the subjects, Channel 8 turns out to be the most active channel among all and is situated near the F8 electrode position according to the 10–20 system. Figure 6 shows the successful drowsiness detection on Channel 8 of various subjects. It is to be noted that trajectory patterns are not the same as the active channel of different subjects. Trajectories could follow any path, but they must satisfy the proposed angle and magnitude criterion. Real-time signals of ΔHbO and ΔHbR could be used according to the proposed scheme to detect drowsiness online as soon as the onset of activity.
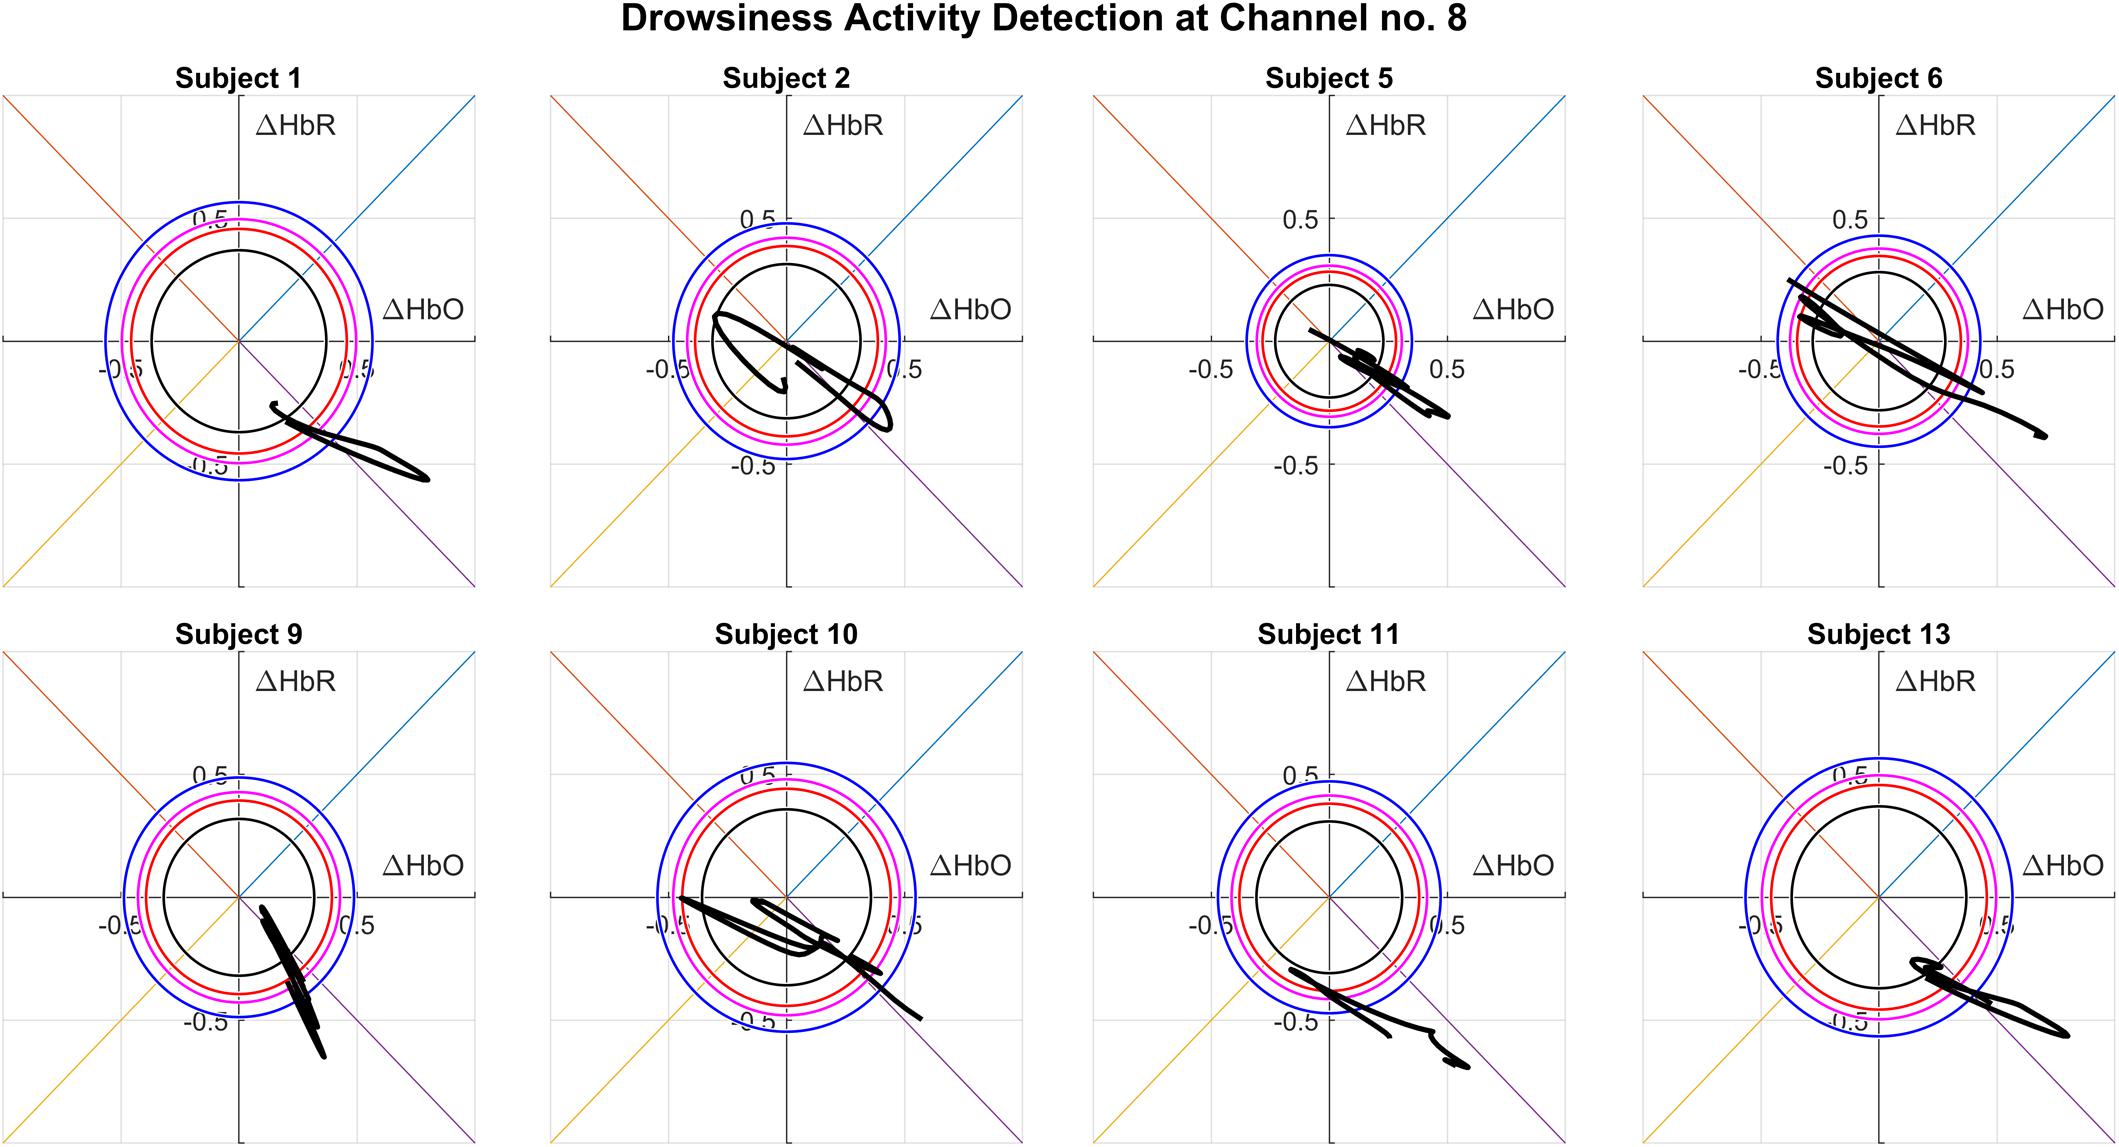
Figure 6. Vector phase analysis (VPA) trajectories of various subjects at an active channel (Channel 8) showing drowsiness activity detection, located at F8 electrode position of the 10–20 system.
The computation of sleep stage thresholds for any subject requires extensive system training and time-taking assessment each time. To avoid this need for retraining and reassessment, a universally applicable criterion is easier to follow each time for any subject with minimum system training requirements. In this study, such a criterion is proposed, which is universally applicable to any subject by only requiring baseline or reference data of wakefulness or resting state. The applicability of sleep stage-based threshold circle criteria for any subject needed extensive validation, which makes it a standard scheme in online detection systems.
For this purpose, multiple classifiers were trained and tested for all possible combinations of two features. Figure 7 presents 36 two-dimensional feature spaces for all feature combinations calculated for the 0–5 s time window over all 13 subjects. It can be observed that m(ΔHbR) vs. m(ΔHbO), m(|R|) vs. m(∠R) and [m(ΔHbT),m(ΔCOE),P] vs. m(|R|) provide the best data separation between sleep stages. Table 2 shows the classification accuracies obtained with all possible binary pairs of features using best-performing classifiers among the five mentioned above. So the above-mentioned feature combinations resulted in 90% classification accuracy, while all other pairs resulted in an accuracy of 70% and above, except only three pairs between 65 and 70%. Table 2 further supports confidence in using features based on all six VPA indices for sleep stage classification.
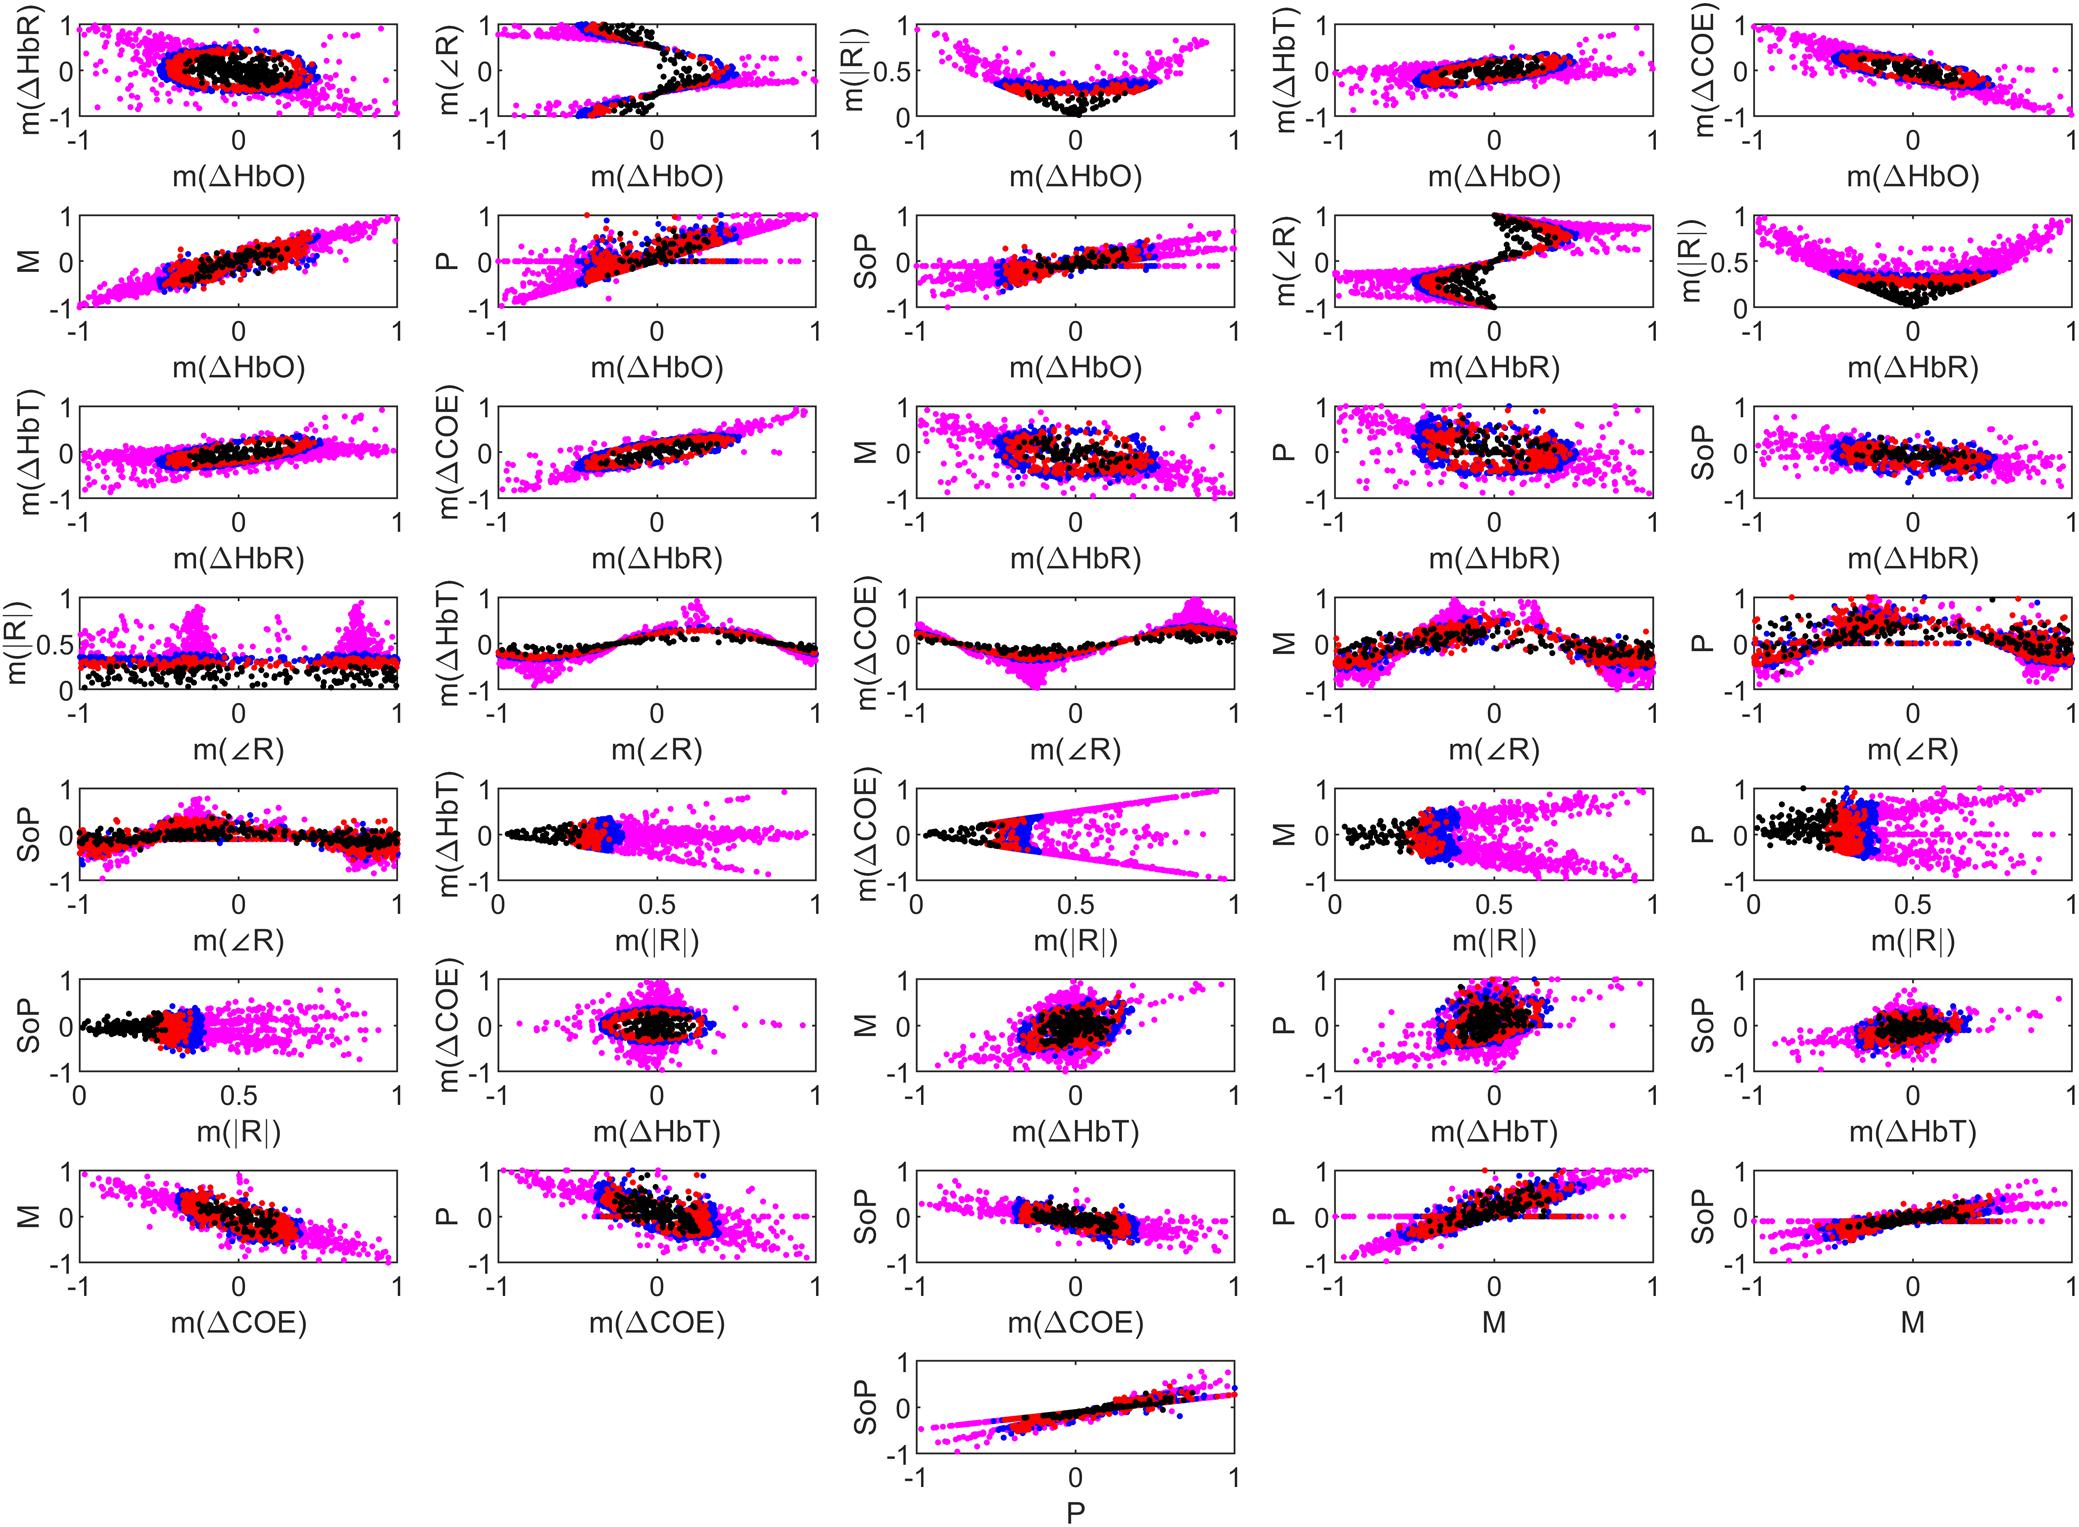
Figure 7. Thirty-six 4-class feature spaces combining all features [six vector phase analysis (VPA) and three statistical] for separating the W, N1, N2, and N3 stages represented by pink, blue, red, and black colored data points, respectively.
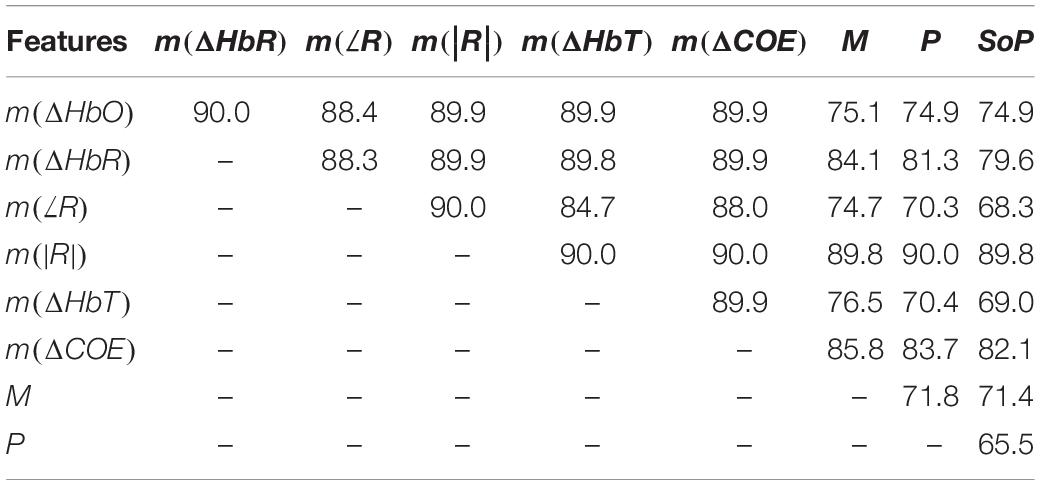
Table 2. Percentage accuracies obtained by combinations of two features (0–5 s window, all subjects, kNN classifier).
Table 3 shows subject-wise classification accuracies obtained with the best-performing feature combination and classifier. It has been observed that the m(∠R), m(|R|) pair performed the best for 11 subjects out of 13, with an almost 85% success rate. For two subjects, m(ΔHbO), m(ΔHbR) performed well comparatively but without significant improvement in the accuracy. So it can be deduced that trajectory gradients of CORE vector angle and magnitude are optimal VPA features for sleep stage classification, as they resulted in more than 90% accuracy for all subjects. Hence, drowsiness activity can be obtained by observing which phase the VPA trajectory lies in and what its distance is from the vector phase diagram’s origin. By constantly observing the relevant change in these two aspects, drowsiness activity can be detected.
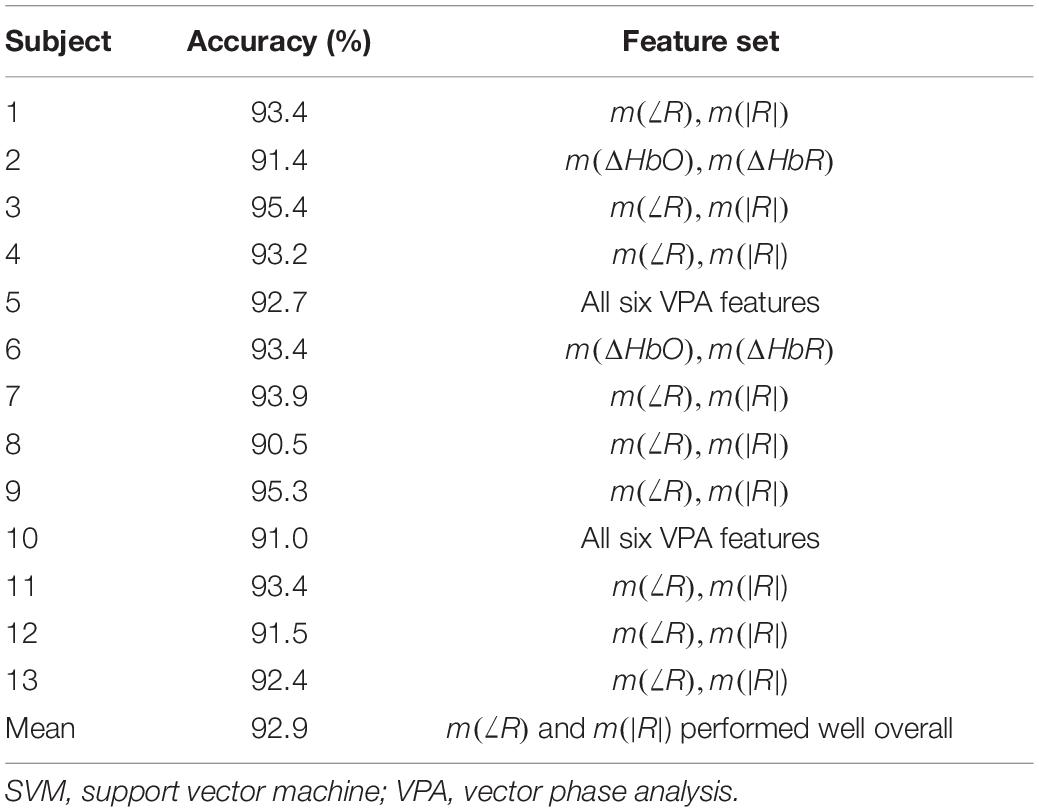
Table 3. Best classification accuracies in brain region A (all channels, 0–5 s window, SVM classifier).
Table 4 compares the percentage accuracy and computation time for cross-validated multiclass classifiers. It is noted that all the classifiers other than DA performed well with less variance accuracy among them but significant differences in computation time. SVM has the highest accuracy, but its computation time almost doubled as compared with that of DT and kNN classifiers. Ensemble classifier is chosen as the best-performing classifier because it has the least computation time and its accuracy is almost the same as that of SVM. Student’s t-test method is applied for the comparison of ensemble classifier’s accuracy with other classifier accuracies. Results show the p-value of less than 0.05 for all tests, which validated the statistical significance of the hypothesis made over outperforming ensemble classifier. Only the best-performing feature set “m(∠R) and m(|R|)” is used for classification accuracies obtained in Table 4.
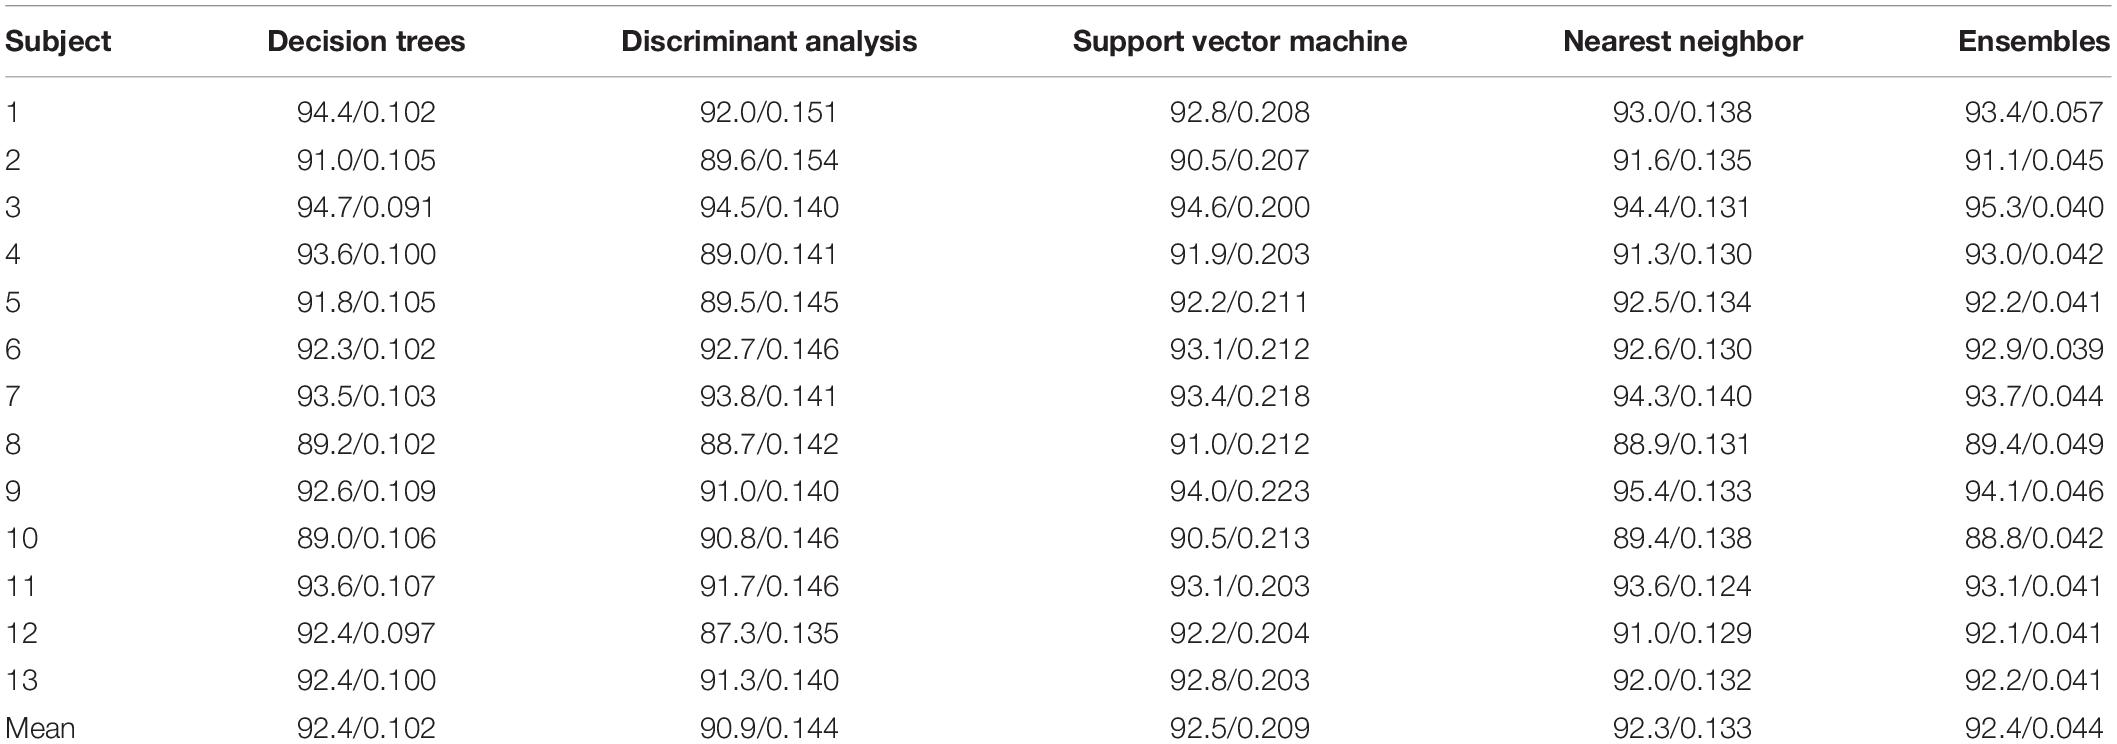
Table 4. Performance comparison of five classifiers: accuracy (%)/computation time (s).
Figure 8 presents average classification accuracies obtained with all five classifiers for all subjects. Variance in accuracy values due to the usage of multiple VPA feature combinations is showed by error bars against each classifier. Here, DA and SVM showed maximum and minimum sensitivity to change of features, respectively. The length of variance bounds shows the standard deviation (SD) of accuracy from the mean value. The SD is the highest in DA, which shows that accuracy changes significantly if the feature set changes, while SD for SVM is the lowest, which shows that accuracy is minimally affected when different feature sets are used for classification.
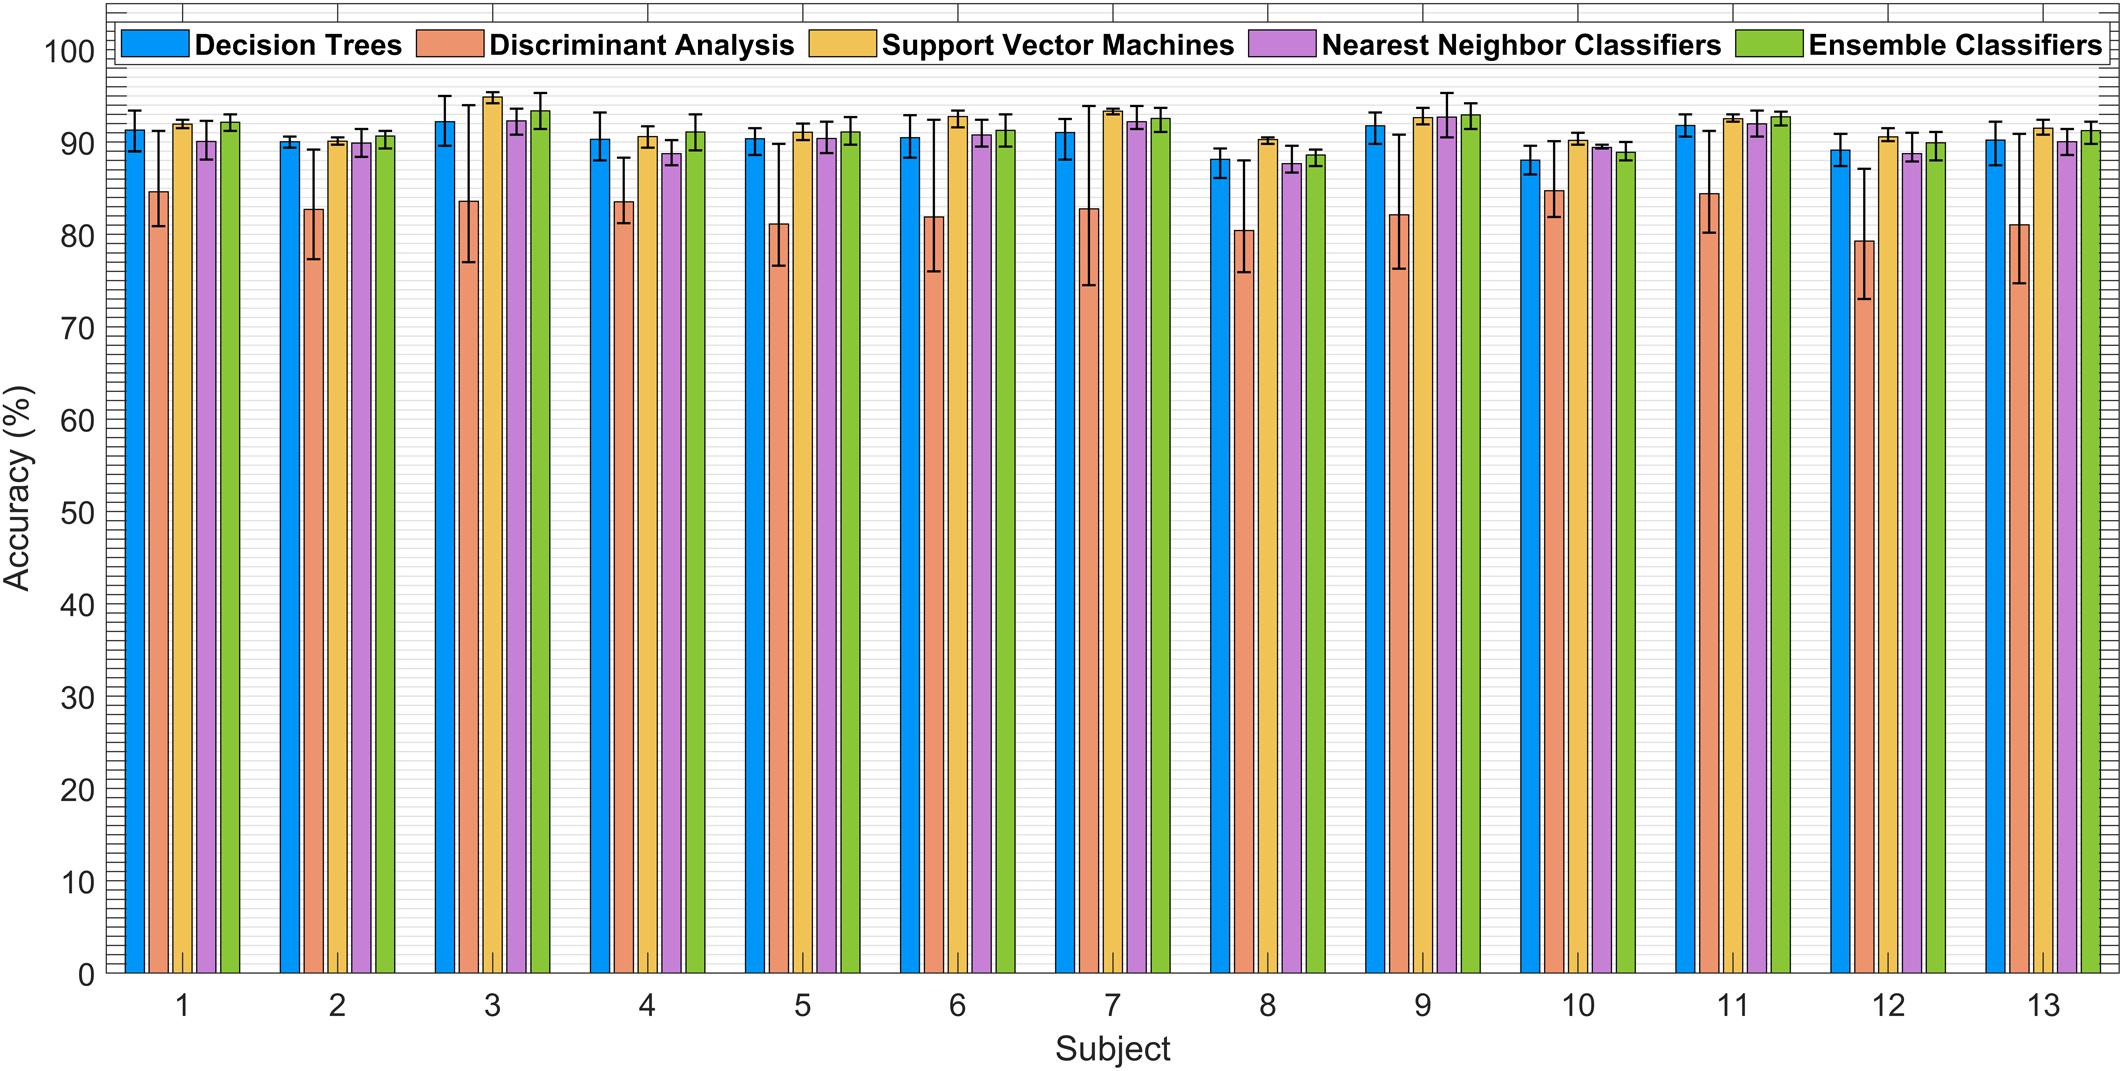
Figure 8. Average classification accuracies with variance bounds obtained by using different vector phase analysis (VPA) feature pairs.
Figure 9 illustrates classification performance measures in terms of confusion/error matrix, ROC curves, and AUC. The ensemble classifier performed very well with an accuracy of 94.1% and AUC near 1 for all classes with a cross-validated classification model. Hence, these results increase the confidence in using the proposed criterion for any subject with minimum setup time.
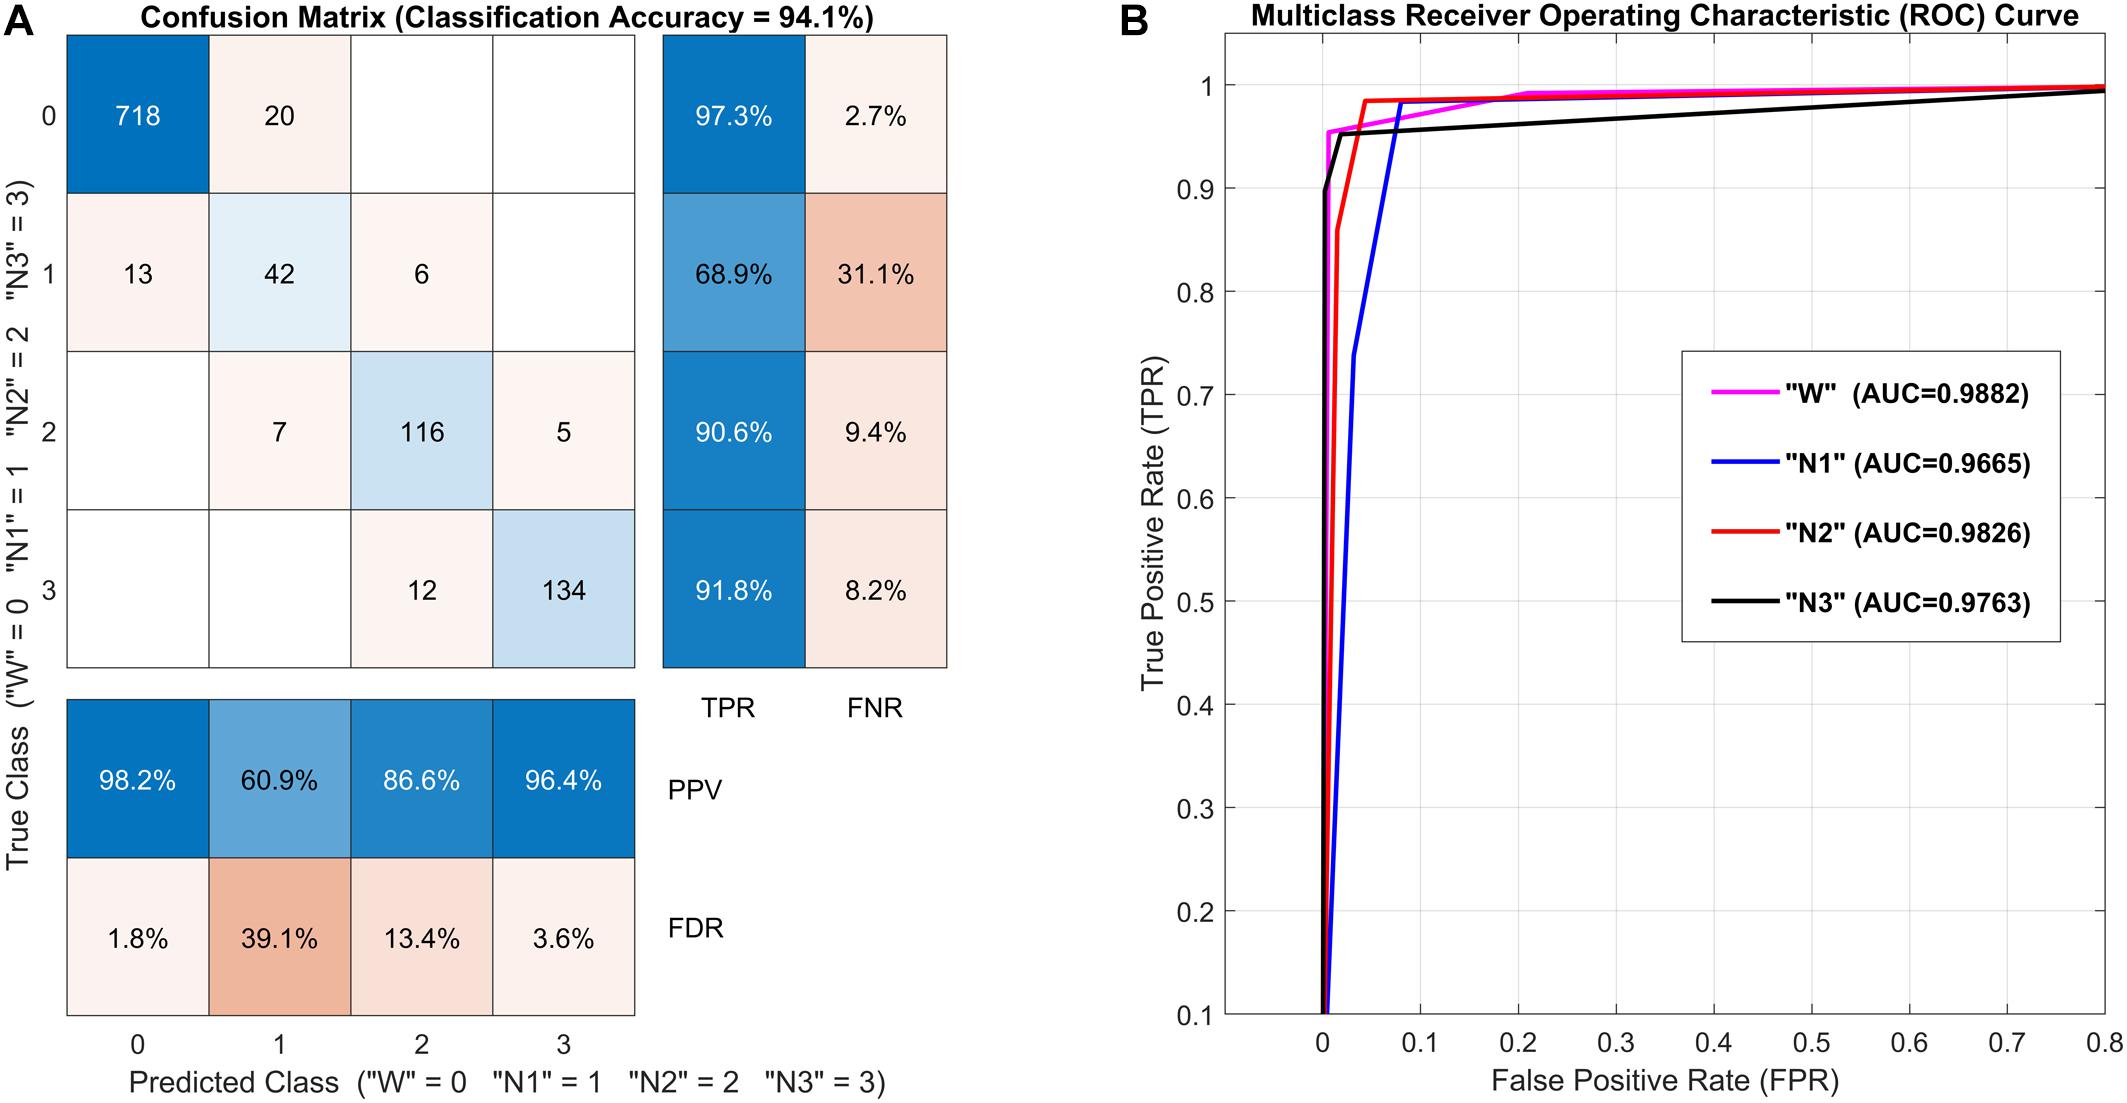
Figure 9. Classification performance measures [Subject 9, all channels, m(|R|) vs. m(∠R) feature set, ensemble classifier]: (A) Confusion matrix with the number of observations at diagonal and off-diagonal entries, true-positive rate (TPR), and false-negative rate (FNR) at the right columns, and positive predictive value (PPV) and false discovery rate (FDR) at the bottom rows. (B) Multiclass receiver operating characteristic (ROC) curves and area under the curve (AUC) for all sleep stages.
Discussion
In previous studies related to passive BCI systems, 0–5 and 0–1 s time windows were used to classify the loss of attention/vigilance from fNIRS brain signals with off-line classification techniques (Khan and Hong, 2015; Tanveer et al., 2019). However, less focus is given to real-time or online detection of passive brain states using fNIRS signals for real-life/practical applications. Studies have shown an increase in ΔHbO levels in the DPFC region of the brain when passive states are overcoming focus during attention-demanding tasks (Khan and Hong, 2015; Tanveer et al., 2019). An increase in ΔHbO and a decrease in ΔCOE is also observed, as sleep is overcoming consciousness (Khero et al., 2019; Oniz et al., 2019). So the results of this study are consistent with the literature and support the hypothesis presented. Here, the trends of the brain’s CORE state are monitored from wakefulness to sleep, which gives a new scheme for the detection of drowsiness or sleep. The spatial resolution is also increased for the detection of passive activity from the right DPFC with Channel 8 (near F8 electrode position) being the most active as shown in the results.
VPA for fNIRS signals is widely used for the classification of active mental tasks (Hong and Khan, 2017; Khan and Hong, 2017; Zafar and Hong, 2018; Khan M.N.A. et al., 2020); however, less focus is observed on the use of VPA for classifying passive brain activities (Yoshino et al., 2013). This study focused on using the VPA for drowsiness classification while reducing the chances of false detection. Various statistical features like mean, slope, kurtosis, skewness, signal peak, and the sum of peaks of ΔHbO/ΔHbR signals (Khan and Hong, 2015; Naseer et al., 2016a; Hong et al., 2018; Khan R.A. et al., 2018; Nazeer et al., 2020a), as well as automatic feature extraction using deep learning networks (Khan R.A. et al., 2018; Tanveer et al., 2019; Wang et al., 2020), are previously used for classification of active as well as passive brain activities. VPA-based features like cerebral blood volume (ΔCBV), ΔCOE and others are also used for active BCIs (Naseer et al., 2016b; Nazeer et al.,2020a,b). The best-performing statistical features (mean, peak, and the sum of peaks of ΔHbO) (Khan and Hong, 2015; Noori et al., 2017; Qureshi et al., 2017) along with VPA features are extensively tested in this study. Special focus is given to VPA-based features to prove the effective utilization of VPA for passive tasks. The classification results have shown confidence in using slopes of VPA indices as features. To avoid false detection, trends of trajectories are captured over a sample space of 5 s instead of using instantaneous values of hemodynamic signals as features. So the slopes of ΔHbO,ΔHbR,ΔHbT,ΔCOE,|R|,∠R trajectories are true representative of changing brain state from wakefulness to drowsiness. The change in the trend of these factors checked against threshold criteria supports the earlier and actual estimation of drowsiness activity.
Threshold circles obtained by EEG response, the onset of tasks, resting state, baseline data, etc., are plotted upon VPA for the hemodynamic response, initial dip, activity detection, etc., in various fNIRS- and EEG-fNIRS-based hybrid BCI studies (Zafar and Hong, 2017; Hong et al., 2018; Khan M.J. et al., 2018; Nazeer et al., 2020a). This study employed threshold circles based upon sleep stages, which are not used before for fNIRS studies, up to the best knowledge of the authors. The novelty lies in proposing a uniform criterion that is readily applicable to any subject without requiring recalibration or extensive setup time. This feature increases the utility of this BCI scheme for practical applications and products.
General trends of the hemodynamic response of the brain during the transition from wakefulness to sleep have been investigated in fNIRS- and EEG-based BCI studies (Oniz et al., 2019). It intuits the use of hemodynamic response for sleep stage classification. The proposed threshold criteria are validated over the 13 subjects’ data with various feature sets and classifiers for multiclass classification. Results and performance measures of this tetra-class classification problem support the claim of this study for the wide applicability of proposed threshold criteria. Classification accuracy is more than 88.7% for all subjects, which is well above the chance rate (25%) for four-class classification and also more than 60% confidence level required for BCI utility (Asgher et al., 2020; Huang et al., 2020; Lindig-Leon et al., 2020). Adaptation of the system to any new subject requires only baseline data of wakefulness state, and other thresholds will be measured as proposed. This BCI scheme is promising for online detection systems.
Conclusion
This study investigates the feasibility of the fNIRS-based passive BCI scheme for the detection of driver’s drowsiness and sleep stage classification. VPA along with fixed threshold circles is used for the online classification of this passive activity. Threshold circle criteria are based upon the CORE state of wakefulness and NREM sleep stages of any subject. The CORE trajectory, which is based upon both ΔHbO and ΔHbR indicators, is plotted upon VPA in real-time. The decision of drowsiness detection has occurred when the CORE trajectory crosses the threshold circles in the fourth quadrant of the vector phase diagram. To further validate the wide applicability of threshold circle criteria, extensive testing is done using various feature sets and classifiers over a dataset of 13 subjects. Results indicate that slopes of CORE vector angle and magnitude trajectories “m(∠R) and m(|R|)” are the best-suited features for drowsiness detection. The SVM classifier performed well overall with a mean classification accuracy of 92.5%, while the ensemble classifier took a minimum computation time of 44 ms for this four-class classification problem. Classification performance measures indicate that sleep stage-based threshold circle criteria are universally applicable for any subject with minimum setup time. Channel selection shows that the right DPFC is the more active region of the brain for drowsiness detection during driving tasks. This study validates a potential BCI scheme for real-time detection of passive brain responses for practical applications.
Data Availability Statement
The datasets analyzed in this article are not publicly available. Requests to access the datasets should be directed to K-SH, a3Nob25nQHB1c2FuLmFjLmty.
Ethics Statement
The studies involving human participants were reviewed and approved by the Pusan National University Institutional Review Board. The patients/participants provided their written informed consent to participate in this study.
Author Contributions
SA conceived the idea, processed the data, and wrote the first draft of the manuscript. MJK obtained the raw fNIRS data when he was a Ph.D. student at Pusan National University. NN developed the VPA method with a single-threshold circle. K-SH supervised the initial development of the VPA. HS and YA were involved in checking the results and manuscript. All authors have read and agreed to the published version of the manuscript.
Funding
This work was supported by the National Research Foundation (NRF) of Korea under the auspices of the Ministry of Science and ICT, South Korea (Grant No. NRF-2020R1A2B5B03096000).
Conflict of Interest
The authors declare that the research was conducted in the absence of any commercial or financial relationships that could be construed as a potential conflict of interest.
References
Ahn, S., Nguyen, T., Jang, H., Kim, J. G., and Jun, S. C. (2016). Exploring neuro-physiological correlates of drivers’ mental fatigue caused by sleep deprivation using simultaneous EEG. ECG, and fNIRS data. Front. Hum. Neurosci. 10:219. doi: 10.3389/fnhum.2016.00219
Ali, Z., and Park, U. (2020). Real-time safety monitoring vision system for linemen in buckets using spatio-temporal inference. Int. J. Control Autom. Syst. 19, 505–520. doi: 10.1007/s12555-019-0546-y
Alkawadri, R. (2019). Brain-Computer Interface (BCI) applications in mapping of epileptic brain networks based on intracranial-EEG: an update. Front. Neurosci. 13:191. doi: 10.3389/fnins.2019.00191
Al-Zubaidi, A., Mertins, A., Heldmann, M., Jauch-Chara, K., and Munte, T. F. (2019). Machine learning based classification of resting-state fMRI features exemplified by metabolic state (Hunger/Satiety). Front. Hum. Neurosci. 13:164. doi: 10.3389/fnhum.2019.00164
Asgher, U., Khalil, K., Khan, M. J., Ahmad, R., Butt, S. I., Ayaz, Y., et al. (2020). Enhanced accuracy for multiclass mental workload detection using long short-term memory for brain-computer interface. Front. Neurosci. 14:584. doi: 10.3389/fnins.2020.00584
Bernardi, G., Siclari, F., Handjaras, G., Riedner, B. A., and Tononi, G. (2018). Local and widespread slow waves in stable NREM sleep: evidence for distinct regulation mechanisms. Front. Hum. Neurosci. 12:248. doi: 10.3389/fnhum.2018.00248
Bhutta, M. R., Hong, K.-S., Kim, B.-M., Hong, M. J., Kim, Y.-H., and Lee, S.-H. (2014). Note: three wavelengths near-infrared spectroscopy system for compensating the light absorbance by water. Rev. Sci. Instrum. 85:026111. doi: 10.1063/1.4865124
Borragan, G., Gilson, M., Atas, A., Slama, H., Lysandropoulos, A., De Schepper, M., et al. (2018). Cognitive fatigue, sleep and cortical activity in multiple sclerosis disease. a behavioral, polysomnographic and functional near-infrared spectroscopy investigation. Front. Hum. Neurosci. 12:378. doi: 10.3389/fnhum.2018.00378
Chi, J., Cao, W., and Gu, Y. (2020). Recent progress in sleep quality monitoring and non-drug sleep improvement. Front. Hum. Neurosci. 14:21. doi: 10.3389/fnhum.2020.00021
Choi, I., Rhiu, I., Lee, Y., Yun, M. H., and Nam, C. S. (2017). A systematic review of hybrid brain-computer interfaces: taxonomy and usability perspectives. PloS One 12:e0176674. doi: 10.1371/journal.pone.0176674
Chuang, C.-H., Cao, Z., King, J.-T., Wu, B.-S., Wang, Y.-K., and Lin, C.-T. (2018). Brain electrodynamic and hemodynamic signatures against fatigue during driving. Front. Neurosci. 12:181. doi: 10.3389/fnins.2018.00181
Craik, A., He, Y., and Contreras-Vidal, J. L. (2019). Deep learning for electroencephalogram (EEG) classification tasks: a review. J. Neural Eng. 16:031001. doi: 10.1088/1741-2552/ab0ab5
Dai, C. M., Zhang, Y., Cai, X. P., Peng, Z. Y., Zhang, L. W., Shao, Y. C., et al. (2020). Effects of sleep deprivation on working memory: change in functional connectivity between the dorsal attention, default mode, and Fronto-Parietal Networks. Front. Hum. Neurosci. 14:360. doi: 10.3389/fnhum.2020.00360
Dart, T., Gallo, M., Beer, J., Fischer, J., Morgan, T., and Pilmanis, A. (2017). Hyperoxia and hypoxic hypoxia effects on simple and choice reaction times. Aerosp. Med. Hum. Perform. 88, 1073–1080. doi: 10.3357/AMHP.4696.2017
Dunbar, J., Gilbert, J. E., and Lewis, B. (2020). Exploring differences between self-report and electrophysiological indices of drowsy driving: a usability examination of a personal brain-computer interface device. J. Safety Res. 74, 27–34. doi: 10.1016/j.jsr.2020.04.006
Fonseca, A., Kerick, S., King, J. T., Lin, C. T., and Jung, T. P. (2018). Brain network changes in fatigued drivers: a longitudinal study in a real-world environment based on the effective connectivity analysis and actigraphy data. Front. Hum. Neurosci. 12:418. doi: 10.3389/fnhum.2018.00418
Hong, K.-S., and Khan, M. J. (2017). Hybrid brain-computer interface techniques for improved classification accuracy and increased number of commands: a review. Front. Neurorobot. 11:35. doi: 10.3389/fnbot.2017.00035
Hong, K.-S., Khan, M. J., and Hong, M. J. (2018). Feature extraction and classification methods for hybrid fNIRS-EEG brain-computer interfaces. Front. Hum. Neurosci. 12:246. doi: 10.3389/fnhum.2018.00246
Hong, K.-S., and Naseer, N. (2016). Reduction of delay in detecting initial dips from functional near-infrared spectroscopy signals using vector-based phase analysis. Int. J. Neural Syst. 26:1650012. doi: 10.1142/S012906571650012X
Huang, Y., He, F., Xu, M., and Qi, H. (2020). Operate P300 speller when performing other task. J. Neural Eng. 17:056022. doi: 10.1088/1741-2552/abb4a6
Ioannides, A. A. (2018). Neurofeedback and the neural representation of self: lessons from awake state and sleep. Front. Hum. Neurosci. 12:142. doi: 10.3389/fnhum.2018.00142
Ismail, K., Sayed, T., Saunier, N., and Lim, C. (2009). Automated analysis of pedestrian–vehicle conflicts using video data. Transp. Res. Rec. 2140, 44–54. doi: 10.3141/2140-05
Kang, H., Yang, S., Huang, J., and Oh, J. (2020). Time series prediction of wastewater flow rate by bidirectional LSTM deep learning. Int. J. Control Autom. Syst. 18, 3023–3030. doi: 10.1007/s12555-019-0984-6
Khan, M. J., Ghafoor, U., and Hong, K.-S. (2018). Early detection of hemodynamic responses using EEG: a hybrid EEG-fNIRS study. Front. Hum. Neurosci. 12:479. doi: 10.3389/fnhum.2018.00479
Khan, M. J., and Hong, K.-S. (2015). Passive BCI based on drowsiness detection: an fNIRS study. Biomed. Opt. Express 6, 4063–4078. doi: 10.1364/BOE.6.004063
Khan, M. J., and Hong, K.-S. (2017). Hybrid EEG-fNIRS-based eight-command decoding for BCI: application to quadcopter control. Front. Neurorobot. 11:6. doi: 10.3389/fnbot.2017.00006
Khan, M. N. A., Bhutta, M. R., and Hong, K.-S. (2020). Task-specific stimulation duration for fNIRS brain-computer interface. IEEE Access 8, 89093–89105. doi: 10.1109/ACCESS.2020.2993620
Khan, R. A., Naseer, N., Qureshi, N. K., Noori, F. M., Nazeer, H., and Khan, M. U. (2018). fNIRS-based Neurorobotic Interface for gait rehabilitation. J. Neuroeng. Rehabil. 15:7. doi: 10.1186/s12984-018-0346-2
Khan, R. A., Naseer, N., Saleem, S., Qureshi, N. K., Noori, F. M., and Khan, M. J. (2020). Cortical tasks-based optimal filter selection: an fNIRS study. J. Healthc. Eng. 2020:9152369. doi: 10.1155/2020/9152369
Khero, M., Fatima, M., Shah, M.a.A, and Tahir, A. (2019). Comparison of the status of sleep quality in basic and clinical medical students. Cureus 11:e4326. doi: 10.7759/cureus.4326
Kim, D., Lee, Y., and Park, C. G. (2020). Context awareness and step length estimation by shape distance and H-features. Int. J. Control Autom. Syst. 18, 3051–3061. doi: 10.1007/s12555-019-0725-x
Ko, L.-W., Chikara, R. K., Lee, Y.-C., and Lin, W.-C. (2020). Exploration of user’s mental state changes during performing brain-computer interface. Sensors 20:3169. doi: 10.3390/s20113169
Koo, M.-S., and Choi, H.-L. (2020). Output feedback regulation of a class of lower triangular nonlinear systems with arbitrary unknown measurement sensitivity. Int. J. Control Autom. Syst. 18, 2186–2194. doi: 10.1007/s12555-019-0721-1
Lasek-Bal, A., Kidoń, J., Błaszczyszyn, M., Stasiów, B., and Żak, A. (2018). BOLD fMRI signal in stroke patients and its importance for prognosis in the subacute disease period–Preliminary report. Neurol Neurochir. Pol. 52, 341–346. doi: 10.1016/j.pjnns.2017.12.006
Li, J., Wang, J., Wang, S., Qi, W., Zhang, L., Hu, Y., et al. (2020). Neural approximation-based model predictive tracking control of non-holonomic wheel-legged robots. Int. J. Control Autom. Syst. 19, 372–381. doi: 10.1007/s12555-019-0927-2
Lin, C.-T., King, J.-T., Chuang, C.-H., Ding, W., Chuang, W.-Y., Liao, L.-D., et al. (2020). Exploring the brain responses to driving fatigue through simultaneous EEG and fNIRS measurements. Int. J. Neural Syst. 30:1950018. doi: 10.1142/S0129065719500187
Lindig-Leon, C., Rimbert, S., and Bougrain, L. (2020). Multiclass classification based on combined motor imageries. Front. Neurosci. 14:559858. doi: 10.3389/fnins.2020.559858
Naseer, N., and Hong, K.-S. (2015). fNIRS-based brain-computer interfaces: a review. Front. Hum. Neurosci. 9:3. doi: 10.3389/fnhum.2015.00003
Naseer, N., Noori, F. M., Qureshi, N. K., and Hong, K.-S. (2016a). Determining optimal feature-combination for LDA classification of functional near-infrared spectroscopy signals in brain-computer interface application. Front. Hum. Neurosci. 10:237. doi: 10.3389/fnhum.2016.00237
Naseer, N., Qureshi, N. K., Noori, F. M., and Hong, K.-S. (2016b). Analysis of different classification techniques for two-class functional near-infrared spectroscopy-based brain-computer interface. Comput. Intell. Neurosci. 2016:5480760. doi: 10.1155/2016/5480760
Nazeer, H., Naseer, N., Khan, R. A., Noori, F. M., Qureshi, N. K., Khan, U. S., et al. (2020a). Enhancing classification accuracy of fNIRS-BCI using features acquired from vector-based phase analysis. J. Neural Eng. 17:056025. doi: 10.1088/1741-2552/abb417
Nazeer, H., Naseer, N., Mehboob, A., Khan, M. J., Khan, R. A., Khan, U. S., et al. (2020b). Enhancing classification performance of fNIRS-BCI by identifying cortically active channels using the z-score method. Sensors 20:6995. doi: 10.3390/s20236995
Nguyen, T., Ahn, S., Jang, H., Jun, S. C., and Kim, J. G. (2017). Utilization of a combined EEG/NIRS system to predict driver drowsiness. Sci. Rep. 7:43933. doi: 10.1038/srep43933
Ni, L., Li, J., Li, W., Zhou, F., Wang, F., Schwarz, C. G., et al. (2017). The value of resting-state functional MRI in subacute ischemic stroke: comparison with dynamic susceptibility contrast-enhanced perfusion MRI. Sci. Rep. 7:41586. doi: 10.1038/srep41586
Nicolas-Alonso, L. F., and Gomez-Gil, J. (2012). Brain computer interfaces, a review. Sensors 12, 1211–1279. doi: 10.3390/s120201211
Noori, F. M., Naseer, N., Qureshi, N. K., Nazeer, H., and Khan, R. A. (2017). Optimal feature selection from fNIRS signals using genetic algorithms for BCI. Neurosci. Lett. 647, 61–66. doi: 10.1016/j.neulet.2017.03.013
Oniz, A., Inanc, G., Taslica, S., Guducu, C., and Ozgoren, M. (2019). Sleep is a refreshing process: an fNIRS study. Front. Hum. Neurosci. 13:160. doi: 10.3389/fnhum.2019.00160
Philip, P., and Åkerstedt, T. (2006). Transport and industrial safety, how are they affected by sleepiness and sleep restriction? Sleep Med. Rev. 10, 347–356. doi: 10.1016/j.smrv.2006.04.002
Qureshi, N. K., Naseer, N., Noori, F. M., Nazeer, H., Khan, R. A., and Saleem, S. (2017). Enhancing classification performance of functional near-infrared spectroscopy-brain–computer interface using adaptive estimation of general linear model coefficients. Front. Neurorobot. 11:33. doi: 10.3389/fnbot.2017.00033
Ramadan, R. A., and Vasilakos, A. V. (2017). Brain computer interface: control signals review. Neurocomputing 223, 26–44. doi: 10.1016/j.neucom.2016.10.024
Romanelli, P., Piangerelli, M., Ratel, D., Gaude, C., Costecalde, T., Puttilli, C., et al. (2019). A novel neural prosthesis providing long-term electrocorticography recording and cortical stimulation for epilepsy and brain-computer interface. J. Neurosurg. 130, 1166–1179. doi: 10.3171/2017.10.JNS17400
Rupp, G., Berka, C., Meghdadi, A. H., Karic, M. S., Casillas, M., Smith, S., et al. (2019). EEG-based neurocognitive metrics may predict simulated and on-road driving performance in older drivers. Front. Hum. Neurosci. 12:532. doi: 10.3389/fnhum.2018.00532
Skalski, S., and Dobrakowski, P. (2020). Vigilance, inhibitory control and regional cerebral blood oxygenation in the PFC - differences in ADHD tunes of presentations. Adv. Cogn. Psychol. 16, 202–212. doi: 10.5709/acp-0297-5
Smith, Z. M., Krizay, E., Sa, R. C., Li, E. T., Scadeng, M., and Powell, F. L.Jr. et al. (2017). Evidence from high-altitude acclimatization for an integrated cerebrovascular and ventilatory hypercapnic response but different responses to hypoxia. J. Appl. Physiol. 123, 1477–1486. doi: 10.1152/japplphysiol.00341.2017
Sosnik, R., and Ben Zur, O. (2020). Reconstruction of hand, elbow and shoulder actual and imagined trajectories in 3D space using EEG slow cortical potentials. J. Neural Eng. 17:016065. doi: 10.1088/1741-2552/ab59a7
Sun, Y., Ayaz, H., and Akansu, A. N. (2020). Multimodal affective state assessment using fNIRS. Brain Sci. 10:85. doi: 10.3390/brainsci10020085
Sung, H.-J., Park, M.-K., and Choi, J. W. (2020). Automatic grader for flatfishes using machine vision. Int. J. Control Autom. Syst. 18, 3073–3082. doi: 10.1007/s12555-020-0007-7
Tanveer, M. A., Khan, M. J., Qureshi, M. J., Naseer, N., and Hong, K.-S. (2019). Enhanced drowsiness detection using deep learning: an fNIRS study. IEEE Access 7, 137920–137929. doi: 10.1109/ACCESS.2019.2942838
Tortora, S., Ghidoni, S., Chisari, C., Micera, S., and Artoni, F. (2020). Deep learning-based BCI for decoding from EEG with LSTM recurrent neural network. J. Neural Eng. 17:046011. doi: 10.1088/1741-2552/ab9842
Tung, Y.-J., Yen, Y.-S., Lin, B.-S., and Chou, W. (2020). Cerebral oxygenation during exercise in patients with cardiopulmonary diseases: a prospective observational study. Acta Cardiol. Sinica 36, 667–674. doi: 10.6515/ACS.202011_36(6).20200519C
Turnip, A., Hong, K.-S., and Jeong, M.-Y. (2011). Real-time feature extraction of P300 component using adaptive nonlinear principal component analysis. Biomed. Eng. Online 10:83. doi: 10.1186/1475-925X-10-83
Van Wyk, M., Solms, M., and Lipinska, G. (2019). Increased awakenings from non-rapid eye movement sleep explain differences in dream recall frequency in healthy individuals. Front. Hum. Neurosci. 13:370. doi: 10.3389/fnhum.2019.00370
Volkova, K., Lebedev, M. A., Kaplan, A., and Ossadtchi, A. (2019). Decoding movement from electrocorticographic activity: a review. Front. Neuroinform. 13:74. doi: 10.3389/fninf.2019.00074
Wang, Z., Zheng, L., and Li, H. (2020). Distributed optimization over general directed networks with random sleep scheme. Int. J. Control Autom. Syst. 18, 2534–2542. doi: 10.1007/s12555-018-9543-9
Wang, Z., Zhou, Y., Chen, L., Gu, B., Yi, W., Liu, S., et al. (2019). BCI monitor enhances electroencephalographic and cerebral hemodynamic activations during motor training. IEEE Trans. Neural Syst. Rehabil. Eng. 27, 780–787. doi: 10.1109/TNSRE.2019.2903685
Wascher, E., Arnau, S., Gutberlet, I., Karthaus, M., and Getzmann, S. (2018). Evaluating pro- and re-active driving behavior by means of the EEG. Front. Hum. Neurosci. 12:205. doi: 10.3389/fnhum.2018.00205
Welvaert, M., and Rosseel, Y. (2014). A review of fMRI simulation studies. PloS One 9:e101953. doi: 10.1371/journal.pone.0101953
Wolpaw, J. R., Birbaumer, N., Mcfarland, D. J., Pfurtscheller, G., and Vaughan, T. M. (2002). Brain–computer interfaces for communication and control. Clin. Neurophysiol. 113, 767–791. doi: 10.1016/s1388-2457(02)00057-3
Yoo, P. E., Oxley, T. J., John, S. E., Opie, N. L., Ordidge, R. J., O’brien, T. J., et al. (2018). Feasibility of identifying the ideal locations for motor intention decoding using unimodal and multimodal classification at 7T-fMRI. Sci. Rep. 8:15556. doi: 10.1038/s41598-018-33839-4
Yoshino, K., and Kato, T. (2012). Vector-based phase classification of initial dips during word listening using near-infrared spectroscopy. Neuroreport 23, 947–951. doi: 10.1097/WNR.0b013e328359833b
Yoshino, K., Oka, N., Yamamoto, K., Takahashi, H., and Kato, T. (2013). Correlation of prefrontal cortical activation with changing vehicle speeds in actual driving: a vector-based functional near-infrared spectroscopy study. Front. Hum. Neurosci. 7:895. doi: 10.3389/fnhum.2013.00895
Zafar, A., and Hong, K.-S. (2017). Detection and classification of three-class initial dips from prefrontal cortex. Biomed. Optics Express 8, 367–383. doi: 10.1364/BOE.8.000367
Zafar, A., and Hong, K.-S. (2018). Neuronal activation detection using vector phase analysis with dual threshold circles: a functional near-infrared spectroscopy study. Int. J. Neural Syst. 28:1850031. doi: 10.1142/S0129065718500314
Zander, T. O., and Kothe, C. (2011). Towards passive brain–computer interfaces: applying brain–computer interface technology to human–machine systems in general. J. Neural Eng. 8:025005. doi: 10.1088/1741-2560/8/2/025005
Zhao, R., Zhang, X. X., Zhu, Y. Q., Fei, N. B., Sun, J. B., Liu, P., et al. (2018). Prediction of the effect of sleep deprivation on response inhibition via machine learning on structural magnetic resonance imaging data. Front. Hum. Neurosci. 12:276. doi: 10.3389/fnhum.2018.00276
Keywords: functional near-infrared spectroscopy, brain-computer interface, drowsiness detection, vector phase analysis, cerebral oxygen regulation, sleep stages, multiclass classification, feature selection
Citation: Arif S, Khan MJ, Naseer N, Hong K-S, Sajid H and Ayaz Y (2021) Vector Phase Analysis Approach for Sleep Stage Classification: A Functional Near-Infrared Spectroscopy-Based Passive Brain–Computer Interface. Front. Hum. Neurosci. 15:658444. doi: 10.3389/fnhum.2021.658444
Received: 25 January 2021; Accepted: 09 March 2021;
Published: 30 April 2021.
Edited by:
Ren Xu, Guger Technologies, AustriaReviewed by:
Farzan Majeed Noori, University of Oslo, NorwayNauman Khalid Qureshi, Dalian University of Technology, China
Copyright © 2021 Arif, Khan, Naseer, Hong, Sajid and Ayaz. This is an open-access article distributed under the terms of the Creative Commons Attribution License (CC BY). The use, distribution or reproduction in other forums is permitted, provided the original author(s) and the copyright owner(s) are credited and that the original publication in this journal is cited, in accordance with accepted academic practice. No use, distribution or reproduction is permitted which does not comply with these terms.
*Correspondence: Keum-Shik Hong, a3Nob25nQHB1c2FuLmFjLmty