 Adrianna Giuffre1,2,3
 Ephrem Zewdie1,2,3
 James G. Wrightson1,3
 Lauran Cole1
 Helen L. Carlson1,2
 Hsing-Ching Kuo4
 Ali Babwani1
 Adam Kirton1,2,3*
- 1Calgary Pediatric Stroke Program, Alberta Children’s Hospital, Calgary, AB, Canada
- 2Department of Pediatrics, Cumming School of Medicine, University of Calgary, Calgary, AB, Canada
- 3Department of Clinical Neurosciences, Cumming School of Medicine, University of Calgary, Calgary, AB, Canada
- 4Department of Physical Medicine & Rehabilitation, University of California, Davis, Sacramento, CA, United States
Introduction: Conventional transcranial direct current stimulation (tDCS) and high-definition tDCS (HD-tDCS) may improve motor learning in children. Mechanisms are not understood. Neuronavigated robotic transcranial magnetic stimulation (TMS) can produce individualised maps of primary motor cortex (M1) topography. We aimed to determine the effects of tDCS- and HD-tDCS-enhanced motor learning on motor maps.
Methods: Typically developing children aged 12–18 years were randomised to right M1 anodal tDCS, HD-tDCS, or Sham during training of their left-hand on the Purdue Pegboard Task (PPT) over 5 days. Bilateral motor mapping was performed at baseline (pre), day 5 (post), and 6-weeks retention time (RT). Primary muscle was the first dorsal interosseous (FDI) with secondary muscles of abductor pollicis brevis (APB) and adductor digiti minimi (ADM). Primary mapping outcomes were volume (mm2/mV) and area (mm2). Secondary outcomes were centre of gravity (COG, mm) and hotspot magnitude (mV). Linear mixed-effects modelling was employed to investigate effects of time and stimulation type (tDCS, HD-tDCS, Sham) on motor map characteristics.
Results: Twenty-four right-handed participants (median age 15.5 years, 52% female) completed the study with no serious adverse events or dropouts. Quality maps could not be obtained in two participants. No effect of time or group were observed on map area or volume. LFDI COG (mm) differed in the medial-lateral plane (x-axis) between tDCS and Sham (p = 0.038) from pre-to-post mapping sessions. Shifts in map COG were also observed for secondary left-hand muscles. Map metrics did not correlate with behavioural changes.
Conclusion: Robotic TMS mapping can safely assess motor cortex neurophysiology in children undergoing motor learning and neuromodulation interventions. Large effects on map area and volume were not observed while changes in COG may occur. Larger controlled studies are required to understand the role of motor maps in interventional neuroplasticity in children.
Introduction
Transcranial direct current stimulation (tDCS) is a non-invasive technique capable of modulating cortical excitability in humans (Nitsche and Paulus, 2000). During conventional tDCS, a sub-threshold current is applied to the brain via two sponge electrodes placed on the scalp. Prolonged enhancement of primary motor cortex (M1) excitability following anodal tDCS has been evidenced by an increase in motor evoked potential (MEP) amplitude within hand muscles (Nitsche and Paulus, 2000). Anodal tDCS applied simultaneously with behavioural tasks facilitates enhanced motor performance over a single session (Nitsche et al., 2003; Boggio et al., 2006; Vines et al., 2006) or across multiple sessions in healthy adults (Reis et al., 2009) with effects outlasting the stimulation period (Nitsche and Paulus, 2001; Boggio et al., 2006; Reis et al., 2009; Matsuo et al., 2011; Sohn et al., 2012; Kidgell et al., 2013). tDCS shows promise for facilitating motor recovery post stroke (for review see, Kang et al., 2016) and a range of other neurological disorders (Lefaucheur, 2016). High-definition tDCS (HD-tDCS) offers improved focal targeting of cortical areas and stronger regional electric fields by centering four electrodes around a central electrode of opposite polarity in a 4 × 1 ring-like orientation (Datta et al., 2009; Dmochowski et al., 2011; Villamar et al., 2013; Alam et al., 2016). Behavioural improvements occur in healthy adults over single (Doppelmayr et al., 2016) and multiple sessions (Pixa et al., 2017) in which patterns of cortical excitability may outlast those induced by conventional tDCS (Kuo et al., 2013).
Children have been neglected in neuromodulation research. With a well-defined safety and tolerability profile (Bikson et al., 2016) in adults and clear clinical need, early translation towards tDCS applications in pediatric populations seem favourable. However, limited evidence suggests primary principles of tDCS, such as polarity and current strength, may differ in the developing brain (Moliadze et al., 2015). Preliminary investigations in pediatric populations highlight potentially varying effects of tDCS in children (Kessler et al., 2013; Rajapakse and Kirton, 2013; Bikson et al., 2016). Our team recently demonstrated that M1-tDCS over three consecutive days enhances motor learning in healthy children with effects retained at 6-weeks (Ciechanski and Kirton, 2017). We have also demonstrated that both anodal tDCS and HD-tDCS can enhance motor learning over multiple days with retained effects (Cole et al., 2018). However, the underlying mechanisms of such interventional neuroplasticity remain unknown.
Transcranial magnetic stimulation (TMS) can produce maps of cortical representations of individual muscles within M1 (Cohen and Hallett, 1988; Wassermann et al., 1992; Wilson et al., 1993; Pascual-Leone et al., 1995b; Thickbroom et al., 1998) and is increasingly applied for clinical applications such as preoperative neurosurgical planning for brain tumor removal and epilepsy surgery (Picht et al., 2011; Lefaucheur and Picht, 2016), for review see Sollmann et al. (2021). Common characteristics, such as map volume, area, hotspot magnitude, and centre of gravity (COG), may also potentially quantify changes in cortical neurophysiology following learning or stimulation-induced changes in motor performance (Cohen et al., 1993; Pascual-Leone et al., 1995a, b). For instance, an increase in motor map size following the acquisition of new fine motor skills in healthy adults (Pascual-Leone et al., 1995a) resembles cortical muscle rearrangement following behavioural motor training in primates (Donoghue et al., 1992; Recanzone et al., 1992; Nudo et al., 1996). TMS motor maps, including robotic neuronavigated methods, have also been acquired in the developing brain of healthy and clinical populations (Maegaki et al., 1999; Garvey et al., 2003; Garvey and Gilbert, 2004; Friel et al., 2017; Grab et al., 2018; Giuffre et al., 2019b, 2021). Whether such advanced mapping methods can detect interventional changes in motor cortex neurophysiology during modulated motor learning in children has not been studied. Here, we aimed to determine the potential effects of tDCS and HD-tDCS enhanced motor learning on robotic TMS motor maps. Based on preliminary evidence from adult studies (Pascual-Leone et al., 1995a; Classen et al., 1998), we hypothesised that map volume and area of the trained first dorsal interosseous muscle (FDI) would increase following active stimulation (tDCS and HD-tDCS) and be associated with enhanced motor performance. We also investigated the effects of stimulation and tDCS-enhanced motor performance on additional motor map outcomes, hotspot magnitude (MEP amplitude), and COG of both hands.
Materials and Methods
Participants and Study Design
Participants were recruited from the community including a population-based research cohort, the Healthy Infants and Children Clinical Research Program (HICCUP). Inclusion criteria were (1) typical neurodevelopment, (2) 12–18 years of age, (3) right-handed (Edinburgh handedness inventory with a laterality index ≥28 (Oldfield, 1971), (4) informed assent/consent, and (5) no contraindications to MRI, TMS, or tDCS (Keel et al., 2001). Children with neurodevelopmental or neuropsychiatric diagnosis or taking neuropsychiatric medications were excluded.
Participants and/or their guardian consented/assented to participate in the Accelerated Motor Learning in Pediatrics (AMPED) randomised, double-blind interventional trial (NCT03193580) (Figure 1). Details of the protocol are described in detail elsewhere (Cole et al., 2018). Briefly, the current study investigated the effects of conventional tDCS and HD-tDCS enhanced motor learning on robotic TMS motor maps in healthy children. At baseline (pre), participants received an MRI (90 min), bilateral robotic TMS motor mapping (90 min), and completed a motor assessment (10 min), with a 15-min break between each assessment, all of which are described below. Participants were then computer randomised to right M1, anodal (1) tDCS, (2) HD-tDCS, or (3) Sham during training of their left-hand on the Purdue Pegboard Task (PPT) over five consecutive days (Figure 1B). All outcome measurements were repeated on day 5 (post) and at a retention time (RT) of 6-weeks.
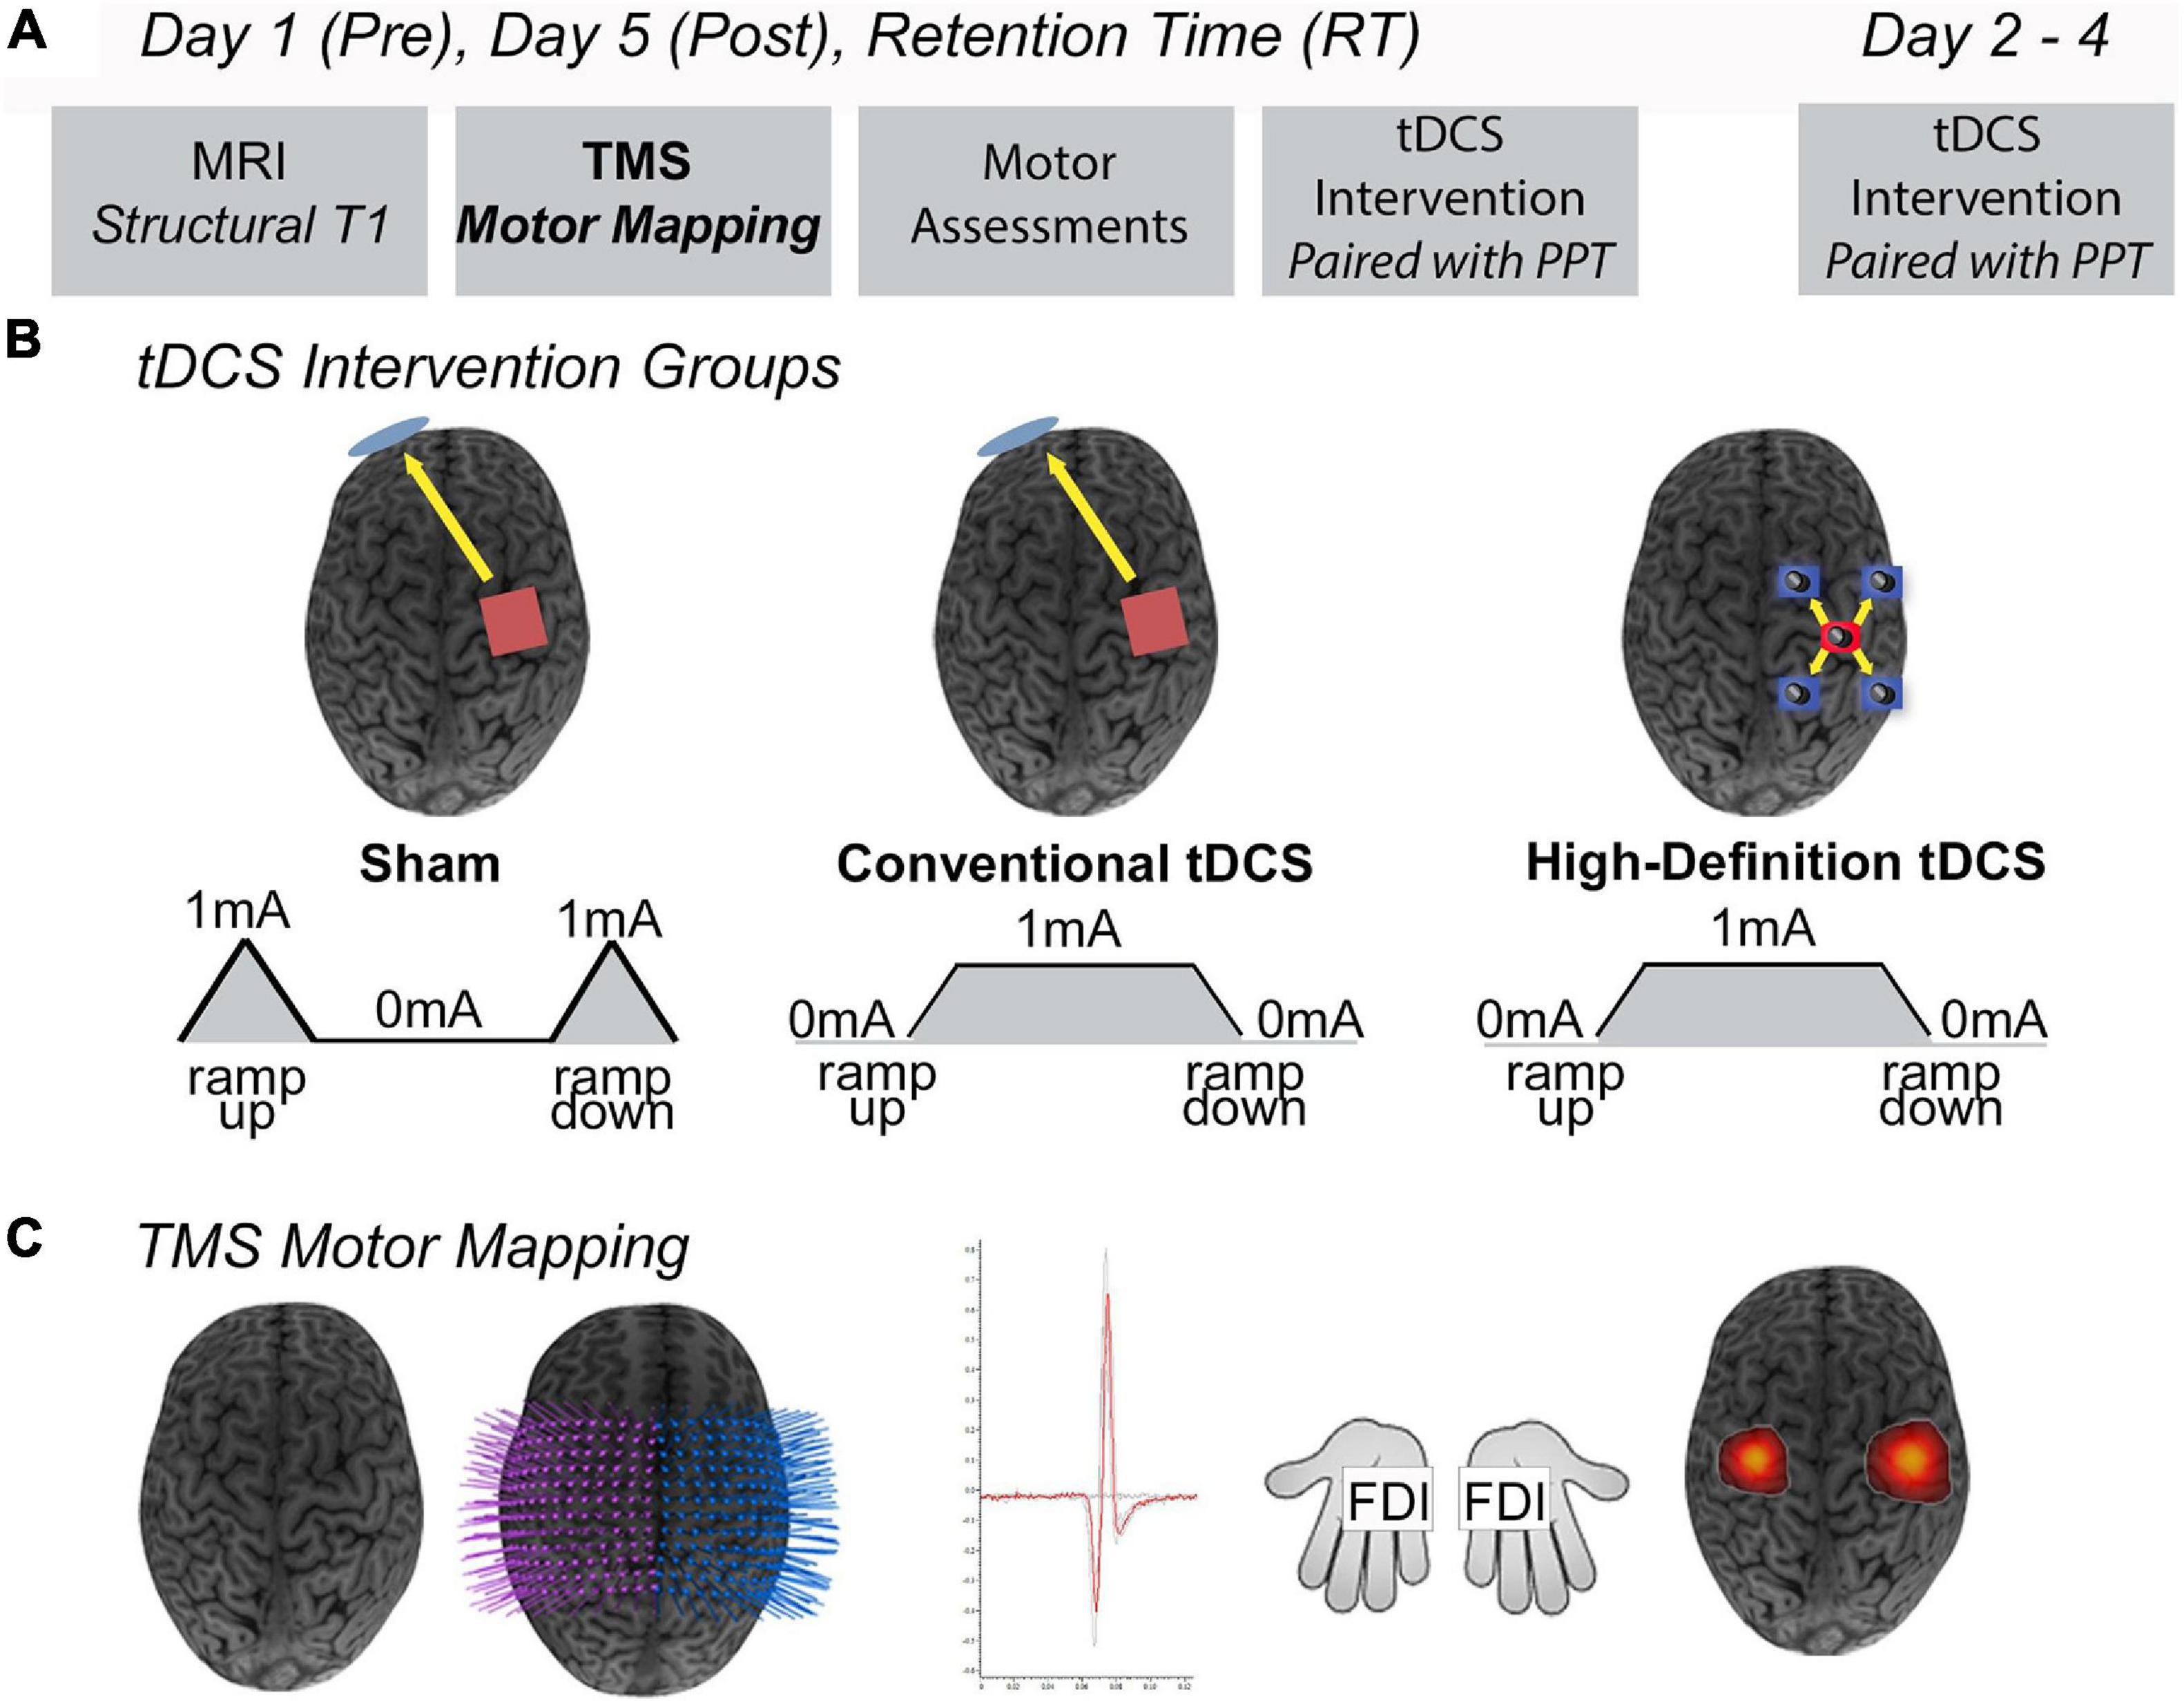
Figure 1. Study design. (A) On Day 1 (pre), participants completed an MRI protocol (90 min), robotic TMS motor mapping (90 min), and the Purdue Pegboard Task (PPT) (10 min), with a 15-min break between each assessment. Days 2–4, participants received five consecutive days of tDCS while training their left hand on the PPT task (PPTL). Day 5 (post), participants received their final tDCS stimulation protocol and proceeded to complete the same MRI protocol, TMS motor mapping, and PPT as Day 1. At a 6-weeks retention time (RT), participants repeated all assessments received on Day 1 (MRI, robotic TMS motor mapping, PPT). (B) Intervention groups. Anodal conventional 1 × 1 Sham tDCS, conventional 1 × 1 tDCS, or 4 × 1 High-Definition tDCS (HD-tDCS) was applied for 20 min at 1 mA targeting the right primary motor cortex (M1). Shown are positions of anode electrodes (red), cathode electrode(s) (blue), direction of current flow (yellow arrows). (C) Robotic TMS motor mapping. Three-dimensional (3D) curvilinear brains were reconstructed from participants T1-weighted anatomical images. Bilateral 12 × 12 grids (7 mm) spacing were centered over the hand knob of right M1 (stimulated cortex) and left M1. Average motor evoked potential (MEP) amplitudes (mV) were acquired from the FDI (target muscle) and other hand muscles. Visualization of robotic TMS motor maps of the FDI muscle overlaid on 3D curvilinear brain.
Magnetic Resonance Imaging
Images were obtained at the ACH Diagnostic Imaging Centre using a 3T General Electric MR750w scanner (GE Healthcare, Chicago, IL, United States) with a 32-channel head coil using a fast-spoiled gradient echo sequence (FSPGR BRAVO, 226 axial slices, TR = 8.5 ms, TE = 3.2 ms, voxels = 1 mm isotropic). Anatomical high-resolution T1 sequences were transferred to the neuronavigation software (Brainsight2, Rogue, Montreal).
Robotic TMS Motor Mapping
Prior to the onset of the stimulation intervention, robotic TMS was used to locate the left-hand FDI (LFDI) hotspot. A figure-of-eight 70mm Air-Film coil (Magstim, Dyfed, United Kingdom) was applied to the scalp over the left hand-knob area (right M1) (Yousry et al., 1997). The LFDI hotspot (described below) was localised using single pulse robotic TMS (Axilum Robotics, Strasbourg, France) via a motor mapping technique (Giuffre et al., 2019b), and marked with a Sharpie (permanent marker), serving as the target site for the anode. For the tDCS and Sham groups, two saline-soaked sponge electrodes (25 cm2, SNAPpad, Soterix Medical Inc., NY, United States) were applied to the scalp. As described, the anode was placed over the LFDI hotspot, while the cathode was placed over the contralateral supraorbital area. Electrodes were held in place using a plastic headband (SNAPstrap, Soterix Medical Inc., NY, United States). In the HD-tDCS, participants wore an EEG cap with the anode electrode centered over the LFDI hotspot, and four surrounding cathode electrodes positioned in a ring-like orientation (1 cm diameter circular electrodes, electrode holder and gel; Soterix Medical Inc., NY, United States).
Bilateral motor maps were acquired using neuronavigated robotic TMS (Axilum Robotics, Strasbourg, France). The detailed robotic motor mapping protocol can be found elsewhere (Giuffre et al., 2019b). Anatomical T1-images were co-registered with each participant using an optical detection camera system (Polaris, NDI Medical Solutions, Waterloo, ON, Canada) and used to reconstruct skin and curvilinear brain. A 12 × 12 rectangular grid with 7 mm spacing was superimposed on the reconstructed curvilinear brain and centered over the anatomical hand-knob of left and right M1 (Yousry et al., 1997) to generate targets for motor mapping. Each grid-point trajectory was aligned tangentially to the cortical surface and maintained at 45° in relation to the interhemispheric fissure using a figure-of-eight 70 mm Air-Film coil (Magstim, Dyfed, United Kingdom), accurately maintaining position and motion correction in near real-time (1 cm/s) (Ginhoux et al., 2013; Goetz et al., 2019).
Participants were seated in a comfortable chair with both arms resting and given an option to watch a movie. Ag-AgCl electrodes (Kendall, Chicopee, MA, United States) were placed on both hands over three muscles: FDI, abductor pollicis brevis (APB), and adductor digiti minimi (ADM). MEP were captured using surface electromyography (EMG), amplified (gain = 1,000, Bortec Biomedical, Calgary, AB, Canada) and filtered (20–2,500 Hz) using a CED 1401 signal analog/digital converter (Cambridge Electronic Design Limited, Cambridge, United Kingdom), and digitised at a rate 5,000 Hz (Signal 6.0 software, Cambridge Electronic Design Limited, Cambridge, United Kingdom).
Experiments began by mapping the right-hemisphere. The LFDI hotspot was first determined as the largest, most consistent MEP (mV). In addition, the FDI hotspot of each hand was used to determine the resting motor threshold (RMT) and mapping intensity. RMT was extrapolated from 5% of the slope of a stimulus response curve (SRC) (Ridding and Rothwell, 1997; Temesi et al., 2014). RMT was used to determine the mapping intensity (120% RMT) for each session. Mapping was performed at a machine stimulator output (MSO) intensity of 120% RMT (Ridding and Rothwell, 1997, 2007) or 100% MSO if their RMT were too high (>84% MSO).
Beginning at the FDI hotspot, four single TMS pulses at 1-second inter-stimulus intervals (1 Hz) were delivered to each grid-point. A grid-point was deemed responsive if ≥2/4 MEP had peak-to-peak amplitudes ≥50 μV in at least one of the three hand-muscles. The neuronavigated robotic system moved to each successive grid-point until a non-responsive grid-point was reached, generating the first border of the map. Motor mapping was completed once non-responsive grid-points formed a complete perimeter in each hemisphere. The complete TMS motor mapping protocol and representative three-dimensional (3D) motor maps of the LFDI muscles (target muscle) are shown in Figure 1C.
Bilateral robotic TMS motor maps were then analysed using a custom mapping script (MATLAB R2016b, The MathWorks, Inc., Natick, MA, United States). The LFDI was the primary muscle as it served as the cortical target site for the tDCS intervention. Primary (map volume and area) and secondary map outcomes were obtained for both hands and characterised by the following:
1. Volume (mm2/mV): Averaged peak-to-peak MEP amplitude at each responsive grid-point multiplied by the summated active grid area (mm2).
2. Area (mm2): Binarised MEP amplitudes of positive number of responsive grid-points (average ≥ 2/4 MEP amplitudes ≥50 μV) multiplied by grid area (7 mm × 7 mm = 49mm2).
3. Centre of Gravity (COG) (mm): Coordinates of the map centroid calculated by using the weighted distribution of the largest MEP amplitude (Wassermann et al., 1992), in a 2 dimensional (2D) x–y plane, assuming z is equal to zero at the surface of the head. COG in the medial-lateral plane corresponds to the 2D x-axis (COG-x), while the anterior-posterior plane corresponds to the 2D y-axis (COG-y). Xi and yi are the respective x-, y- coordinates of the location where the peak-to-peak MEP amplitude (Mi) was recorded.
Safety and Tolerability
Immediately following each robotic TMS mapping session, participants completed a pediatric non-invasive brain stimulation safety and tolerability questionnaire (Zewdie et al., 2020). The safety and tolerability of tDCS and HD-tDCS sessions are reported elsewhere (Cole et al., 2018; Zewdie et al., 2020). The mapping experience was ranked against common childhood experiences; (1) play a game, (2) birthday party, (3) watch TV, (4) long car ride, (5) go to dentist, (6) shot at the doctor, and (7) throwing-up. Participants were also screened for symptoms of headache, neck pain, unpleasant tingling, light-headedness, nausea, and any other self-reported symptoms, all of which were graded as mild, moderate, or severe.
Conventional and High Definition tDCS and Trained Motor Task
At baseline, participants performed the PPT, a validated measure of hand dexterity, using their left-hand (PPTL) and right-hand (PPTR) (Gardner and Broman, 1979). During the tDCS intervention, participants received anodal stimulation targeting the right M1 while training their left-hand on the PPT (Figure 1B). Over five consecutive days, participants performed the PPTL at minutes 5, 10, and 15, while receiving one of the three stimulation interventions, and once again after the stimulation period ended. At post and RT, participants repeated the PPT (PPTL and PPTR) assessment to examine the effects of tDCS and HD-tDCS on motor learning and retention.
Statistical Analysis
Analyses were performed using the R statistical software package (RStudio Team, 2015) using jamovi (Version 1.6, Sydney, Australia1). Data were reported as mean and standard error (SE) unless otherwise stated. Robotic TMS motor map outcomes and motor assessments were tested for normality using the Shapiro–Wilk test. Repeated measures analysis of variance (ANOVA) determined potential differences of RMT across time by group. One-way ANOVA or Kruskal-Wallis H Test determined potential differences of muscles and outcomes at baseline across intervention groups. Linear mixed-effects modeling with restricted maximum likelihood estimation was used to investigate potential effects of time (pre, post, and RT) and group, controlling for potential effects of age and sex. We collapsed active tDCS and HD-tDCS into one stimulation group (stimulation) to investigate the effects of active stimulation on motor maps. Subsequently, we modeled each type of tDCS (tDCS, HD-tDCS, and Sham), stimulation type, separately to explore whether specific stimulation montages might alter motor maps. Dependent variables included primary outcomes (map volume and area) and secondary outcomes (hotspot magnitude and COG). Post-hoc analyses were corrected for multiple comparisons (Holm-Sidak). Estimated marginal means and fixed parameter effects are reported for the left-hand FDI (target muscle) for primary and secondary motor map outcomes. Lastly, linear regression explored the association between change in FDI map volume and change in PPT motor performance from pre-to-post mapping sessions. Estimated marginal means of motor map outcomes for left-hand secondary muscles and right-hand muscles are reported in the Supplementary Material.
Results
Participants
Twenty-four participants were recruited and completed the AMPED trial (12–18 years old, median age 15.5 years, 13 female). Two participants at baseline and one participant at RT received unilateral motor mapping of the right-hemisphere (stimulated cortex) only due to time constraints. One participant was excluded from the motor mapping analyses as their motor mapping intensity exceeded 100% MSO, resulting in insufficient MEP recordings. An additional participant was excluded as MEP could not be recorded from the FDI muscle. Demographics and baseline PPT scores across groups are reported in Table 1. The final sample included 22 right-hemisphere (stimulated) motor maps (n = 7 Sham, n = 8 tDCS, n = 7 HD-tDCS) and 20 left-hemisphere (non-stimulated) motor maps (n = 7 Sham, n = 8 tDCS, n = 5 HD-tDCS). The primary outcomes were not associated with age or sex and the following results held true when controlling for age and sex across motor map outcomes.
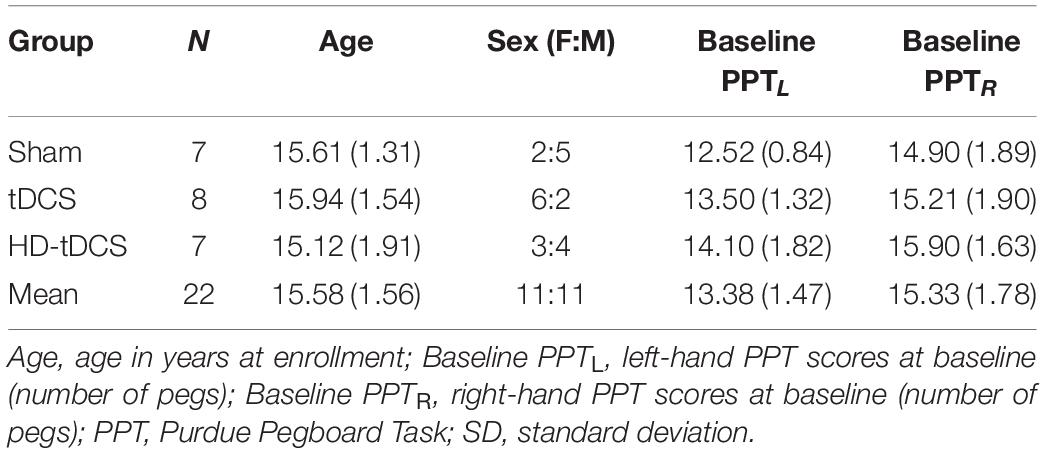
Table 1. Demographics and mean (SD) baseline PPT scores.
Effects of tDCS and HD-tDCS on Motor Learning
The effects of stimulation on motor learning are described in detail elsewhere (Cole et al., 2018). Briefly, on the primary trained motor task (PPTL) all participants showed an increase in number of pegs placed over five consecutive days of training, regardless of tDCS intervention (p < 0.001). Participants in the active stimulation groups (tDCS and HD-tDCS) had significantly enhanced rates of motor learning compared to Sham [tDCS t(117) = 2.058, p = 0.042; HD-tDCS t(117) = 1.986, p = 0.049]. Effects were sustained at 6 weeks retention time.
Mapping and Thresholds
Representative examples of LFDI motor maps overlaid on a 3D anatomical brain from one Sham participant and one tDCS participant across mapping sessions are depicted in Figure 2. Bilateral motor mapping was performed with a mean time of 37 min (SD 12 min, ranging 9–31 min) and was comparable between hemispheres.
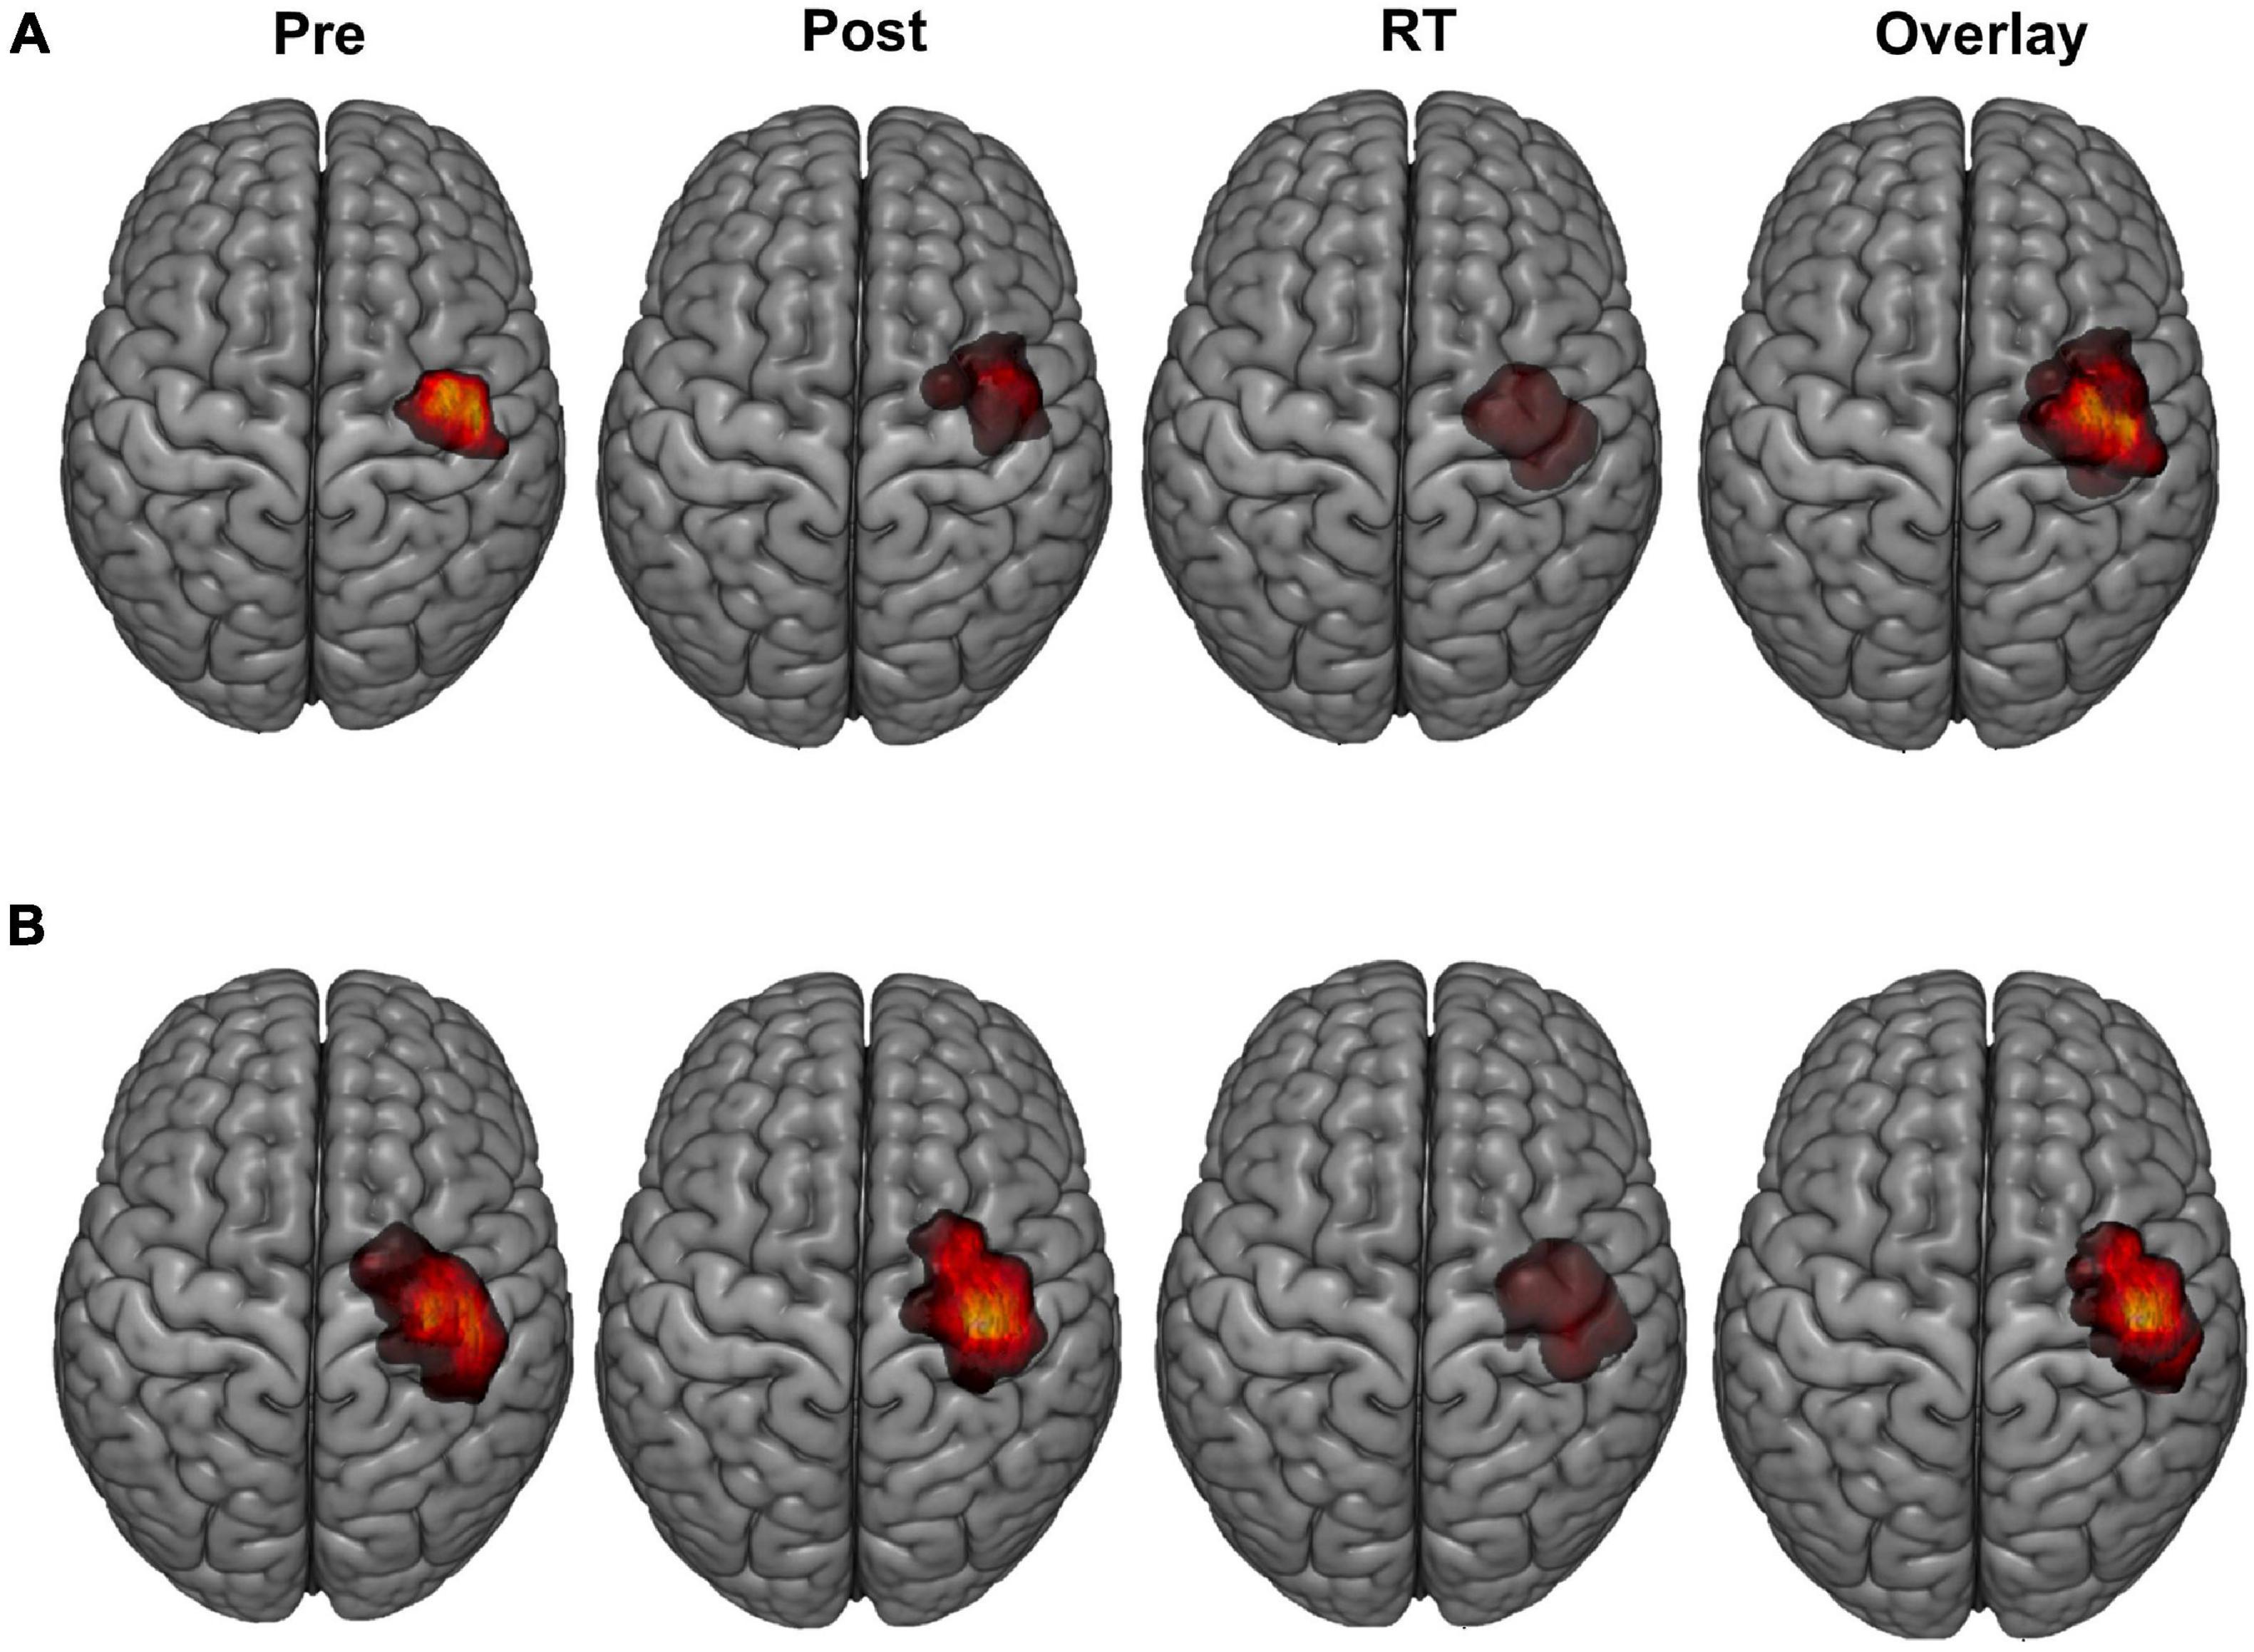
Figure 2. LFDI motor maps. Representative single subject examples of LFDI motor map across robotic TMS motor mapping sessions (pre, post, RT) and all three time points overlaid on a three-dimensional (3D) curvilinear brain from a Sham participant (A) and a participant in the tDCS group (B). Pre = baseline; Post = day 5; RT = six-weeks retention time; LFDI = left-hand first dorsal interosseous muscle.
Resting motor threshold was similar across treatment groups, mapping sessions and between the LFDI (pre = 60%, post = 58%, RT = 59%) and right-hand first dorsal interosseous (RFDI) (pre = 59%, post = 58%, RT = 58%). Linear mixed-effects modeling demonstrated no effects of time, stimulation, or interaction between time and stimulation on RMT in either FDI.
Motor Map Primary Outcomes in the LFDI Muscle
Bilateral FDI motor map outcomes of volume and area across mapping sessions are shown in Figure 3 and described in detail below for the trained LFDI.
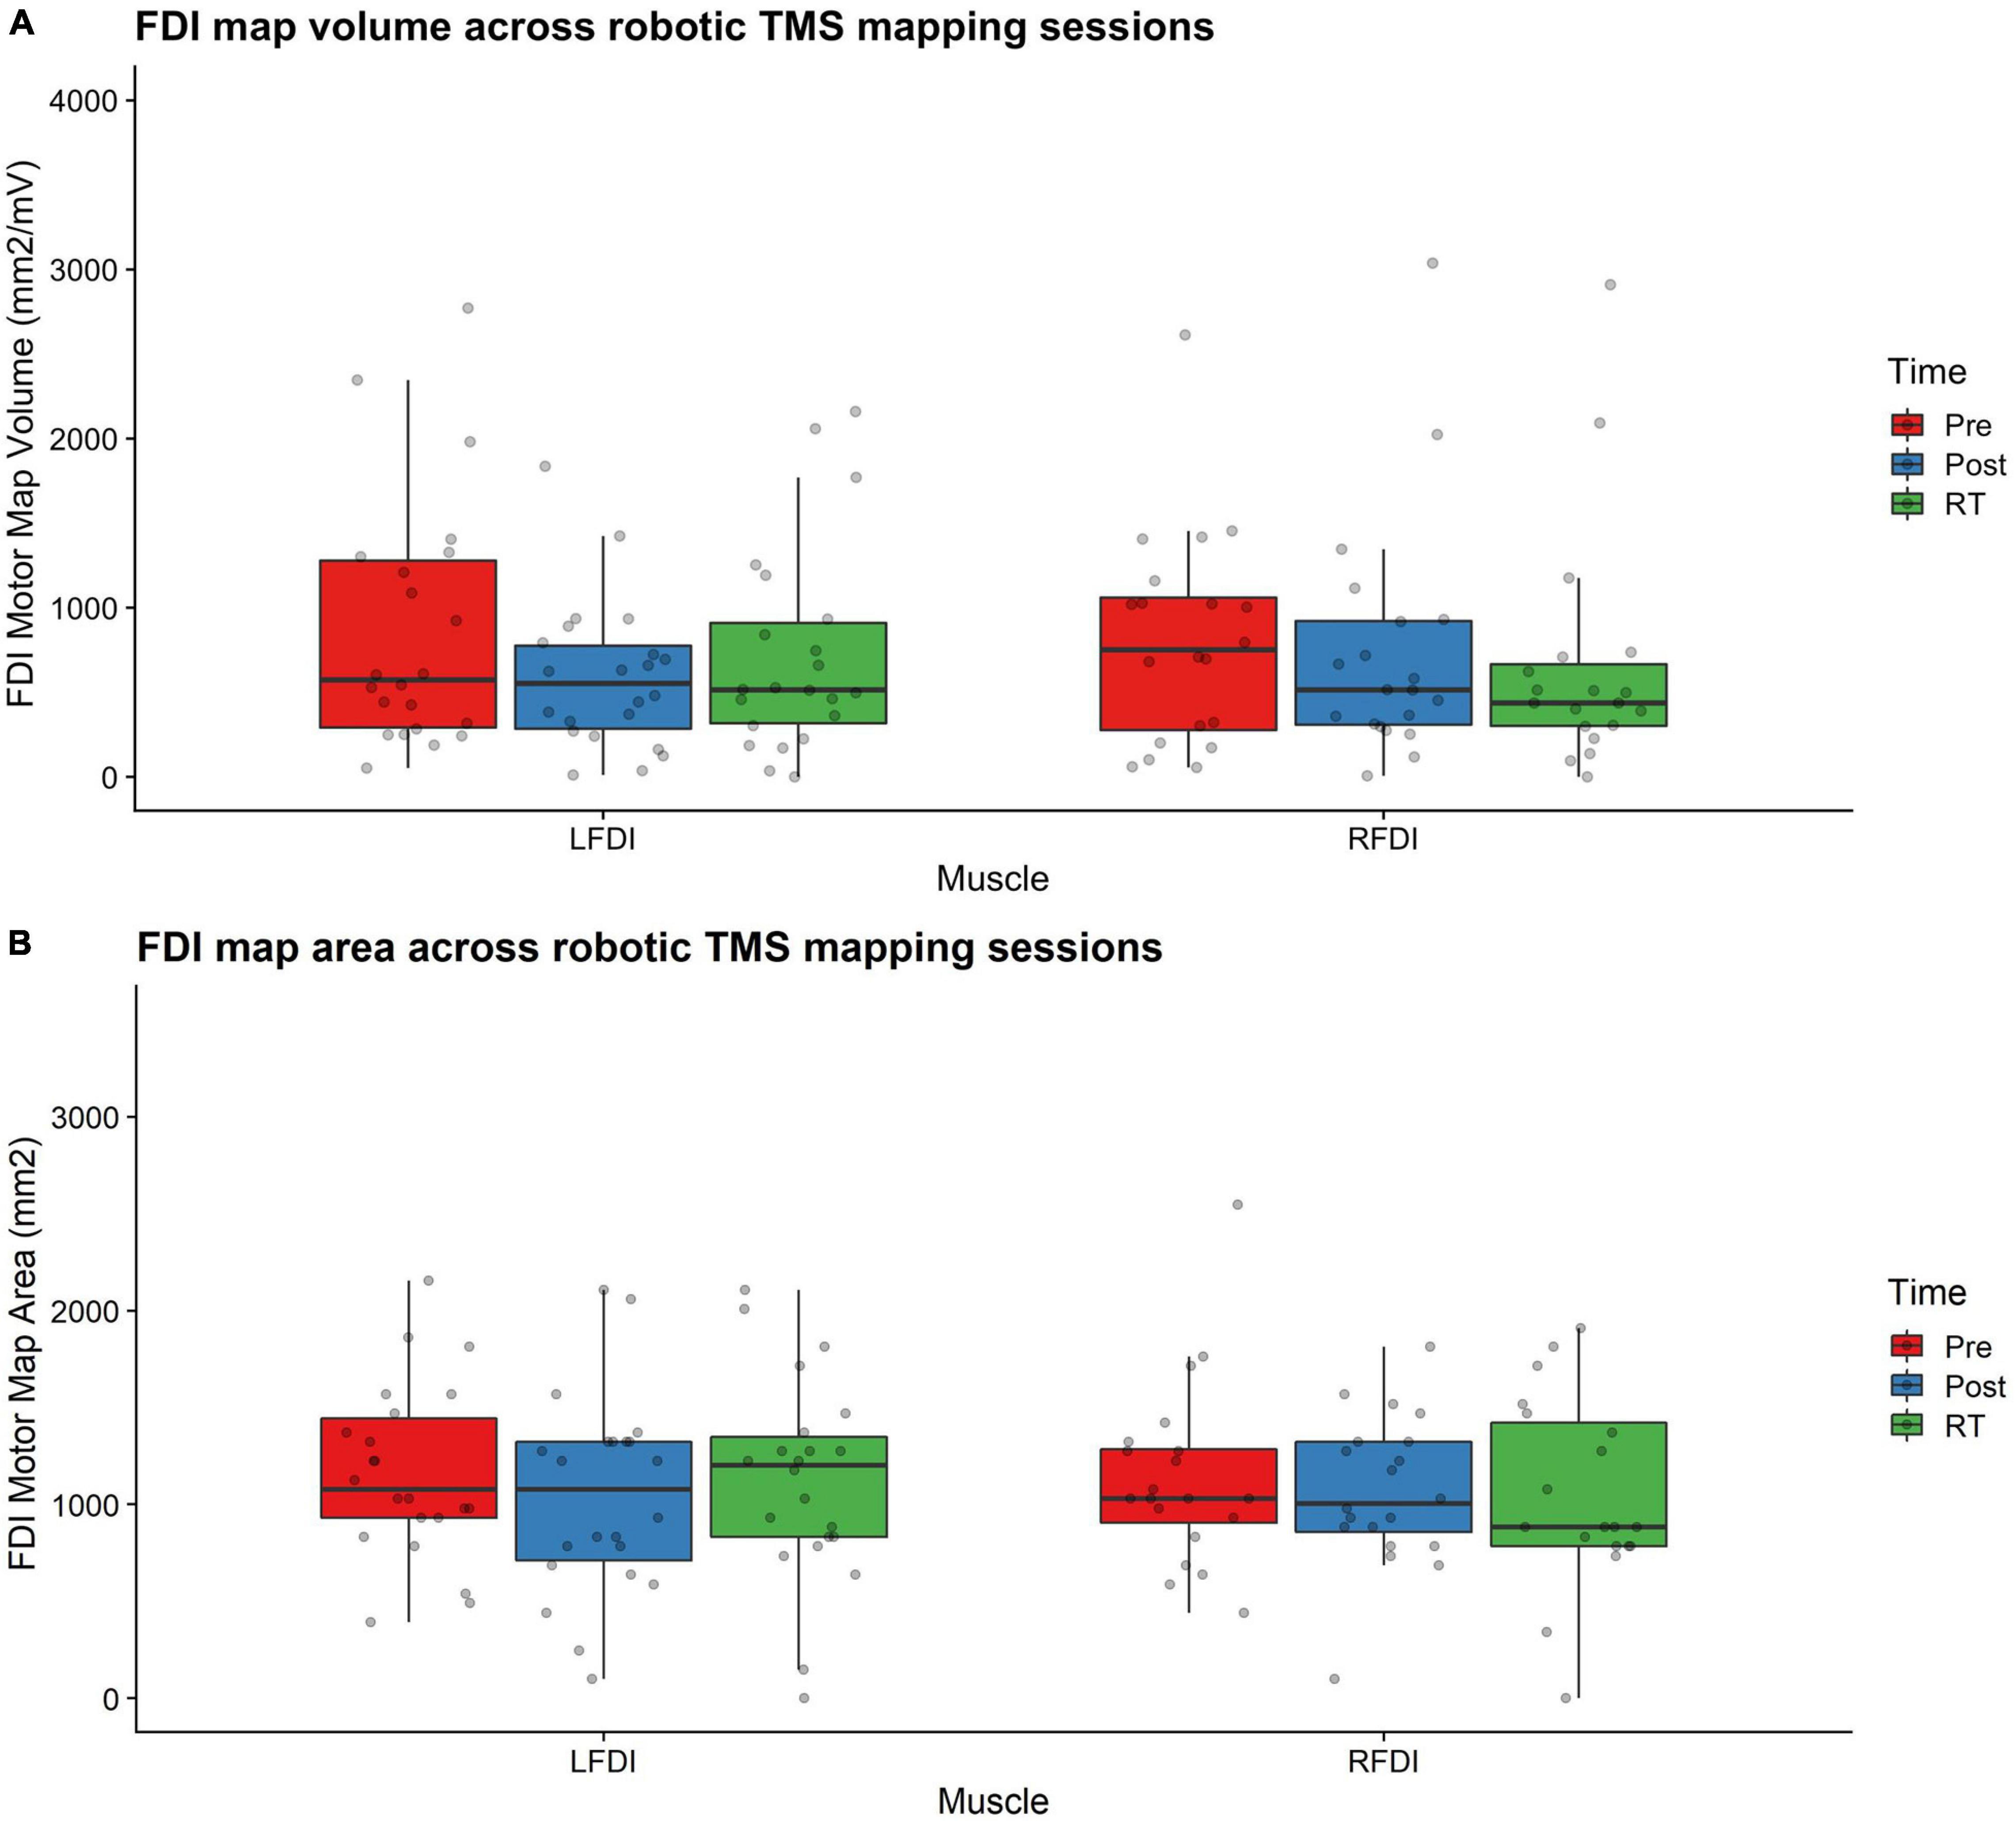
Figure 3. FDI map volume and area. (A) FDI map volume (mm2/mV) and (B) area (mm2) across robotic TMS motor mapping sessions. Map volume (mm2/mV) = Cumulative active map area × MEP amplitude (mV) at each responsive grid-point; Map area (mm2) = Grid spacing (49mm2) × number of responsive grid-points; LFDI = left-hand first dorsal interosseous muscle; RFDI = right-hand first dorsal interosseous muscle; Pre = baseline (red); Post = day 5 (blue); RT = six-weeks retention time (green). Box ends are interquartile range, the line is median, and the whiskers are 5–95%.
LFDI Map Volume
Left-hand FDI map volume and area across participants, stimulation (Active vs Sham) and stimulation type (tDCS, HD-tDCS, and Sham), and mapping sessions are depicted in Figure 4. Estimated marginal means of LFDI map volume are reported in Table 2. LFDI map volumes appeared stable across sessions (Figure 4A). No effects of time (F = 3.12, p = 0.055), stimulation (F = 1.34, p = 0.268), or any interaction between time and stimulation (F = 1.01, p = 0.373) were observed on LFDI map volume between stimulation groups (Figure 4B). LFDI map volumes were comparable at the pre timepoint between stimulation groups (F = 1.642, p = 0.220). There were no effects of time (F = 2.23, p = 0.122), stimulation type (F = 0.91, p = 0.431), or any interaction between time and stimulation type (F = 0.57, p = 0.684) on LFDI motor map volume when examined across the three intervention groups (Figure 4C). Fixed parameter effects of LFDI volume across both any stimulation and each stimulation type are reported in Tables 3, 4.
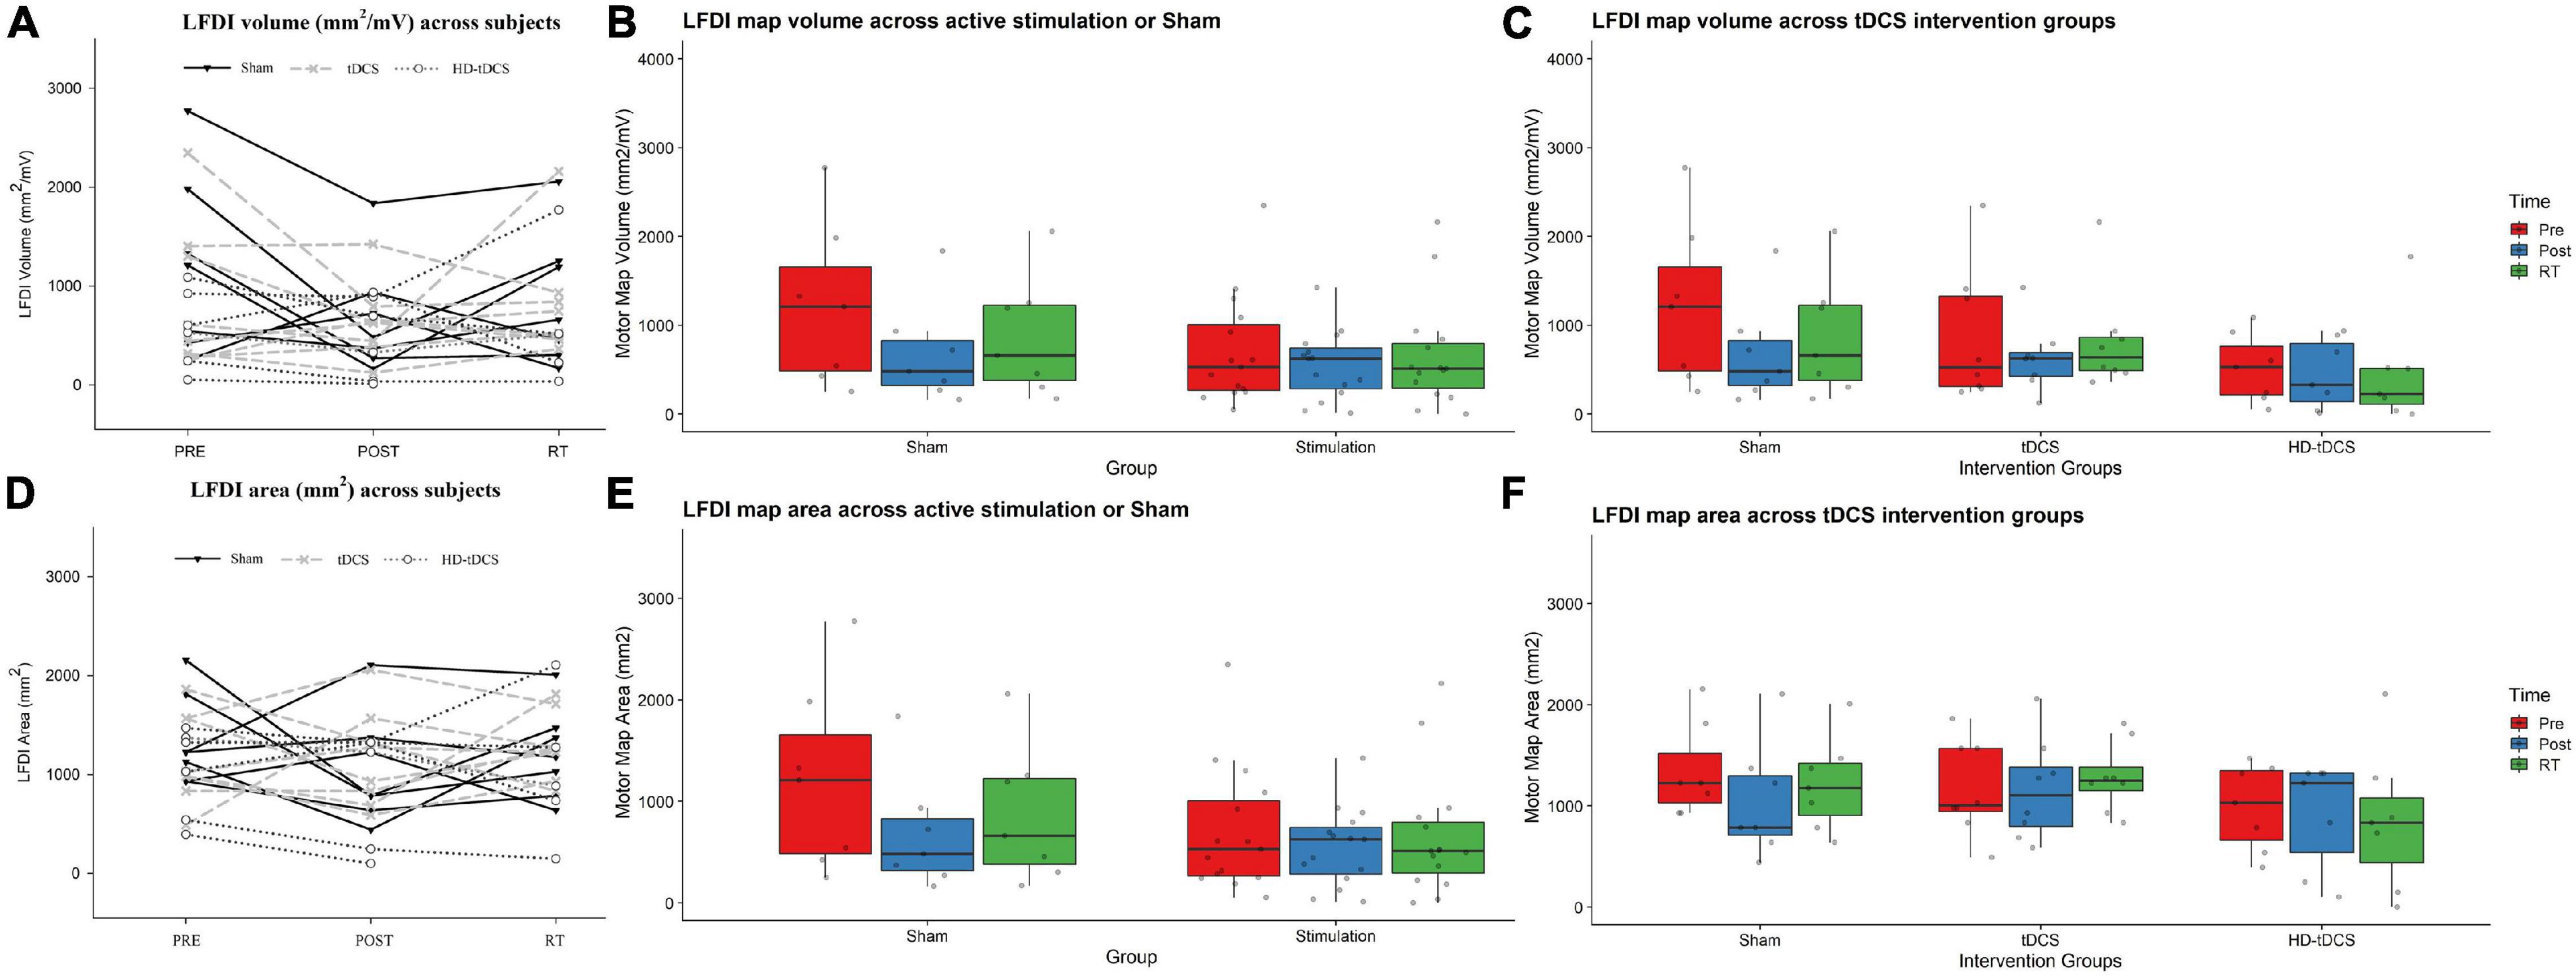
Figure 4. LFDI map volume and area across robotic TMS motor mapping sessions. (A) LFDI map volume (mm2/mV) of each participant across mapping sessions. (B) LFDI map volume (mm2/mV) in active stimulation groups (tDCS and HD-tDCS) and Sham. (C) LFDI map volume (mm2/mV) in intervention groups (tDCS, HD-tDCS and Sham). (D) LFDI map area (mm2) of each participant across motor mapping sessions. (E) LFDI map area (mm2) in active stimulation groups (tDCS and HD-tDCS) and Sham. (F) LFDI map area (mm2) in intervention groups (tDCS, HD-tDCS, and Sham). Map volume (mm2/mV) = Cumulative active map area × MEP amplitude (mV) at each responsive grid-point; Map area (mm2) = Grid spacing (49mm2) × number of responsive grid-points; Black line with triangle = Sham participants; Gray dashed line with X = tDCS participants; Gray dotted line with circle = HD-tDCS; LFDI = left-hand first dorsal interosseous muscle; Pre = baseline; Post = day 5; RT = six-weeks retention time. Box ends are interquartile range, the line is median, and the whiskers are 5–95%.
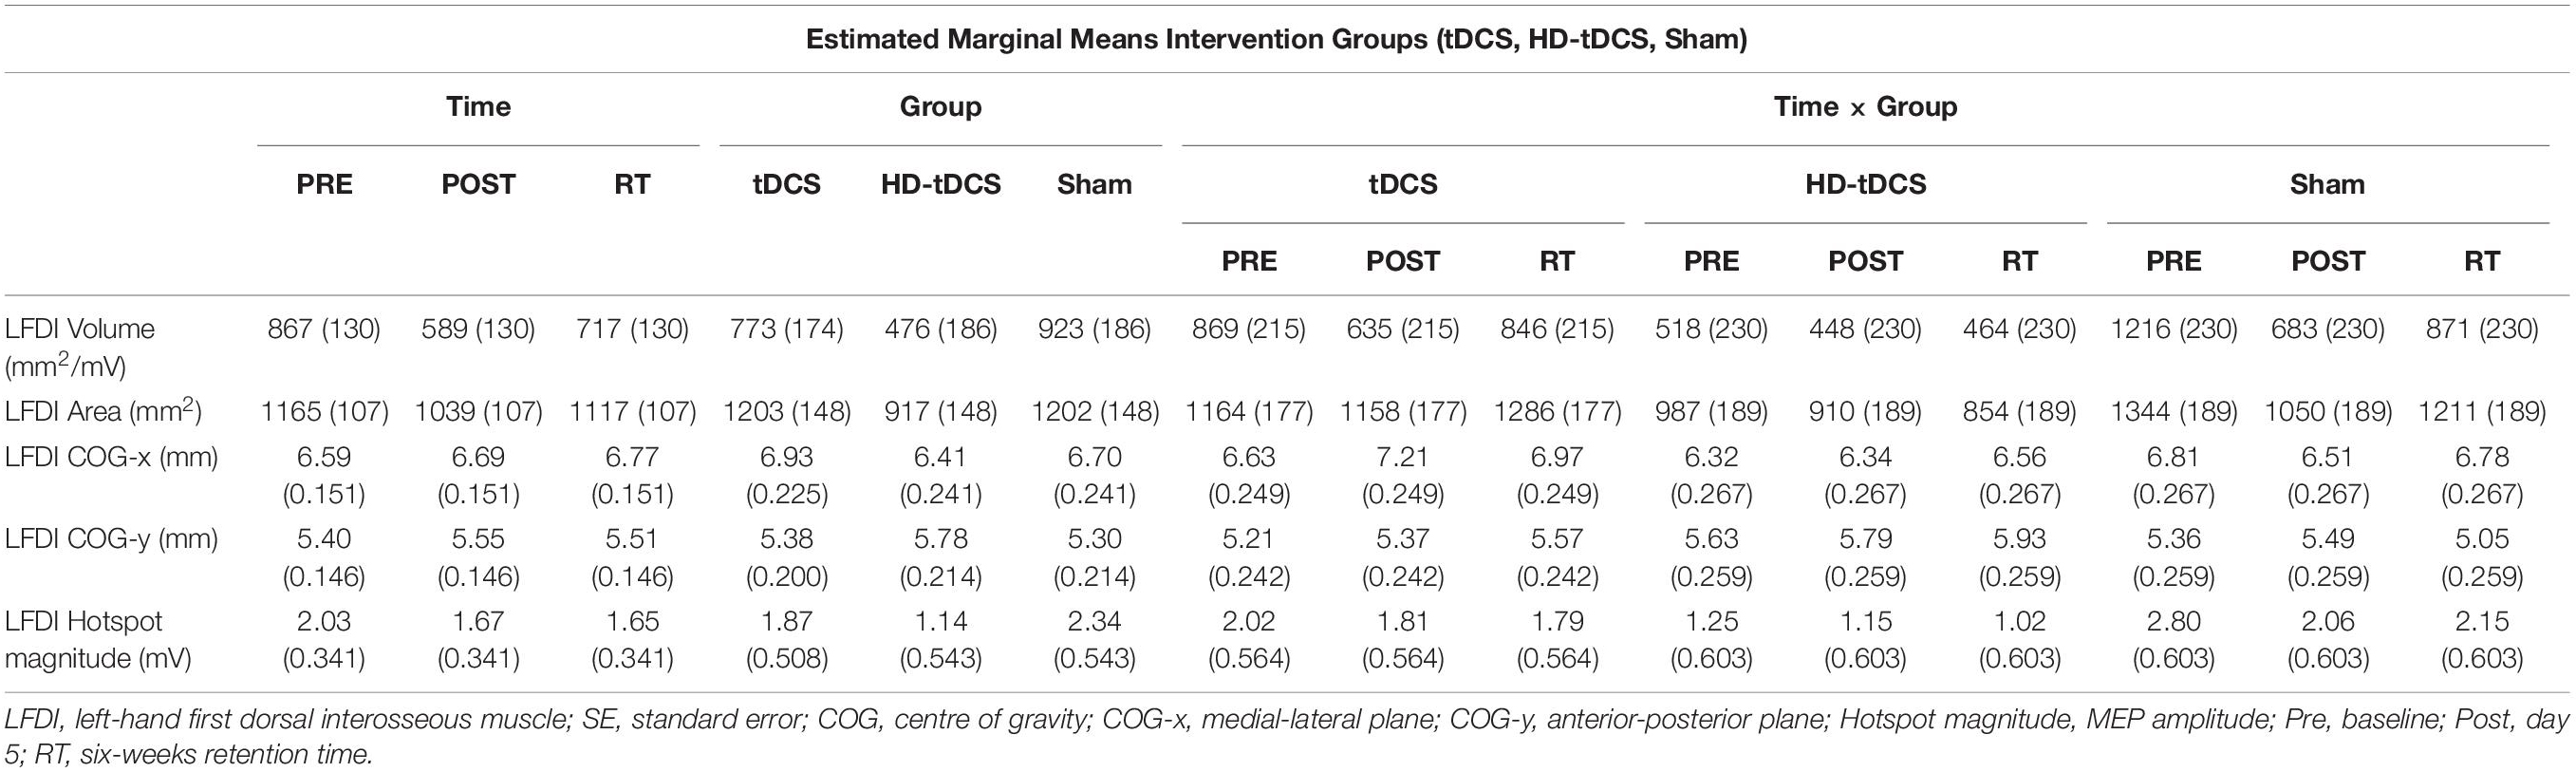
Table 2. LFDI estimated marginal means (SE) of robotic TMS motor map outcomes across intervention groups.
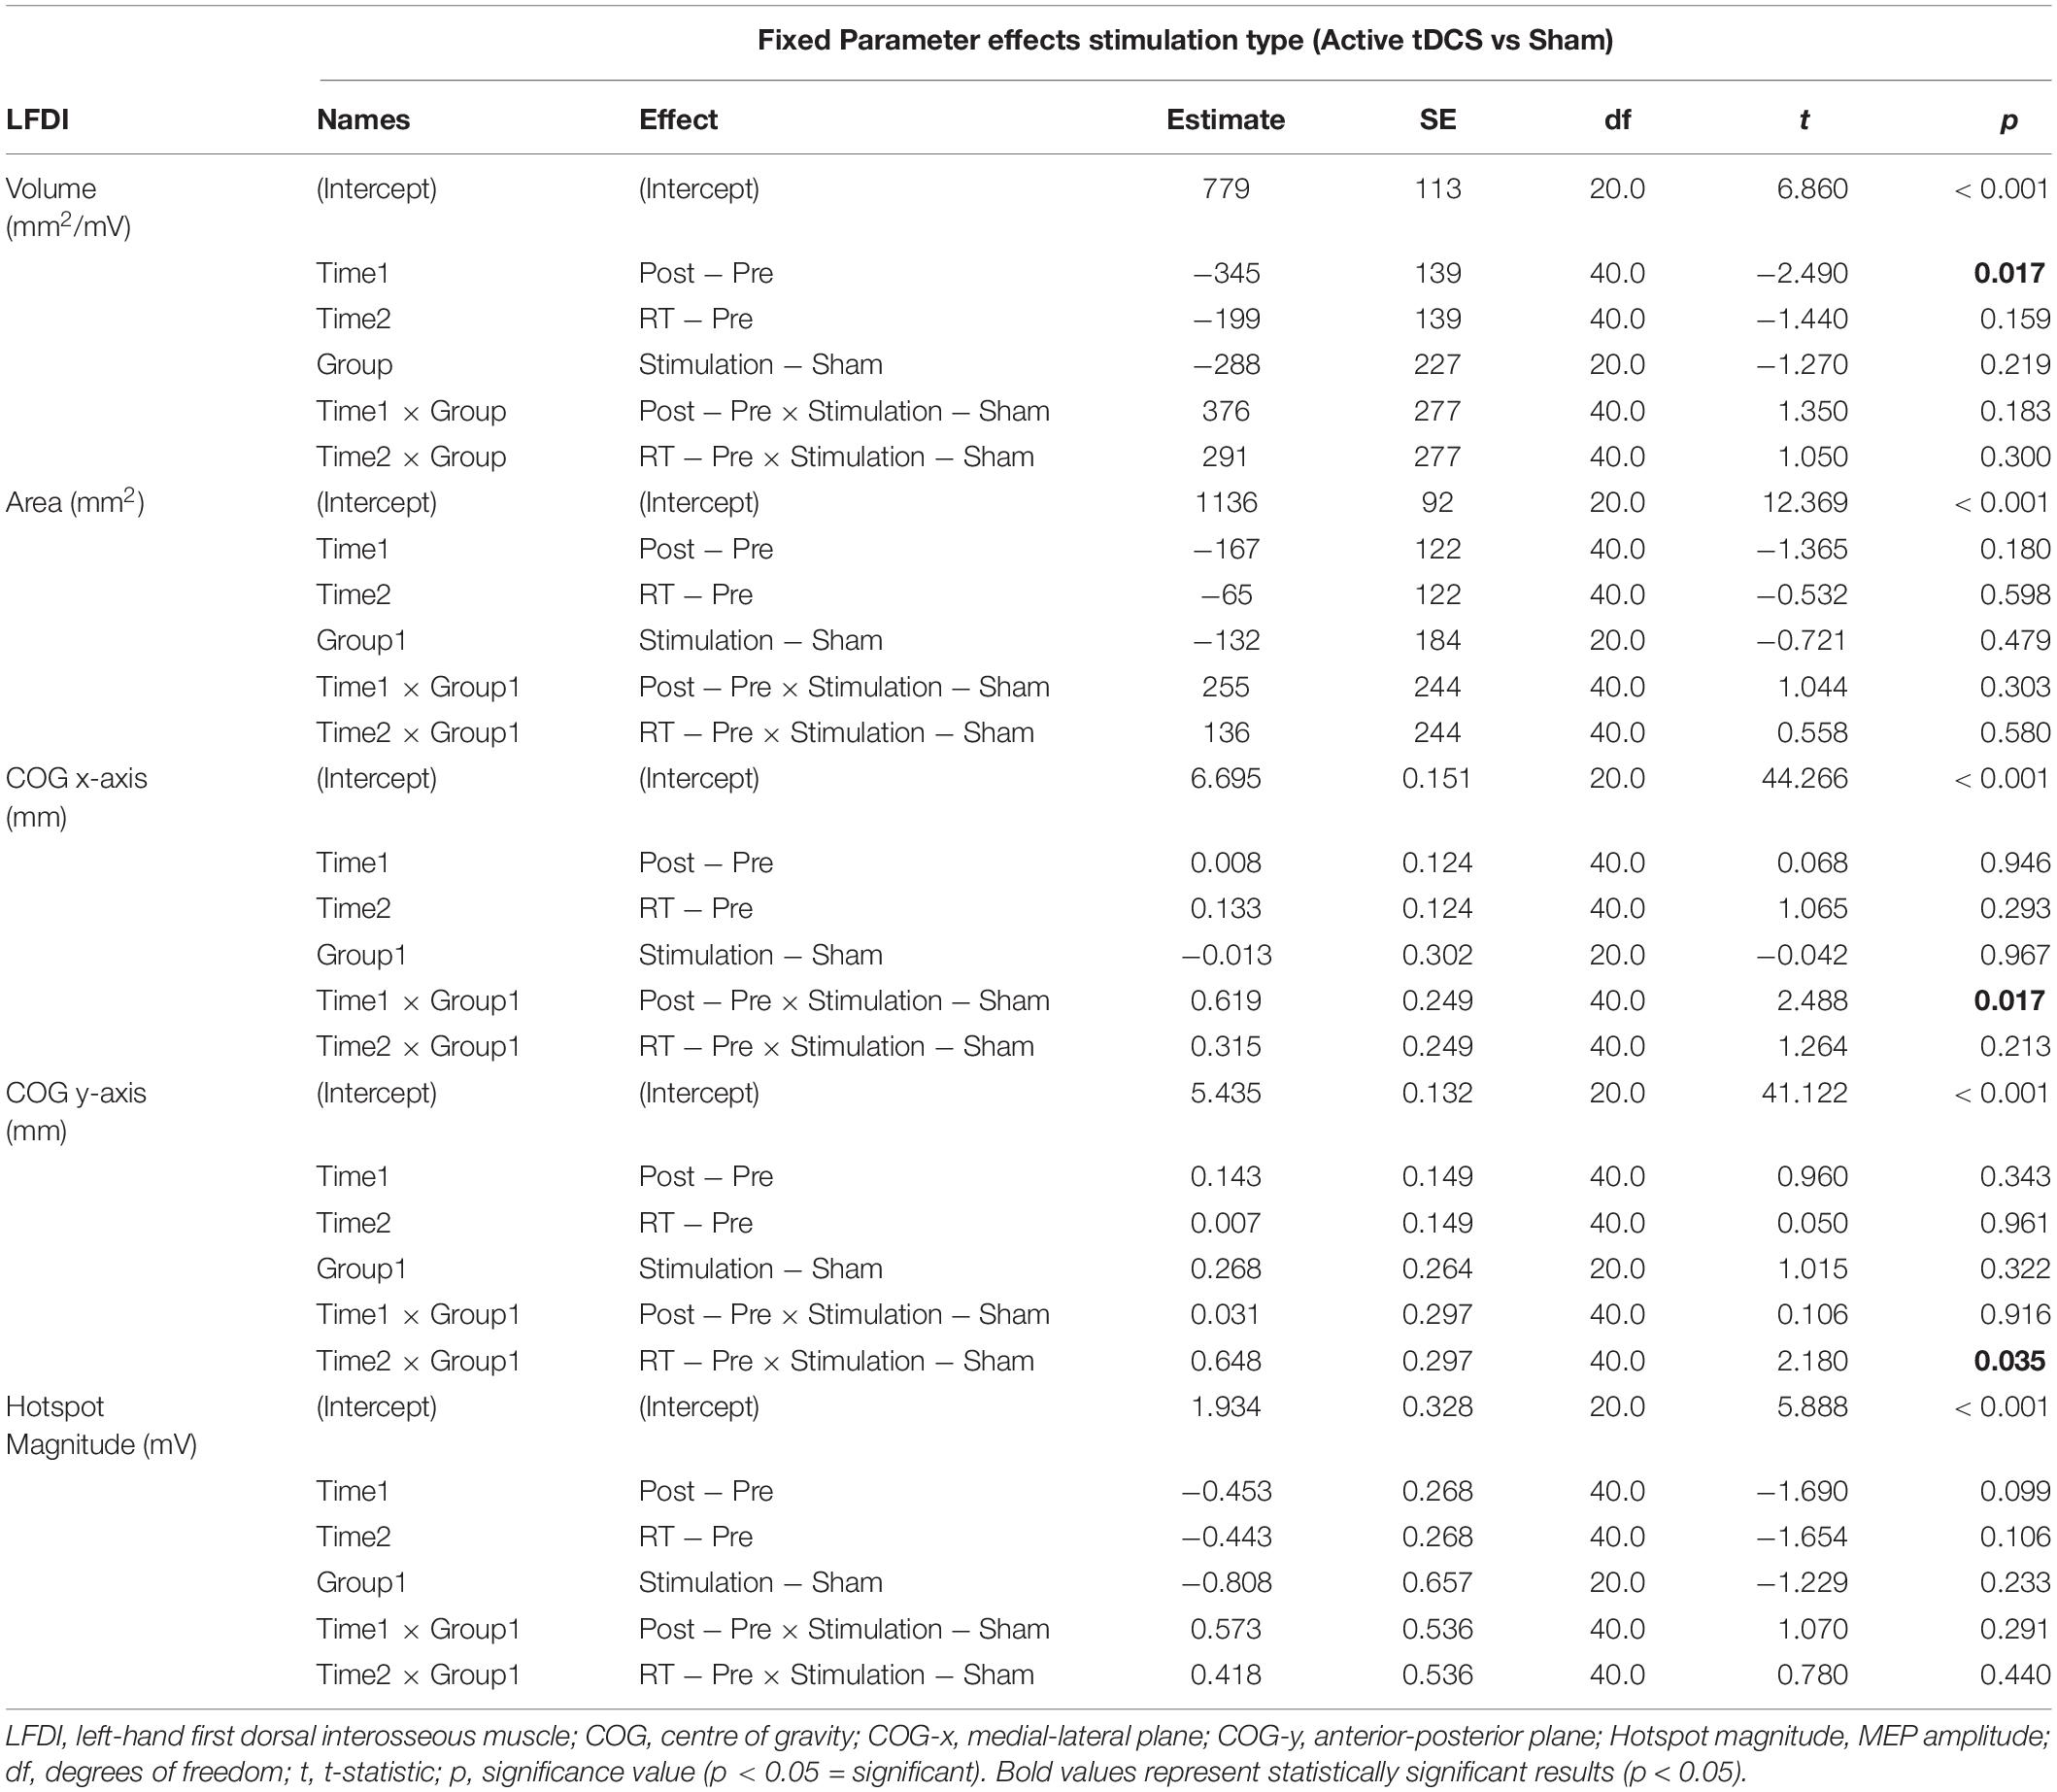
Table 3. LFDI fixed parameters for motor map outcomes across Active and Sham stimulation (stimulation).
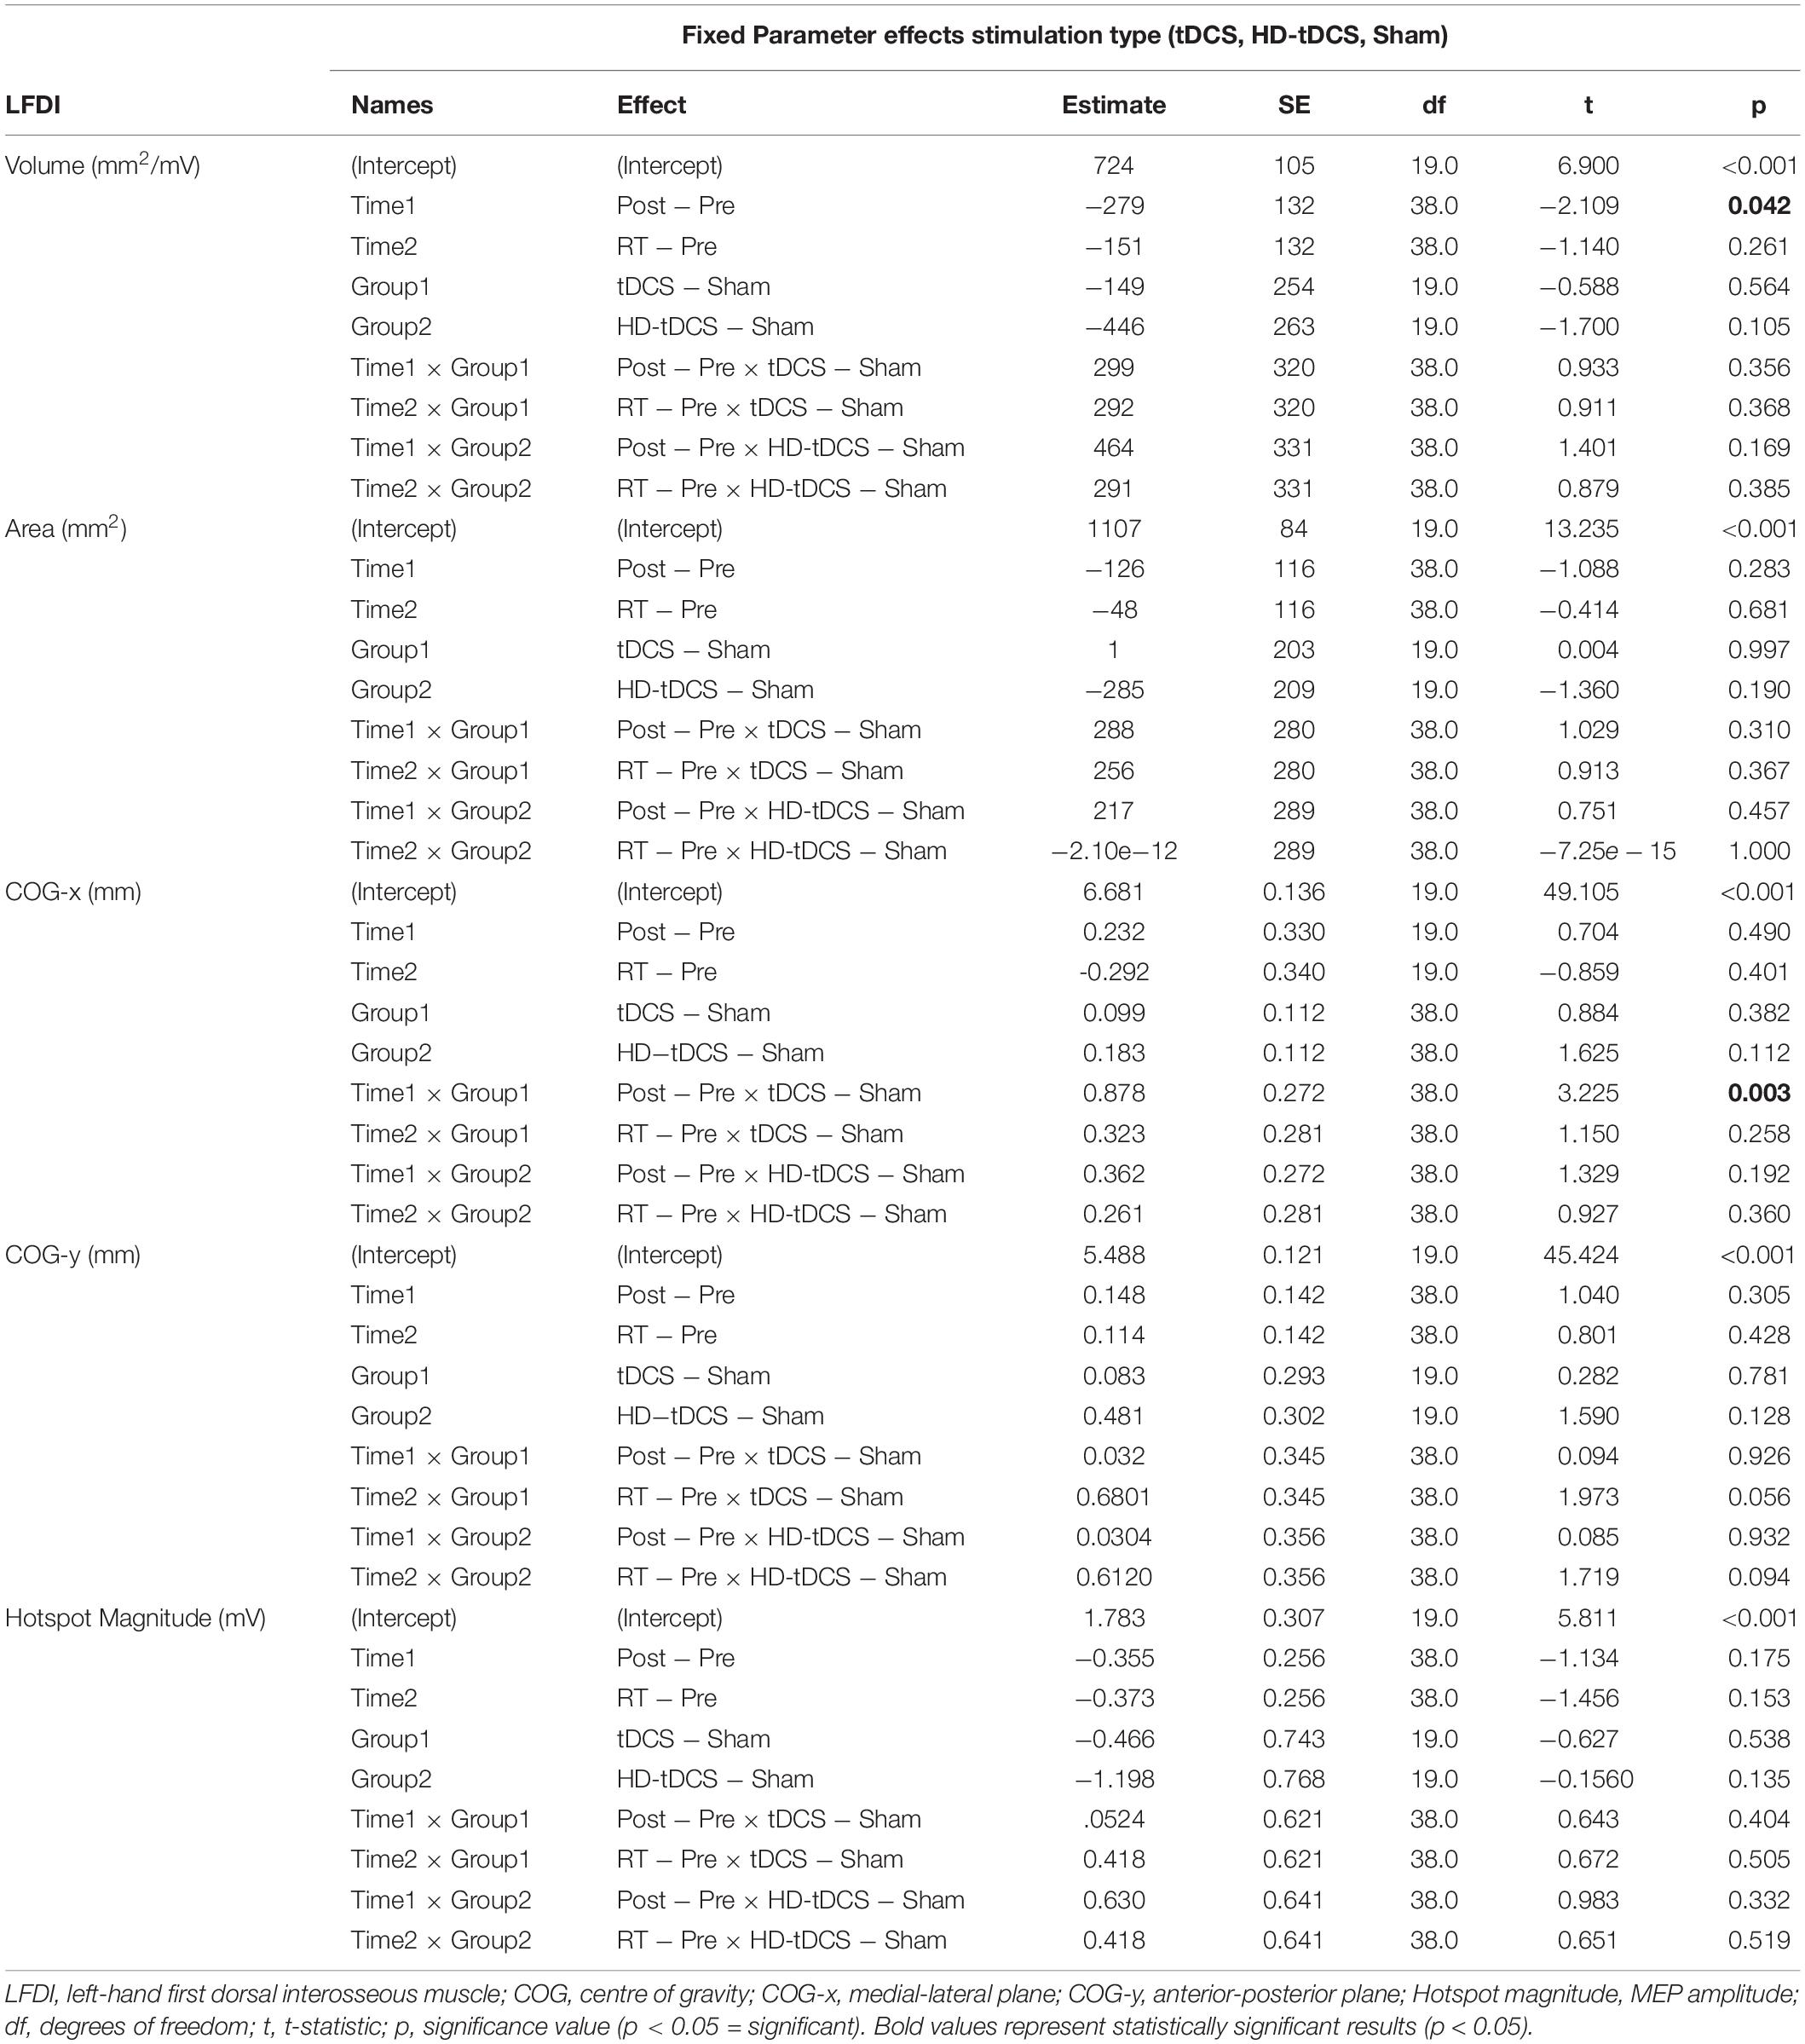
Table 4. LFDI fixed parameters for motor map outcomes across intervention groups (stimulation type).
LFDI Map Area
Map area for LFDI did not differ across mapping sessions regardless of stimulation group (Figure 4D). Estimated marginal means of LFDI map area are reported in Table 2. There were no effects of time (F = 0.947, p = 0.396), stimulation (F = 0.520, p = 0.479), or any interaction between time and stimulation (F = 0.546, p = 0.584) on LFDI map area between active forms of stimulation and Sham (Figure 4E). LFDI map areas were comparable at the pre timepoint between stimulation groups (F = 1.100, p = 0.353). Similarly, there was no effect of time (F = 2.23, p = 0.122), stimulation type (F = 0.91, p = 0.431), or any interaction between time and stimulation type (F = 0.57, p = 0.684) on LFDI motor map volume across the three intervention groups (Figure 4F). Fixed parameter effects of LFDI area across both stimulation and stimulation type are reported in Tables 3, 4.
LFDI Secondary Motor Mapping Outcomes
LFDI Centre of Gravity
We investigated whether LFDI COG in the 2D x- or y-plane shifted following motor learning and stimulation between mapping sessions. Estimated marginal means are reported in Table 2. Fixed effects parameter estimates for LFDI COG in the medial-lateral plane (x-axis, COG-x) and anterior-posterior plane (y-axis, COG-y) between stimulation (Active or Sham) and stimulation type (tDCS, HD-tDCS and Sham) are reported in Tables 3, 4.
There was a significant interaction between time and stimulation type on LFDI COG-x (F = 2.83, p = 0.038) between intervention groups (Figure 5). From pre-to-post, the degree of change in COG-x differed between tDCS and Sham [t(38) = 3.225, p = 0.003]. There was no effect of time (F = 1.32, p = 0.278) or stimulation type (F = 1.27, p = 0.305) on LFDI COG-x. LFDI COG-y showed no effects of time (F = 0.59, p = 0.558), stimulation type (F = 1.46, p = 0.257), or any interaction between time and stimulation type (F = 1.45, p = 0.236) across intervention groups. Between Active or Sham, LFDI COG-x showed no effect of time (F = 0.71, p = 0.497), stimulation (F = 0.001, p = 0.967) or any interaction between time and stimulation type (F = 3.10, p = 0.056). LFDI COG-y also showed no effect of time (F = 0.59, p = 0.562), stimulation (F = 1.08, p = 0.322) or any interaction between time and stimulation type (F = 3.02, p = 0.060).
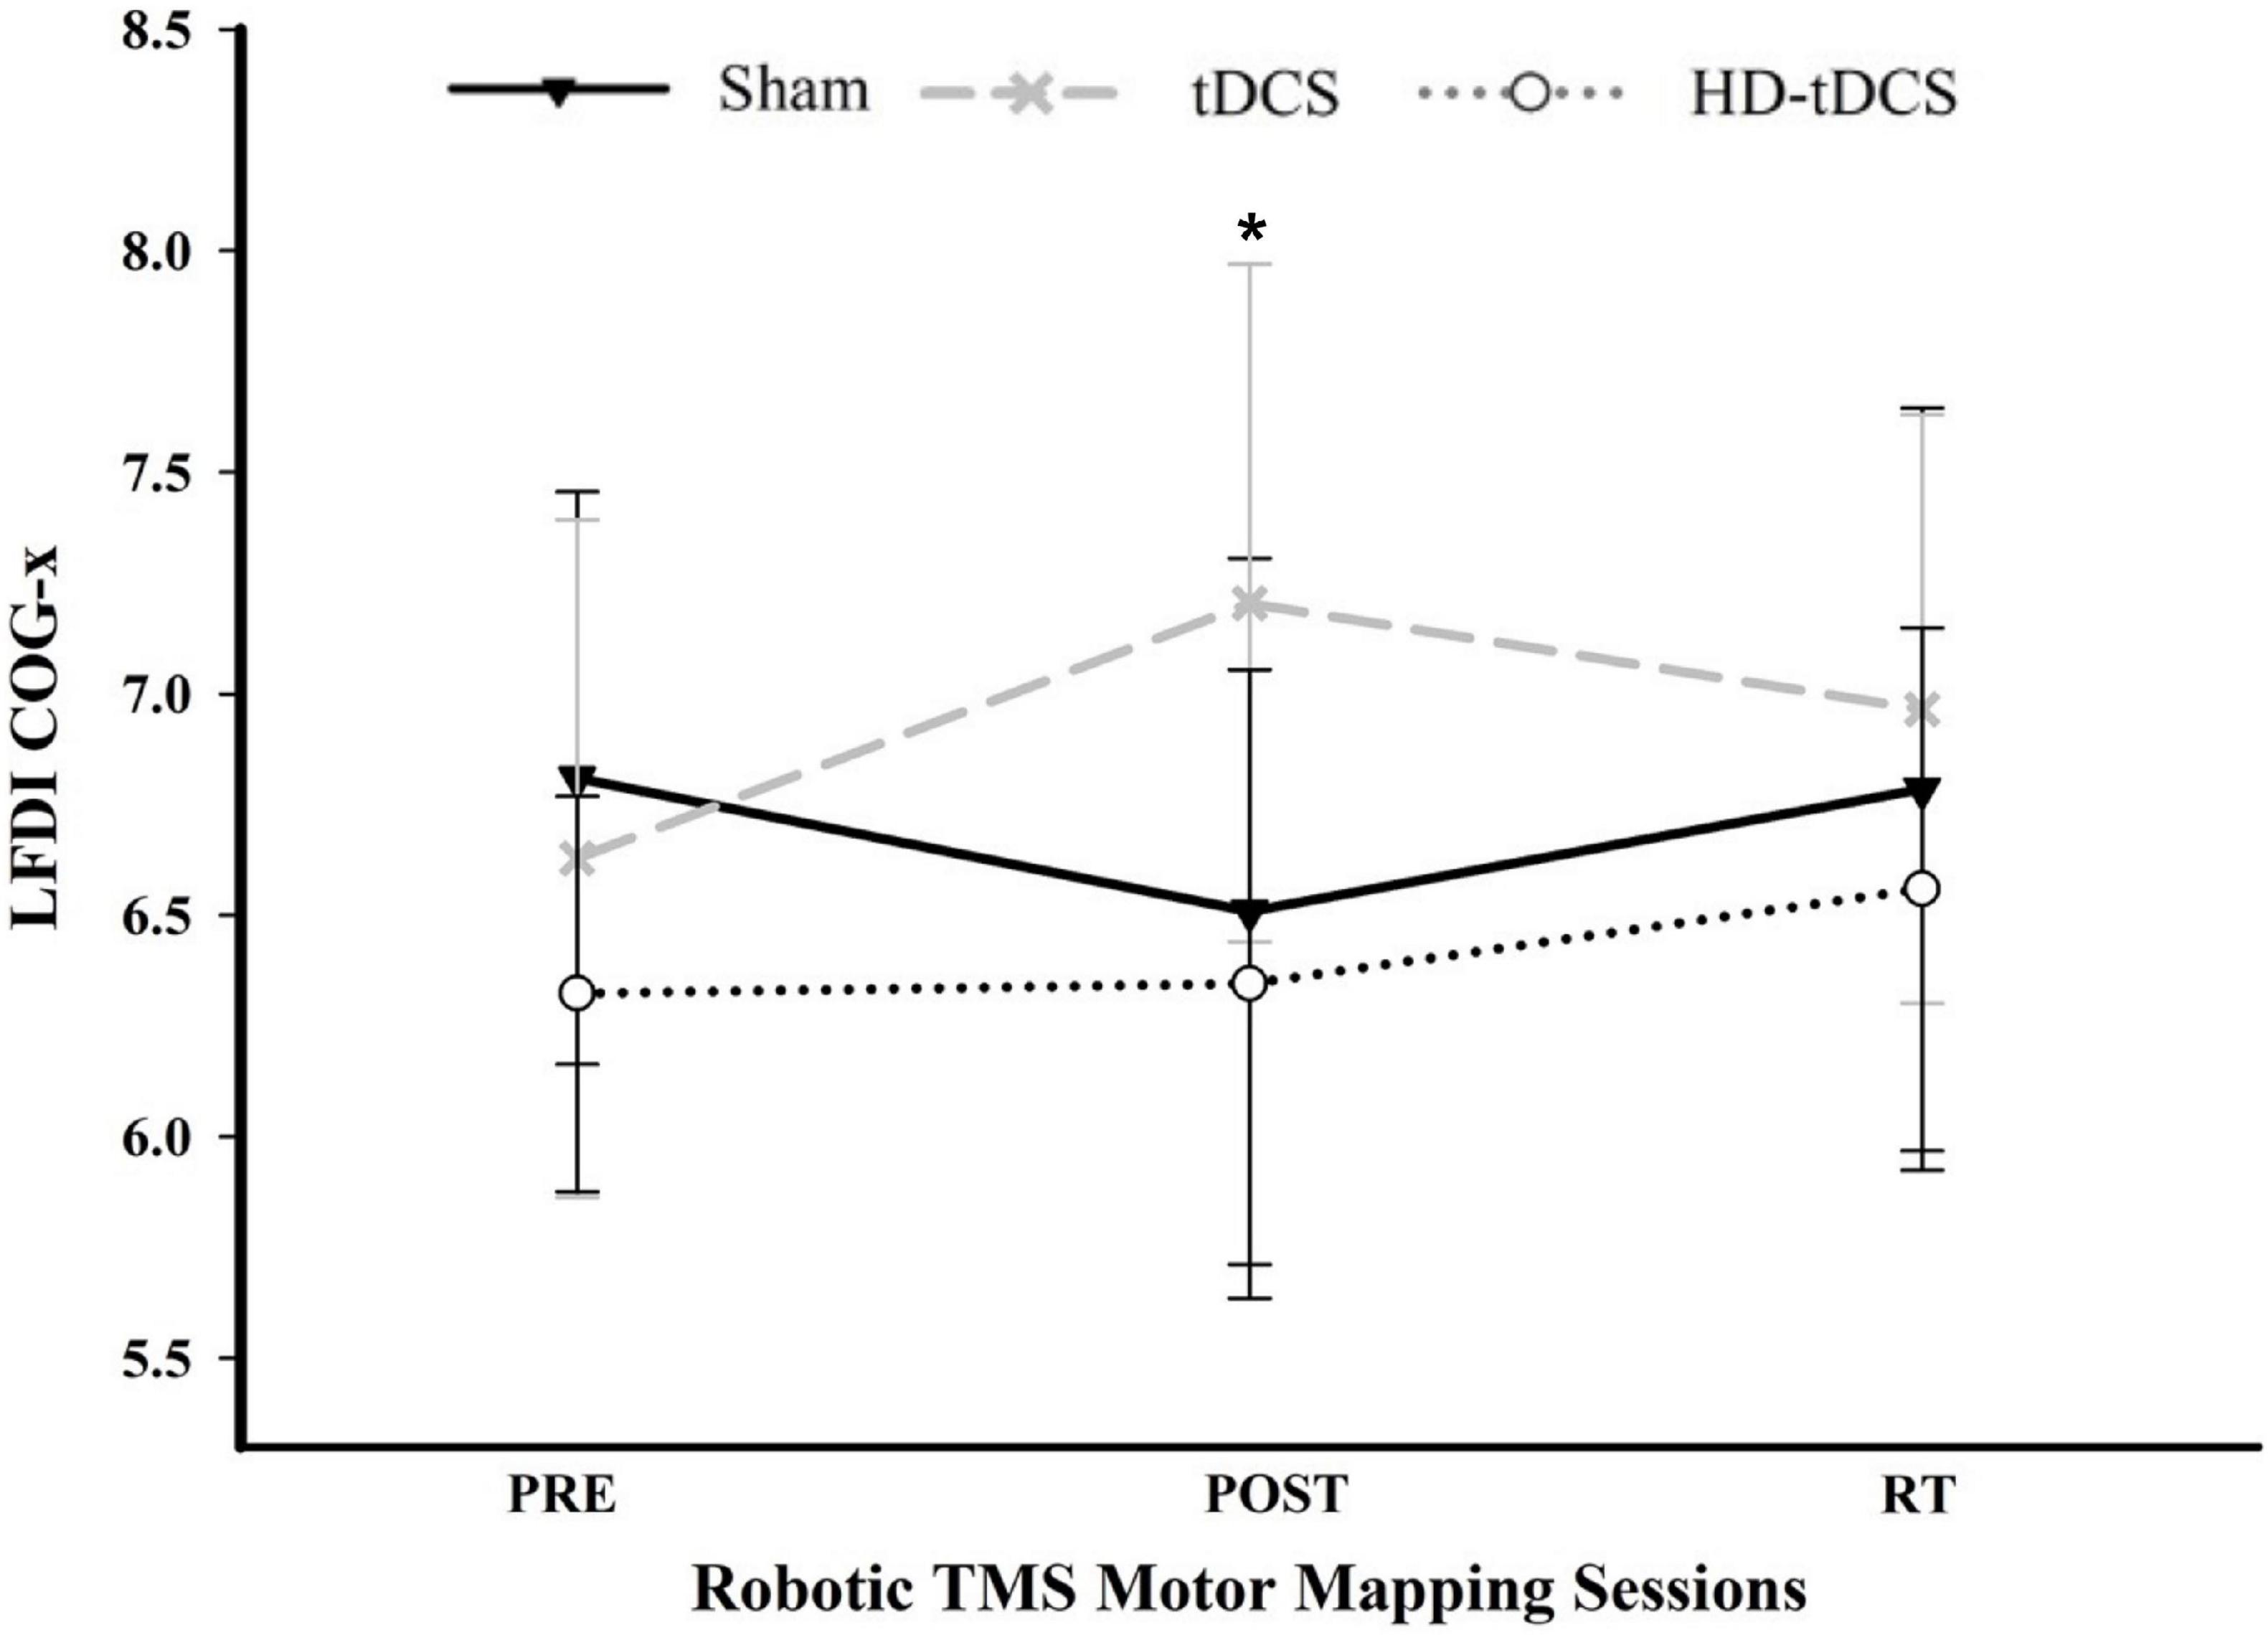
Figure 5. COG-x across mapping sessions. Mean LFDI COG-x (mm) between intervention groups across time points. Change in COG-x significantly differed between tDCS and Sham from the pre-to-post mapping sessions (p = 0.003). Black line = Sham; Gray dashed line = tDCS; Gray dotted line = HD-tDCS; LFDI = left-hand first dorsal interosseous muscle; COG-x = centre of gravity medial-lateral plane; RT = six-weeks retention time. Error bars = standard deviation. *p < 0.05.
LFDI Hotspot Magnitude
Left-Hand First Dorsal Interosseous hotspot magnitude did not differ across mapping sessions regardless of stimulation group. Estimated marginal means for LFDI hotspot magnitude are reported in Table 2. Fixed effects parameter estimates for LFDI hotspot magnitude between stimulation (Active or Sham) and stimulation type are reported in Tables 3, 4.
There were no effects of time (F = 1.87, p = 0.168), stimulation (F = 1.51, p = 0.233), or any interaction between time and stimulation (F = 0.61, p = 0.547) on LFDI hotspot magnitude between Active stimulations and Sham. Similarly, there was no effect of time (F = 1.35, p = 0.272), stimulation type (F = 1.24, p = 0.312), or any interaction between time and stimulation type (F = 0.30, p = 0.875) on LFDI hotspot magnitude across the three intervention groups.
Motor Map Outcomes for Left-Hand Secondary Muscles and Right-Hand Muscles
Map outcomes for left-hand secondary muscles (APB and ADM) and right-hand muscles are summarised in Supplementary Table 1. In secondary muscles of the trained left-hand, we observed significant interactions for LAPB and LADM COG-x between time and stimulation (LAPB F = 6.62, p = 0.003; LADM F = 7.40, p = 0.002) and stimulation type (LAPB F = 4.23, p = 0.006; LADM F = 5.16, p = 0.002). From pre-to-RT, change in COG-x differed between Active (tDCS and HD-tDCS) and Sham [LAPB t(38) = −3.537, p = 0.001; LADM t(38) = −3.688, p < 0.001). No effects of stimulation, stimulation type, or time were observed on map volume, area, hotspot magnitude, or COG-y, within the left-hand secondary muscles.
Right-hand first dorsal interosseous map volume and area across time and stimulation type are depicted in Supplementary Figure 1. No significant effects were observed on map volume, area, hotspot magnitude, COG-x, or COG-y in any of the untrained right-hand muscles.
Purdue Pegboard Task Performance and First Dorsal Interosseous Map Volume and Area
We investigated associations between the change in motor performance scores of the left-hand (PPTL) and right-hand (PPTR) and the change in FDI map volume and area from the pre-to-post mapping sessions (Figure 6). In the trained left-hand, linear regression found no relationship between change in PPTL performance and change in LFDI map volume (R = 0.196, t = −0.451, p = 0.657) or area (R = 0.204, t = 0.516, p = 0.612) (Figures 6A,B). Similarly in the untrained right-hand, no relationship between the change in PPTR performance and the change in RFDI map volume (R = 0.281, t = 1.062, p = 0.303) or area (R = 0.158, t = −0.351, p = 0.730) was found (Figures 6C,D). Lastly, linear regression found no significant relationship between change in map volume or area of the left- and right-hand secondary muscles (APB and ADM) and change in PPT from pre-to-post mapping sessions.
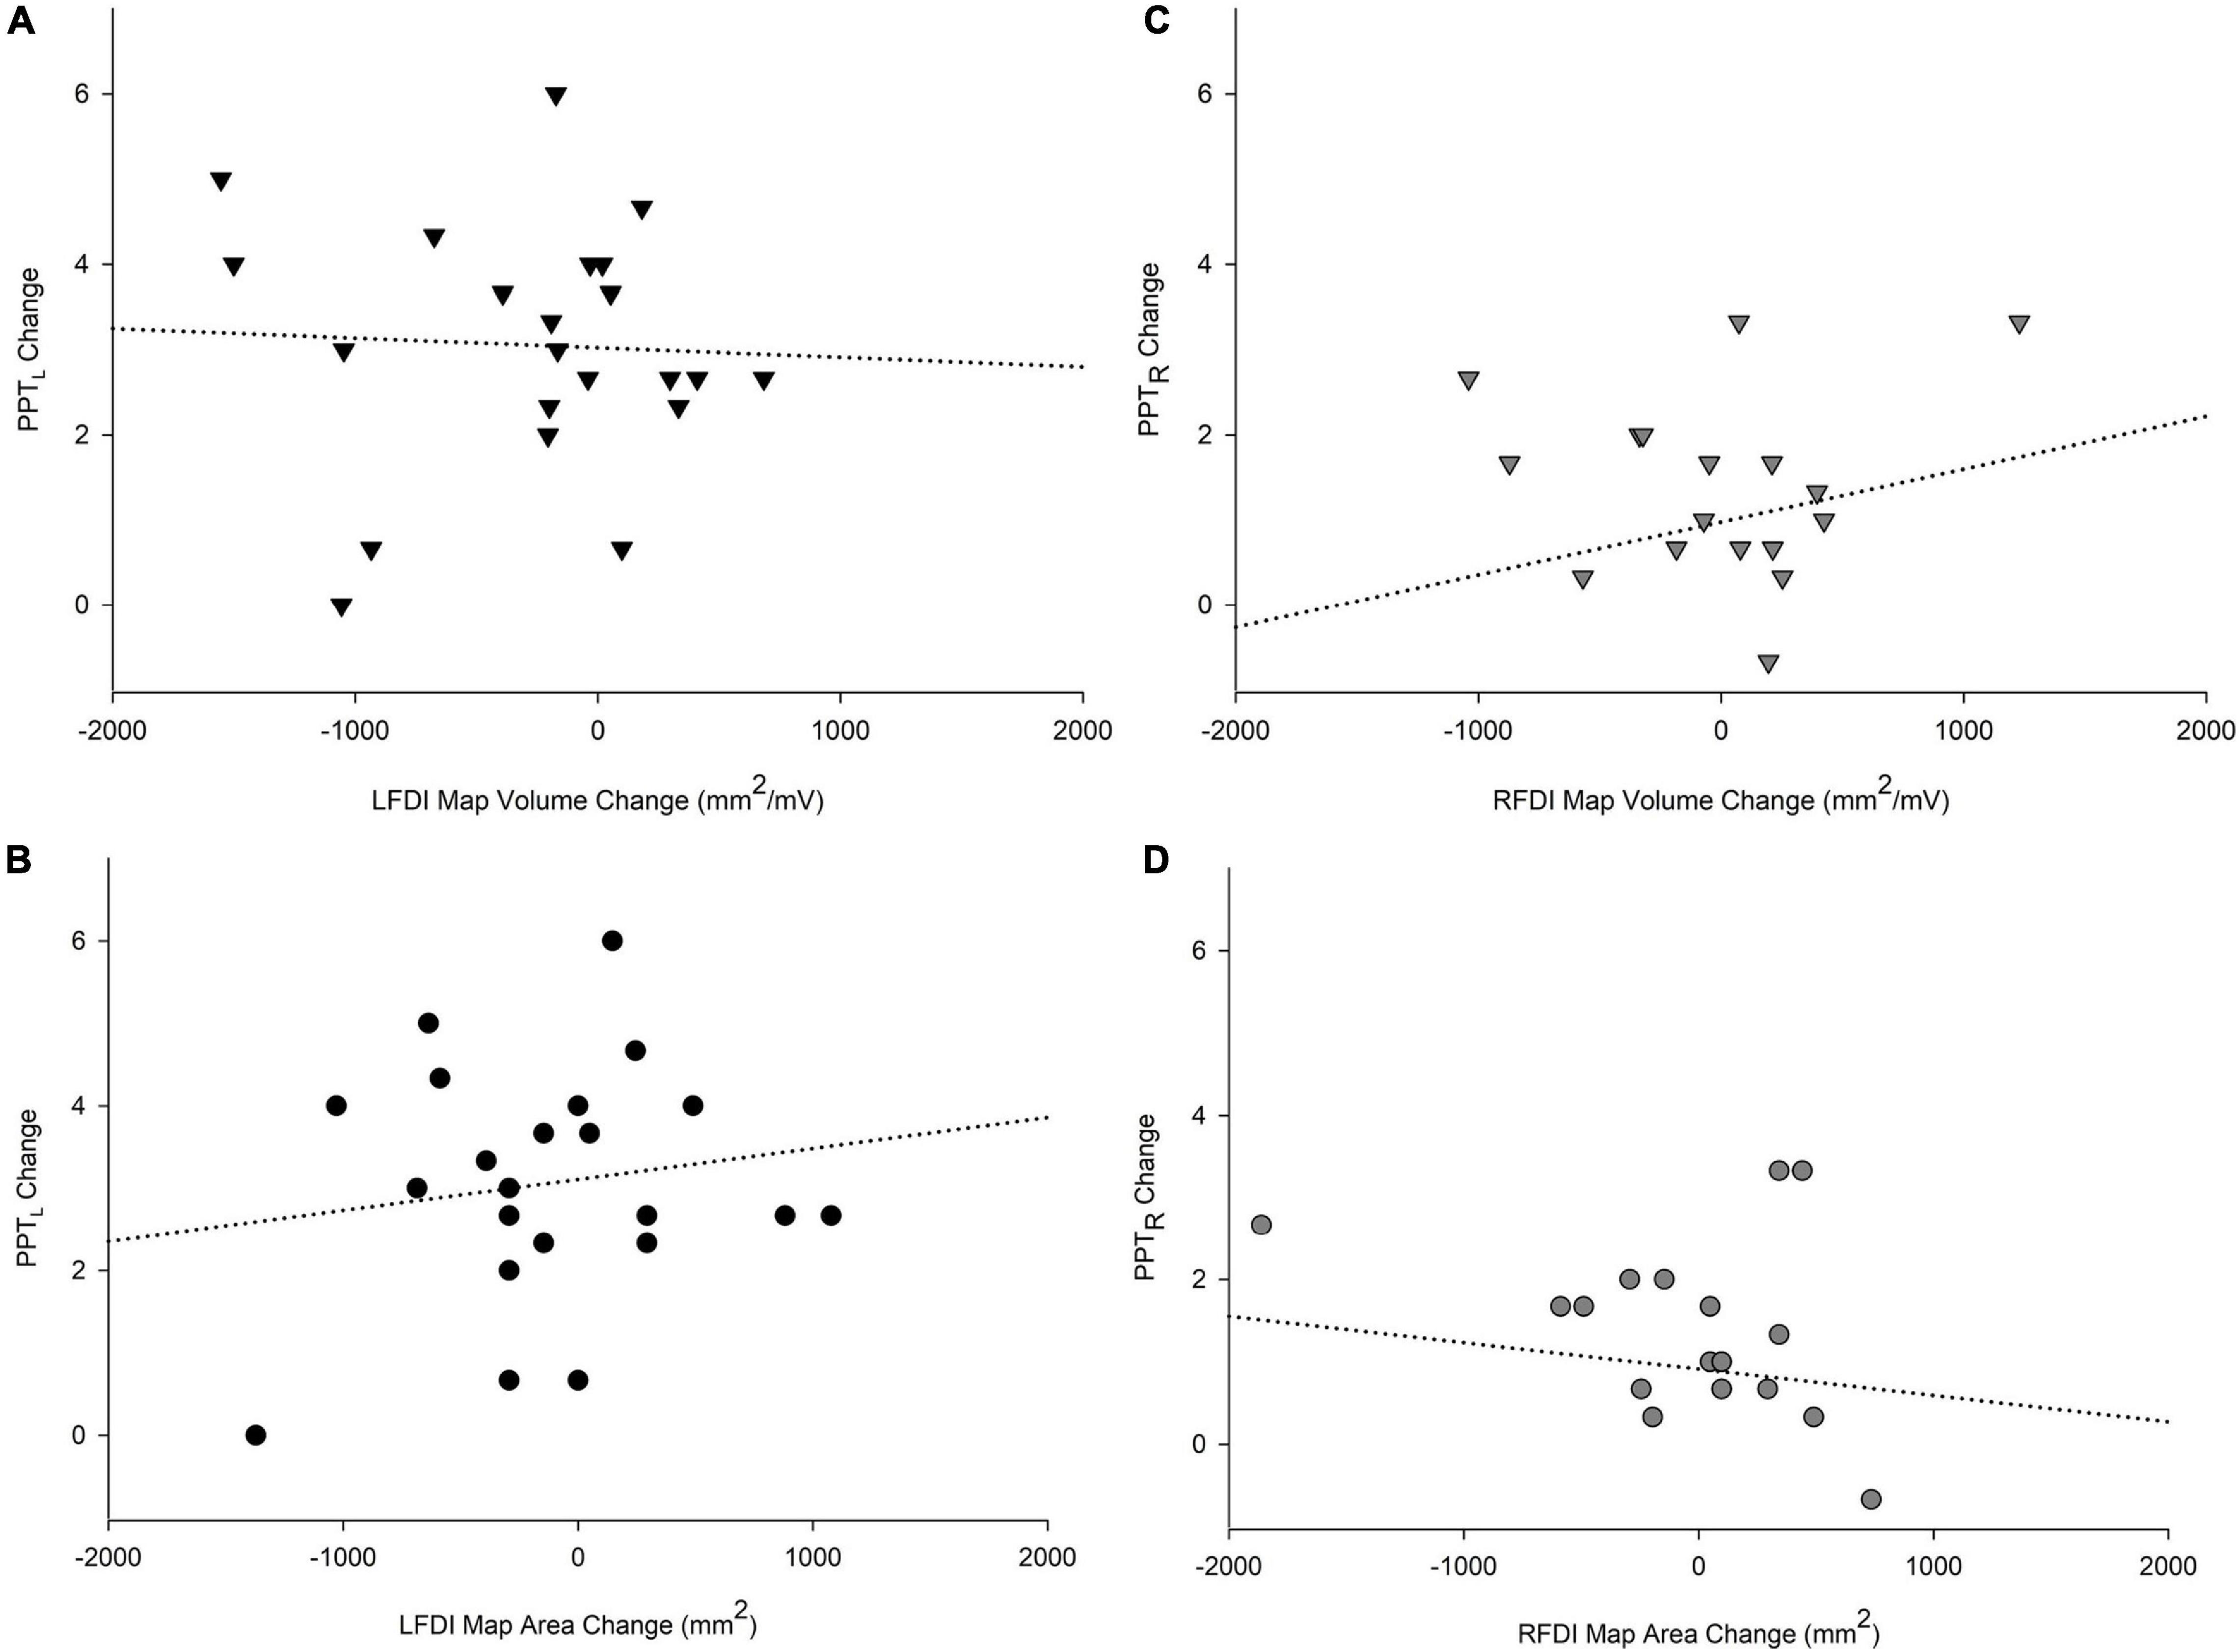
Figure 6. Relationships of PPT motor performance with map volume (mm2/mV) and area (mm2). Change in PPTL scores with LFDI map volume (A) and area (B). Change in PPTR scores with RFDI map volume (C) and area (D). Linear regression showed no significant relationship between change in FDI map volume and area with change in PPT scores between the pre and post in either hand. LFDI = left-hand first dorsal interosseous muscle; RFDI = right-hand first dorsal interosseous muscle; PPT = change in number of pegs from pre-to-post; PPTL = Left-hand; PPTR = Right-hand.
Safety and Tolerability
Robotic TMS motor mapping was well tolerated by all participants. In 65 motor mapping sessions, no serious adverse events occurred. All reported events were minor (graded as mild or moderate) and decreased over time. The most common adverse event, reported as total number of occurrences, were neck-pain (n = 18, 25%) and headache (n = 16, 22%) Other events included unpleasant tingling (n = 7, 10%), light headedness (n = 5, 7%), and nausea (n = 1, 1%). On average, participants ranked their TMS session 4th, between a “birthday party” and “long car ride”, compared to other daily activities. tDCS safety and tolerability was also favourable and is reported elsewhere (Cole et al., 2018).
Discussion
We investigated the effects of natural and modulated (tDCS and HD-tDCS) motor learning on robotic TMS motor maps. There were no significant effects of time or group on FDI motor map volume, area, or hotspot magnitude of the left-hand (trained) or right-hand (untrained), or within any of the secondary muscles. We did observe interactions between time and group on COG-x in muscles of the left-hand over time. Map metrics did not correlate with behavioural changes. Our results suggest robotic TMS motor mapping is a potentially valuable tool for studying plasticity in the developing motor system, but multiple factors must be considered, most notably the large variability in maps across individuals and time (Ngomo et al., 2012).
Primary motor cortex plays a pivotal role during skilled voluntary movements and learning of motor skills (Cohen et al., 1993; Rossi et al., 1999; Sanes and Donoghue, 2000; Muellbacher et al., 2001; Rioult-Pedotti and Donoghue, 2003). TMS has advanced our knowledge of such M1 plasticity, revealing changes in corticospinal excitability and cortical reorganization in response to upper-limb behavioural training (Pascual-Leone et al., 1995b, a; Classen et al., 1998; Butefisch et al., 2000; Ziemann et al., 2001; Gallasch et al., 2009). However, how motor mapping can further inform these mechanisms remains poorly understood. Robotic TMS may offer additional potential in the study of M1 neurophysiology and plasticity and may be particularly applicable in pediatric populations for its improved accuracy, movement-compensation, and increasingly well-established safety and tolerability profile (Zewdie et al., 2020). We recently demonstrated that robotic TMS can safely quantify M1 neurophysiology in healthy children (Grab et al., 2018) and investigated motor map outcomes and their associations with motor performance (Giuffre et al., 2021).
The present study is the first to demonstrate the application of such robotic TMS motor map outcomes to explore the underlying M1-plasticity effects of multiple days of modulated learning in healthy children (Cole et al., 2018). Our findings suggest COG may be a valuable neurophysiological motor mapping outcome. Following five consecutive days of intervention, the weighted cortical motor map of the trained LFDI appeared to shift differently between those participants receiving active tDCS compared to Sham. The significance of this finding is supported by our reliability study of robotic TMS motor mapping measures over both short- and long-term timeframes in young adults (Giuffre et al., 2020). Our reported standard error of COG-x (0.365) was below our previously reported standard error of measurement for COG-x (0.40). Such observations of COG-x being more reliable than other map outcomes is consistent with other reports (Wassermann et al., 1992; Mortifee et al., 1994; Jones–Lush et al., 2010; Ngomo et al., 2012; Littmann et al., 2013). COG may reflect changes in cortical physiology of upper-limb muscles following behavioural training or tDCS-modulated motor skill learning. Medial-lateral shifts in COG have been previously reported to shift medially with age in preadolescents (Säisänen et al., 2021) following one-hour of motor training (Liepert et al., 1999; Tegenthoff et al., 2004) and suggested to reflect shifts in motor cortex excitability (Wassermann, 2002) and reorganization following motor learning (Liepert et al., 2000). As M1 is distributed in a medial-lateral plane, shifts along COG-x potentially identify scalp coordinates corresponding to a larger number of the most excitable corticospinal neurons influencing recorded muscle activity (Röricht et al., 2001). Other reports suggest COG may be a more precise measure of anatomical reorganization assessable by TMS, although additional mapping outcomes such as map volume, area, and hotspot magnitude are more commonly investigated.
Accordingly, our primary map outcome measures were area, volume, and hotspot magnitude. We originally hypothesised that map volume and area would increase following learning and stimulation, based in part on evidence of increased cortical excitability (MEP amplitude) following anodal tDCS in healthy adults and children (Nitsche and Paulus, 2000; Nitsche et al., 2003; Ciechanski and Kirton, 2017; Cole et al., 2018) and enlarged motor map representations following motor performance alone in both animal (Nudo et al., 1996) and human models (Pascual-Leone et al., 1995a). Since map volume quantifies MEP amplitude at responsive grid-points, taking map area into account, we predicted the effects of tDCS stimulation might unveil different patterns of change within these M1 representations of hand muscles. Both measures have the potential to be complementary metrics capable of quantifying M1-plasticity effects such as strengthened synaptic connections and unmasking of latent horizontal connections (Huntley, 1997; Sanes and Donoghue, 2000). Contrary to our hypothesis, however, map volume, area, and cortical excitability showed no significant effect of time or group. Since executing the current study, we have learned that inter-session reliability of these outcomes is moderate with large minimal detectable differences estimated at more than 40–50% (Giuffre et al., 2020). Accordingly, with our modest sample divided into three treatment groups, we were likely underpowered to show significant changes in these standard map metrics. Additional reasons behind the absence of findings may stem from diverse individual variability in tDCS-induced changes in excitability, individual differences in motor skill learning, or differences in tDCS current density among participants (Ciechanski et al., 2018).
Increased map volume and area have been associated with repeated motor task learning (Pearce et al., 2000) and acquiring motor skills (Pascual-Leone et al., 1995b; Reis and Fritsch, 2011). In healthy subjects, MEP amplitude and cortical representations of fingers (map size) increased following repetitive practice of a piano sequence (Pascual-Leone et al., 1995a), while showing no change following repeated PPT performance (Garry et al., 2004) or during non-specific motor training (Ngomo et al., 2012). It is postulated that while behaviour improves, cortical output maps to the muscles involved become progressively larger until explicit knowledge is achieved, after which they may reduce in size (Pascual-Leone et al., 1994). For instance, while many TMS studies reported behavioural training increases cortical excitability (MEP amplitude), suggesting a correlation with functional outcome (Pascual-Leone et al., 1995a; Muellbacher et al., 2001; Ziemann et al., 2001; Garry et al., 2004), others have reported no change (Carroll et al., 2002; Ngomo et al., 2012). Inconsistent findings are also found in motor map outcomes, such as volume and area, following behavioural training though these have been studied almost exclusively in adults (Brasil-Neto et al., 1992; Wilson et al., 1993; Mortifee et al., 1994; Thickbroom et al., 1998; Malcolm et al., 2006). These may represent potential reasons for our results showing no definitive changes in motor map volume and area following motor training. That stimulation with tDCS or HD-tDCS might also alter the natural direction of effects of motor learning on motor maps must also be considered.
More expansive representations of a trained sequence of movements in M1 have been associated with performance, suggesting specific representations of movement sequences may be implemented at the cortical level as a new functional unit and distributions of cortical sites may be functionally linked during coordinated movements (Tyč and Boyadjian, 2011). As we demonstrated in the behavioural arm of the interventional trial on which the current study is based, days 4 and 5 showed the most significant increases of tDCS-induced effects on motor performance (Cole et al., 2018). We observed similar results in an earlier trial of tDCS-enhanced motor learning in children (Ciechanski and Kirton, 2017). The effect of time (day of training) appears to be dynamic and possibly altered by stimulation, adding yet another source of variance between individuals to our measurements which were limited to 3 timepoints. Acquiring TMS mapping measures on each day of such interventional trials could shed light on such shorter-term, day-to-day changes in cortical representations (map volume or area) during the course of stimulation-induced motor learning but may be limited by resource utilization and participant compliance.
To date, there is no gold standard for TMS motor mapping that provides the highest accuracy of measurements. Mäki and Ilmoniemi (2010) showed variability of MEP amplitudes at the same cortical grid-point, one-third of the largest responses were on average 10 times higher than one-third of the lowest responses (Mäki and Ilmoniemi, 2010). Estimating the size of motor representations based on MEP amplitudes obtained within a finite number of stimulation points is challenging (Julkunen, 2014) and depends on the accuracy of stimulation, density of stimulus locations, and MEP variability at the borders of the maps (Brasil-Neto et al., 1992; Classen et al., 1998; Chernyavskiy et al., 2019). Other groups have used a greater number of stimuli (6–10 pulses) per grid-point to accommodate (Cirillo et al., 2010; Ngomo et al., 2012) and reduce variability (Bastani and Jaberzadeh, 2012; van de Ruit et al., 2015), however, the feasibility of this approach in the developing brain is questionable. Additional recent investigations using neuronavigated single biphasic TMS pulses suggest increased efficacy to induce motor responses (Pitkänen et al., 2018), which may accommodate motor mapping challenges in young children, such as high motor thresholds (Julkunen, 2014; van de Ruit et al., 2015), though investigations in pediatric populations are lacking. Robotic neuronavigated TMS may be a useful tool to overcome these and other challenges in children. In addition to reducing human error of accurate coil placement, neuronavigated robotic TMS reduces acquisition time, provides consistent coil positioning, and near real-time motion correction, accommodating subject movement (Ginhoux et al., 2013). Robotic motor mapping appears safe, feasible in children (Grab et al., 2018; Giuffre et al., 2021), and is well-supported by growing evidence of TMS safety in children (Zewdie et al., 2020).
An ability to measure motor map plasticity has translational implications for children with early brain injury and cerebral palsy, the leading cause of lifelong neurological disability. The sensorimotor network is one of the earliest developing networks, well-established very early in life but highly refined throughout of development where motor maps may undergo dramatic developmental plasticity (Khazipov and Milh, 2018). How these natural processes are altered after early unilateral injury such as perinatal stroke are increasingly understood from preclinical models (Martin et al., 2007; Wen et al., 2018) and human imaging and brain mapping studies (Kirton et al., 2021). A recent mouse model of perinatal stroke evaluated motor map size and movement latency following cortical stimulation and motor training (Zhang et al., 2021). In line with our findings, motor map area (size) showed no overall expansion following 10 min a day over three-weeks of pellet training. Interestingly, mice with smaller map areas at baseline showed the greatest improvement in skilled forelimb training. TMS motor maps appear to be altered in children with unilateral cerebral palsy (CP) undergoing therapeutic interventions. For example, Friel et al. (2016) has shown increased motor map area (size) and MEP amplitudes of the affected hand in children with unilateral spastic CP following 3-weeks (6 h/day, 5 days/week) of bimanual therapy (Friel et al., 2016). Additional investigations by their group have shown medial-lateral shifts in FDI COG, in addition to investigating size and excitability of cortical motor maps, may lead toward further defining the relationship between changes in motor maps and motor function in children with CP (Kesar et al., 2012; Marneweck et al., 2018). Such models are informing large-scale randomised neuromodulation clinical trials (Kirton et al., 2016, 2017) where the addition of robotic TMS mapping with comprehensive outcomes such as COG before and after modulation may shed further light on mechanisms of interventional plasticity.
In addition to the above limitations, additional challenges are acknowledged. Our study could not control for other factors that may influence map size, such as the influence of hand use throughout the intervention (Ngomo et al., 2012). For instance, musicians and racket ballplayers (Pearce et al., 2000) who utilise their hand muscles more than the average person display different neurophysiology and organization of cortical motor networks. Our study was based on a secondary aim of the primary interventional tDCS trial, powered to determine the behavioural effects of tDCS on motor learning in children. Combined with new knowledge of TMS mapping reliability (Giuffre et al., 2020), it is clear that we had very modest power to detect true changes in map parameters. This emphasises the need for careful power calculations in future motor mapping studies. Additional limitations are due to the potential differences in electric field strength and distribution in our pediatric sample. Advances in computer finite element modeling (FEM) and realistic 3D head models have enabled tDCS-induced current to be predicted and modeled through the cortex (Miranda et al., 2006; Wagner et al., 2006; Bikson et al., 2012). The development of high-resolution derived head models allows for more accurate and precise modeling of current, though special considerations are required when applying tDCS in children. An early current modeling case study suggested tDCS-induced electric fields may be stronger in children (Kessler et al., 2013). Supplementing these findings in the largest pediatric sample to date, our group recently demonstrated children incur increased current densities and distributions compared to adolescents and adults (Ciechanski et al., 2018). These differences may be attributed to age-related differences in developmental changes within grey and white matter and skull thickness. As children have thinner skulls, stronger electric fields may be induced, resulting in more expansive current in underlying tissue (Opitz et al., 2015; Ciechanski et al., 2018). Recently, HD-tDCS was proposed to offer more focal current delivery and optimised targeting (Datta et al., 2009), however, investigations of modeling HD-tDCS current distributions in pediatrics are lacking. In a preliminary investigation, we studied potential differences in electric field modeling of conventional tDCS and HD-tDCS in the pediatric sample described in this study. We observed lower peak electric fields in HD-tDCS compared to tDCS and found no significant associations between electric fields and motor performance of the two stimulation groups (Giuffre et al., 2019a). As a larger sample of participants is needed to determine differences in electric field distribution of tDCS and HD-tDCS, we cannot account for possible differential effects of tDCS on motor maps. Additional investigations of current modeling various tDCS montages, especially in pediatric and clinical populations, are needed to optimise tDCS enhancement of motor function and advance therapies for clinical populations.
Patterns of motor map volume and area within participants revealed large variability that likely limited our ability to detect differences. Variability can be attributed to both subject factors (age, genetics, and sleep) (Antal et al., 2010; Li Voti et al., 2011; Ngomo et al., 2012), as well as measurement error. Variable subthreshold activation of corticospinal outputs at rest, background EMG activity, and focality of TMS-induced electric currents are all considered and can only partially be controlled. These factors may have contributed to our findings in secondary hand muscles. As different muscle representations display unique pyramidal and interneuronal orientations, the TMS coil may differentially active unique muscle representations. Although many horizontally oriented neuronal elements are perpendicular to the central sulcus, the depth from the scalp at which these elements initiate MEP response to TMS are difficult to evaluate and likely differs in children. An additional limitation may relate to our use of the LFDI RMT to determine the mapping threshold across all muscles. Although this may provide relative cortical representations of additional hand muscles and is highly practical, it cannot account for differences in thresholds, orientation, and other specific factors unique to each muscle representation that might only be determined with each mapped individually.
Conclusion
In summary, robotic TMS motor mapping is feasible and well-tolerated in children. The maps generated can estimate neurophysiological measures relevant to M1 physiology and plasticity. Large effects on traditional mapping outcomes such as area and volume were not observed but shifts in COG may represent an informative measure. Fully powered TMS motor mapping investigations are needed in the developing brain to determine utility in understanding mechanisms of motor developmental and interventional plasticity.
Data Availability Statement
The original contributions presented in the study are included in the article/Supplementary Material, further inquiries can be directed to the corresponding author.
Ethics Statement
The studies involving human participants were reviewed and approved by University of Calgary Research Ethics Board (REB16-2474). Written informed consent and assent when applicable to participate in this study was provided by the participants’ legal guardian/next of kin.
Author Contributions
AG: conceptualization, methodology, formal analysis, ethics, recruiting, investigation, data collection, supervision, and writing—original draft. EZ, JW, and LC: conceptualization, methodology, formal analysis, ethics, recruiting, investigation, data collection, and writing—manuscript and editing. HC: conceptualization, methodology, formal analysis, investigation, data collection, and writing—manuscript and editing. H-CK: conceptualization, methodology, formal analysis, recruiting, investigation, data collection, and writing—manuscript and editing. AB: formal analysis, investigation, and writing—manuscript and editing. AK: conceptualization, methodology, ethics, investigation, writing—original draft, and supervision. All authors contributed to the article and approved the submitted version.
Funding
This work was supported by a project grant from the Canadian Institutes of Health Research obtained by AK (FDN-143294) and the Canadian Institutes of Health Research Graduate Doctoral Vanier Scholarship.
Conflict of Interest
The authors declare that the research was conducted in the absence of any commercial or financial relationships that could be construed as a potential conflict of interest.
Publisher’s Note
All claims expressed in this article are solely those of the authors and do not necessarily represent those of their affiliated organizations, or those of the publisher, the editors and the reviewers. Any product that may be evaluated in this article, or claim that may be made by its manufacturer, is not guaranteed or endorsed by the publisher.
Supplementary Material
The Supplementary Material for this article can be found online at: https://www.frontiersin.org/articles/10.3389/fnhum.2021.747840/full#supplementary-material
Footnote
References
Alam, M., Truong, D. Q., Khadka, N., and Bikson, M. (2016). Spatial and polarity precision of concentric high-definition transcranial direct current stimulation (HD-tDCS). Phys. Med. Biol. 61, 4506–4521. doi: 10.1088/0031-9155/61/12/4506
Antal, A., Chaieb, L., Moliadze, V., Monte-Silva, K., Poreisz, C., Thirugnanasambandam, N., et al. (2010). Brain-derived neurotrophic factor (BDNF) gene polymorphisms shape cortical plasticity in humans. Brain Stimul. 3, 230–237. doi: 10.1016/j.brs.2009.12.003
Bastani, A., and Jaberzadeh, S. (2012). A higher number of TMS-elicited MEP from a combined hotspot improves intra- and inter-session reliability of the upper limb muscles in healthy individuals. PLoS One 7:e47582. doi: 10.1371/journal.pone.0047582
Bikson, M., Grossman, P., Thomas, C., Zannou, A. L., Jiang, J., Adnan, T., et al. (2016). Safety of transcranial direct current stimulation: evidence based update 2016. Brain Stimul. 9, 641–661. doi: 10.1016/j.brs.2016.06.004
Bikson, M., Rahman, A., and Datta, A. (2012). Computational models of transcranial direct current stimulation. Clin. EEG Neurosci. 43, 176–183. doi: 10.1177/1550059412445138
Boggio, P. S., Castro, L. O., Savagim, E. A., Braite, R., Cruz, V. C., Rocha, R. R., et al. (2006). Enhancement of non-dominant hand motor function by anodal transcranial direct current stimulation. Neurosci. Lett. 404, 232–236. doi: 10.1016/j.neulet.2006.05.051
Brasil-Neto, J. P., McShane, L. M., Fuhr, P., Hallett, M., and Cohen, L. G. (1992). Topographic mapping of the human motor cortex with magnetic stimulation: factors affecting accuracy and reproducibility. Electroencephalogr. Clin. Neurophysiol. 85, 9–16. doi: 10.1016/0168-5597(92)90095-s
Butefisch, C. M., Davis, B. C., Wise, S. P., Sawaki, L., Kopylev, L., Classen, J., et al. (2000). Mechanisms of use-dependent plasticity in the human motor cortex. Proc. Natl. Acad. Sci. U.S.A. 97, 3661–3665. doi: 10.1073/pnas.050350297
Carroll, T. J., Riek, S., and Carson, R. G. (2002). The sites of neural adaptation induced by resistance training in humans. J. Physiol. 544, 641–652. doi: 10.1113/jphysiol.2002.024463
Chernyavskiy, A. Y., Sinitsyn, D. O., Poydasheva, A. G., Bakulin, I. S., Suponeva, N. A., and Piradov, M. A. (2019). Accuracy of estimating the area of cortical muscle representations from TMS mapping data using voronoi diagrams. Brain Topogr. 32, 859–872. doi: 10.1007/s10548-019-00714-y
Ciechanski, P., and Kirton, A. (2017). Transcranial direct-current stimulation can enhance motor learning in children. Cereb. Cortex 27, 2758–2767. doi: 10.1093/cercor/bhw114
Ciechanski, P., Carlson, H. L., Yu, S. S., and Kirton, A. (2018). Modeling transcranial direct-current stimulation-induced electric fields in children and adults. Front. Hum. Neurosci. 12:268. doi: 10.3389/fnhum.2018.00268
Cirillo, J., Rogasch, N., and Semmler, J. (2010). Hemispheric differences in use-dependent corticomotor plasticity in young and old adults. Exp. Brain Res. 205, 57–68. doi: 10.1007/s00221-010-2332-1
Classen, J., Liepert, J., Wise, S. P., Hallett, M., and Cohen, L. G. (1998). Rapid plasticity of human cortical movement representation induced by practice. J. Neurophysiol. 79, 1117–1123. doi: 10.1152/jn.1998.79.2.1117
Cohen, L. G., and Hallett, M. (1988). Noninvasive mapping of human motor cortex. Neurology 38, 904–904. doi: 10.1212/WNL.38.6.904
Cohen, L. G., Brasil-Neto, J. P., Pascual-Leone, A., and Hallett, M. (1993). Plasticity of cortical motor output organization following deafferentation, cerebral lesions, and skill acquisition. Adv. Neurol. 63, 187–200.
Cole, L., Giuffre, A., Ciechanski, P., Carlson, H. L., Zewdie, E., Kuo, H.-C., et al. (2018). Effects of high-definition and conventional transcranial direct-current stimulation on motor learning in children. Front. Neurosci. 12:787. doi: 10.3389/fnins.2018.00787
Datta, A., Bansal, V., Diaz, J., Patel, J., Reato, D., and Bikson, M. (2009). Gyri-precise head model of transcranial direct current stimulation: improved spatial focality using a ring electrode versus conventional rectangular pad. Brain Stimul. 2, 201–207.e1. doi: 10.1016/j.brs.2009.03.005
Dmochowski, J. P., Datta, A., Bikson, M., Su, Y., and Parra, L. C. (2011). Optimized multi-electrode stimulation increases focality and intensity at target. J. Neural Eng. 8:046011. doi: 10.1088/1741-2560/8/4/046011
Donoghue, J. P., Leibovic, S., and Sanes, J. N. (1992). Organization of the forelimb area in squirrel monkey motor cortex: representation of digit, wrist, and elbow muscles. Exp. Brain Res. 89, 1–19. doi: 10.1007/BF00228996
Doppelmayr, M., Pixa, N. H., and Steinberg, F. (2016). Cerebellar, but not motor or parietal, high-density anodal transcranial direct current stimulation facilitates motor adaptation. J. Int. Neuropsychol. Soc. 22, 928–936. doi: 10.1017/S1355617716000345
Friel, K. M., Kuo, H.-C., Fuller, J., Ferre, C. L., Brandão, M., Carmel, J. B., et al. (2016). Skilled bimanual training drives motor cortex plasticity in children with unilateral cerebral palsy. Neurorehabil. Neural Repair 30, 834–844. doi: 10.1177/1545968315625838
Friel, K. M., Lee, P., Soles, L. V., Smorenburg, A. R. P., Kuo, H.-C., and Edwards, D. J. (2017). Combined transcranial direct current stimulation and robotic upper limb therapy improves upper limb function in an adult with cerebral palsy. NeuroRehabilitation 41, 41–50. doi: 10.3233/NRE-171455
Gallasch, E., Christova, M., Krenn, M., Kossev, A., and Rafolt, D. (2009). Changes in motor cortex excitability following training of a novel goal-directed motor task. Eur. J. Appl. Physiol. 105, 47–54. doi: 10.1007/s00421-008-0871-y
Gardner, R. A., and Broman, M. (1979). The Purdue pegboard: normative data on 1334 school children. J. Clin. Child Psychol. 8, 156–162. doi: 10.1080/15374417909532912
Garry, M. I., Kamen, G., and Nordstrom, M. A. (2004). Hemispheric differences in the relationship between corticomotor excitability changes following a fine-motor task and motor learning. J. Neurophysiol. 91, 1570–1578. doi: 10.1152/jn.00595.2003
Garvey, M. A., and Gilbert, D. L. (2004). Transcranial magnetic stimulation in children. Eur. J. Paediatr. Neurol. 8, 7–19.
Garvey, M. A., Ziemann, U., Bartko, J. J., Denckla, M. B., Barker, C. A., and Wassermann, E. M. (2003). Cortical correlates of neuromotor development in healthy children. Clin. Neurophysiol. 114, 1662–1670.
Ginhoux, R., Renaud, P., Zorn, L., Goffin, L., Bayle, B., Foucher, J., et al. (2013). A custom robot for transcranial magnetic stimulation: first assessment on healthy subjects. Conf. Proc. IEEE Eng. Med. Biol. Soc. 2013, 5352–5355. doi: 10.1109/EMBC.2013.6610758
Giuffre, A., Cole, L., Kuo, H.-C., Carlson, H. L., Grab, J., Kirton, A., et al. (2019b). Non-invasive modulation and robotic mapping of motor cortex in the developing brain. J. Vis. Exp. 149:e59594. doi: 10.3791/59594
Giuffre, A., Carlson, H. L., and Kirton, A. (2019a). Abstract #25: current modeling high definition and conventional tDCS-enhanced motor learning in children. Brain Stimul. 12:e9. doi: 10.1016/j.brs.2018.12.032
Giuffre, A., Kahl, C. K., Zewdie, E., Wrightson, J. G., Bourgeois, A., Condliffe, E. G., et al. (2020). Reliability of robotic transcranial magnetic stimulation motor mapping. J. Neurophysiol. 125, 74–85. doi: 10.1152/jn.00527.2020
Giuffre, A., Zewdie, E., Carlson, H. L., Wrightson, J. G., Kuo, H., Cole, L., et al. (2021). Robotic transcranial magnetic stimulation motor maps and hand function in adolescents. Physiol. Rep. 9:e14801. doi: 10.14814/phy2.14801
Goetz, S., Kozyrkov, I. C., Luber, B., Lisanby, S. H., Murphy, D. L., Grill, W. M., et al. (2019). Accuracy of robotic coil positioning during transcranial magnetic stimulation. J. Neural Eng. 16:054003. doi: 10.1088/1741-2552/ab2953
Grab, J. G., Zewdie, E., Carlson, H. L., Kuo, H.-C., Ciechanski, P., Hodge, J., et al. (2018). Robotic TMS mapping of motor cortex in the developing brain. J. Neurosci. Methods 309, 41–54. doi: 10.1016/j.jneumeth.2018.08.007
Huntley, G. W. (1997). Correlation between patterns of horizontal connectivity and the extend of short-term representational plasticity in rat motor cortex. Cereb. Cortex 7, 143–156. doi: 10.1093/cercor/7.2.143
Jones–Lush, L. M., Judkins, T. N., and Wittenberg, G. F. (2010). Arm movement maps evoked by cortical magnetic stimulation in a robotic environment. Neuroscience 165, 774–781. doi: 10.1016/j.neuroscience.2009.10.065
Julkunen, P. (2014). Methods for estimating cortical motor representation size and location in navigated transcranial magnetic stimulation. J. Neurosci. Methods 232, 125–133. doi: 10.1016/j.jneumeth.2014.05.020
Kang, N., Summers, J. J., and Cauraugh, J. H. (2016). Transcranial direct current stimulation facilitates motor learning post-stroke: a systematic review and meta-analysis. J. Neurol. Neurosurg. Psychiatr. 87, 345–355. doi: 10.1136/jnnp-2015-311242
Keel, J. C., Smith, M. J., and Wassermann, E. M. (2001). A safety screening questionnaire for transcranial magnetic stimulation. Clin. Neurophysiol. 112:720.
Kesar, T. M., Sawaki, L., Burdette, J. H., Cabrera, N., Kolaski, K., Smith, B. P., et al. (2012). Motor cortical functional geometry in cerebral palsy and its relationship to disability. Clin. Neurophysiol. 123, 1383–1390. doi: 10.1016/j.clinph.2011.11.005
Kessler, S. K., Minhas, P., Woods, A. J., Rosen, A., Gorman, C., and Bikson, M. (2013). Dosage considerations for transcranial direct current stimulation in children: a computational modeling study. PLoS One 8:e76112. doi: 10.1371/journal.pone.0076112
Khazipov, R., and Milh, M. (2018). Early patterns of activity in the developing cortex: focus on the sensorimotor system. Semin. Cell Dev. Biol. 76, 120–129. doi: 10.1016/j.semcdb.2017.09.014
Kidgell, D. J., Goodwill, A. M., Frazer, A. K., and Daly, R. M. (2013). Induction of cortical plasticity and improved motor performance following unilateral and bilateral transcranial direct current stimulation of the primary motor cortex. BMC Neurosci. 14:64. doi: 10.1186/1471-2202-14-64
Kirton, A., Andersen, J., Herrero, M., Nettel-Aguirre, A., Carsolio, L., Damji, O., et al. (2016). Brain stimulation and constraint for perinatal stroke hemiparesis: the plastic champs trial. Neurology 86, 1659–1667. doi: 10.1212/WNL.0000000000002646
Kirton, A., Ciechanski, P., Zewdie, E., Andersen, J., Nettel-Aguirre, A., Carlson, H., et al. (2017). Transcranial direct current stimulation for children with perinatal stroke and hemiparesis. Neurology 88, 259–267. doi: 10.1212/WNL.0000000000003518
Kirton, A., Metzler, M. J., Craig, B. T., Hilderley, A., Dunbar, M., Giuffre, A., et al. (2021). Perinatal stroke: mapping and modulating developmental plasticity. Nat. Rev. Neurol. 17, 415–432. doi: 10.1038/s41582-021-00503-x
Kuo, H.-I., Bikson, M., Datta, A., Minhas, P., Paulus, W., Kuo, M.-F., et al. (2013). Comparing cortical plasticity induced by conventional and high-definition 4 × 1 ring tDCS: a neurophysiological study. Brain Stimul. 6, 644–648. doi: 10.1016/j.brs.2012.09.010
Lefaucheur, J.-P. (2016). A comprehensive database of published tDCS clinical trials (2005–2016). Neurophysiol. Clin. 46, 319–398. doi: 10.1016/j.neucli.2016.10.002
Lefaucheur, J.-P., and Picht, T. (2016). The value of preoperative functional cortical mapping using navigated TMS. Neurophysiol. Clin. 46, 125–133. doi: 10.1016/j.neucli.2016.05.001
Li Voti, P., Conte, A., Suppa, A., Iezzi, E., Bologna, M., Aniello, M. S., et al. (2011). Correlation between cortical plasticity, motor learning and BDNF genotype in healthy subjects. Exp. Brain Res. 212, 91–99. doi: 10.1007/s00221-011-2700-5
Liepert, J., Graef, S., Uhde, I., Leidner, O., and Weiller, C. (2000). Training-induced changes of motor cortex representations in stroke patients. Acta Neurol. Scand. 101, 321–326.
Liepert, J., Terborg, C., and Weiller, C. (1999). Motor plasticity induced by synchronized thumb and foot movements. Exp. Brain Res. 125, 435–439. doi: 10.1007/s002210050700
Littmann, A. E., McHenry, C. L., and Shields, R. K. (2013). Variability of motor cortical excitability using a novel mapping procedure. J. Neurosci. Methods 214, 137–143. doi: 10.1016/j.jneumeth.2013.01.013
Maegaki, Y., Maeoka, Y., Ishii, S., Eda, I., Ohtagaki, A., Kitahara, T., et al. (1999). Central motor reorganization in cerebral palsy patients with bilateral cerebral lesions. Pediatr. Res. 45, 559–567. doi: 10.1203/00006450-199904010-00016
Mäki, H., and Ilmoniemi, R. J. (2010). EEG oscillations and magnetically evoked motor potentials reflect motor system excitability in overlapping neuronal populations. Clin. Neurophysiol. 121, 492–501. doi: 10.1016/j.clinph.2009.11.078
Malcolm, M., Triggs, W., Light, K., Shechtman, O., Khandekar, G., and Gonzalezrothi, L. (2006). Reliability of motor cortex transcranial magnetic stimulation in four muscle representations. Clin. Neurophysiol. 117, 1037–1046. doi: 10.1016/j.clinph.2006.02.005
Marneweck, M., Kuo, H.-C., Smorenburg, A. R. P., Ferre, C. L., Flamand, V. H., Gupta, D., et al. (2018). The relationship between hand function and overlapping motor representations of the hands in the contralesional hemisphere in unilateral spastic cerebral palsy. Neurorehabil. Neural Repair 32, 62–72. doi: 10.1177/1545968317745991
Martin, J. H., Friel, K. M., Salimi, I., and Chakrabarty, S. (2007). Activity- and use-dependent plasticity of the developing corticospinal system. Neurosci. Biobehav. Rev. 31, 1125–1135. doi: 10.1016/j.neubiorev.2007.04.017
Matsuo, A., Maeoka, H., Hiyamizu, M., Shomoto, K., Morioka, S., and Seki, K. (2011). Enhancement of precise hand movement by transcranial direct current stimulation. Neuroreport 22, 78–82. doi: 10.1097/WNR.0b013e32834298b3
Miranda, P. C., Lomarev, M., and Hallett, M. (2006). Modeling the current distribution during transcranial direct current stimulation. Clin. Neurophysiol. 117, 1623–1629. doi: 10.1016/j.clinph.2006.04.009
Moliadze, V., Schmanke, T., Andreas, S., Lyzhko, E., Freitag, C. M., and Siniatchkin, M. (2015). Stimulation intensities of transcranial direct current stimulation have to be adjusted in children and adolescents. Clin. Neurophysiol. 126, 1392–1399. doi: 10.1016/j.clinph.2014.10.142
Mortifee, P., Stewart, H., Schulzer, M., and Eisen, A. (1994). Reliability of transcranial magnetic stimulation for mapping the human motor cortex. Electroencephalogr. Clin. Neurophysiol. 93, 131–137. doi: 10.1016/0168-5597(94)90076-0
Muellbacher, W., Ziemann, U., Boroojerdi, B., Cohen, L., and Hallett, M. (2001). Role of the human motor cortex in rapid motor learning. Exp. Brain Res. 136, 431–438. doi: 10.1007/s002210000614
Ngomo, S., Leonard, G., and Mercier, C. (2012). Influence of the amount of use on hand motor cortex representation: effects of immobilization and motor training. Neuroscience 220, 208–214. doi: 10.1016/j.neuroscience.2012.06.018
Nitsche, M. A., and Paulus, W. (2000). Excitability changes induced in the human motor cortex by weak transcranial direct current stimulation. J. Physiol. 527(Pt 3), 633–639.
Nitsche, M. A., and Paulus, W. (2001). Sustained excitability elevations induced by transcranial DC motor cortex stimulation in humans. Neurology 57, 1899–1901.
Nitsche, M. A., Schauenburg, A., Lang, N., Liebetanz, D., Exner, C., Paulus, W., et al. (2003). Facilitation of implicit motor learning by weak transcranial direct current stimulation of the primary motor cortex in the human. J. Cogn. Neurosci. 15, 619–626. doi: 10.1162/089892903321662994
Nudo, R. J., Milliken, G. W., Jenkins, W. M., and Merzenich, M. M. (1996). Use-dependent alterations of movement representations in primary motor cortex of adult squirrel monkeys. J. Neurosci. 16, 785–807.
Oldfield, R. C. (1971). The assessment and analysis of handedness: the Edinburgh inventory. Neuropsychologia 9, 97–113.
Opitz, A., Paulus, W., Will, S., Antunes, A., and Thielscher, A. (2015). Determinants of the electric field during transcranial direct current stimulation. NeuroImage 109, 140–150. doi: 10.1016/j.neuroimage.2015.01.033
Pascual-Leone, A., Grafman, J., and Hallett, M. (1994). Modulation of cortical motor output maps during development of implicit and explicit knowledge. Science 263, 1287–1289. doi: 10.1126/science.8122113
Pascual-Leone, A., Wassermann, E. M., Sadato, N., and Hallett, M. (1995b). The role of reading activity on the modulation of motor cortical outputs to the reading hand in Braille readers. Ann. Neurol. 38, 910–915.
Pascual-Leone, A., Nguyet, D., Cohen, L. G., Brasil-Neto, J. P., Cammarota, A., and Hallett, M. (1995a). Modulation of muscle responses evoked by transcranial magnetic stimulation during the acquisition of new fine motor skills. J. Neurophysiol. 74, 1037–1045. doi: 10.1152/jn.1995.74.3.1037
Pearce, A. J., Thickbroom, G. W., Byrnes, M. L., and Mastaglia, F. L. (2000). Functional reorganisation of the corticomotor projection to the hand in skilled racquet players. Exp. Brain Res. 130, 238–243. doi: 10.1007/s002219900236
Picht, T., Schmidt, S., Brandt, S., Frey, D., Hannula, H., Neuvonen, T., et al. (2011). Preoperative functional mapping for rolandic brain tumor surgery: comparison of navigated transcranial magnetic stimulation to direct cortical stimulation. Neurosurgery 69, 581–588; discussion 588. doi: 10.1227/NEU.0b013e3182181b89
Pitkänen, M., Kallioniemi, E., Järnefelt, G., Karhu, J., and Julkunen, P. (2018). Efficient mapping of the motor cortex with navigated biphasic paired-pulse transcranial magnetic stimulation. Brain Topogr. 31, 963–971. doi: 10.1007/s10548-018-0660-9
Pixa, N. H., Steinberg, F., and Doppelmayr, M. (2017). Effects of high-definition anodal transcranial direct current stimulation applied simultaneously to both primary motor cortices on bimanual sensorimotor performance. Front. Behav. Neurosci. 11:130. doi: 10.3389/fnbeh.2017.00130
Rajapakse, T., and Kirton, A. (2013). Non-invasive brain stimulation in children: applications and future directions. Transl. Neurosci. 4, 217–233. doi: 10.2478/s13380-013-0116-3
Recanzone, G. H., Merzenich, M. M., Jenkins, W. M., Grajski, K. A., and Dinse, H. R. (1992). Topographic reorganization of the hand representation in cortical area 3b owl monkeys trained in a frequency-discrimination task. J. Neurophysiol. 67, 1031–1056. doi: 10.1152/jn.1992.67.5.1031
Reis, J., and Fritsch, B. (2011). Modulation of motor performance and motor learning by transcranial direct current stimulation. Curr. Opin. Neurol. 24, 590–596. doi: 10.1097/WCO.0b013e32834c3db0
Reis, J., Schambra, H. M., Cohen, L. G., Buch, E. R., Fritsch, B., Zarahn, E., et al. (2009). Noninvasive cortical stimulation enhances motor skill acquisition over multiple days through an effect on consolidation. Proc. Natl. Acad. Sci. U.S.A. 106, 1590–1595. doi: 10.1073/pnas.0805413106
Ridding, M. C., and Rothwell, J. C. (1997). Stimulus/response curves as a method of measuring motor cortical excitability in man. Electroencephalogr. Clin. Neurophysiol. 105, 340–344. doi: 10.1016/S0924-980X(97)00041-6
Ridding, M. C., and Rothwell, J. C. (2007). Is there a future for therapeutic use of transcranial magnetic stimulation? Nat. Rev. Neurosci. 8, 559–567. doi: 10.1038/nrn2169
Rioult-Pedotti, M. S., and Donoghue, J. P. (2003). “The nature and mechanisms of plasticity,” in Plasticity in the Human Nervous System, eds S. Boniface and U. Ziemann (New York: Cambridge University Press), 1–25.
Röricht, S., Machetanz, J., Irlbacher, K., Niehaus, L., Biemer, E., and Meyer, B.-U. (2001). Reorganization of human motor cortex after hand replantation. Ann. Neurol. 50, 240–249. doi: 10.1002/ana.1091
Rossi, F., Triggs, W. J., and Eisenschenk, S. (1999). Topographic differences in task-dependent facilitation of magnetic motor evoked potentials. Neurology 52, 537–537. doi: 10.1212/WNL.52.3.537
Säisänen, L., Könönen, M., Niskanen, E., Lakka, T., Lintu, N., Vanninen, R., et al. (2021). Primary hand motor representation areas in healthy children, preadolescents, adolescents, and adults. NeuroImage 228:117702. doi: 10.1016/j.neuroimage.2020.117702
Sanes, J. N., and Donoghue, J. P. (2000). Plasticity and primary motor cortex. Annu. Rev. Neurosci. 23, 393–415. doi: 10.1146/annurev.neuro.23.1.393
Sohn, M. K., Kim, B. O., and Song, H. T. (2012). Effect of stimulation polarity of transcranial direct current stimulation on non-dominant hand function. Ann. Rehabil. Med. 36, 1–7. doi: 10.5535/arm.2012.36.1.1
Sollmann, N., Krieg, S. M., Säisänen, L., and Julkunen, P. (2021). Mapping of motor function with neuronavigated transcranial magnetic stimulation: a review on clinical application in brain tumors and methods for ensuring feasible accuracy. Brain Sci. 11:897. doi: 10.3390/brainsci11070897
Tegenthoff, M., Cornelius, B., Pleger, B., Malin, J.-P., and Schwenkreis, P. (2004). Amphetamine enhances training-induced motor cortex plasticity. Acta Neurol. Scand. 109, 330–336. doi: 10.1046/j.1600-0404.2003.00235.x
Temesi, J., Gruet, M., Rupp, T., Verges, S., and Millet, G. Y. (2014). Resting and active motor thresholds versus stimulus–response curves to determine transcranial magnetic stimulation intensity in quadriceps femoris. J. NeuroEng. Rehabil. 11:40. doi: 10.1186/1743-0003-11-40
Thickbroom, G. W., Sammut, R., and Mastaglia, F. L. (1998). Magnetic stimulation mapping of motor cortex: factors contributing to map area. Electroencephalogr. Clin. Neurophysiol. 109, 79–84. doi: 10.1016/S0924-980X(98)00006-X
Tyč, F., and Boyadjian, A. (2011). Plasticity of motor cortex induced by coordination and training. Clin. Neurophysiol. 122, 153–162. doi: 10.1016/j.clinph.2010.05.022
van de Ruit, M., Perenboom, M. J. L., and Grey, M. J. (2015). TMS brain mapping in less than two minutes. Brain Stimul. 8, 231–239. doi: 10.1016/j.brs.2014.10.020
Villamar, M. F., Volz, M. S., Bikson, M., Datta, A., Dasilva, A. F., and Fregni, F. (2013). Technique and considerations in the use of 4x1 ring high-definition transcranial direct current stimulation (HD-tDCS). J. Vis. Exp. 77:e50309. doi: 10.3791/50309
Vines, B. W., Nair, D. G., and Schlaug, G. (2006). Contralateral and ipsilateral motor effects after transcranial direct current stimulation. Neuroreport 17, 671–674.
Wagner, T., Fregni, F., Eden, U., Ramos-Estebanez, C., Grodzinsky, A., Zahn, M., et al. (2006). Transcranial magnetic stimulation and stroke: a computer-based human model study. Neuroimage 30, 857–870.
Wassermann, E. M. (2002). Variation in the response to transcranial magnetic brain stimulation in the general population. Clin. Neurophysiol. 113, 1165–1171. doi: 10.1016/S1388-2457(02)00144-X
Wassermann, E. M., McShane, L. M., Hallett, M., and Cohen, L. G. (1992). Noninvasive mapping of muscle representations in human motor cortex. Electroencephalogr. Clin. Neurophysiol. 85, 1–8. doi: 10.1016/0168-5597(92)90094-R
Wen, T.-C., Lall, S., Pagnotta, C., Markward, J., Gupta, D., Ratnadurai-Giridharan, S., et al. (2018). Plasticity in one hemisphere, control from two: adaptation in descending motor pathways after unilateral corticospinal injury in neonatal rats. Front. Neural Circuits 12:28. doi: 10.3389/fncir.2018.00028
Wilson, S. A., Thickbroom, G. W., and Mastaglia, F. L. (1993). Transcranial magnetic stimulation mapping of the motor cortex in normal subjects: the representation of two intrinsic hand muscles. J. Neurol. Sci. 118, 134–144. doi: 10.1016/0022-510X(93)90102-5
Yousry, T. A., Schmid, U. D., Alkadhi, H., Schmidt, D., Peraud, A., Buettner, A., et al. (1997). Localization of the motor hand area to a knob on the precentral gyrus. A new landmark. Brain 120(Pt 1), 141–157. doi: 10.1093/brain/120.1.141
Zewdie, E., Ciechanski, P., Kuo, H. C., Giuffre, A., Kahl, C., King, R., et al. (2020). Safety and tolerability of transcranial magnetic and direct current stimulation in children: prospective single center evidence from 3.5 million stimulations. Brain Stimul. 13, 565–575. doi: 10.1016/j.brs.2019.12.025
Zhang, S. Y., Jeffers, M. S., Lagace, D. C., Kirton, A., and Silasi, G. (2021). Developmental and interventional plasticity of motor maps after perinatal stroke. J. Neurosci. 41, 6157–6172. doi: 10.1523/JNEUROSCI.3185-20.2021
Keywords: robotic TMS, motor mapping, tDCS and HD-tDCS, motor learning, pediatrics, neurophysiology, neuroplasticity
Citation: Giuffre A, Zewdie E, Wrightson JG, Cole L, Carlson HL, Kuo H-C, Babwani A and Kirton A (2021) Effects of Transcranial Direct Current Stimulation and High-Definition Transcranial Direct Current Stimulation Enhanced Motor Learning on Robotic Transcranial Magnetic Stimulation Motor Maps in Children. Front. Hum. Neurosci. 15:747840. doi: 10.3389/fnhum.2021.747840
Received: 26 July 2021; Accepted: 16 September 2021;
Published: 06 October 2021.
Edited by:
Hyochol Ahn, Florida State University, United StatesReviewed by:
Ricardo Nuno Braço Forte Salvador, Neuroelectrics (Spain), SpainLaura Säisänen, Kuopio University Hospital, Finland
Copyright © 2021 Giuffre, Zewdie, Wrightson, Cole, Carlson, Kuo, Babwani and Kirton. This is an open-access article distributed under the terms of the Creative Commons Attribution License (CC BY). The use, distribution or reproduction in other forums is permitted, provided the original author(s) and the copyright owner(s) are credited and that the original publication in this journal is cited, in accordance with accepted academic practice. No use, distribution or reproduction is permitted which does not comply with these terms.
*Correspondence: Adam Kirton, YWRhbS5raXJ0b25AYWhzLmNh