 Marina Weiler1
 Kevin C. Stieger1
 Kavisha Shroff2
 Jessie P. Klein2William H. Wood2Yongqing Zhang2
 Prabha Chandrasekaran3
 Elin Lehrmann2
 Simonetta Camandola4
 Jeffrey M. Long1
 Mark P. Mattson4
 Kevin G. Becker2*
 Peter R. Rapp1
- 1Laboratory of Behavioral Neuroscience, National Institute on Aging, National Institutes of Health, Baltimore, MD, United States
- 2Laboratory of Genetics and Genomics, National Institute on Aging, National Institutes of Health, Baltimore, MD, United States
- 3Laboratory of Clinical Investigation, National Institute on Aging, National Institutes of Health, Baltimore, MD, United States
- 4Laboratory of Neurosciences, National Institute on Aging, National Institutes of Health, Baltimore, MD, United States
Introduction: Transcranial Magnetic Stimulation (TMS) is a noninvasive technique that uses pulsed magnetic fields to affect the physiology of the brain and central nervous system. Repetitive TMS (rTMS) has been used to study and treat several neurological conditions, but its complex molecular basis is largely unexplored.
Methods: Utilizing three experimental rat models (in vitro, ex vivo, and in vivo) and employing genome-wide microarray analysis, our study reveals the extensive impact of rTMS treatment on gene expression patterns.
Results: These effects are observed across various stimulation protocols, in diverse tissues, and are influenced by time and age. Notably, rTMS-induced alterations in gene expression span a wide range of biological pathways, such as glutamatergic, GABAergic, and anti-inflammatory pathways, ion channels, myelination, mitochondrial energetics, multiple neuron-and synapse-specific genes.
Discussion: This comprehensive transcriptional analysis induced by rTMS stimulation serves as a foundational characterization for subsequent experimental investigations and the exploration of potential clinical applications.
Introduction
Transcranial Magnetic Stimulation (TMS) is a noninvasive technique that uses pulsed magnetic fields to affect the physiology of the brain and the central nervous system (Wagner et al., 2007). Repetitive TMS (rTMS) has been shown to alter higher-order biological processes including neuronal plasticity (Ferreri and Rossini, 2013), cortical excitability (Cavaleri et al., 2017), and cognition (Cheng et al., 2017). rTMS has been used in the study and treatment of neurological conditions including stroke (Smith and Stinear, 2016; McDonnell and Stinear, 2017), epilepsy (Chen et al., 2016), dystonia (Lozeron et al., 2016), schizophrenia (Kaskie and Ferrarelli, 2017), multiple sclerosis (Simpson and Macdonell, 2015), Parkinson’s (Chung and Mak, 2016) and Alzheimer’s disease (Nardone et al., 2014; Weiler et al., 2020), as well as other neurological and non-neurological disorders (Weiler et al., 2021), and was approved for clinical use for treatment-resistant depression by the FDA in 2008.
Remarkably, given its extensive clinical application, the complex molecular basis of rTMS remains largely unexplored. Only a limited number of transcripts and proteins have been previously reported altered following rTMS (Lee et al., 2014; Wang et al., 2014; Cirillo et al., 2017) including Fos (Legrand et al., 2018), Caspase-3 (Grehl et al., 2015), Gfap (Grehl et al., 2015), the MAPK signaling pathway (Cui et al., 2019), and the miR-409-3p/CTR3/AMPK/Sirt1 axis (Wu et al., 2022). However, a systematic genome-wide transcriptional analysis has not been performed to date (Ikeda et al., 2017, 2018), and the underlying molecular basis of the clinical effects of rTMS treatment remains unknown.
Here, using three experimental models in rats, in vitro, ex vivo, and in vivo, using genome-wide microarray analysis, we show that rTMS treatment results in broad-based alterations in gene expression patterns using different stimulation protocols, in different tissues, over time, and with age. Gene expression was altered due to rTMS stimulation in numerous biological pathways including glutamatergic and GABAergic pathways, ion channels, myelination, mitochondrial energetics, cellular tight junction gene expression, as well as in multiple neuron and synapse-specific genes. Strikingly, in some circumstances rTMS had strong anti-inflammatory effects with broad down regulation of pathways involved in the classical complement cascade, Toll-like receptors, and other inflammatory pathways. This global transcriptional analysis induced by rTMS stimulation provides a baseline characterization for further experimental analysis and exploring potential clinical applications.
Materials and methods
Animals
Long–Evans rats (Charles River Laboratories), used for the ex vivo and in vivo experiments, were individually housed and maintained under specific pathogen-free conditions on a 12-h light/dark cycle at the National Institute on Aging/National Institute on Drug Abuse (NIA/NIDA) animal facilities in the Biomedical Research Center (Baltimore, MD). Standard rat chow and water were available ad libitum throughout the experiments. All procedures were approved by the Animal Care and Use Committee of the Intramural Research Program of the NIA.
Background behavioral characterization
To establish the baseline cognitive status of the animals used in the ex vivo experiment, rats were tested in a ‘place’ version of the Morris water maze task, as previously described (Gallagher et al., 1993). The Morris water maze is a widely recognized tool for investigating spatial memory and learning in rodents, and the procedure used here has been extensively validated as a test for neurocognitive aging (Rapp et al., 1987; Rapp and Gallagher, 1996; Haberman et al., 2012; Gallagher et al., 2015; Tomás Pereira and Burwell, 2015).
Training continued over 8 consecutive days, three training trials per day. Every other day, the third trial was a probe in which the platform was inaccessible for 30 s. A learning index score was calculated for each animal from their average proximity to the escape platform during training; lower scores indicate better task performance. Aged rats that performed on par with young animals were denoted aged unimpaired (AU), while rats that scored greater than the young were classified as aged impaired (AI; Spiegel et al., 2013; Supplementary Figure 1). To control for non-mnemonic deficits, rats were tested in a single session of a hippocampus-independent cued water maze protocol the following day. No animals that performed outside the normal range on this version of the task were included in the present experiments.
Tissue preparation
In vitro
Primary cultures of hippocampal neurons were prepared using hippocampi collected from E18 Sprague Dawley rats as previously described (Mazucanti et al., 2018). Dissociated cells were counted and plated (106 cells/dish) in polyethyleneimine (Sigma-Aldrich) pre-coated coverslips on 35 mm dishes (zero days in vitro). Neurons were maintained in Neurobasal medium (GIBCO) supplemented with B27 (GIBCO), 2 mM glutamine, 100 U/ml penicillin, 100 μg/ml streptomycin, and 0.25 μg/ml amphotericin B. The cultures were placed in an incubator with extra insulation to prevent CO2 loss and decrease in temperature. The plates were placed centered directly on the inverted coil and received either 1 Hz, intermittent Theta Burst Stimulation (iTBS), or sham stimulation. Stimulation intensity was set at 15% of the machine’s maximum output (stimulation intensity for in vitro and ex vivo experiments was chosen as the average intensity for all groups in the in vivo experiment, detailed below). Neuronal cultures received either 1 Hz, iTBS, or sham stimulation. For the sham treatment, the plate was placed in the incubator with the coil approximately 20 cm away. Following stimulation, the plates were returned to the home incubator without the coil. RNA was isolated at 0, 2, 8 24, and 48 h after the end of stimulation.
Ex vivo
Four young (5–6 months), 4 AU, and 4 AI (24–25 months) male Long-Evans rats were sacrificed. Under RNase-free conditions, brains were removed, and the hippocampi were isolated and placed in cold, artificial cerebrospinal fluid (aCSF; 120 mM NaCl, 2.5 mM KCl, 1 mM NaH2PO4, 26 mM NaHCO3, 1.3 mM MgSO4, 10 mM D-Glucose, 3.3 mM CaCl2) saturated with 100% O2. The hippocampi were then quickly cut into approximately 7 to 9, 1 mm-thick slabs using a McIlwain tissue chopper (Pt#: MTC/2E; The Mickle Laboratory Engineering Co.), yielding approximately 15–18 hippocampal slices for each brain. Serial slices were distributed equally into 3 separate dishes (1 Hz, iTBS, sham) and incubated in fresh aCSF for 1 h at 32°C before administering rTMS. Hippocampal slices from young, AU, and AI rats were arranged 1 cm under the center of the coil and received either 1 Hz, iTBS, or sham stimulation, with the stimulation intensity set to 15% of the machine’s maximum output. Sham stimulation was applied to hippocampal slices arranged 20 cm from the coil. Hippocampal slices from one given animal were equally distributed across conditions (1 Hz, iTBS, and sham) and rested in aCSF for 2 h before RNA collection.
In vivo
Before rTMS administration, eight aged (26–27 months, 714–1,150 g) and eight young male rats (6–7 months, 502–788 g) were lightly anesthetized with isoflurane to reduce restraint stress and head movement during the stimulation procedure. The rats then received an intra-muscular injection of Dexmedetomidine (aged: 0.03 mg kg−1 body weight; young: 0.035 mg kg−1 body weight, the minimum required to prevent movement throughout the stimulation period). Antisedan (aged: 0.03 mg kg−1 body weight; young: 0.035 mg kg−1 body weight) was given after stimulation to reverse the sedation. Physiological parameters (heart rate, arterial blood oxygen saturation, body temperature) were monitored during anesthesia (Starr Life Sciences MouseOx Plus, Starr Life Sciences Corp. Oakmont, PA, USA) to ensure light and consistent anesthetic depth throughout stimulation. Rats were positioned on a heating pad and body temperature was maintained within 2°C of the initial measurement.
Young and aged rats received either iTBS or sham stimulation. Similar to procedures described in previous studies (Trippe et al., 2009; Mix et al., 2010, 2015; Benali et al., 2011; Hoppenrath et al., 2016), the coil was centered 8 mm above the rat’s skull, oriented with the handle to the left of the rat to produce a mediolaterally oriented electric field, aimed towards maximally stimulating the axons of the corpus callosum. The rat’s head was elevated with a small plastic conical ramp to ensure the skull was roughly parallel with the coil base and to minimize head movement and off-target body stimulation. Stimulator output intensity was adjusted to just below the level that elicited muscle twitching in the neck and head [aged: 15.0 ± 0.9% (11–17%); young: 15.3 ± 1.4% (12–19%) of maximal stimulator output], consistent with earlier preclinical studies in rats (Hoppenrath and Funke, 2013; Mix et al., 2015). Sham stimulation was performed with the coil 20 cm away from the rats’ heads.
Forty-eight hours post-stimulation animals in all conditions were deeply anesthetized with 5% isoflurane and sacrificed. Under RNase-free conditions, the brains were removed and freshly microdissected areas of the neocortex and dorsal hippocampus under the center of the TMS coil during stimulation were immediately frozen and stored at −80°C.
rTMS protocols
rTMS was applied using a Magstim Rapid2 stimulator with a 70-mm figure-eight coil (The Magstim Company, Whitland, Dyfed, UK). 1 Hz stimulation was applied in 5 blocks of 600 pulses lasting 10 min repeated at 15-min intervals for a total of 3,000 pulses in 70 min. iTBS was administered in 5 blocks repeated every 15 min with each block consisting of 20 trains of 3 50-Hz pulse bursts repeated at 5 Hz for 2 s with a 10-s inter-train interval as described elsewhere (Huang et al., 2005). Each iTBS block consisted of 600 pulses in 192 s for a total of 3,000 pulses delivered in 63.2 min.
Genome-wide gene expression analysis
RNA extraction
Total RNA was extracted by adding frozen individual hippocampi or hippocampal sections into prechilled tubes containing 1.0 mm glass beads (BioSpec Products, Bartlesville, OK) and RLT buffer and homogenized with a single 30 s 5,500 rpm cycle on a Precellys 24 homogenizer (Bertin Corp., Rockville, MD). The homogenate was centrifuged at 10,000 rpm for 10 min, the cleared lysate was transferred to a new tube, and RNA was column-purified according to the Qiagen RNeasy mini protocol (Qiagen, Germantown, MD). RNA concentration and quality were measured by Nanodrop (ThermoFisher, Waltham, MA USA) and the Agilent Bioanalyzer RNA 6000 Chip (Agilent, Santa Clara, CA).
Agilent microarray experiments
Two-hundred ng total RNA was labeled using the Agilent one-color Low-Input QuickAmp Labeling Kit (5190-2305, Agilent, Santa Clara, CA), purified on Qiagen columns, and quantified according to the manufacturer’s recommendations. A total of 600 ng Cy3-labeled cRNA was hybridized for 17 h to Agilent SurePrint G3 Rat Gene Expression v2 8x60K oligo microarrays (G4858-074036). Following post-hybridization rinses, arrays were scanned using an Agilent SureScan microarray scanner at 3-micron resolution, and hybridization intensity data was extracted from the scanned images using Agilent’s Feature Extraction Software. Raw and normalized microarray data have been deposited in the GEO data repository as SuperSeries GSE230150, with SubSeries GSE230147 (in vitro, N = 56 samples), GSE230148 (ex vivo, N = 40 samples), and GSE230149 (in vivo, N = 56 samples).
Microarray data analysis
The resulting dataset was analyzed with DIANE 6.0, a JMP microarray analysis program. The results were normalized with a z-score transformation (Cheadle et al., 2003). Z-normalized data were then analyzed with principal component analysis and sample hierarchical cluster to investigate the possible outliner samples and global genotype/treatment effects. To determine the gene expression changes within each specific RNA comparison, we first filtered probes by ANOVA test, then the pairwise statistical analysis is done by the z-test between different investigated groups with multiple comparison correction. The significant probes are determined by the cut off (Wagner et al., 2007) one way ANOVA p < 0.05 (Ferreri and Rossini, 2013) the z-test p < 0.05 and false discovery rate < 0.30 (Cavaleri et al., 2017) |z-ratio| > 1.5 (Cheng et al., 2017) average z-score for the pairwise sample > 0 (Cheadle et al., 2003). In other words, every differential expression effect of rTMS reported throughout this manuscript meets these statistical selection criteria.
Network analysis
The entire expression changes (z-ratio) result for each comparison are used as input. Gene set analysis using GO gene sets with the Parametric Analysis of Gene Set Enrichment (PAGE) algorithm was performed as previously described (Kim and Volsky, 2005). Protein interaction diagrams were generated from significant differentially expressed genes with the STRING interaction database. Functional grouping is denoted by colors, network nodes represent proteins and edges represent protein–protein relationships.
In addition to gene sets for functional gene groups, gene set analysis was also performed using highly specific Gene-Disease Associations (GAD) database (De et al., 2010; Zhang et al., 2010), in which every gene in each gene set has been statistically associated with a specific human disease or disorder through a population-based genetic association study. Noteworthy, an increase or decrease in a specific disease gene set simply means the aggregate values of the genes that have been associated with that disease have increased or decreased in expression, not that the disorder itself has increased or decreased or can be altered by rTMS treatment.
Results
In this global microarray-based gene expression analysis we used three distinct experimental modalities (Figure 1) to identify gross transcriptional changes induced by rTMS, each having specific advantages and limitations; (a) in vitro: purified rat embryonal hippocampal neuronal cultures allowed identification of transcriptional changes over a 48-h time course using two stimulation protocols (1 Hz and iTBS); (b) ex vivo: hippocampal slices from a well-established rat model of aging (Gallagher et al., 1993; Gallagher and Rapp, 1997) enabled testing two different stimulation protocols (1 Hz and iTBS), in a short-term response model (2 h) across cognitive status in the context of complex cellular organization; and (c) in vivo: young and aged animals allowed the identification of the global transcriptional response to rTMS, in a long-term response model (48 h), in two different brain regions (hippocampus and cerebral cortex), across age. In this way, we identified rTMS-induced transcriptional changes in multiple contexts. As a starting point for hypothesis generation, this report focuses on the effects of rTMS within each model and group, rather than on comparisons between models, cognitive status, or age groups. Detailed results of the transcriptional changes due to rTMS treatment in the context of age, cognition, and brain region will be presented elsewhere. Here the effects of TMS are evaluated as differential gene expression in contrasts between stimulated samples and corresponding sham controls within each experimental condition.
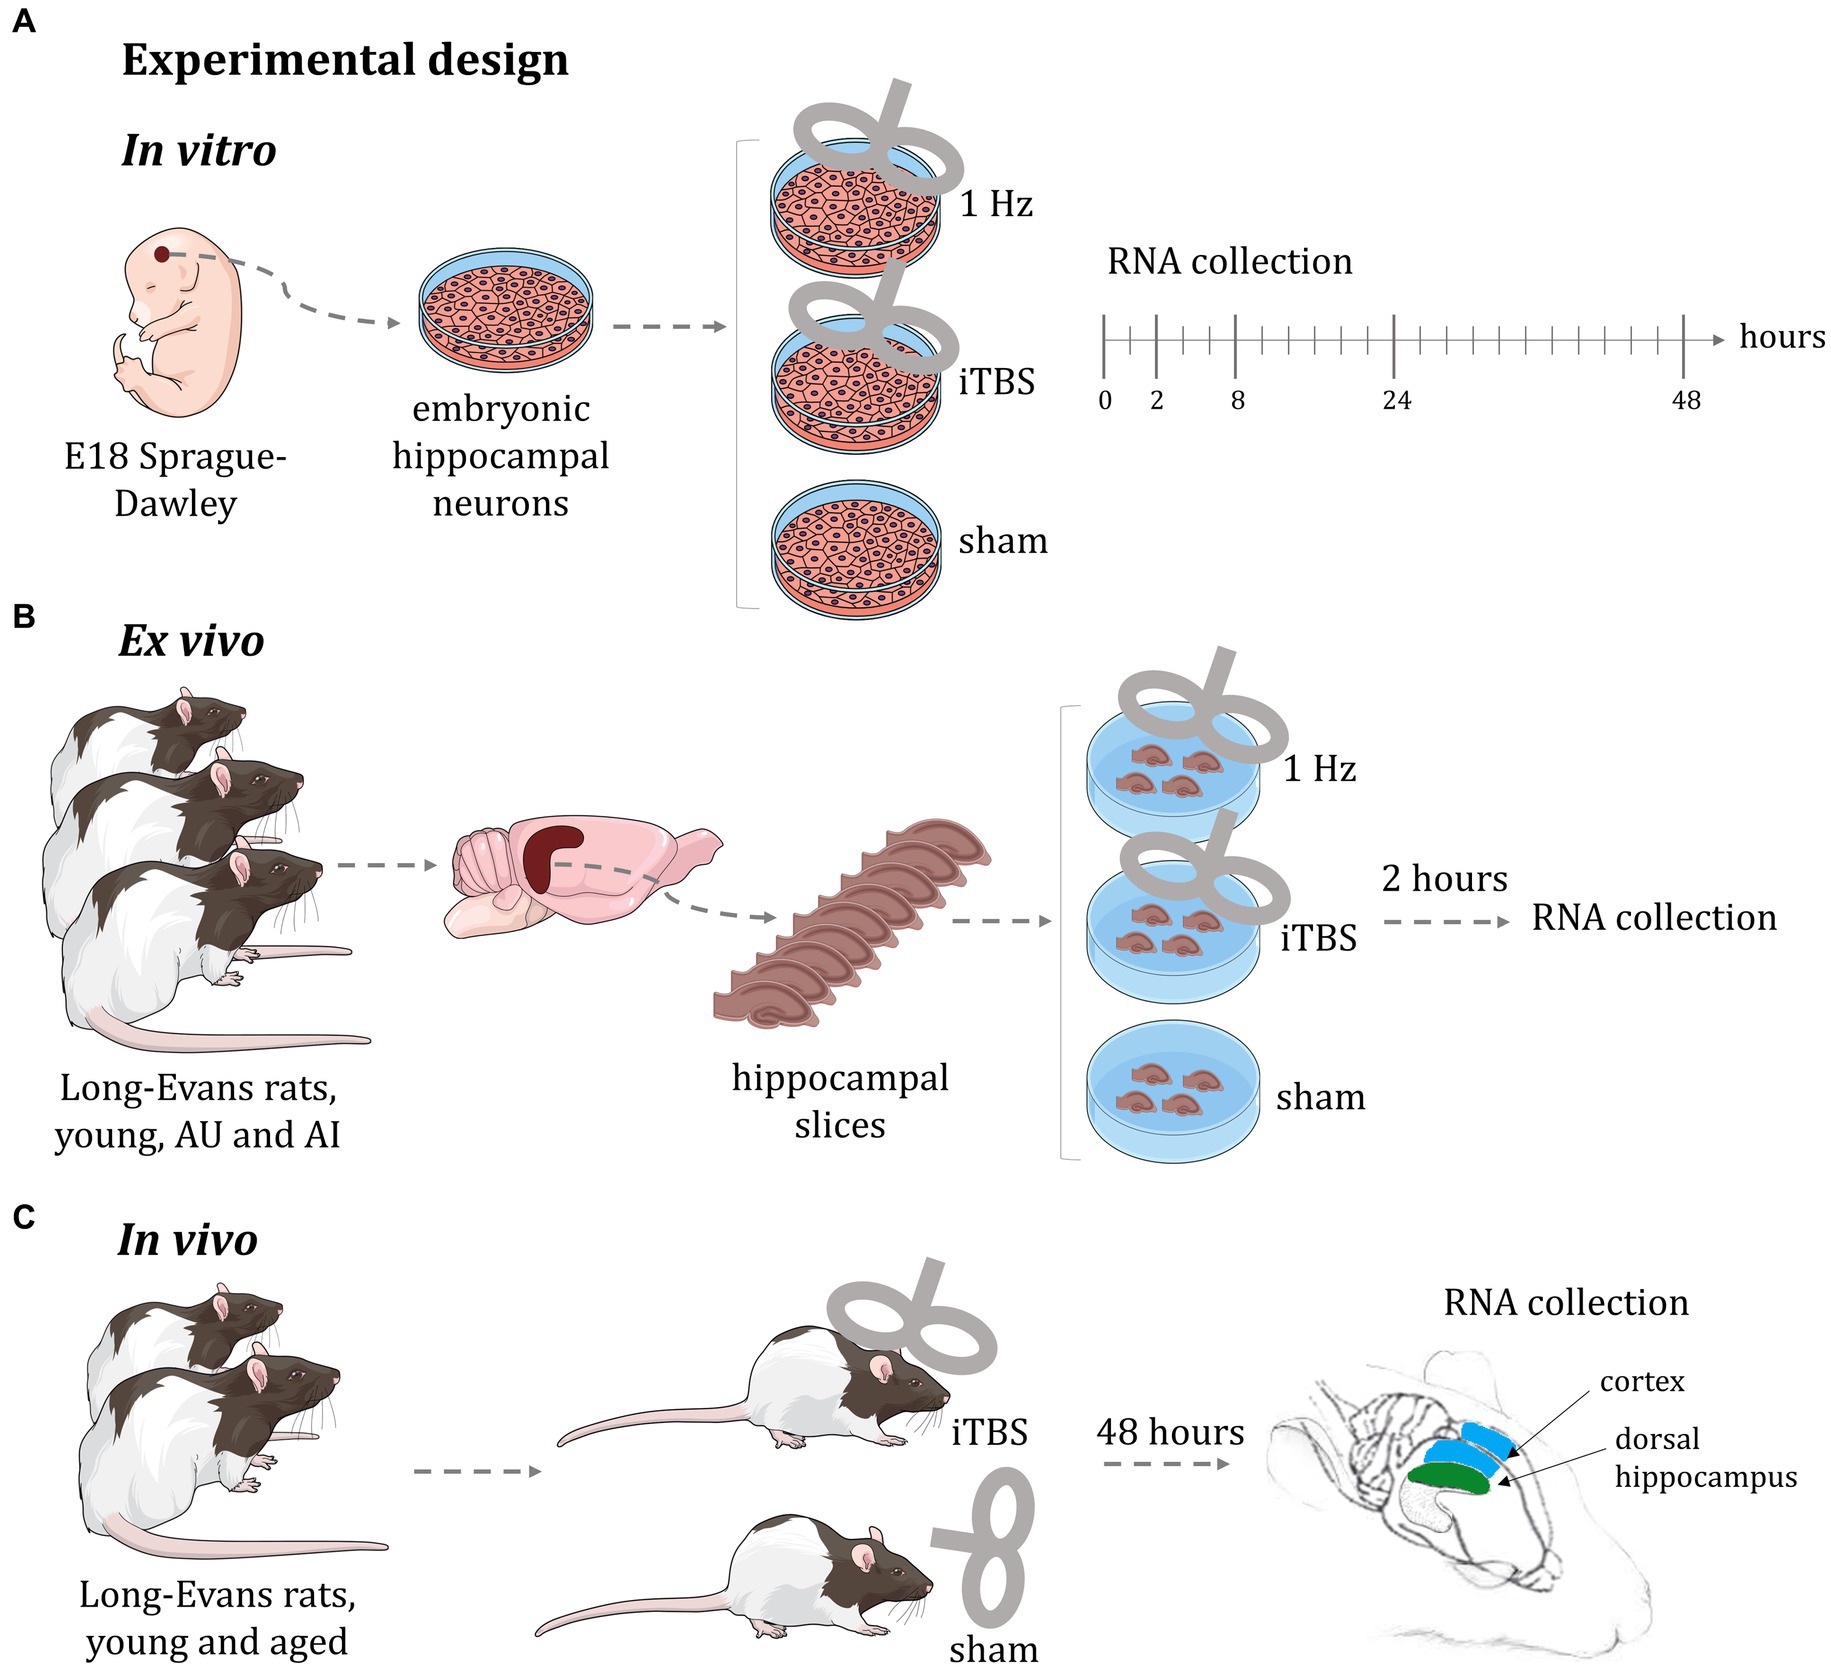
Figure 1. Experimental design of rTMS treatment. (A) In vitro: purified rat embryonal hippocampal neuronal cultures allowed identification of transcriptional changes over a 48-h time course using two stimulation protocols (1 Hz and iTBS); (B) ex vivo: hippocampal slices from a well-established rat model of aging enabled testing two different stimulation protocols (1 Hz and iTBS), in a short-term response model (2 h) across cognitive status in the context of complex cellular organization; (C) in vivo: young and aged animals allowed the identification of the global transcriptional response to rTMS, in a long-term response model (48 h), in two different brain regions (hippocampus and cerebral cortex), across age. AU: aged unimpaired; AI: aged impaired; iTBS: intermittent theta burst stimulation. This figure was in part created with BioRender software (BioRender.com).
rTMS produces broad transcriptional changes
As shown in Table 1, stimulation resulted in hundreds of significant transcriptional changes between rTMS and sham-treated controls in all experimental models, with both increases and decreases in each treatment group. While there are considerable overlaps between rTMS treatments, each sample-treatment combination produced a complex pattern of transcriptional response (Figure 2). This was evident in the in vitro, ex vivo, and in vivo experimental models. The transcriptional response was quite dynamic, often with both increases and decreases in the same gene and gene families with time, stimulation protocol, and relative to brain region. The complete set of statistically significant transcriptional changes due to rTMS can be found here (Supplementary Table 1).
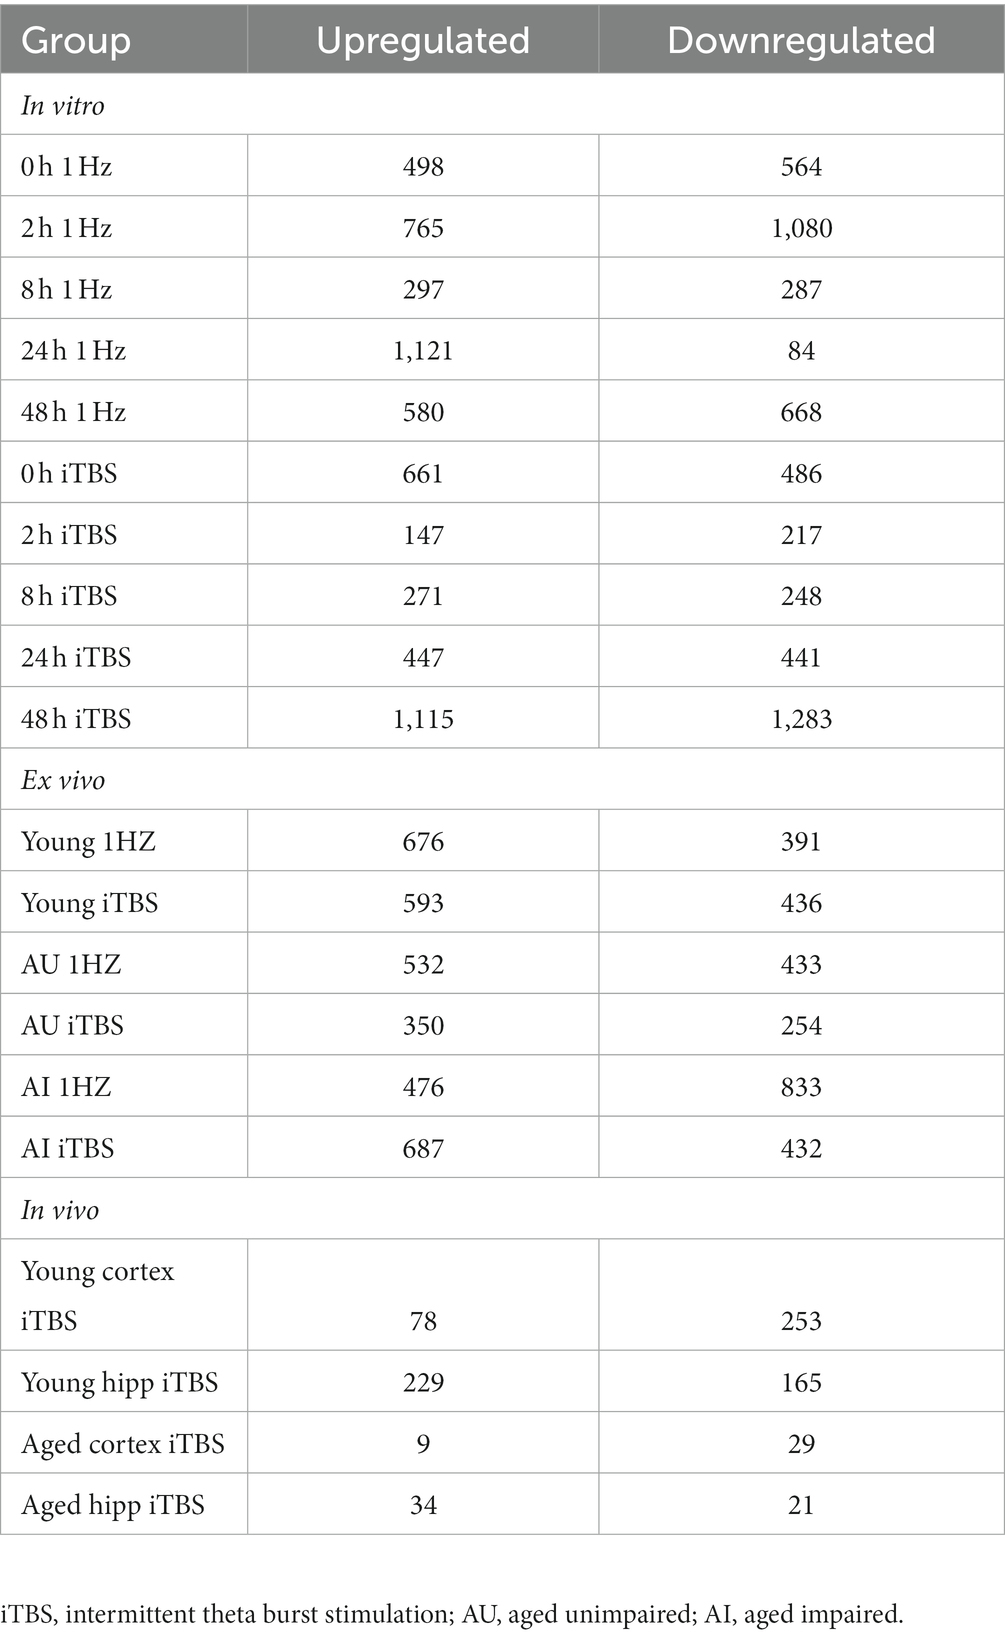
Table 1. Number of genes changed in each rTMS group compared to its respective sham group.
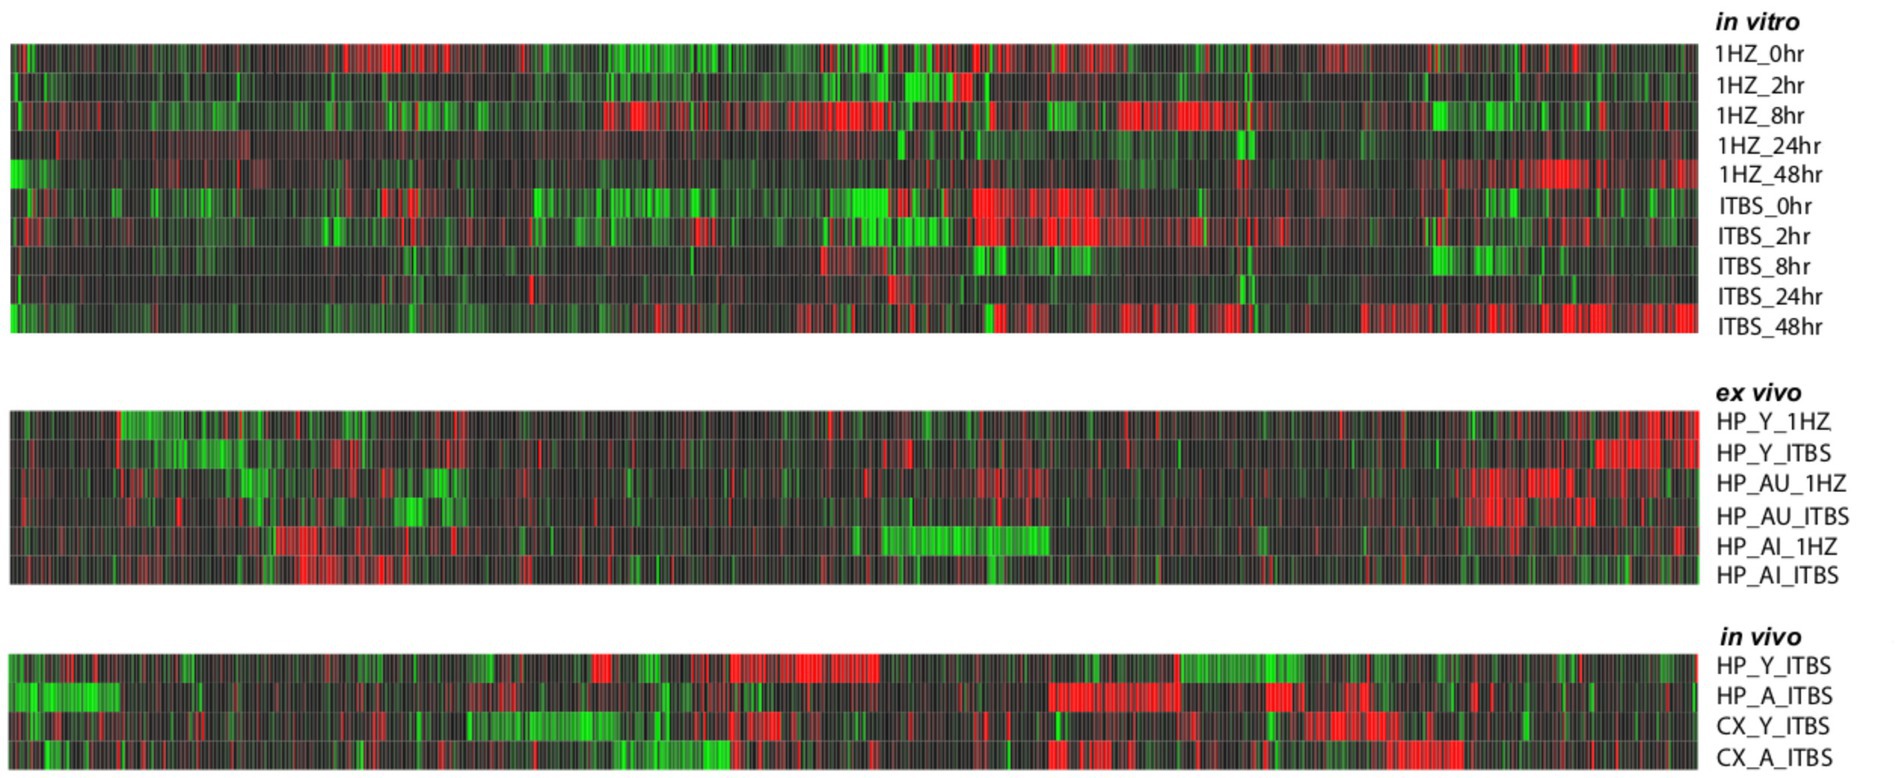
Figure 2. Heat map of gene expression changes due to rTMS treatment in three experimental models. Expression changes for individual genes were considered significant if they met four criteria: z-ratio > 1.5 or below −1.5; false detection rate < 0.30; a p-value statistic for z-score replicability <0.05; and mean background-corrected signal intensity > than zero. Red denotes higher relative expression and black to green are lower relative expression. This analysis suggests that rTMS treatment produces strikingly different patterns of gene expression across conditions within each model compared to their respective sham treatments.
rTMS alters the transcription of genes involved in complex neural processes
Table 2 (in vitro), Table 3 (ex vivo), and Table 4 (in vivo) show groups of selected genes with altered transcription (|z-ratio| > 1.5) implicated in complex neuronal processes in all three models tested. The categories of these genes include neurotransmission, synaptic function, inflammation, myelination, and cell–cell adhesion among other functional gene classes.
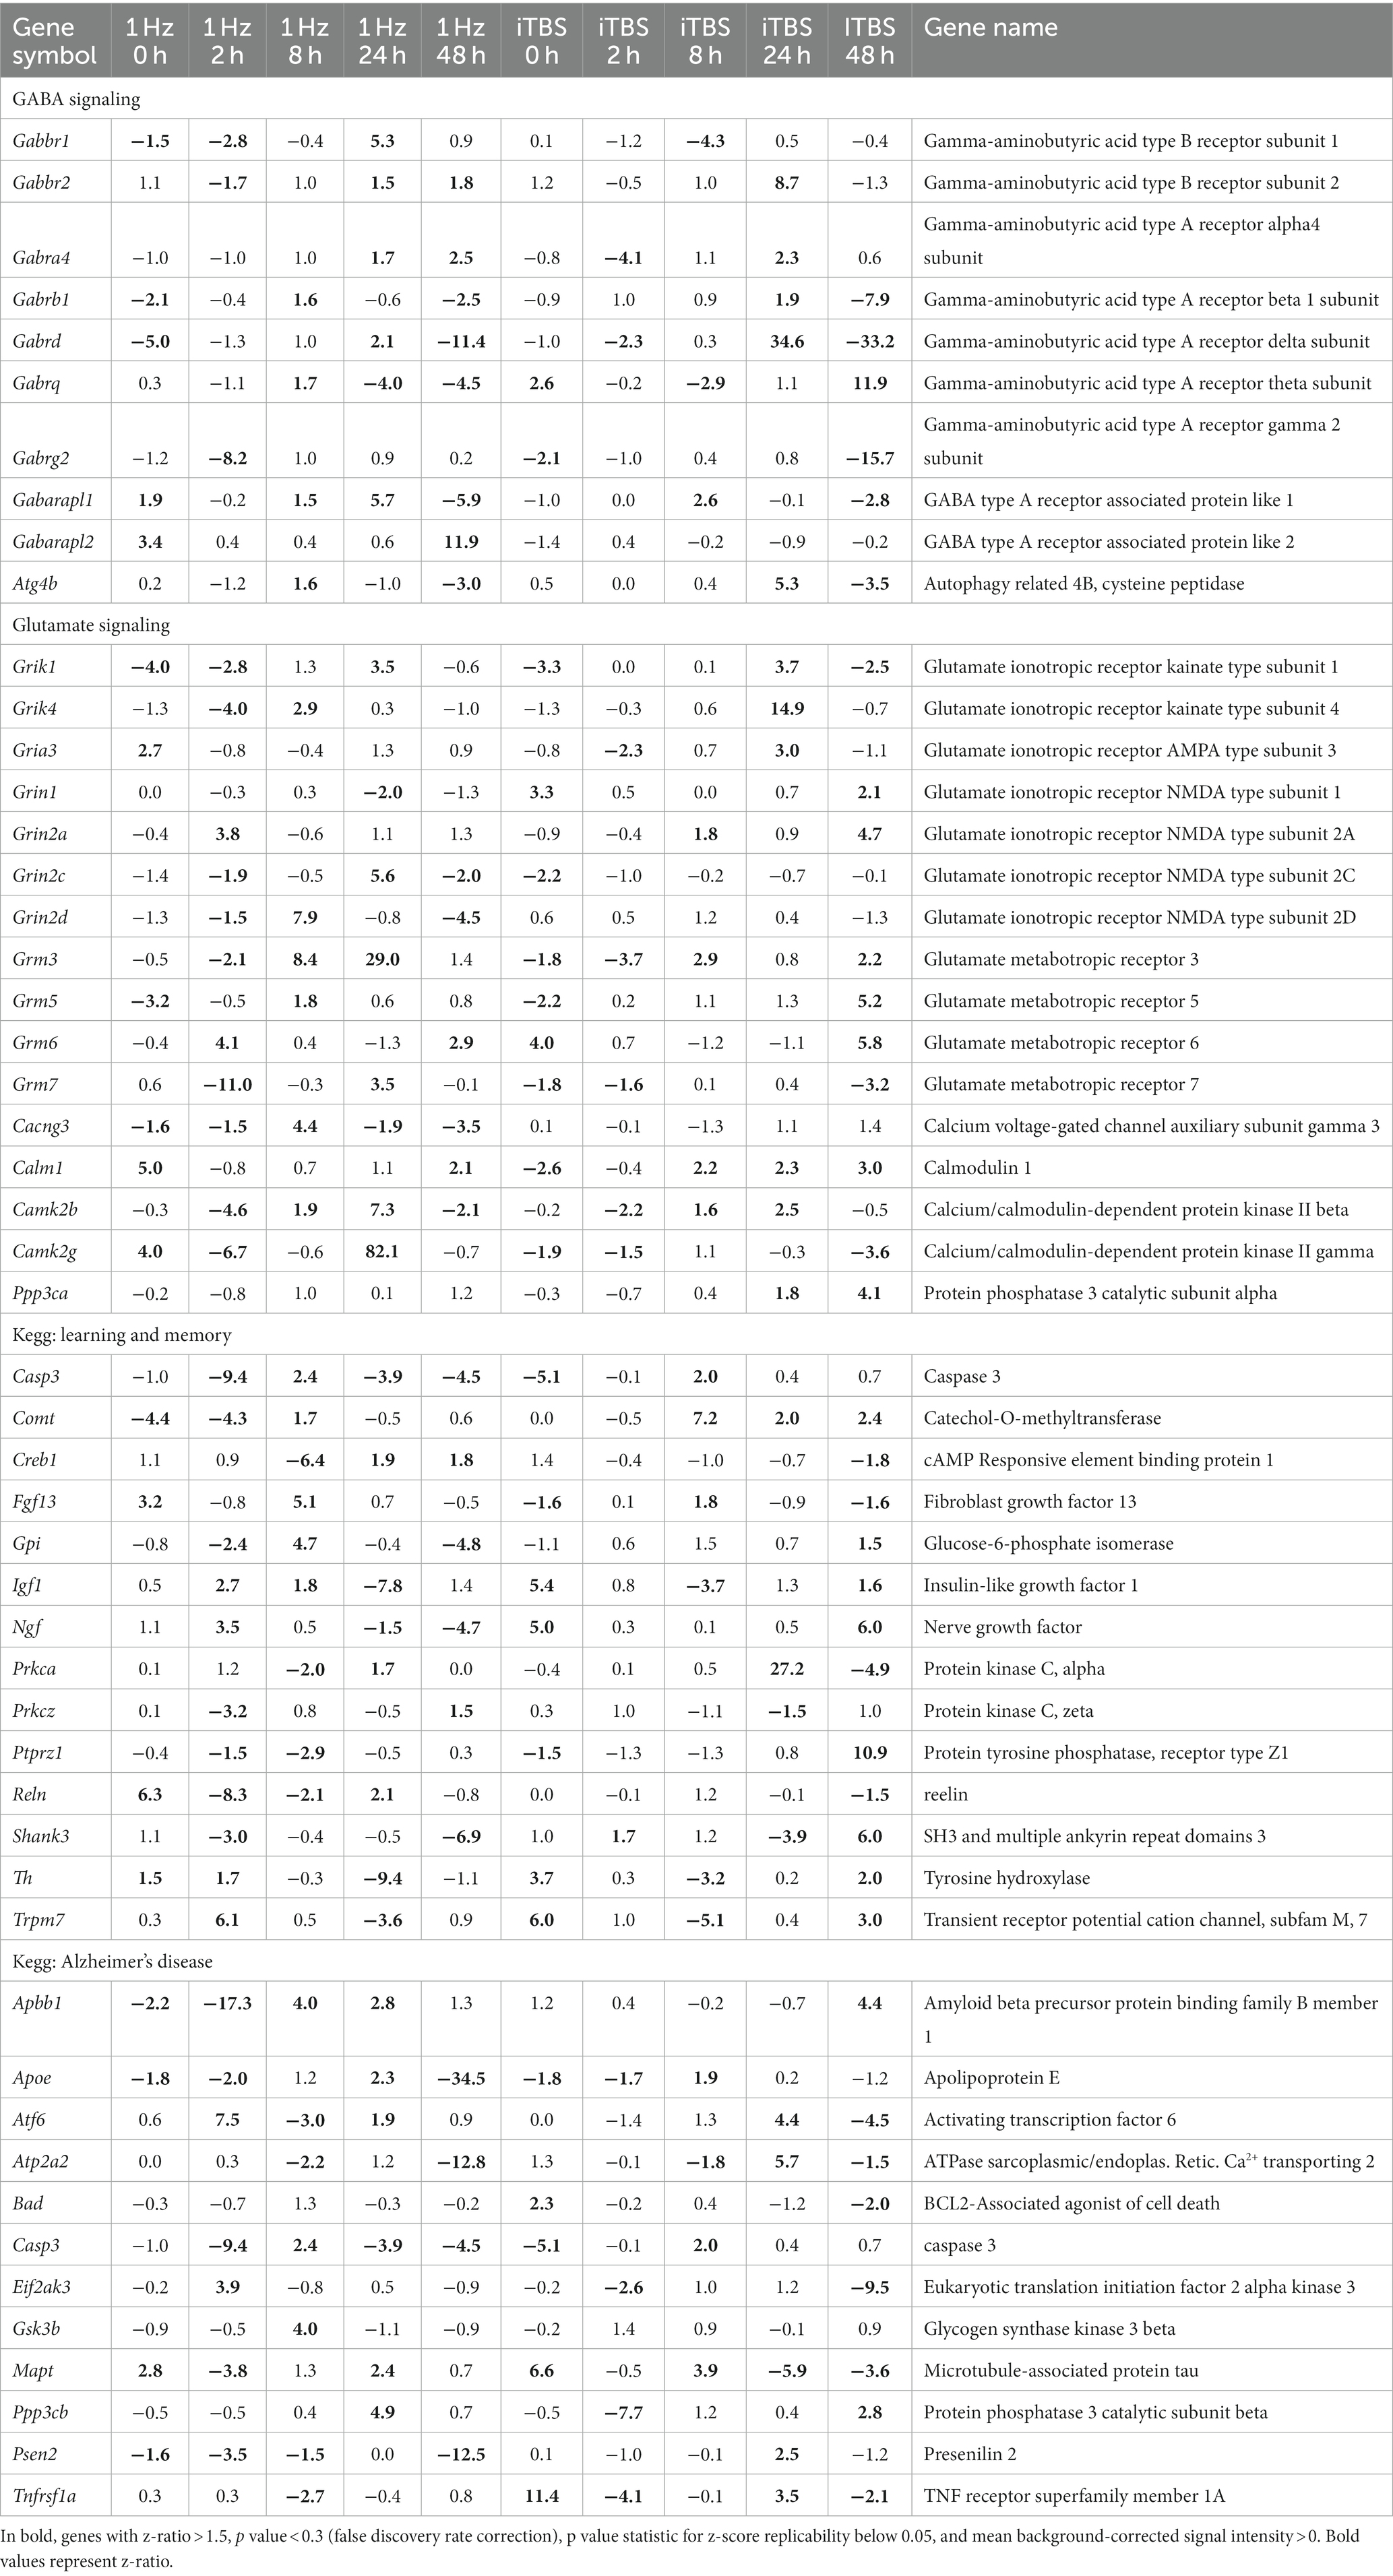
Table 2. In vitro model selected genes of rTMS induced alterations.
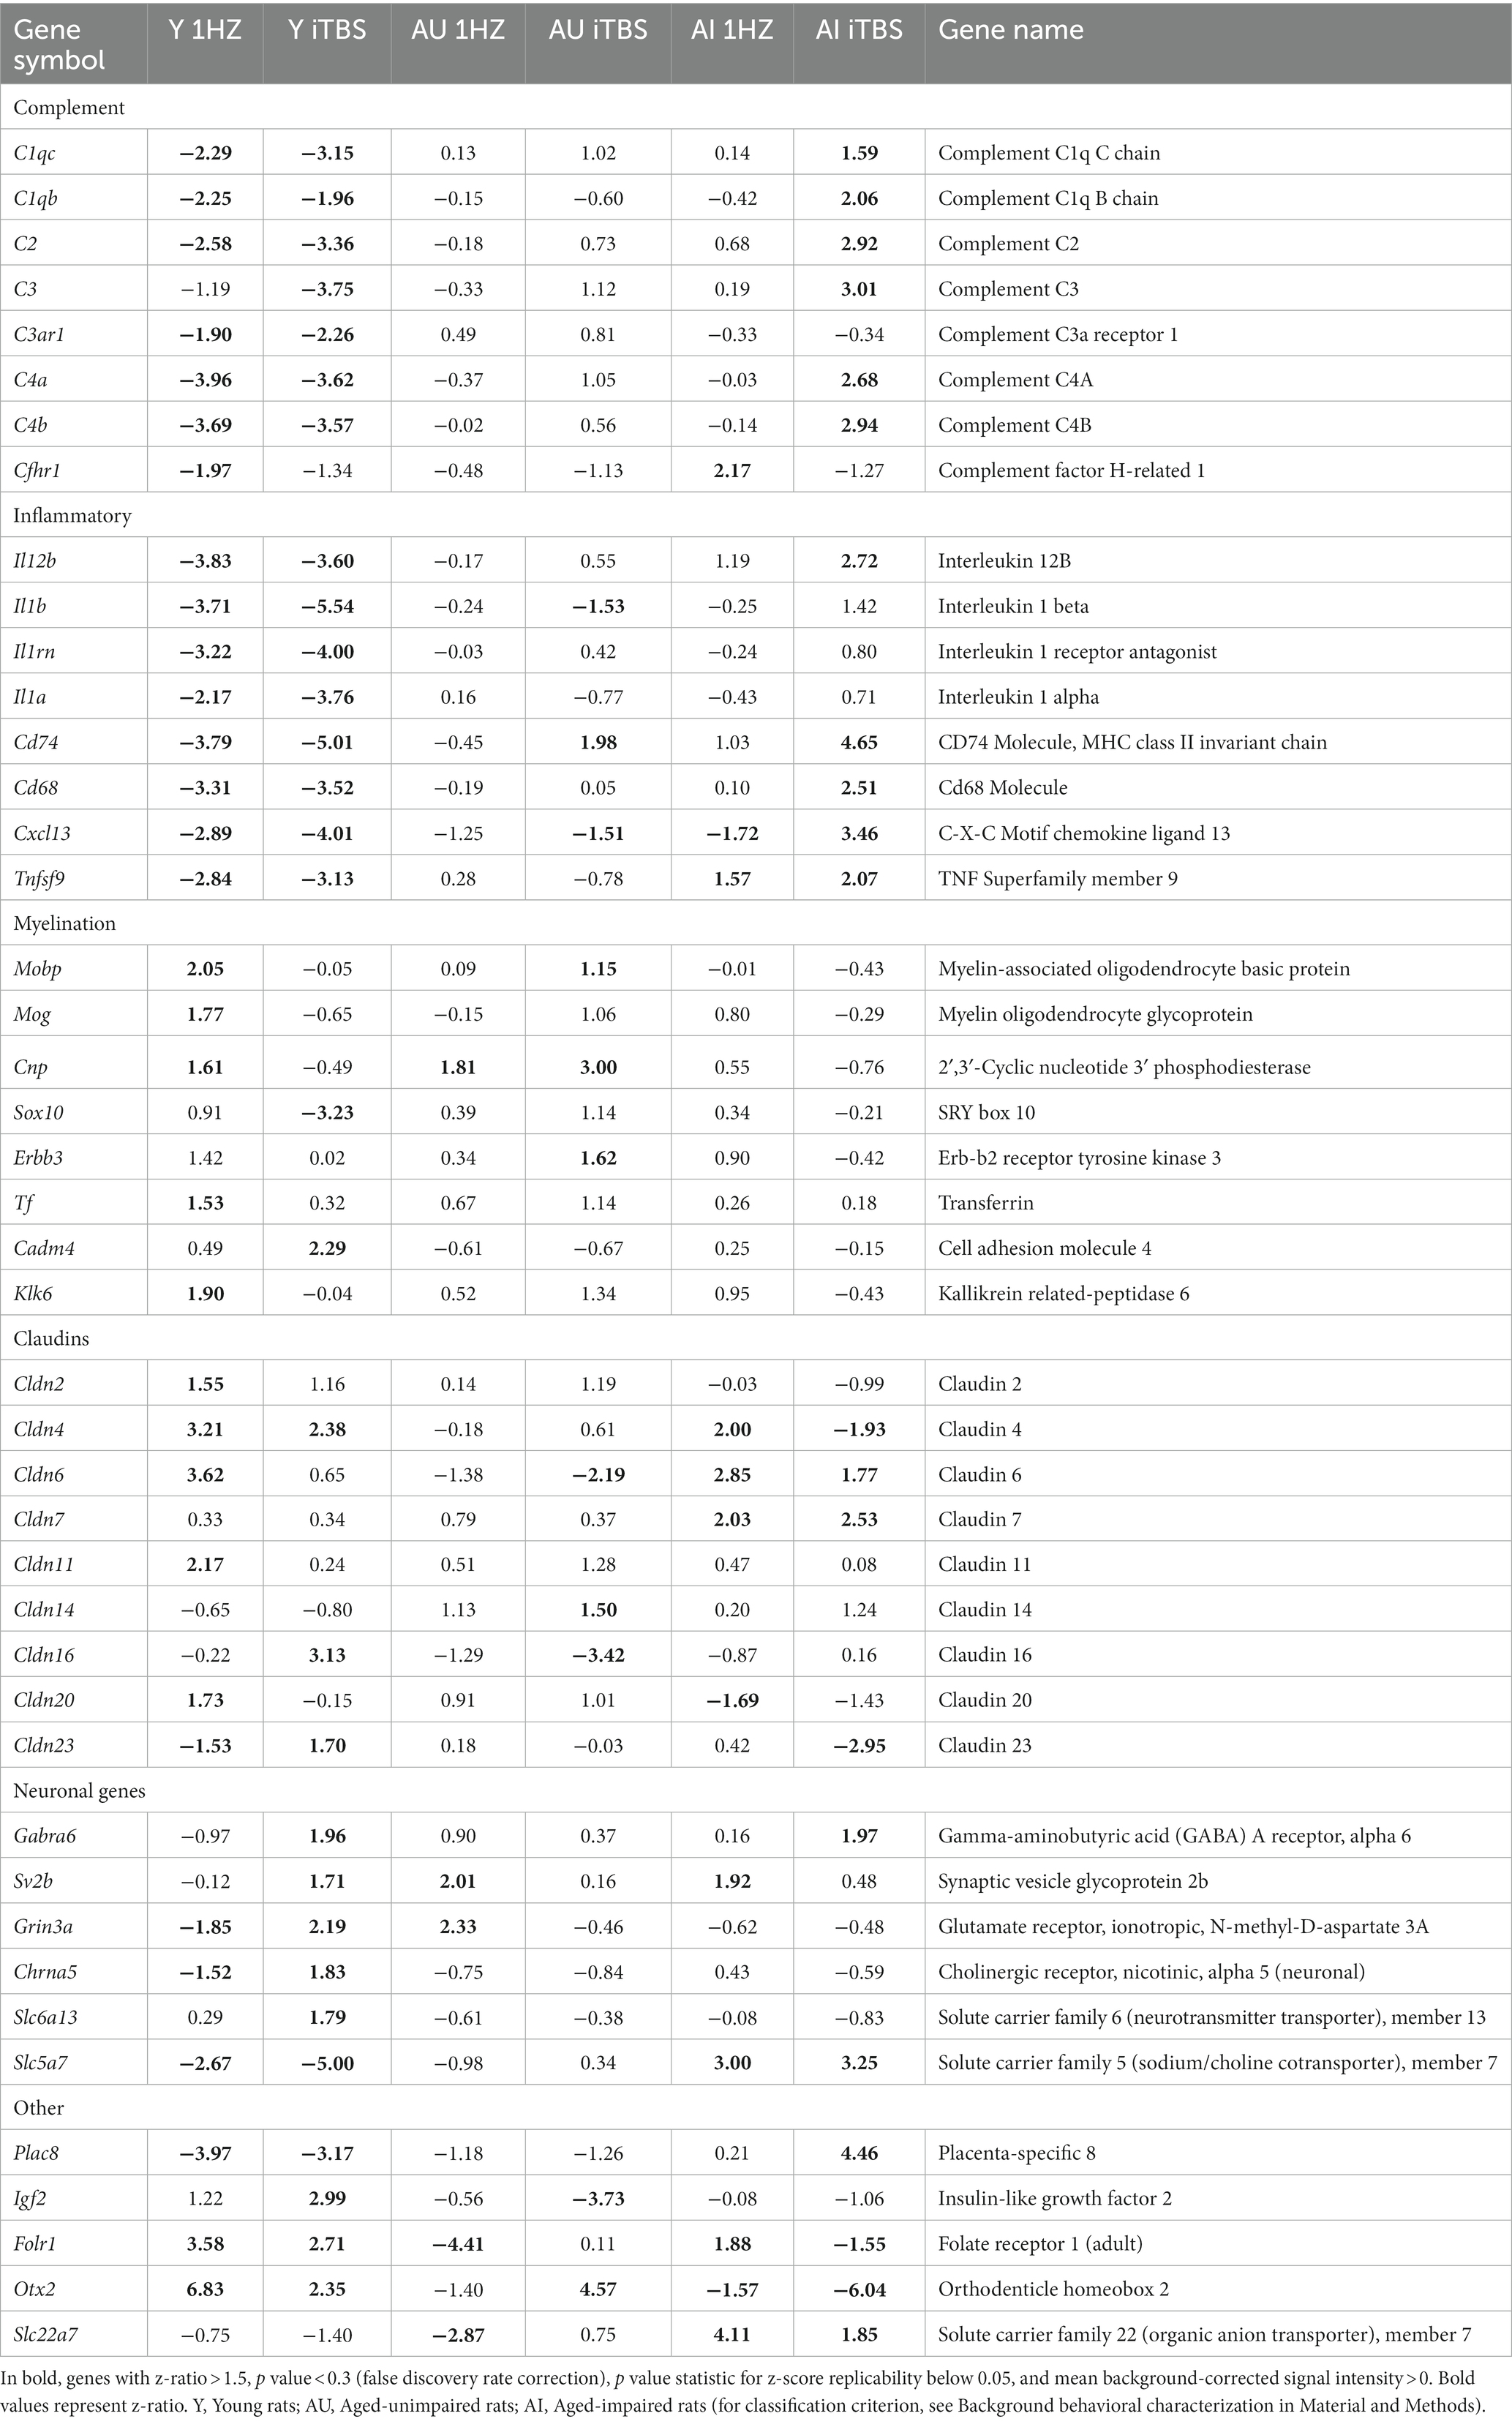
Table 3. Ex vivo model selected genes of rTMS induced alterations.
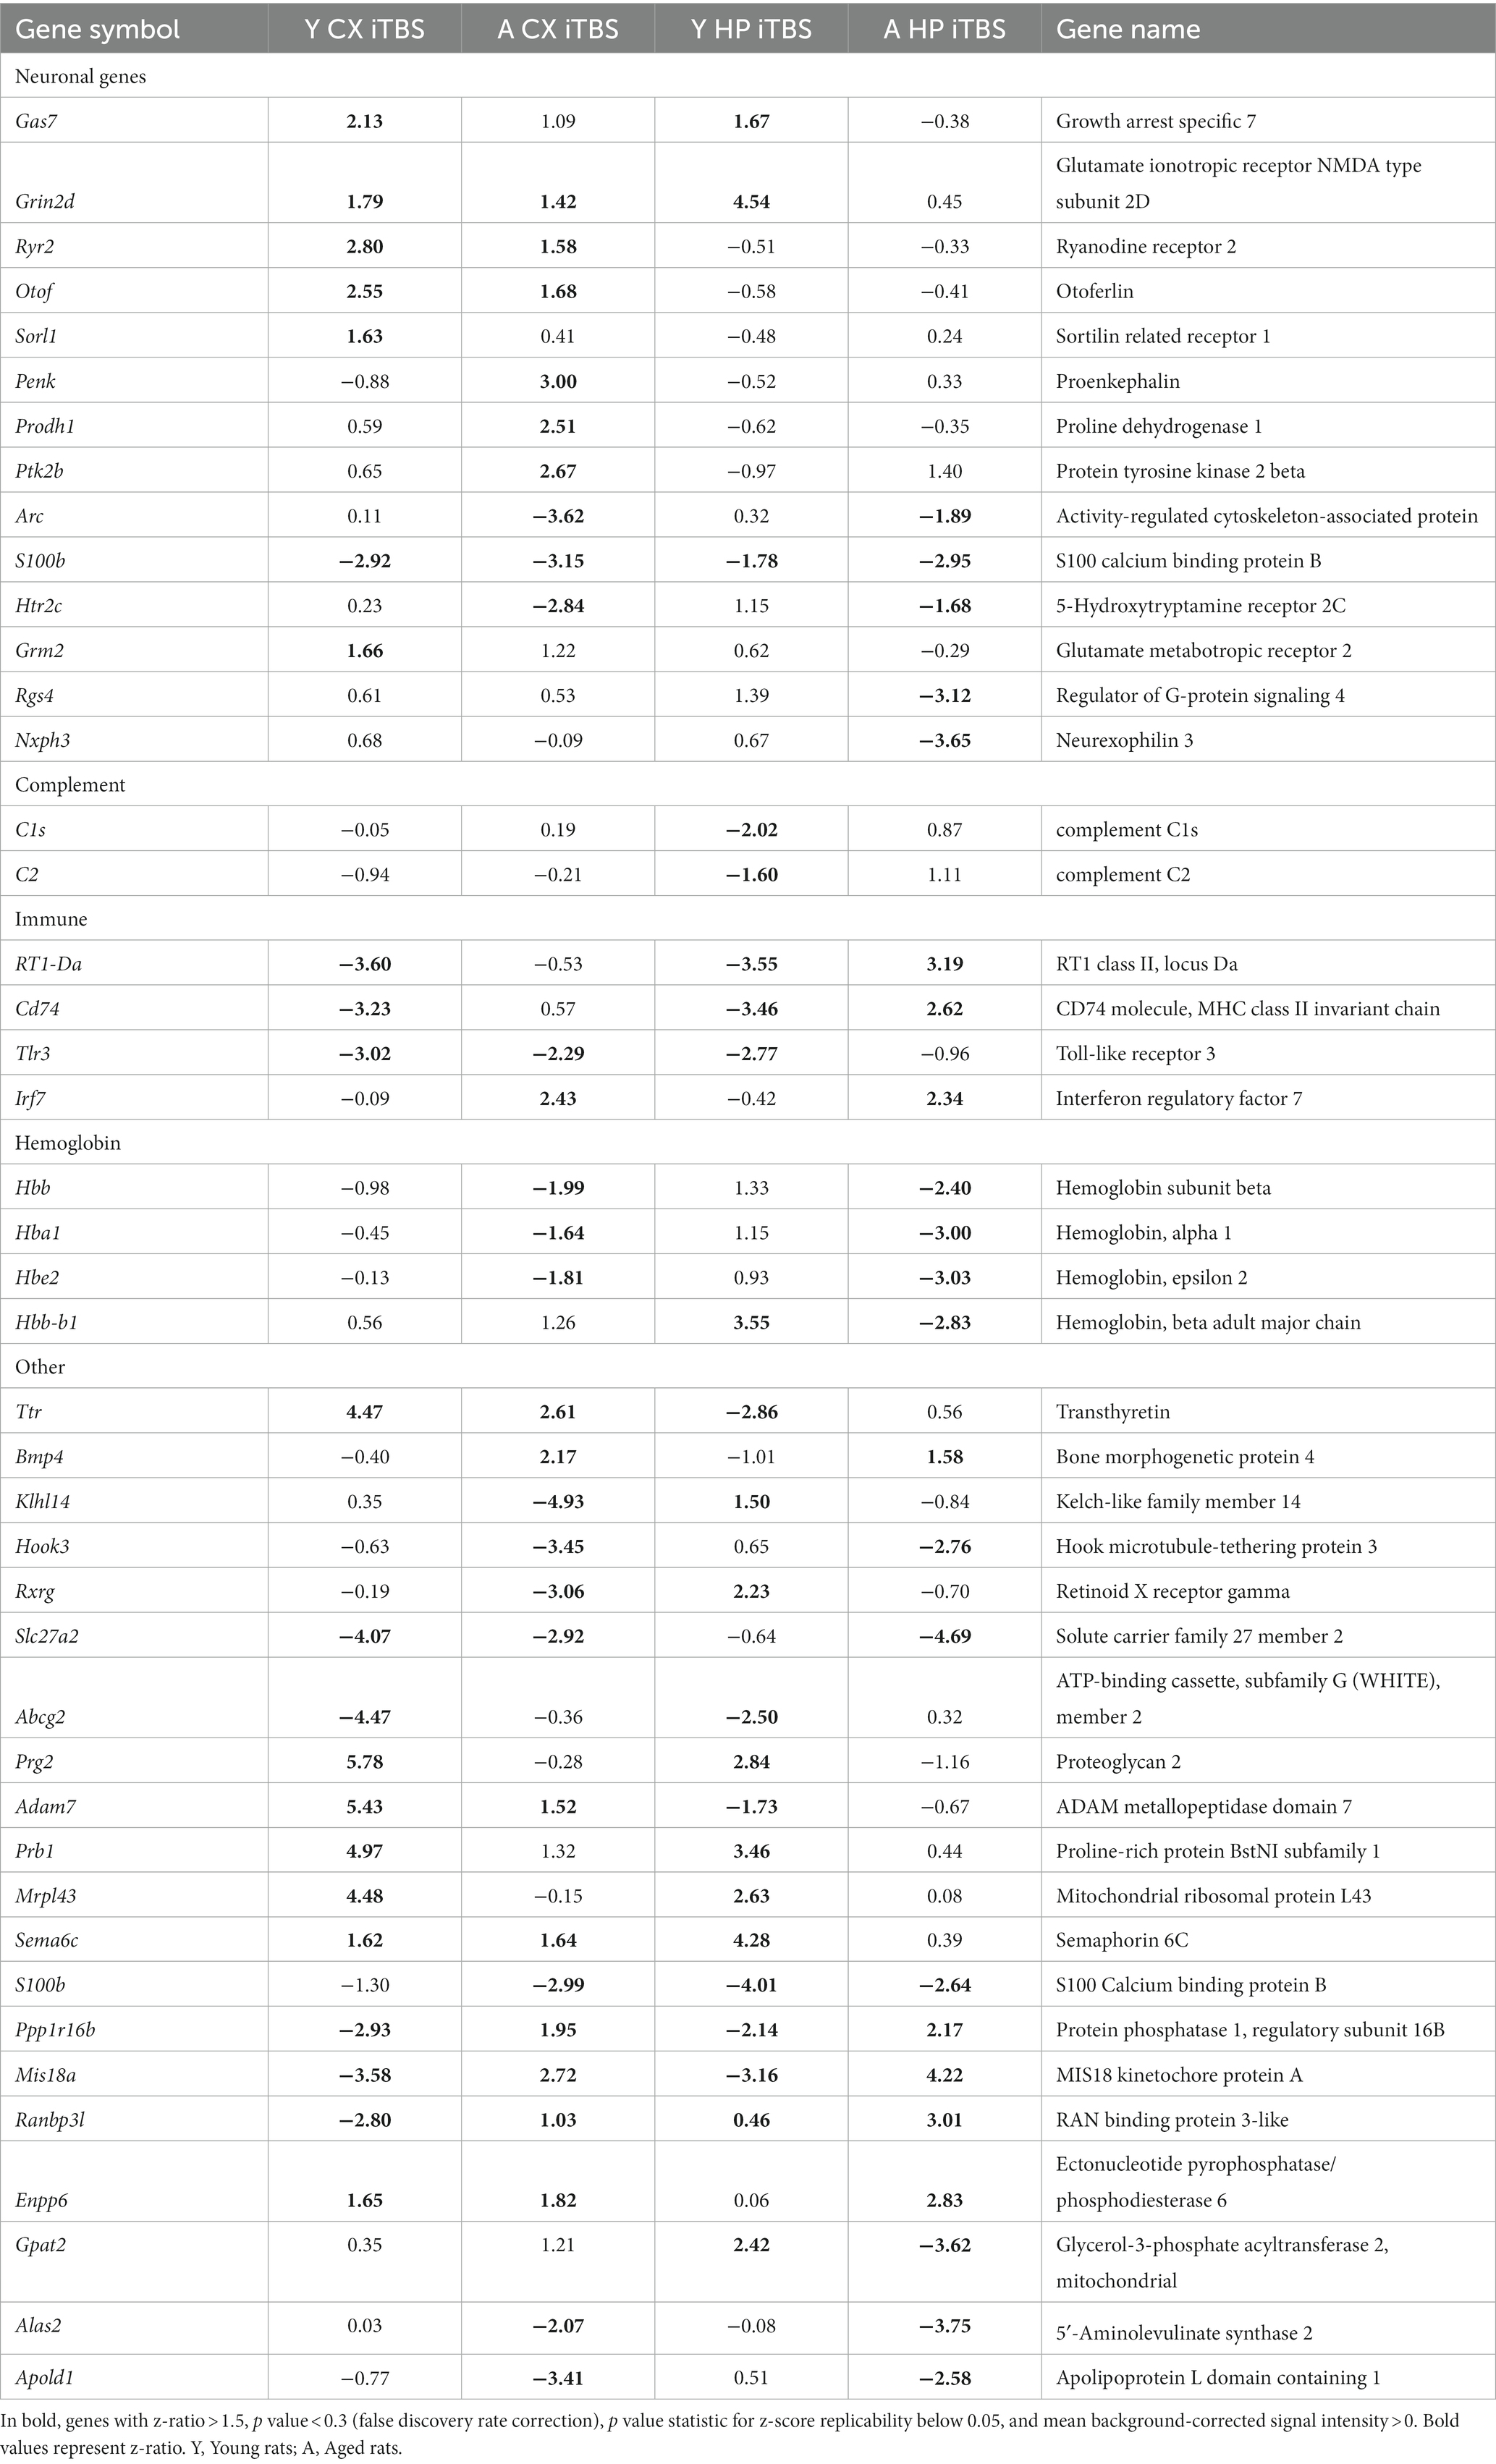
Table 4. In vivo model selected genes of rTMS induced alterations.
With the in vitro model using rat hippocampal neuronal cultures, genes involved in inhibitory and excitatory neurotransmission were altered, both upregulated and downregulated (Table 2), which included multiple GABA (Figure 3A) and glutamate receptors (Figure 3B) such as Gabbr1,2; Grik1,4; Grm3-7, and Gabra4 (Heidelberg et al., 2013) as well as genes involved in learning and memory-related plasticity. In addition, the transcriptional response was altered in oxidative phosphorylation pathways including shared genes involved in Huntington’s, Alzheimer’s, and Parkinson’s disease (Figures 4A,B). In the ex vivo and in vivo models (Tables 3, 4) altered transcription of additional neuronal genes was shown to include genes involved in neurotransmission [Ptk2b (Brys et al., 2013), Slc6a13 (Christiansen et al., 2007)]; choline transport [Slc5a7 (Ribeiro et al., 2006), Ryr2 (Abu-Omar et al., 2017), Chrna5 (Proulx et al., 2014)]; synaptic function [Grin3a (Glun3a; Perez-Otano et al., 2016)]; plasticity (Arc; Tomas Pereira et al., 2015, Cnp; Barmashenko et al., 2014); learning and memory [Arc; Morin et al., 2015; Tomas Pereira et al., 2015), Grin2d, (Glun2d; Jacobs et al., 2014)], and cognition (Ryr2; Liu et al., 2012, Arc; Morin et al., 2015, Sorl1; Li et al., 2017), among others.
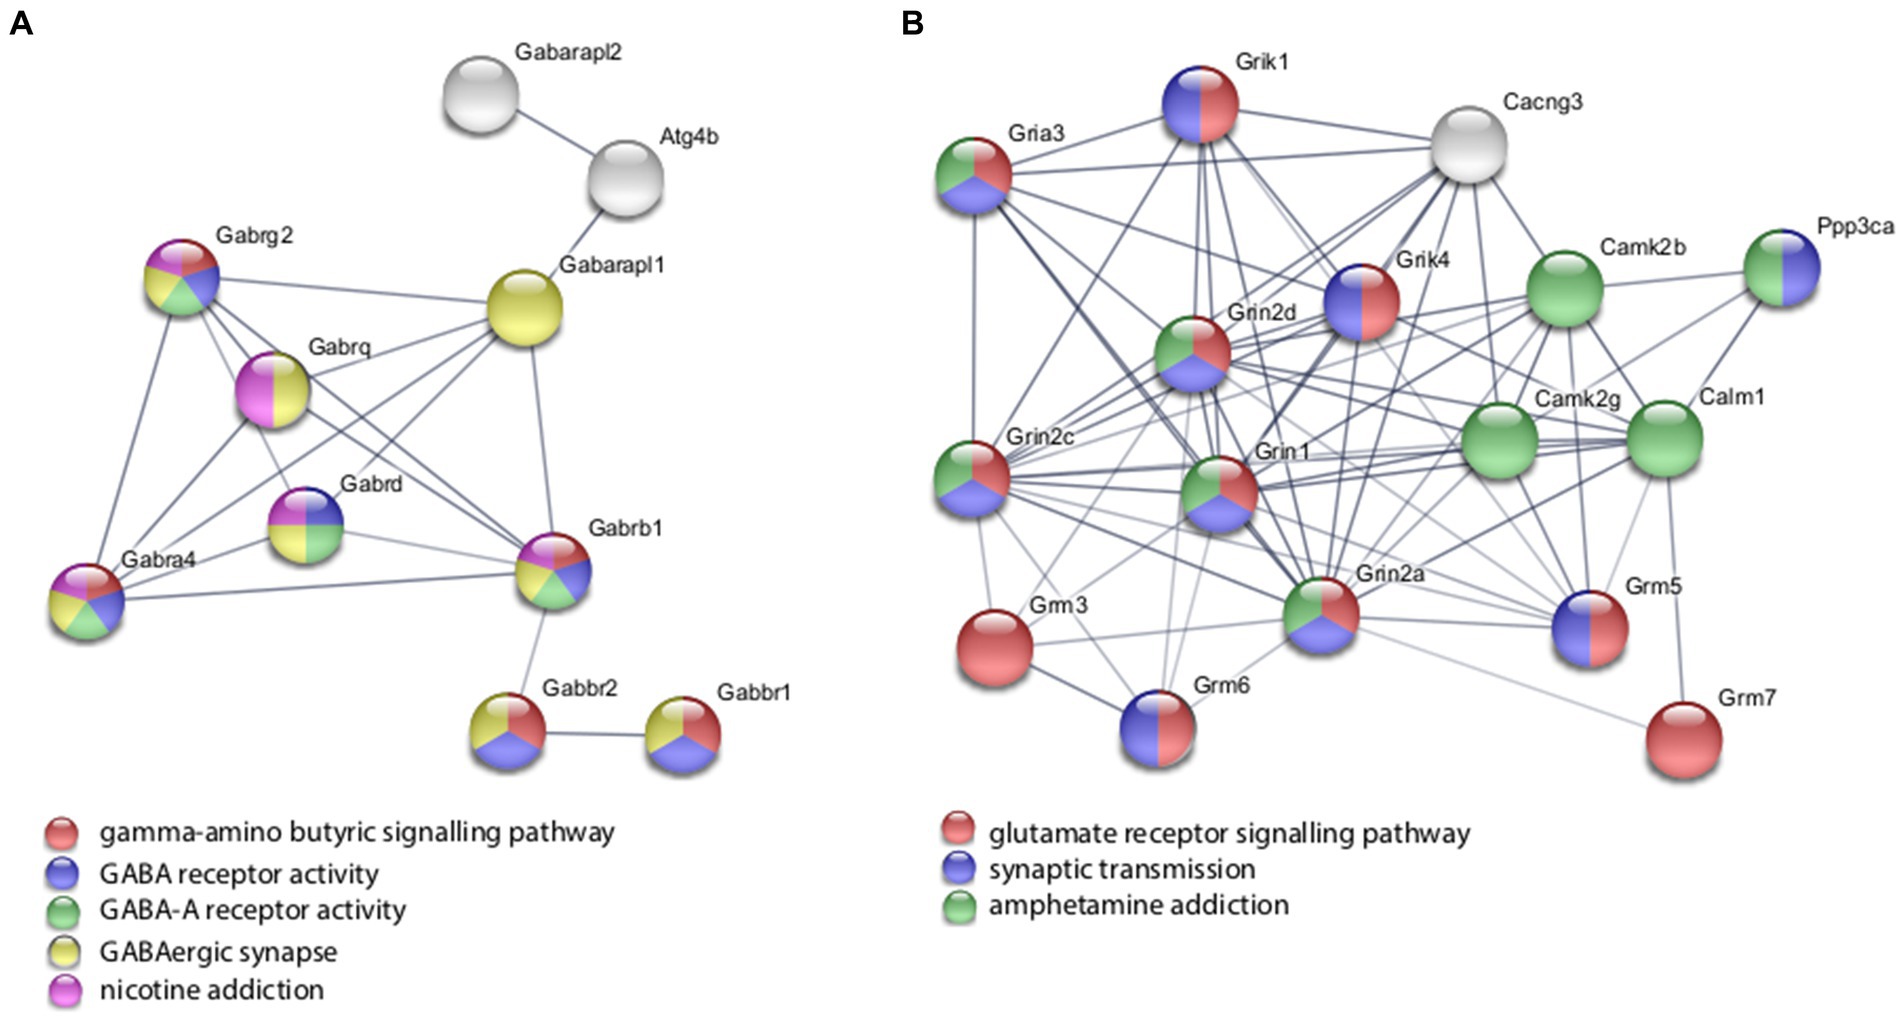
Figure 3. Selected protein–protein interaction network analysis from rTMS altered differential gene expression in the in vitro model. Networks built from shared genes involved in inhibitory and excitatory neuronal functions, including multiple (A) GABA and (B) glutamate receptors. Expression changes for individual genes were considered significant if they met four criteria: z-ratio > 1.5 or below −1.5; false detection rate < 0.30; a p-value statistic for z-score replicability <0.05; and mean background-corrected signal intensity > than zero. Functional or biological grouping is denoted by colors. Network nodes represent proteins and edges represent protein–protein relationships.
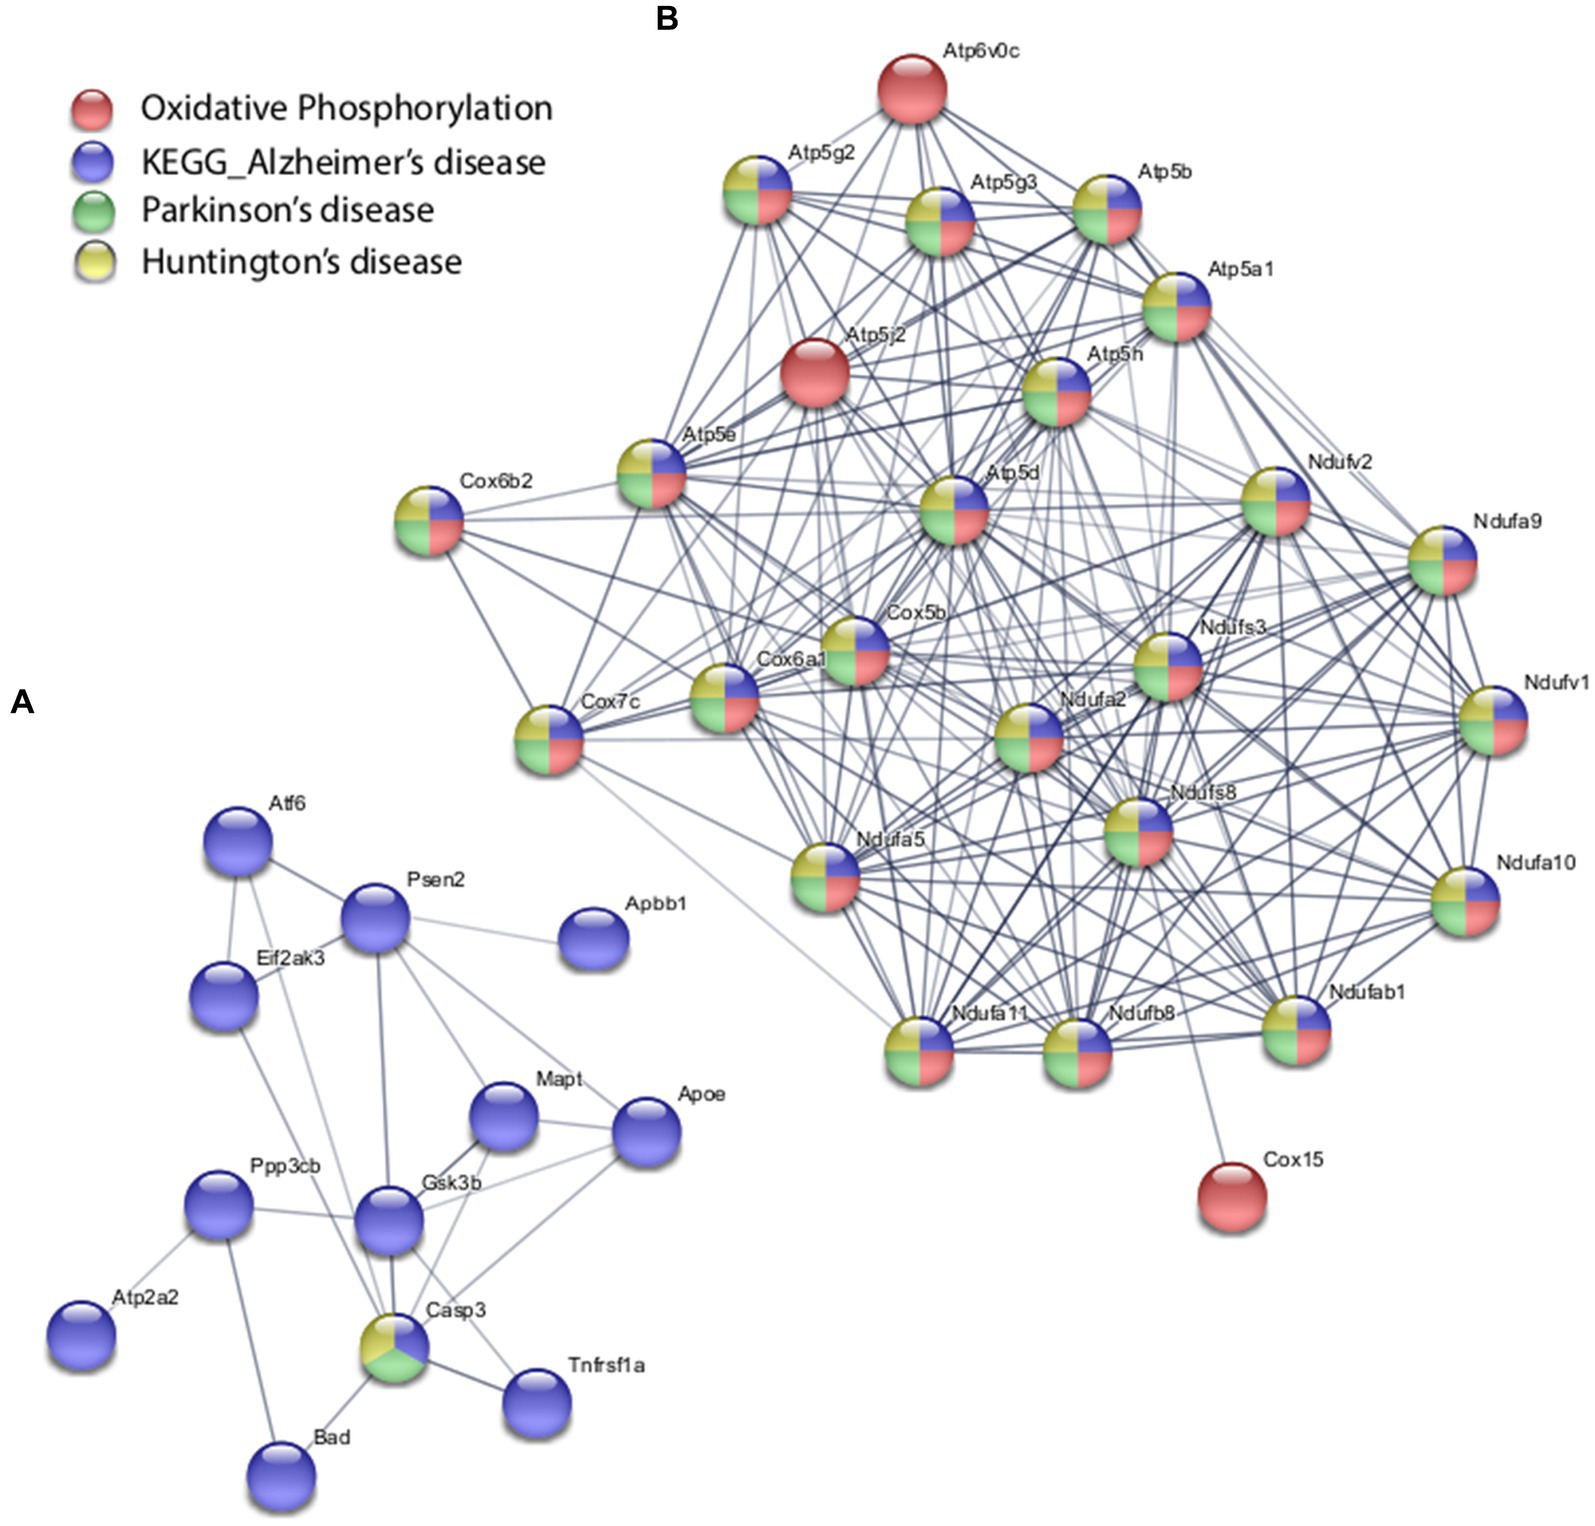
Figure 4. Selected protein–protein interaction network analysis from rTMS altered differential gene expression in the in vitro model. Networks built from shared genes involved in glutamate signaling and neurotransmission. (A) Transcriptional alteration of genes involved in Alzheimer’s disease. (B) Transcriptional response was altered in oxidative phosphorylation pathways including shared genes involved in Huntington’s, Alzheimer’s, and Parkinson’s disease. Expression changes for individual genes were considered significant if they met four criteria: z-ratio > 1.5 or below −1.5; false detection rate < 0.30; a p-value statistic for z-score replicability <0.05; and mean background-corrected signal intensity > than zero. Functional grouping is denoted by colors. Network nodes represent proteins and edges represent protein–protein relationships.
Coordinate transcriptional upregulation occurred in a cohort of myelin regulatory genes at 2 h post-rTMS stimulation in the ex vivo model (Table 3). These include increases in Mobp, Mog, Cnp, Erbb3 Klk6, Cadm4, and transferrin (Tf). However, the myelin regulatory factor Sox10 was downregulated in the iTBS-stimulated ex vivo samples. Myelin-related transcriptional induction was not statistically significant at 48 h for in vivo or at 2 h for in vitro cultures. Moreover, gene expression from nine Claudin family members was both increased and decreased in the ex vivo model (Table 3). Claudins mediate cell–cell contact and blood–brain barrier integrity. A shared protein domain network showing interrelationships between the TMS transcriptionally altered Claudins is shown in Figure 5.
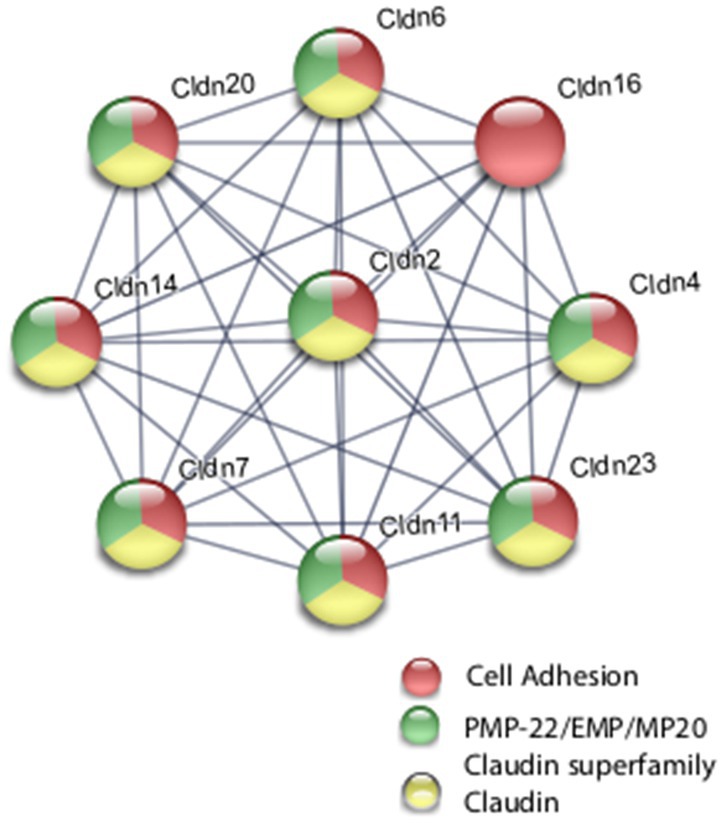
Figure 5. Selected protein–protein interaction network analysis from rTMS altered differential gene expression in the ex vivo model. Network built from shared genes involved in Claudin family members. Expression changes for individual genes were considered significant if they met four criteria: z-ratio > 1.5 or below −1.5; false detection rate < 0.30; a p-value statistic for z-score replicability <0.05; and mean background-corrected signal intensity > than zero. Functional grouping is denoted by colors. Network nodes represent proteins and edges represent protein–protein relationships.
rTMS results in a broad-based anti-inflammatory transcriptional response
rTMS produced a substantial reduction in transcripts involved in immune and inflammatory processes in the ex vivo and in vivo samples. Most striking was the coordinate downregulation of many members of the classical complement pathway in the ex vivo rTMS model with both 1 Hz and iTBS (Table 3) stimulation after 2 h. In addition, the expression of complement factors C1s and C2 was reduced in the in vivo model in the young hippocampus at 48 h (Table 4). In contrast, C1qb, C1qc, C2, C3, C4a, and C4b were increased in the AI hippocampus using iTBS in the ex vivo model (Table 3). Although generally thought of as mediators of innate immunity, members of the complement cascade have also been shown to be important in synaptic remodeling (Presumey et al., 2017), and have been associated with schizophrenia (Nimgaonkar et al., 2017), age-related macular degeneration (Lu et al., 2018), and Alzheimer’s disease (Torvell et al., 2021).
Additional inflammatory genes that were transcriptionally repressed by rTMS included Il1b, Il1rn, Cd74, and Il12b in the ex vivo model following iTBS (Table 3), and Tlr3, Cd74, and RT1-Da in the in vivo model (Table 4). Moreover, the gene for S100b, a marker of neuroinflammation and neuronal damage, was markedly downregulated by rTMS in all in vivo samples (Table 4). Importantly, immune regulatory molecules as a group were not significantly altered by rTMS in the in vitro model using purified neuronal cultures suggesting that modulation of immune transcripts in both ex vivo and in vivo models (both complex tissue intact samples) were from non-neuronal cells including resident glial cell populations.
rTMS affects the transcription of genes implicated in disorders for which it is used clinically
Notably, expression was altered among multiple genes that have been studied in disorders for which rTMS is used clinically, including depression [Slc6a4 (Lam et al., 2018), S100b (Schroeter et al., 2014), Il18 (Prossin et al., 2011; Bufalino et al., 2013; Kim et al., 2017), Il1b (Bufalino et al., 2013), Htr2c (Brummett et al., 2014), Gabra6 (Inoue et al., 2015)], epilepsy [Grin2d (GluN2D; Li D. et al., 2016), Gabra6 (Prasad et al., 2014), Scn1b (Ramadan et al., 2017), Scn3a (Lamar et al., 2017), Kcnt1 (Evely et al., 2017)], schizophrenia [Rgs4 (Schwarz, 2017), Grin1 (Zhao et al., 2006), Grm5 (Matosin et al., 2017), Pde10a (Boden et al., 2017), C4a (Nimgaonkar et al., 2017)], bipolar disorder [Pde10a (McDonald et al., 2012); S100b (da Rosa et al., 2016)], Parkinson’s disease [Nr4a2 (Liu et al., 2017)], Alzheimer’s disease and other dementias [Ptk2b (Li Y. Q. et al., 2016), Ttr (Silva et al., 2017), Nr4a2 (Montarolo et al., 2016), Ryr2 (Briggs et al., 2017), Mobp (Irwin et al., 2014), Cd40 (Giunta et al., 2010), Grn (Sudre et al., 2017), Hmo1 (Sung et al., 2016), Arc (Bi et al., 2017)], stroke [Lgals3 (Gal3; He et al., 2017), Ace (Wei et al., 2017), Cd40 (Huang et al., 2017), Cxcl12 (Shen et al., 2017), Hmgb1 (Choi et al., 2017)], as well as substance abuse [Slc6a4 (Bauer et al., 2015), Penk (Moeller et al., 2015), Rgs4 (Ho et al., 2010), Chrna5 (Lassi et al., 2016; Olfson et al., 2016)]. Overlap between the complex functional processes, disorders, and genes mentioned here highlights a central role of shared fundamental neuronal pathways in multiple processes and distinct neurological disorders (Brainstorm et al., 2018; Gandal et al., 2018).
Moreover, TMS altered the expression of genes studied in other disorders, suggesting additional potential clinical applications of TMS. These include hereditary motor neuropathy [Slc5a7 (Barwick et al., 2012)], congenital myasthenic syndrome (Slc5a7; Bauche et al., 2016), age-related hearing loss (Gabra6; Sun et al., 2014), Canavan disease (Gabra6; Surendran et al., 2003), gout (Abcg2; Yu et al., 2017), pancreatitis (Cldn2; Giri et al., 2016), as well as numerous genes involved in inflammatory and immune disorders. Additionally, TMS alters the transcription of many genes of unknown function. These can be found in Supplementary Table 1.
Gene set analysis of rTMS transcriptional changes
Gene set analysis is based on gene expression changes in functionally related groups of genes, as opposed to individual genes, resulting in statistically significant aggregate scores for each gene group. Figure 6 displays a marked reduction in Gene Ontology (GO) inflammatory gene sets in the ex vivo young hippocampus using 1 Hz stimulation versus the unstimulated sham. These include reductions in Innate Immune Response, Complement pathways, as well as Chemokine and Cytokine GO gene sets. Broad-based immune suppression was found in the ex vivo young hippocampus model using iTBS versus sham as well, including gene sets for Inflammatory Response, Chemotaxis, Antigen Processing and Presentation, Immunoglobulin Mediated Immune Response, among others (Figure 7). In addition to marked immune suppression, upregulated GO gene sets in the iTBS ex vivo model included a theme of mitochondrial and energy-related GO gene groups. Immune suppression is evident in the in vivo model in the cortex after iTBS stimulation: GO gene sets such as Immune Response, Complement Activation, and Chemokine activity, among others, were downregulated, and upregulated gene sets included Synaptic Vesicle, Synaptic Transmission, and Neurite Development (Figure 8). In the in vivo model in the hippocampus, a theme of translation and ribosomal-related gene sets were upregulated after iTBS (Figure 9). For the in vivo iTBS model, alterations in GAD sets for inflammatory disorders such as Scleroderma, Crohn’s disease, and Lupus, were found in both cortex and hippocampus, as well as disorders specifically relevant to TMS treatment including mood disorders, seasonal affective disorders, attention-deficit/hyperactivity disorder, schizophrenia, substance use related disorders, among others (Supplementary Figures 2–5).
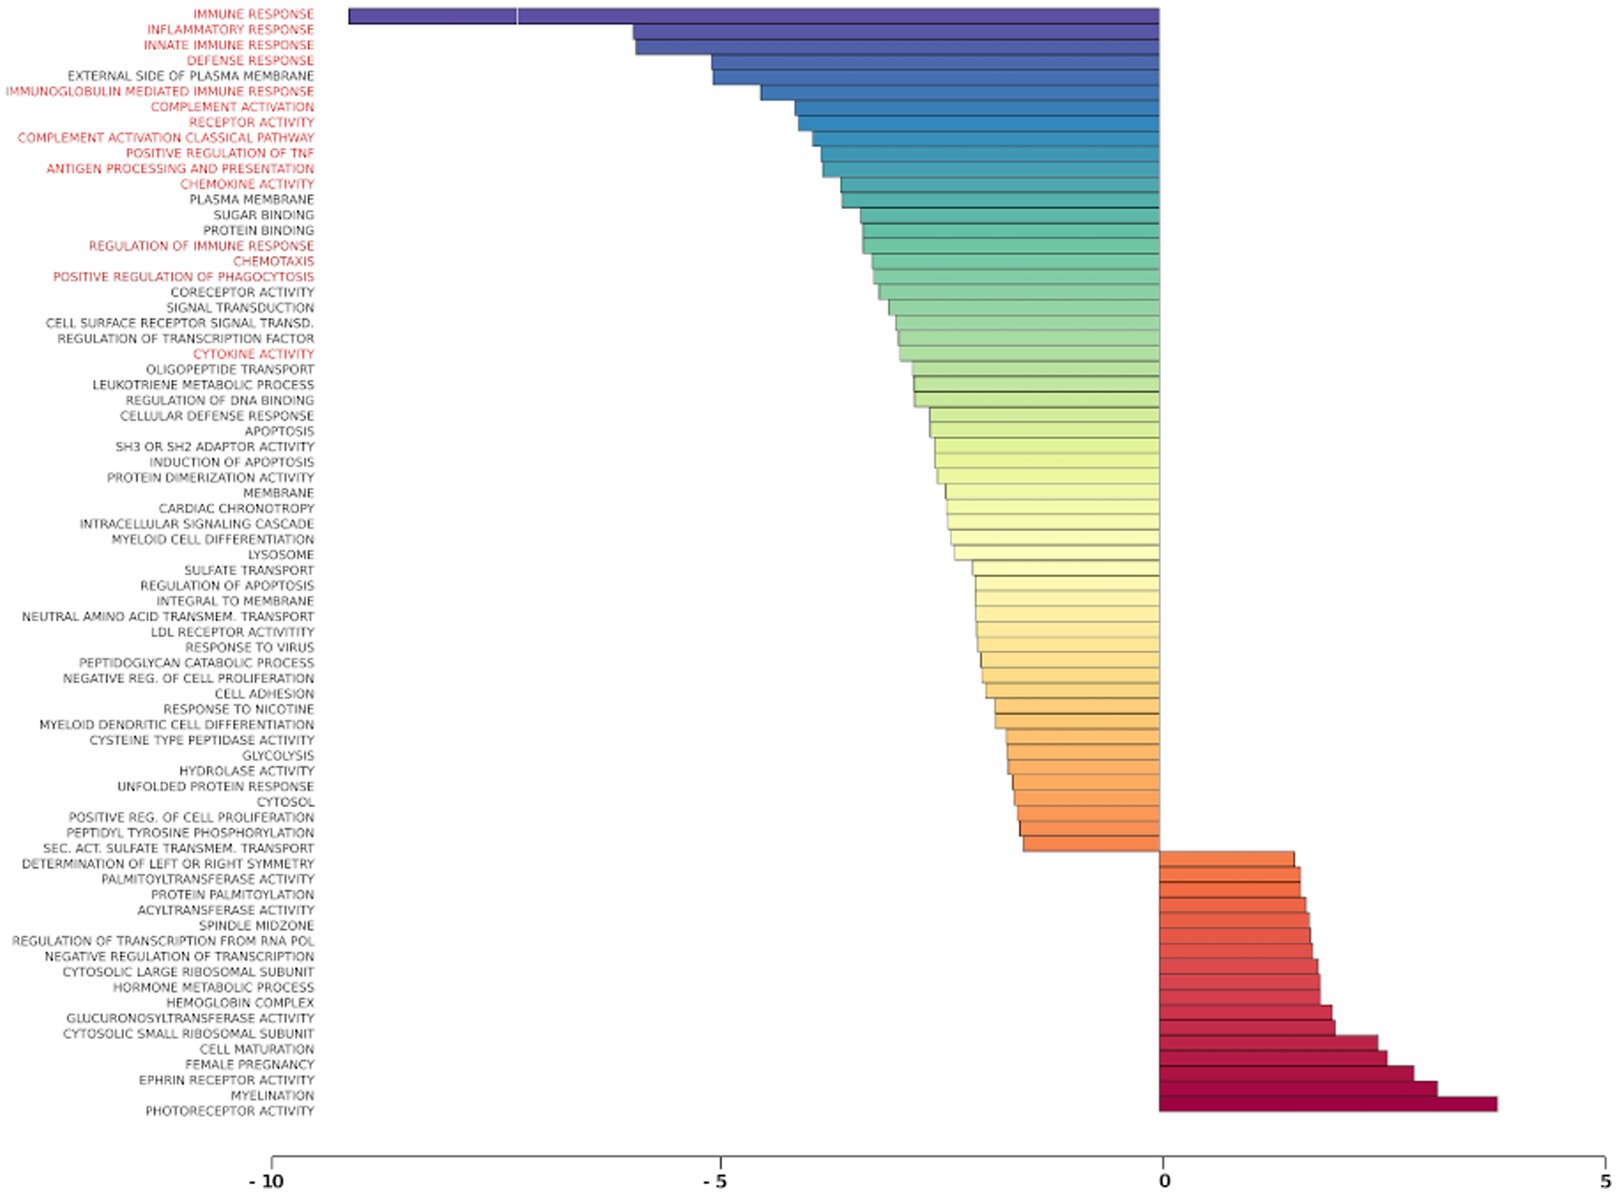
Figure 6. Gene ontology gene set analysis in the ex vivo model, 1 Hz stimulation protocol, young. Red text highlights gene groups involved in inflammation and immune response following 1 Hz stimulation of hippocampal slices from young rats compared to sham treatment. Significantly changed gene sets, associated with biological processes, are organized by z-score.
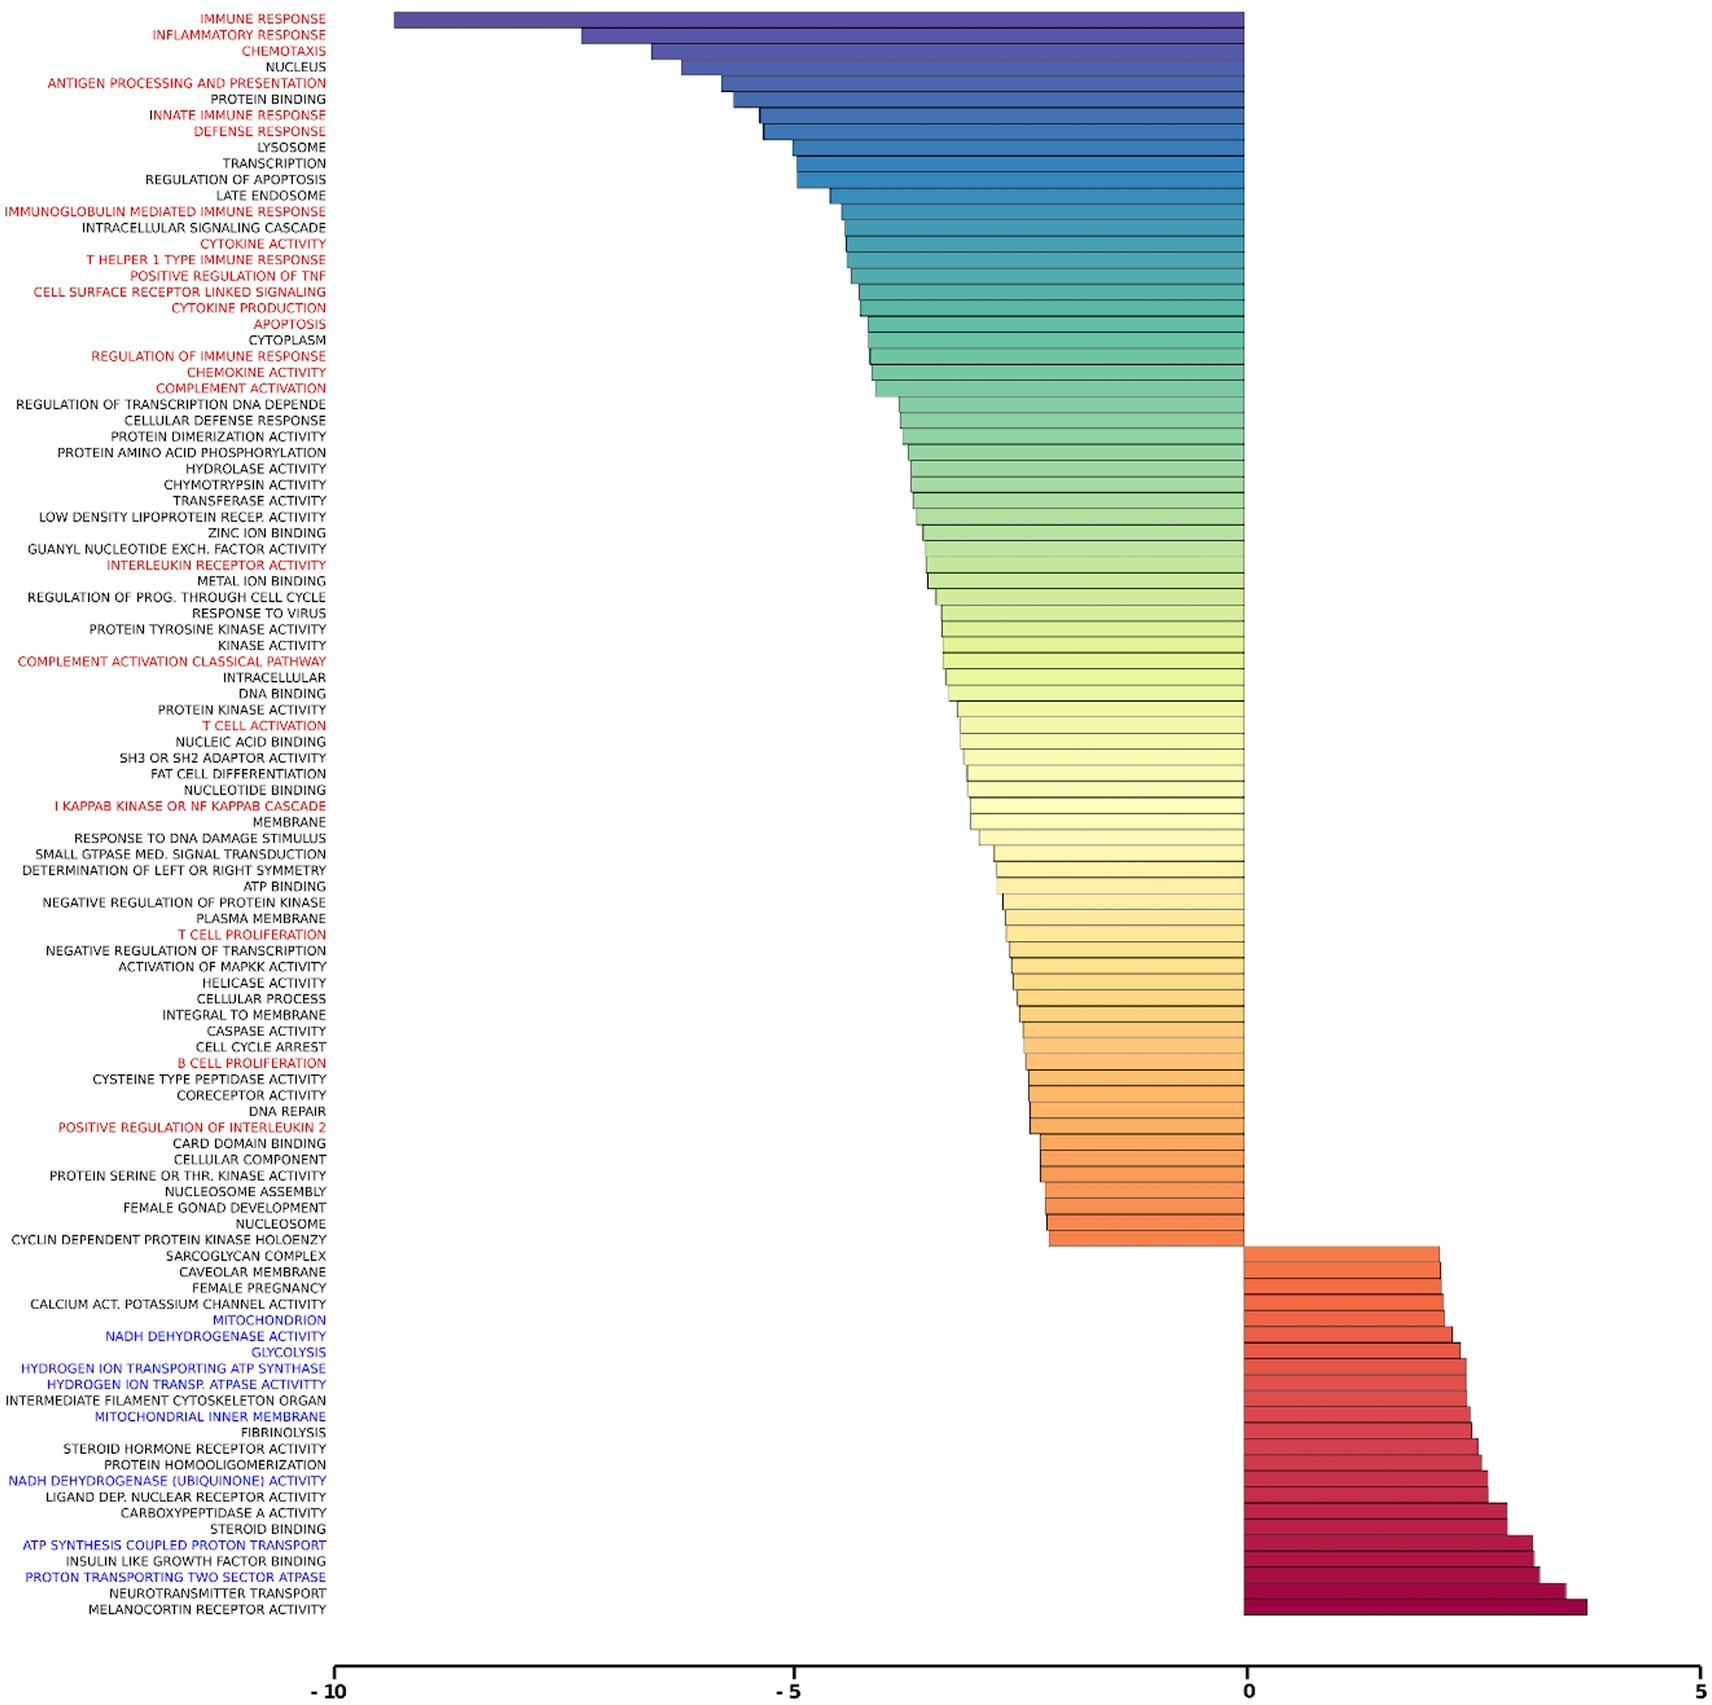
Figure 7. Gene ontology gene set analysis in the ex vivo model, iTBS protocol, young. Text highlighted in red indicates gene groups involved in inflammation and immune response, and blue text signifies gene groups involved in mitochondrial/energy processes following iTBS in hippocampal slices from young rats compared to sham treatment. Significantly changed gene sets, associated with biological processes, are organized by z-score.
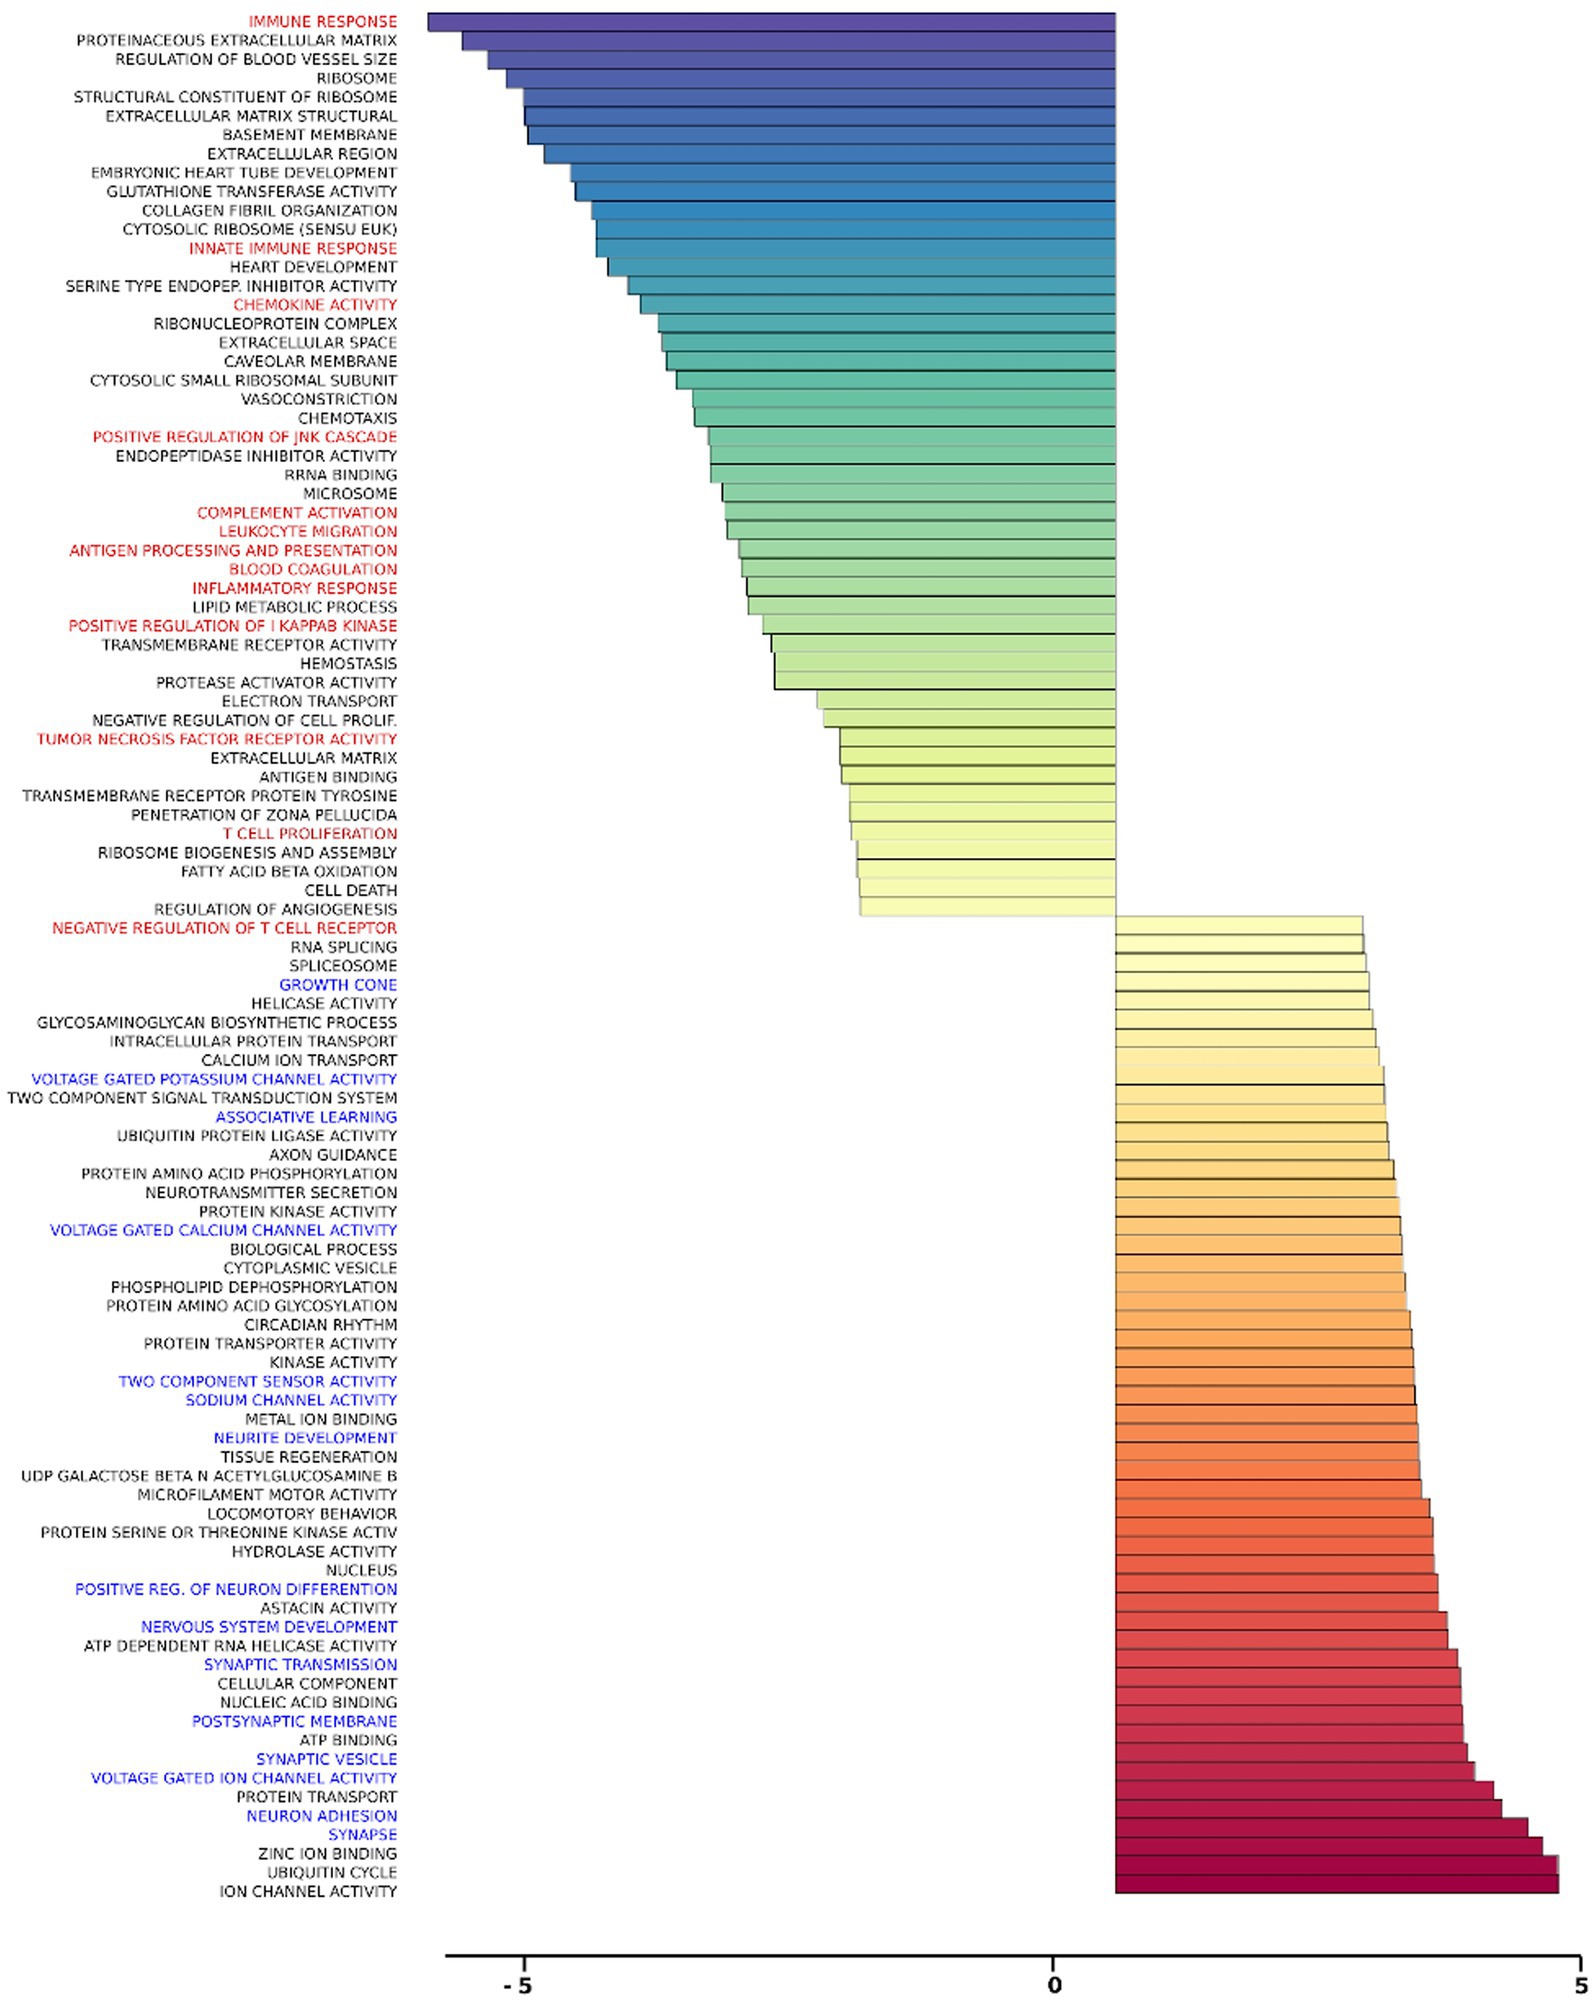
Figure 8. Gene ontology gene set analysis in the in vivo model, cortex, young. Highlighted in red text are gene groups involved in inflammation and immune response, and blue text highlights gene groups involved in synaptic growth and synaptic transmission in young rat cortical samples following iTBS compared to sham treatment. Significantly changed gene sets, associated with biological processes, are organized by z-score.
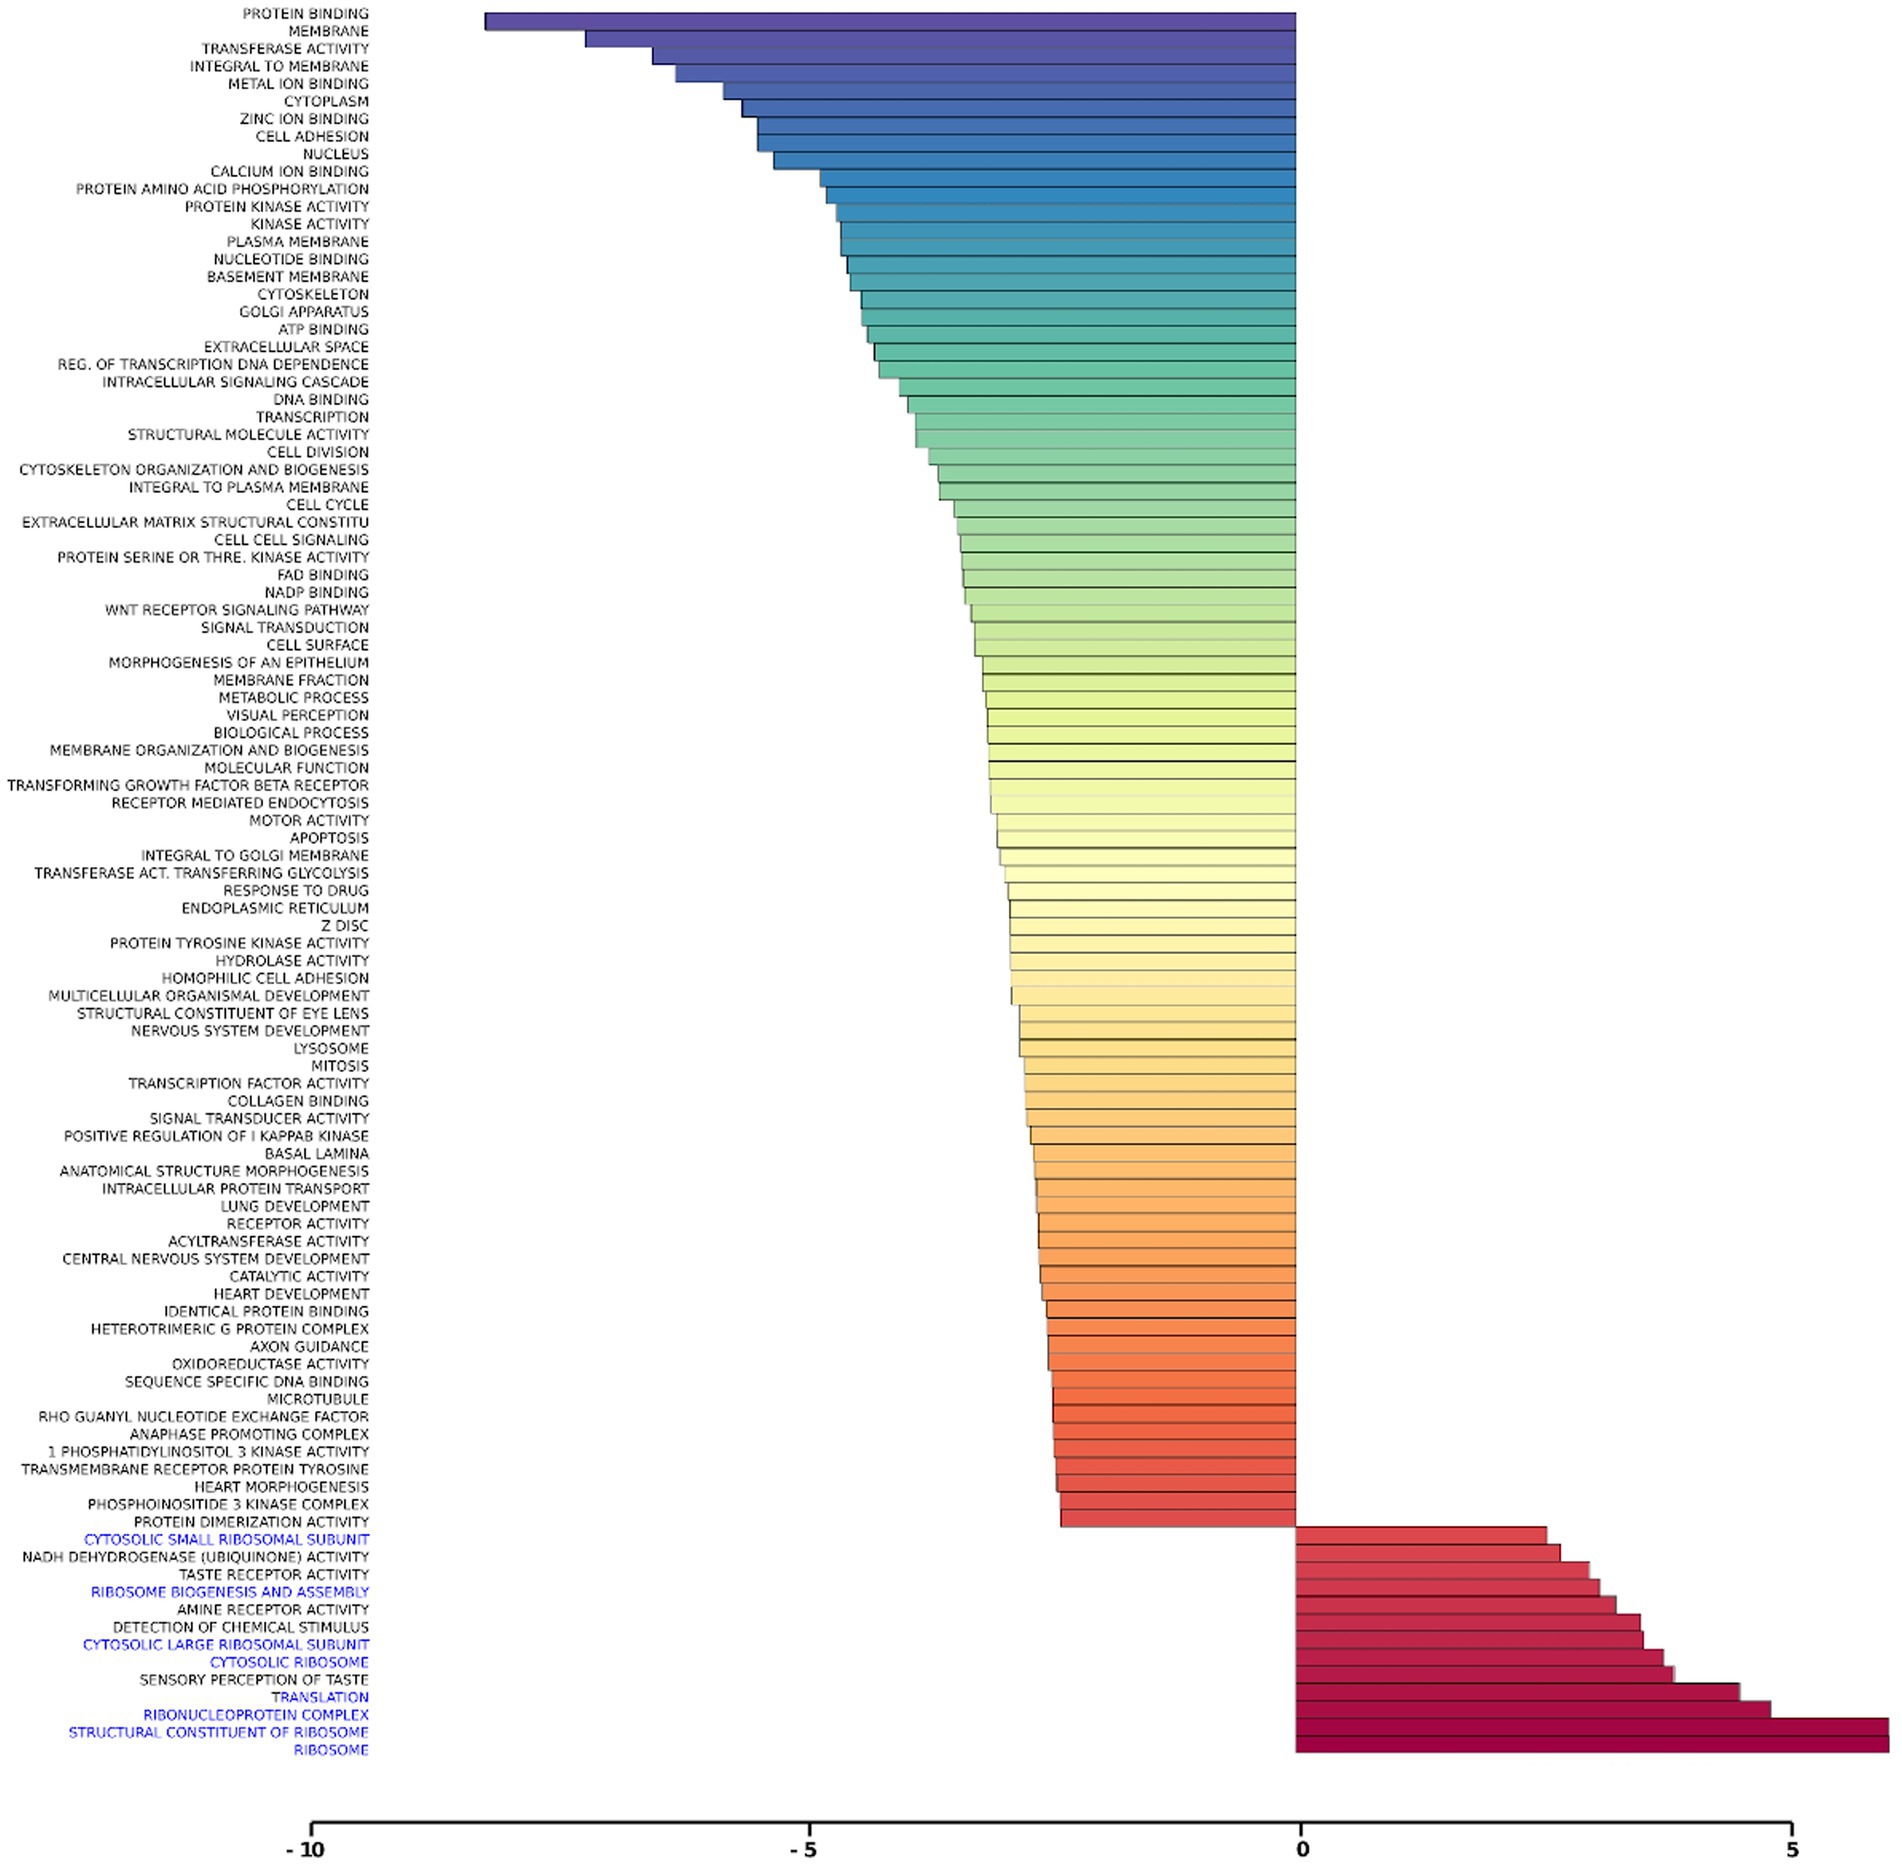
Figure 9. Gene ontology gene set analysis in the in vivo model, hippocampus, young. Highlighted in blue are gene groups involved in ribosomal function of young hippocampus samples following iTBS compared to sham treatment. Significantly changed gene sets, associated with biological processes, are organized by z-score.
Discussion
The last decade has witnessed a significant increase in pre-clinical and clinical research on rTMS as a therapeutic tool to treat several neuropsychiatric conditions. However, the molecular basis of rTMS effects remains largely unexplored. Here, using three experimental rat models, we show that the transcriptional response to rTMS treatment is complex and dynamic. Widespread transcriptional responses were apparent in the neuronal in vitro culture model, in the ex vivo hippocampal slice model, and in different brain regions in the in vivo model. Our results have implications for both research and clinical settings focused on the use of rTMS as a treatment for neurological conditions.
Alterations in glutamatergic and GABAergic signaling pathways following rTMS are specifically relevant to neuropsychiatric disorders
Using rat hippocampal neuronal cultures, we observed that rTMS regulated the expression of genes involved in inhibitory and excitatory neurotransmission mediated in part by glutamatergic and GABAergic synapses. The evidence supporting this argument can be found in Table 2 and Figures 3A,B. In Table 2, we present results highlighting the specific genes that exhibit alterations following rTMS. These findings demonstrate that rTMS had a notable impact on the expression of various glutamatergic and GABAergic genes. In addition, Figures 3A,B depict the changes in gene expression induced by rTMS. These figures illustrate the specific genes in the glutamatergic and GABAergic pathways that are significantly modulated by rTMS. The observed alterations support the suggestion that rTMS is positioned to potently influence inhibitory and excitatory neurotransmission.
Alterations in the glutamatergic system can promote excitotoxic cell death, comprising a potential mechanism of neurodegeneration in Alzheimer’s disease (Mufson et al., 2008; Wang and Reddy, 2017). Early aberrant excitatory neurotransmission is frequently observed in both animal models of Alzheimer’s disease (Palop et al., 2007) and patients (Scott et al., 2002), and blocking the action of glutamate and targeting excitatory synapses has been exploited as a potential pharmacological treatment for the disease. Altered oscillatory rhythmic activity and network hypersynchrony are also features of Alzheimer’s disease (Koch et al., 2022) and may contribute to cognitive impairment (Busche and Konnerth, 1700; Palop and Mucke, 2016). However, while a major emphasis in prior research has focused on dysfunction of the glutamatergic system, accumulating evidence links inhibitory GABAergic interneurons to excitatory/inhibitory imbalance as a potential early contributor to cognitive impairment in both aging (Oh et al., 2010; Gallagher et al., 2019) and disease (Li Y. et al., 2016; Govindpani et al., 2017).
Disruption in excitatory/inhibitory balance has also been associated with other neuropsychiatric and neurological conditions such as chronic stress (Varga et al., 2017), major depression disorder (Pehrson and Sanchez, 2015; Fee et al., 2017; Fogaca and Duman, 2019), autism spectrum disorder (Schur et al., 2016), bipolar disorder (Bialer, 2012), epilepsy (Ye and Kaszuba, 2017; Losi et al., 2019) and schizophrenia (Metzner et al., 2019), and normalizing altered inhibitory function represents a promising target for therapeutic intervention. rTMS has been identified as a modifier of GABAergic (Trippe et al., 2009; Jazmati et al., 2018) and glutamatergic (Yang et al., 2014) systems previously and preventing or reversing disease-related imbalance by targeting either system with rTMS could be of both symptomatic and disease-modifying value.
Transcriptional changes related to immunosuppression are relevant to inflammatory effects in depression and Alzheimer’s disease
A major insight from our analysis is the broad transcriptional change related to immunosuppression, observed as early as 2 h after stimulation in hippocampal slices. Neuroinflammation has emerged as a key feature in the pathogenesis of Alzheimer’s disease, potentially playing a causative role rather than simply as a secondary consequence of the pathological cascade (Sheng et al., 2003). Given the failure of amyloidogenic drugs to provide therapeutic benefit, scientific interest has shifted to other features of neurodegeneration including neuroinflammation (Castello et al., 2014). Similarly, major depressive disorder has been associated with increased activation of the immune system (Lee and Giuliani, 2019), and many front-line pharmaceutical treatments for depression have been shown to reduce inflammatory activation and lower circulating cytokine levels (Galecki et al., 2018).
rTMS has proven effective in animal models as a therapeutic tool targeting the inflammatory response (Sasso et al., 2016). Our results are consistent with a potential anti-inflammatory benefit, demonstrating that stimulation-induced downregulation of genes related to immunosuppression in young hippocampal slices 48 h following treatment. Strikingly, however, while decreased neuroinflammatory gene transcription was the predominant effect in young, rTMS had the opposite effect in hippocampal slices from aged animals with cognitive impairment (AI), inducing a potential proinflammatory transcriptional response. Given that aging itself is associated with chronic increases in circulating levels of inflammatory markers (Singh and Newman, 2011) – a phenomenon exacerbated by age-associated diseases (Chung et al., 2009) – our results suggest that rTMS might exacerbate age-related pathological immune activity. Thus, rTMS treatments with demonstrated anti-inflammatory benefits in young adults may have unanticipated effects in older recipients. Future studies focusing on the neuroinflammatory effects of rTMS specifically in the context of aging will be needed to move this technology forward in the clinical setting.
Although the mechanisms that mediate neuroinflammation are not fully understood, it is well-accepted that microglia play a key role (DiSabato et al., 2016; Dokalis and Prinz, 2019). In our study, the comparative analysis of purified hippocampal neuronal culture preparations versus the ex vivo or in vivo complex tissue samples, where glial cells are present, suggests that the observed influence on inflammatory response genes likely arises from the non-neuronal compartment. Taking advantage of the unique dataset generated in these experiments, future analyses directly comparing the transcriptional response to rTMS as a function of experimental preparation, temporal kinetics, age, and cognitive status will provide a rich source of insight into the complex molecular consequences underlying the phenotypic response to intervention.
Our ex vivo experiments provide an approach to systematically test rTMS-drug interactions
Although FDA-approved as a stand-alone treatment for non-responsive major depressive disorder, in clinical practice rTMS is typically used as a supplementary therapy, together with psychotropic medication. A therapeutic benefit of combined rTMS and adjunctive drug treatment for major depression has been confirmed previously (Wei et al., 2017), but evidence fully exploring the interaction between rTMS and anti-depressants is scarce. Psychotropic drugs affect cortical excitability and plasticity (Minzenberg and Leuchter, 2019) and medications commonly used to treat neurological conditions change neural circuit and network activation (Borchert et al., 2016; Zheng et al., 2017). The use of concomitant medication may impact rTMS treatment outcome favorably or unfavorably, depending on the drug category or mechanism of action (Hunter et al., 2019). For example, while still in their infancy, studies in pharmaco-TMS have shown that medications that block voltage-gated sodium channels increase the evoked motor threshold to TMS, i.e., a common metric used to normalize and titrate stimulation intensity across individuals (a readout for TMS dosage; Ziemann, 2004; Ziemann et al., 2015).
The idea that the effects of rTMS vary depending on the use of concurrent medication aligns with the ‘state-dependency’ concept of TMS (Silvanto and Pascual-Leone, 2008). Among the factors that might influence the outcomes of TMS, the pharmacological ‘state’ of the brain has received relatively limited attention, likely because patients treated with rTMS for neuropsychiatric conditions are typically receiving concurrent pharmacological treatment. In this context, our ex vivo experiments point to one potentially useful approach for research aimed at identifying drug-rTMS interactions. Overall, while recognizing that the barriers to successful translation are substantial, properly designed basic research can nonetheless inform therapeutic development toward safer and more effective TMS application in a variety of conditions.
The complex transcriptional profiles induced by rTMS in the context of age, tissue, and cognitive status are relevant to the clinical status of individual patients
It has been over a decade since the first rTMS application was approved by the FDA for the treatment of major depressive disorder, and since then the range of potential applications under investigation with rTMS has skyrocketed. The research on rTMS as a therapy includes patients with a variety of disorders and pathological signatures, from all ages and different cognitive statuses. Recent in vivo data points to the potential translational relevance of findings in animal models demonstrating effects on behavior and structural plasticity (Cambiaghi et al., 2022) and the potential implication for clinical application in neurodegenerative diseases (Weiler et al., 2020). In our results, we observed that rTMS induced unique gene expression profiles in each experiment, all of which reflected a variety of biological conditions and different stimulation parameters. In addition, the gene expression response following rTMS was highly complex. Whereas previous studies investigating the effects of rTMS have focused on alterations in only a handful of priori-selected genes (Lee et al., 2014; Wang et al., 2014; Grehl et al., 2015; Cirillo et al., 2017; Legrand et al., 2018; Cui et al., 2019; Wu et al., 2022), our large-scale analysis of gene expression detected several complex different pathways that are altered after stimulation.
Any non-invasive brain stimulation protocol intended to target a specific gene set or mechanism in the context of treating a given condition may have unexpected consequences in a different context, e.g., in other brain regions, or as a function of the cognitive status and age of the recipients. For example, clinical trials of rTMS (Turriziani et al., 2012) have reported that the same stimulation protocol that yields cognitive improvement in some subjects at risk for Alzheimer’s disease has detrimental effects in cognitively healthy individuals. Likewise, stimulation aiming at targeting a specific pathway or mechanism may induce changes in other genes and unintended downstream pathways. The findings reported here also highlight that the transcriptional response can be temporally dynamic, resulting in both increases and decreases in the same gene families across time, suggesting that a protocol chosen for its acute effects may lead to unpredictable long-term changes in expression.
Taken together, our results suggest that patterns of gene expression following rTMS are complex, dynamic, and dependent on the brain region, age, cognitive status, and potentially many other subject variables not examined here. Given the current and growing clinical application of rTMS, it is timely that greater attention turns to basic research aimed at understanding the underlying basis of reported therapeutic benefits, with the goal of optimizing treatment in the context of the individual patient.
The limitations of research on non-invasive brain stimulation in experimental animal models are significant. A primary limitation from a translational perspective is that, although we analyzed multiple stimulation protocols, we only studied the effects of one stimulation session, while clinical rTMS approaches employ treatments over the course of days or weeks. Further studies investigating the effects of rTMS on a long-term basis should be conducted. Another limitation is that although in some cases we used a diverse parametric setting such as different ages and cognitive states, our initial report is predominantly focused on the effects of rTMS itself. Here, each rTMS-stimulated sample group was statistically compared to its own unstimulated sham control, as opposed to comparisons across age and between cognitive groups. Detailed results of the transcriptional changes due to rTMS treatment in the context of age, cognition, and brain region will be presented elsewhere.
Data availability statement
The three data sets underlying this paper have been deposited to the NCBI Gene Expression Omnibus and are accessible through their individual GSE identifiers (in vitro: GSE230147, (ex vivo: GSE230148, and in vivo: GSE230149) and the GEO SuperSeries accession number GSE230150 (https://www.ncbi.nlm.nih.gov/geo/query/acc.cgi?acc=GSE230150).
Ethics statement
The animal study was approved by Animal Care and Use Committee of the Intramural Research Program of the NIA. The study was conducted in accordance with the local legislation and institutional requirements.
Author contributions
MW, KCS, EL, JML, KGB, and PRR: study conception and design. MW, KCS, EL, SC, JML, MPM, KGB, and PRR: data collection. MW, KCS, KS, JPK, WHW, YZ, PC, EL, JML, KGB, and PRR: analysis and interpretation of results. MW, EL, JML, KGB, and PRR: draft manuscript preparation. All authors contributed to the article and approved the submitted version.
Acknowledgments
This research was supported entirely by the Intramural Research Program of the NIH, National Institute on Aging. The authors thank members of the Neurocognitive Aging Section for expert technical assistance.
Conflict of interest
The authors declare that the research was conducted in the absence of any commercial or financial relationships that could be construed as a potential conflict of interest.
Publisher’s note
All claims expressed in this article are solely those of the authors and do not necessarily represent those of their affiliated organizations, or those of the publisher, the editors and the reviewers. Any product that may be evaluated in this article, or claim that may be made by its manufacturer, is not guaranteed or endorsed by the publisher.
Supplementary material
The Supplementary material for this article can be found online at: https://www.frontiersin.org/articles/10.3389/fnhum.2023.1215291/full#supplementary-material
References
Abu-Omar, N., Das, J., Szeto, V., and Feng, Z. P. (2017). Neuronal ryanodine receptors in development and aging. Mol. Neurobiol. 55, 1183–1192. doi: 10.1007/s12035-016-0375-4
Barmashenko, G., Buttgereit, J., Herring, N., Bader, M., Ozcelik, C., Manahan-Vaughan, D., et al. (2014). Regulation of hippocampal synaptic plasticity thresholds and changes in exploratory and learning behavior in dominant negative NPR-B mutant rats. Front. Mol. Neurosci. 7:95. doi: 10.3389/fnmol.2014.00095
Barwick, K. E., Wright, J., Al-Turki, S., McEntagart, M. M., Nair, A., Chioza, B., et al. (2012). Defective presynaptic choline transport underlies hereditary motor neuropathy. Am. J. Hum. Genet. 91, 1103–1107. doi: 10.1016/j.ajhg.2012.09.019
Bauche, S., O'Regan, S., Azuma, Y., Laffargue, F., McMacken, G., Sternberg, D., et al. (2016). Impaired presynaptic high-affinity choline transporter causes a congenital myasthenic syndrome with episodic apnea. Am. J. Hum. Genet. 99, 753–761. doi: 10.1016/j.ajhg.2016.06.033
Bauer, I. E., Graham, D. P., Soares, J. C., and Nielsen, D. A. (2015). Serotonergic gene variation in substance use pharmacotherapy: a systematic review. Pharmacogenomics 16, 1307–1314. doi: 10.2217/pgs.15.72
Benali, A., Trippe, J., Weiler, E., Mix, A., Petrasch-Parwez, E., Girzalsky, W., et al. (2011). Theta-burst transcranial magnetic stimulation alters cortical inhibition. J. Neurosci. 31, 1193–1203. doi: 10.1523/JNEUROSCI.1379-10.2011
Bi, R., Kong, L. L., Xu, M., Li, G. D., Zhang, D. F., Alzheimer's Disease Neuroimaging I, et al. (2017). The arc gene confers genetic susceptibility to Alzheimer's disease in Han Chinese. Mol. Neurobiol. 55, 1217–1226. doi: 10.1007/s12035-017-0397-6
Bialer, M. (2012). Why are antiepileptic drugs used for nonepileptic conditions? Epilepsia 53, 26–33. doi: 10.1111/j.1528-1167.2012.03712.x
Boden, R., Persson, J., Wall, A., Lubberink, M., Ekselius, L., Larsson, E. M., et al. (2017). Striatal phosphodiesterase 10A and medial prefrontal cortical thickness in patients with schizophrenia: a PET and MRI study. Transl. Psychiatry 7:e 1050. doi: 10.1038/tp.2017.11
Borchert, R. J., Rittman, T., Passamonti, L., Ye, Z., Sami, S., Jones, S. P., et al. (2016). Atomoxetine enhances connectivity of prefrontal networks in Parkinson's Disease. Neuropsychopharmacology 41, 2171–2177. doi: 10.1038/npp.2016.18
Brainstorm, C., Anttila, V., Bulik-Sullivan, B., Finucane, H. K., Walters, R. K., Bras, J., et al. (2018). Analysis of shared heritability in common disorders of the brain. Science 360. doi: 10.1126/science.aap8757
Briggs, C. A., Chakroborty, S., and Stutzmann, G. E. (2017). Emerging pathways driving early synaptic pathology in Alzheimer's disease. Biochem. Biophys. Res. Commun. 483, 988–997. doi: 10.1016/j.bbrc.2016.09.088
Brummett, B. H., Babyak, M. A., Williams, R. B., Harris, K. M., Jiang, R., Kraus, W. E., et al. (2014). A putatively functional polymorphism in the HTR2C gene is associated with depressive symptoms in white females reporting significant life stress. PLoS One 9:e114451. doi: 10.1371/journal.pone.0114451
Brys, Z., Pluhar, A., Kis, J. T., Buda, B., and Szabo, A. (2013). Network analysis of neurotransmitter related human kinase genes: possible role of SRC, RAF1, PTK2B? Neuropsychopharmacol. Hung. 15, 165–171.
Bufalino, C., Hepgul, N., Aguglia, E., and Pariante, C. M. (2013). The role of immune genes in the association between depression and inflammation: a review of recent clinical studies. Brain Behav. Immun. 31, 31–47. doi: 10.1016/j.bbi.2012.04.009
Busche, M. A., and Konnerth, A. (1700). Impairments of neural circuit function in Alzheimer's disease. Philos. Trans. R. Soc. Lond. Ser. B Biol. Sci. 371:20150429. doi: 10.1098/rstb.2015.0429
Cambiaghi, M., Infortuna, C., Gualano, F., Elsamadisi, A., Malik, W., Buffelli, M., et al. (2022). High-frequency rTMS modulates emotional behaviors and structural plasticity in layers II/III and V of the mPFC. Front. Cell. Neurosci. 16:1082211. doi: 10.3389/fncel.2022.1082211
Castello, M. A., Jeppson, J. D., and Soriano, S. (2014). Moving beyond anti-amyloid therapy for the prevention and treatment of Alzheimer's disease. BMC Neurol. 14:169. doi: 10.1186/s12883-014-0169-0
Cavaleri, R., Schabrun, S. M., and Chipchase, L. S. (2017). The number of stimuli required to reliably assess corticomotor excitability and primary motor cortical representations using transcranial magnetic stimulation (TMS): a systematic review and meta-analysis. Syst. Rev. 6:48. doi: 10.1186/s13643-017-0440-8
Cheadle, C., Vawter, M. P., Freed, W. J., and Becker, K. G. (2003). Analysis of microarray data using Z score transformation. J. Mol. Diagn. 5, 73–81. doi: 10.1016/S1525-1578(10)60455-2
Chen, R., Spencer, D. C., Weston, J., and Nolan, S. J. (2016). Transcranial magnetic stimulation for the treatment of epilepsy. Cochrane Database Syst. Rev. 8:CD011025. doi: 10.1002/14651858.CD011025.pub2
Cheng, C. P. W., Wong, C. S. M., Lee, K. K., Chan, A. P. K., Yeung, J. W. F., and Chan, W. C. (2017). Effects of repetitive transcranial magnetic stimulation on improvement of cognition in elderly patients with cognitive impairment: a systematic review and meta-analysis. Int. J. Geriatr. Psychiatry 33. doi: 10.1002/gps.4726
Choi, J. Y., Cui, Y., Chowdhury, S. T., and Kim, B. G. (2017). High-mobility group box-1 as an autocrine trophic factor in white matter stroke. Proc. Natl. Acad. Sci. U. S. A. 114, E4987–E4995. doi: 10.1073/pnas.1702035114
Christiansen, B., Meinild, A. K., Jensen, A. A., and Brauner-Osborne, H. (2007). Cloning and characterization of a functional human gamma-aminobutyric acid (GABA) transporter, human GAT-2. J. Biol. Chem. 282, 19331–19341. doi: 10.1074/jbc.M702111200
Chung, H. Y., Cesari, M., Anton, S., Marzetti, E., Giovannini, S., Seo, A. Y., et al. (2009). Molecular inflammation: underpinnings of aging and age-related diseases. Ageing Res. Rev. 8, 18–30. doi: 10.1016/j.arr.2008.07.002
Chung, C. L., and Mak, M. K. (2016). Effect of repetitive transcranial magnetic stimulation on physical function and motor signs in Parkinson's Disease: a systematic review and Meta-analysis. Brain Stimul. 9, 475–487. doi: 10.1016/j.brs.2016.03.017
Cirillo, G., Di Pino, G., Capone, F., Ranieri, F., Florio, L., Todisco, V., et al. (2017). Neurobiological after-effects of non-invasive brain stimulation. Brain Stimul. 10, 1–18. doi: 10.1016/j.brs.2016.11.009
Cui, M., Ge, H., Zeng, H., Yan, H., Zhang, L., Feng, H., et al. (2019). Repetitive transcranial magnetic stimulation promotes neural stem cell proliferation and differentiation after intracerebral hemorrhage in mice. Cell Transplant. 28, 568–584. doi: 10.1177/0963689719834870
da Rosa, M. I., Simon, C., Grande, A. J., Barichello, T., Oses, J. P., and Quevedo, J. (2016). Serum S100B in manic bipolar disorder patients: systematic review and meta-analysis. J. Affect. Disord. 206, 210–215. doi: 10.1016/j.jad.2016.07.030
De, S., Zhang, Y., Garner, J. R., Wang, S. A., and Becker, K. G. (2010). Disease and phenotype gene set analysis of disease-based gene expression in mouse and human. Physiol. Genomics 42A, 162–167. doi: 10.1152/physiolgenomics.00008.2010
DiSabato, D. J., Quan, N., and Godbout, J. P. (2016). Neuroinflammation: the devil is in the details. J. Neurochem. 139, 136–153. doi: 10.1111/jnc.13607
Dokalis, N., and Prinz, M. (2019). Resolution of neuroinflammation: mechanisms and potential therapeutic option. Semin. Immunopathol. 41, 699–709. doi: 10.1007/s00281-019-00764-1
Evely, K. M., Pryce, K. D., and Bhattacharjee, A. (2017). The Phe 932Ile mutation in KCNT1 channels associated with severe epilepsy, delayed myelination and leukoencephalopathy produces a loss-of-function channel phenotype. Neuroscience 351, 65–70. doi: 10.1016/j.neuroscience.2017.03.035
Fee, C., Banasr, M., and Sibille, E. (2017). Somatostatin-positive gamma-aminobutyric acid interneuron deficits in depression: cortical microcircuit and therapeutic perspectives. Biol. Psychiatry 82, 549–559. doi: 10.1016/j.biopsych.2017.05.024
Ferreri, F., and Rossini, P. M. (2013). TMS and TMS-EEG techniques in the study of the excitability, connectivity, and plasticity of the human motor cortex. Rev. Neurosci. 24, 431–442. doi: 10.1515/revneuro-2013-0019
Fogaca, M. V., and Duman, R. S. (2019). Cortical GABAergic dysfunction in stress and depression: new insights for therapeutic interventions. Front. Cell. Neurosci. 13:87. doi: 10.3389/fncel.2019.00087
Galecki, P., Mossakowska-Wojcik, J., and Talarowska, M. (2018). The anti-inflammatory mechanism of antidepressants - SSRIs, SNRIs. Prog. Neuro-Psychopharmacol. Biol. Psychiatry 80, 291–294. doi: 10.1016/j.pnpbp.2017.03.016
Gallagher, M., Burwell, R., and Burchinal, M. (1993). Severity of spatial learning impairment in aging: development of a learning index for performance in the Morris water maze. Behav. Neurosci. 107, 618–626. doi: 10.1037/0735-7044.107.4.618
Gallagher, M., Burwell, R., and Burchinal, M. (2015). Severity of spatial learning impairment in aging: development of a learning index for performance in the Morris water maze. Behav. Neurosci. 129, 540–548. doi: 10.1037/bne0000080
Gallagher, M., Okonkwo, O. C., Resnick, S. M., Jagust, W. J., Benzinger, T. L. S., and Rapp, P. R. (2019). What are the threats to successful brain and cognitive aging? Neurobiol. Aging 83, 130–134. doi: 10.1016/j.neurobiolaging.2019.04.016
Gallagher, M., and Rapp, P. R. (1997). The use of animal models to study the effects of aging on cognition. Annu. Rev. Psychol. 48, 339–370. doi: 10.1146/annurev.psych.48.1.339
Gandal, M. J., Haney, J. R., Parikshak, N. N., Leppa, V., Ramaswami, G., Hartl, C., et al. (2018). Shared molecular neuropathology across major psychiatric disorders parallels polygenic overlap. Science 359, 693–697. doi: 10.1126/science.aad6469
Giri, A. K., Midha, S., Banerjee, P., Agrawal, A., Mehdi, S. J., Dhingra, R., et al. (2016). Common variants in CLDN2 and MORC4 genes confer Disease susceptibility in patients with chronic pancreatitis. PLoS One 11:e0147345. doi: 10.1371/journal.pone.0147345
Giunta, B., Rezai-Zadeh, K., and Tan, J. (2010). Impact of the CD40-CD40L dyad in Alzheimer's disease. CNS Neurol. Disord. Drug Targets 9, 149–155. doi: 10.2174/187152710791012099
Govindpani, K., Calvo-Flores Guzman, B., Vinnakota, C., Waldvogel, H. J., Faull, R. L., and Kwakowsky, A. (2017). Towards a better understanding of GABAergic remodeling in Alzheimer's Disease. Int. J. Mol. Sci. 18:1813. doi: 10.3390/ijms18081813
Grehl, S., Viola, H. M., Fuller-Carter, P. I., Carter, K. W., Dunlop, S. A., Hool, L. C., et al. (2015). Cellular and molecular changes to cortical neurons following low intensity repetitive magnetic stimulation at different frequencies. Brain Stimul. 8, 114–123. doi: 10.1016/j.brs.2014.09.012
Haberman, R., Quigley, C., and Gallagher, M. (2012). Characterization of CpG island DNA methylation of impairment-related genes in a rat model of cognitive aging. Epigenetics 7, 1008–1019. doi: 10.4161/epi.21291
He, X. W., Li, W. L., Li, C., Liu, P., Shen, Y. G., Zhu, M., et al. (2017). Serum levels of galectin-1, galectin-3, and galectin-9 are associated with large artery atherosclerotic stroke. Sci. Rep. 7:40994. doi: 10.1038/srep40994
Heidelberg, L. S., Warren, J. W., and Fisher, J. L. (2013). SB-205384 is a positive allosteric modulator of recombinant GABAA receptors containing rat alpha 3, alpha 5, or alpha 6 subunit subtypes coexpressed with beta 3 and gamma 2 subunits. J. Pharmacol. Exp. Ther. 347, 235–241. doi: 10.1124/jpet.113.207324
Ho, A. M., Mac Kay, R. K., Dodd, P. R., and Lewohl, J. M. (2010). Association of polymorphisms in RGS4 and expression of RGS transcripts in the brains of human alcoholics. Brain Res. 1340, 1–9. doi: 10.1016/j.brainres.2010.04.049
Hoppenrath, K., and Funke, K. (2013). Time-course of changes in neuronal activity markers following iTBS-TMS of the rat neocortex. Neurosci. Lett. 536, 19–23. doi: 10.1016/j.neulet.2013.01.003
Hoppenrath, K., Härtig, W., and Funke, K. (2016). Intermittent Theta-burst transcranial magnetic stimulation alters electrical properties of fast-spiking neocortical interneurons in an age-dependent fashion. Front. Neural Circ. 10:22. doi: 10.3389/fncir.2016.00022
Huang, Y. Z., Edwards, M. J., Rounis, E., Bhatia, K. P., and Rothwell, J. C. (2005). Theta burst stimulation of the human motor cortex. Neuron 45, 201–206. doi: 10.1016/j.neuron.2004.12.033
Huang, H. T., Guo, J., Xiang, Y., Chen, J. M., Luo, H. C., Meng, L. Q., et al. (2017). A SNP in 5′ untranslated region of CD40 gene is associated with an increased risk of ischemic stroke in a Chinese population: a case-control study. Genet. Mol. Biol. 40, 442–449. doi: 10.1590/1678-4685-gmb-2016-0212
Hunter, A. M., Minzenberg, M. J., Cook, I. A., Krantz, D. E., Levitt, J. G., Rotstein, N. M., et al. (2019). Concomitant medication use and clinical outcome of repetitive transcranial magnetic stimulation (rTMS) treatment of major depressive disorder. Brain Behav. 9:e01275. doi: 10.1002/brb3.1275
Ikeda, T., Kobayashi, S., and Morimoto, C. (2017). Gene expression microarray data from mouse cerebrum treated with rTMS for 30 days. Data Brief 15, 948–969. doi: 10.1016/j.dib.2017.10.034
Ikeda, T., Kobayashi, S., and Morimoto, C. (2018). Gene expression microarray data from mouse CBS treated with rTMS for 30 days, mouse cerebrum and CBS treated with rTMS for 40 days. Data Brief 17, 1078–1081. doi: 10.1016/j.dib.2018.01.079
Inoue, A., Akiyoshi, J., Muronaga, M., Masuda, K., Aizawa, S., Hirakawa, H., et al. (2015). Association of TMEM132D, COMT, and GABRA6 genotypes with cingulate, frontal cortex and hippocampal emotional processing in panic and major depressive disorder. Int. J. Psychiatry Clin. Pract. 19, 192–200. doi: 10.3109/13651501.2015.1043133
Irwin, D. J., McMillan, C. T., Suh, E., Powers, J., Rascovsky, K., Wood, E. M., et al. (2014). Myelin oligodendrocyte basic protein and prognosis in behavioral-variant frontotemporal dementia. Neurology 83, 502–509. doi: 10.1212/WNL.0000000000000668
Jacobs, S., Cui, Z., Feng, R., Wang, H., Wang, D., and Tsien, J. Z. (2014). Molecular and genetic determinants of the NMDA receptor for superior learning and memory functions. PLoS One 9:e111865. doi: 10.1371/journal.pone.0111865
Jazmati, D., Neubacher, U., and Funke, K. (2018). Neuropeptide Y as a possible homeostatic element for changes in cortical excitability induced by repetitive transcranial magnetic stimulation. Brain Stimul. 11, 797–805. doi: 10.1016/j.brs.2018.02.017
Kaskie, R. E., and Ferrarelli, F. (2017). Investigating the neurobiology of schizophrenia and other major psychiatric disorders with transcranial magnetic stimulation. Schizophr. Res. 192, 30–38. doi: 10.1016/j.schres.2017.04.045
Kim, T. K., Kim, J. E., Choi, J., Park, J. Y., Lee, J. E., Lee, E. H., et al. (2017). Local Interleukin-18 system in the basolateral amygdala regulates susceptibility to chronic stress. Mol. Neurobiol. 54, 5347–5358. doi: 10.1007/s12035-016-0052-7
Kim, S. Y., and Volsky, D. J. (2005). PAGE: parametric analysis of gene set enrichment. BMC Bioinform. 6:144. doi: 10.1186/1471-2105-6-144
Koch, G., Casula, E. P., Bonnì, S., Borghi, I., Assogna, M., Minei, M., et al. (2022). Precuneus magnetic stimulation for Alzheimer’s disease: a randomized, sham-controlled trial. Brain 145, 3776–3786. doi: 10.1093/brain/awac285
Lam, D., Ancelin, M. L., Ritchie, K., Freak-Poli, R., Saffery, R., and Ryan, J. (2018). Genotype-dependent associations between serotonin transporter gene (SLC6A4) DNA methylation and late-life depression. BMC Psychiatry 18:282. doi: 10.1186/s12888-018-1850-4
Lamar, T., Vanoye, C. G., Calhoun, J., Wong, J. C., Dutton, S. B., Jorge, B. S., et al. (2017). SCN3A deficiency associated with increased seizure susceptibility. Neurobiol. Dis. 102, 38–48. doi: 10.1016/j.nbd.2017.02.006
Lassi, G., Taylor, A. E., Timpson, N. J., Kenny, P. J., Mather, R. J., Eisen, T., et al. (2016). The CHRNA5-A3-B4 gene cluster and smoking: from discovery to therapeutics. Trends Neurosci. 39, 851–861. doi: 10.1016/j.tins.2016.10.005
Lee, C. H., and Giuliani, F. (2019). The role of inflammation in depression and fatigue. Front. Immunol. 10:1696. doi: 10.3389/fimmu.2019.01696
Lee, S. A., Oh, B. M., Kim, S. J., and Paik, N. J. (2014). The molecular evidence of neural plasticity induced by cerebellar repetitive transcranial magnetic stimulation in the rat brain: a preliminary report. Neurosci. Lett. 575, 47–52. doi: 10.1016/j.neulet.2014.05.029
Legrand, M., Troubat, R., Brizard, B., Le Guisquet, A. M., Belzung, C., and El-Hage, W. (2018). Prefrontal cortex rTMS reverses behavioral impairments and differentially activates c-Fos in a mouse model of post-traumatic stress disorder. Brain Stimul. 12, 87–95. doi: 10.1016/j.brs.2018.09.003
Li, H., Lv, C., Yang, C., Wei, D., Chen, K., Li, S., et al. (2017). SORL1 rs 1699102 polymorphism modulates age-related cognitive decline and gray matter volume reduction in non-demented individuals. Eur. J. Neurol. 24, 187–194. doi: 10.1111/ene.13182
Li, Y., Sun, H., Chen, Z., Xu, H., Bu, G., and Zheng, H. (2016). Implications of GABAergic neurotransmission in Alzheimer's disease. Front. Aging Neurosci. 8:31. doi: 10.3389/fnagi.2016.00031
Li, Y. Q., Tan, M. S., Wang, H. F., Tan, C. C., Zhang, W., Zheng, Z. J., et al. (2016). Common variant in PTK2B is associated with late-onset Alzheimer's disease: a replication study and meta-analyses. Neurosci. Lett. 621, 83–87. doi: 10.1016/j.neulet.2016.04.020
Li, D., Yuan, H., Ortiz-Gonzalez, X. R., Marsh, E. D., Tian, L., McCormick, E. M., et al. (2016). GRIN2D recurrent De novo dominant mutation causes a severe epileptic encephalopathy treatable with NMDA receptor channel blockers. Am. J. Hum. Genet. 99, 802–816. doi: 10.1016/j.ajhg.2016.07.013
Liu, X., Betzenhauser, M. J., Reiken, S., Meli, A. C., Xie, W., Chen, B. X., et al. (2012). Role of leaky neuronal ryanodine receptors in stress-induced cognitive dysfunction. Cells 150, 1055–1067. doi: 10.1016/j.cell.2012.06.052
Liu, H., Liu, H., Li, T., Cui, J., Fu, Y., Ren, J., et al. (2017). NR4A2 genetic variation and Parkinson's disease: evidence from a systematic review and meta-analysis. Neurosci. Lett. 650, 25–32. doi: 10.1016/j.neulet.2017.01.062
Losi, G., Gomez-Gonzalo, M., Zonta, M., Chiavegato, A., and Carmignoto, G. (2019). Cellular and molecular mechanisms of new onset seizure generation. Aging Clin. Exp. Res. 33, 1713–1716. doi: 10.1007/s40520-019-01396-z
Lozeron, P., Poujois, A., Richard, A., Masmoudi, S., Meppiel, E., Woimant, F., et al. (2016). Contribution of TMS and rTMS in the understanding of the pathophysiology and in the treatment of dystonia. Front. Neural Circ. 10:90. doi: 10.3389/fncir.2016.00090
Lu, F., Liu, S., Hao, Q., Liu, L., Zhang, J., Chen, X., et al. (2018). Association between complement factor C2/C3/CFB/CFH polymorphisms and age-related macular degeneration: a Meta-analysis. Genet. Test. Mol. Biomarkers 22, 526–540. doi: 10.1089/gtmb.2018.0110
Matosin, N., Newell, K. A., Quide, Y., Andrews, J. L., Teroganova, N., Green, M. J., et al. (2017). Effects of common GRM5 genetic variants on cognition, hippocampal volume and mGluR5 protein levels in schizophrenia. Brain Imaging Behav. 12, 509–517. doi: 10.1007/s11682-017-9712-0
Mazucanti, C. H., Kawamoto, E. M., Mattson, M. P., Scavone, C., and Camandola, S. (2018). Activity-dependent neuronal Klotho enhances astrocytic aerobic glycolysis. J. Cereb. Blood Flow Metab. 39, 1544–1556. doi: 10.1177/0271678X18762700
McDonald, M. L., Mac Mullen, C., Liu, D. J., Leal, S. M., and Davis, R. L. (2012). Genetic association of cyclic AMP signaling genes with bipolar disorder. Transl. Psychiatry 2:e169. doi: 10.1038/tp.2012.92
McDonnell, M. N., and Stinear, C. M. (2017). TMS measures of motor cortex function after stroke: a meta-analysis. Brain Stimul. 10, 721–734. doi: 10.1016/j.brs.2017.03.008
Metzner, C., Zurowski, B., and Steuber, V. (2019). The role of Parvalbumin-positive interneurons in auditory steady-state response deficits in schizophrenia. Sci. Rep. 9:18525. doi: 10.1038/s41598-019-53682-5
Minzenberg, M. J., and Leuchter, A. F. (2019). The effect of psychotropic drugs on cortical excitability and plasticity measured with transcranial magnetic stimulation: implications for psychiatric treatment. J. Affect. Disord. 253, 126–140. doi: 10.1016/j.jad.2019.04.067
Mix, A., Benali, A., Eysel, U. T., and Funke, K. (2010). Continuous and intermittent transcranial magnetic theta burst stimulation modify tactile learning performance and cortical protein expression in the rat differently. Eur. J. Neurosci. 32, 1575–1586. doi: 10.1111/j.1460-9568.2010.07425.x
Mix, A., Hoppenrath, K., and Funke, K. (2015). Reduction in cortical parvalbumin expression due to intermittent theta-burst stimulation correlates with maturation of the perineuronal nets in young rats. Dev. Neurobiol. 75, 1–11. doi: 10.1002/dneu.22205
Moeller, S. J., Beebe-Wang, N., Schneider, K. E., Konova, A. B., Parvaz, M. A., Alia-Klein, N., et al. (2015). Effects of an opioid (proenkephalin) polymorphism on neural response to errors in health and cocaine use disorder. Behav. Brain Res. 293, 18–26. doi: 10.1016/j.bbr.2015.07.004
Montarolo, F., Perga, S., Martire, S., Navone, D. N., Marchet, A., Leotta, D., et al. (2016). Altered NR4A subfamily gene expression level in peripheral blood of Parkinson's and Alzheimer's disease patients. Neurotox. Res. 30, 338–344. doi: 10.1007/s12640-016-9626-4
Morin, J. P., Guzman-Ramos, K., and Bermudez-Rattoni, F. (2015). New insights on retrieval-induced and ongoing memory consolidation: lessons from arc. Neural Plast. 2015:184083. doi: 10.1155/2015/184083
Mufson, E. J., Counts, S. E., Perez, S. E., and Ginsberg, S. D. (2008). Cholinergic system during the progression of Alzheimer's disease: therapeutic implications. Expert. Rev. Neurother. 8, 1703–1718. doi: 10.1586/14737175.8.11.1703
Nardone, R., Tezzon, F., Holler, Y., Golaszewski, S., Trinka, E., and Brigo, F. (2014). Transcranial magnetic stimulation (TMS)/repetitive TMS in mild cognitive impairment and Alzheimer's disease. Acta Neurol. Scand. 129, 351–366. doi: 10.1111/ane.12223
Nimgaonkar, V. L., Prasad, K. M., Chowdari, K. V., Severance, E. G., and Yolken, R. H. (2017). The complement system: a gateway to gene-environment interactions in schizophrenia pathogenesis. Mol. Psychiatry 22, 1554–1561. doi: 10.1038/mp.2017.151
Oh, M. M., Oliveira, F. A., and Disterhoft, J. F. (2010). Learning and aging related changes in intrinsic neuronal excitability. Front. Aging Neurosci. 2:2. doi: 10.3389/neuro.24.002.2010
Olfson, E., Saccone, N. L., Johnson, E. O., Chen, L. S., Culverhouse, R., Doheny, K., et al. (2016). Rare, low frequency and common coding variants in CHRNA5 and their contribution to nicotine dependence in European and African Americans. Mol. Psychiatry 21, 601–607. doi: 10.1038/mp.2015.105
Palop, J. J., Chin, J., Roberson, E. D., Wang, J., Thwin, M. T., Bien-Ly, N., et al. (2007). Aberrant excitatory neuronal activity and compensatory remodeling of inhibitory hippocampal circuits in mouse models of Alzheimer's disease. Neuron 55, 697–711. doi: 10.1016/j.neuron.2007.07.025
Palop, J. J., and Mucke, L. (2016). Network abnormalities and interneuron dysfunction in Alzheimer disease. Nat. Rev. Neurosci. 17, 777–792. doi: 10.1038/nrn.2016.141
Pehrson, A. L., and Sanchez, C. (2015). Altered gamma-aminobutyric acid neurotransmission in major depressive disorder: a critical review of the supporting evidence and the influence of serotonergic antidepressants. Drug Des. Devel. Ther. 9, 603–624. doi: 10.2147/DDDT.S62912
Perez-Otano, I., Larsen, R. S., and Wesseling, J. F. (2016). Emerging roles of Glu N3-containing NMDA receptors in the CNS. Nat. Rev. Neurosci. 17, 623–635. doi: 10.1038/nrn.2016.92
Prasad, D. K., Shaheen, U., Satyanarayana, U., Prabha, T. S., Jyothy, A., and Munshi, A. (2014). Association of GABRA6 1519 T>C (rs 3219151) and Synapsin II (rs 37733634) gene polymorphisms with the development of idiopathic generalized epilepsy. Epilepsy Res. 108, 1267–1273. doi: 10.1016/j.eplepsyres.2014.07.001
Presumey, J., Bialas, A. R., and Carroll, M. C. (2017). Complement system in neural synapse elimination in development and Disease. Adv. Immunol. 135, 53–79. doi: 10.1016/bs.ai.2017.06.004
Prossin, A. R., Koch, A. E., Campbell, P. L., McInnis, M. G., Zalcman, S. S., and Zubieta, J. K. (2011). Association of plasma interleukin-18 levels with emotion regulation and mu-opioid neurotransmitter function in major depression and healthy volunteers. Biol. Psychiatry 69, 808–812. doi: 10.1016/j.biopsych.2010.10.014
Proulx, E., Piva, M., Tian, M. K., Bailey, C. D., and Lambe, E. K. (2014). Nicotinic acetylcholine receptors in attention circuitry: the role of layer VI neurons of prefrontal cortex. Cell. Mol. Life Sci. 71, 1225–1244. doi: 10.1007/s00018-013-1481-3
Ramadan, W., Patel, N., Anazi, S., Kentab, A. Y., Bashiri, F. A., Hamad, M. H., et al. (2017). Confirming the recessive inheritance of SCN1B mutations in developmental epileptic encephalopathy. Clin. Genet. 92, 327–331. doi: 10.1111/cge.12999
Rapp, P. R., and Gallagher, M. (1996). Preserved neuron number in the hippocampus of aged rats with spatial learning deficits. Proc. Natl. Acad. Sci. 93, 9926–9930. doi: 10.1073/pnas.93.18.9926
Rapp, P. R., Rosenberg, R. A., and Gallagher, M. (1987). An evaluation of spatial information processing in aged rats. Behav. Neurosci. 101, 3–12. doi: 10.1037/0735-7044.101.1.3
Ribeiro, F. M., Black, S. A., Prado, V. F., Rylett, R. J., Ferguson, S. S., and Prado, M. A. (2006). The "ins" and "outs" of the high-affinity choline transporter CHT1. J. Neurochem. 97, 1–12. doi: 10.1111/j.1471-4159.2006.03695.x
Sasso, V., Bisicchia, E., Latini, L., Ghiglieri, V., Cacace, F., Carola, V., et al. (2016). Repetitive transcranial magnetic stimulation reduces remote apoptotic cell death and inflammation after focal brain injury. J. Neuroinflammation 13:150. doi: 10.1186/s12974-016-0616-5
Schroeter, M. L., Steiner, J., Schonknecht, P., and Mueller, K. (2014). Further evidence for a role of S100B in mood disorders: a human gene expression mega-analysis. J. Psychiatr. Res. 53, 84–86. doi: 10.1016/j.jpsychires.2014.02.021
Schur, R. R., Draisma, L. W., Wijnen, J. P., Boks, M. P., Koevoets, M. G., Joels, M., et al. (2016). Brain GABA levels across psychiatric disorders: a systematic literature review and meta-analysis of (1) H-MRS studies. Hum. Brain Mapp. 37, 3337–3352. doi: 10.1002/hbm.23244
Schwarz, E. (2017). A gene-based review of RGS4 as a putative risk gene for psychiatric illness. Am. J. Med. Genet. B Neuropsychiatr. Genet. 177, 267–273. doi: 10.1002/ajmg.b.32547
Scott, H. L., Pow, D. V., Tannenberg, A. E., and Dodd, P. R. (2002). Aberrant expression of the glutamate transporter excitatory amino acid transporter 1 (EAAT1) in Alzheimer's disease. J. Neurosci. 22:Rc206. doi: 10.1523/JNEUROSCI.22-03-j0004.2002
Shen, J., Chen, B., Zheng, G. R., Qiu, S. Z., Yin, H. M., Mao, W., et al. (2017). Detection of high serum concentration of CXC chemokine ligand-12 in acute intracerebral hemorrhage. Clin. Chim. Acta 471, 55–61. doi: 10.1016/j.cca.2017.05.022
Sheng, J. G., Bora, S. H., Xu, G., Borchelt, D. R., Price, D. L., and Koliatsos, V. E. (2003). Lipopolysaccharide-induced-neuroinflammation increases intracellular accumulation of amyloid precursor protein and amyloid beta peptide in APPswe transgenic mice. Neurobiol. Dis. 14, 133–145. doi: 10.1016/S0969-9961(03)00069-X
Silva, C. S., Eira, J., Ribeiro, C. A., Oliveira, A., Sousa, M. M., Cardoso, I., et al. (2017). Transthyretin neuroprotection in Alzheimer's disease is dependent on proteolysis. Neurobiol. Aging 59, 10–14. doi: 10.1016/j.neurobiolaging.2017.07.002
Silvanto, J., and Pascual-Leone, A. (2008). State-dependency of transcranial magnetic stimulation. Brain Topogr. 21, 1–10. doi: 10.1007/s10548-008-0067-0
Simpson, M., and Macdonell, R. (2015). The use of transcranial magnetic stimulation in diagnosis, prognostication and treatment evaluation in multiple sclerosis. Mult. Scler. Relat. Disord. 4, 430–436. doi: 10.1016/j.msard.2015.06.014
Singh, T., and Newman, A. B. (2011). Inflammatory markers in population studies of aging. Ageing Res. Rev. 10, 319–329. doi: 10.1016/j.arr.2010.11.002
Smith, M. C., and Stinear, C. M. (2016). Transcranial magnetic stimulation (TMS) in stroke: ready for clinical practice? J. Clin. Neurosci. 31, 10–14. doi: 10.1016/j.jocn.2016.01.034
Spiegel, A. M., Koh, M. T., Vogt, N. M., Rapp, P. R., and Gallagher, M. (2013). Hilar interneuron vulnerability distinguishes aged rats with memory impairment. J. Comp. Neurol. 521, 3508–3523. doi: 10.1002/cne.23367
Sudre, C. H., Bocchetta, M., Cash, D., Thomas, D. L., Woollacott, I., Dick, K. M., et al. (2017). White matter hyperintensities are seen only in GRN mutation carriers in the GENFI cohort. Neuroimage Clin. 15, 171–180. doi: 10.1016/j.nicl.2017.04.015
Sun, W., Fu, Q., Zhang, C., Manohar, S., Kumaraguru, A., and Li, J. (2014). Loudness perception affected by early age hearing loss. Hear. Res. 313, 18–25. doi: 10.1016/j.heares.2014.04.002
Sung, H. Y., Choi, B. O., Jeong, J. H., Kong, K. A., Hwang, J., and Ahn, J. H. (2016). Amyloid beta-mediated hypomethylation of heme oxygenase 1 correlates with cognitive impairment in Alzheimer's disease. PLoS One 11:e0153156. doi: 10.1371/journal.pone.0153156
Surendran, S., Rady, P. L., Michals-Matalon, K., Quast, M. J., Rassin, D. K., Campbell, G. A., et al. (2003). Expression of glutamate transporter, GABRA6, serine proteinase inhibitor 2 and low levels of glutamate and GABA in the brain of knock-out mouse for Canavan disease. Brain Res. Bull. 61, 427–435. doi: 10.1016/S0361-9230(03)00158-8
Tomás Pereira, I., and Burwell, R. D. (2015). Using the spatial learning index to evaluate performance on the water maze. Behav. Neurosci. 129, 533–539. doi: 10.1037/bne0000078
Tomas Pereira, I., Gallagher, M., and Rapp, P. R. (2015). Head west or left, east or right: interactions between memory systems in neurocognitive aging. Neurobiol. Aging 36, 3067–3078. doi: 10.1016/j.neurobiolaging.2015.07.024
Torvell, M., Carpanini, S. M., Daskoulidou, N., Byrne, R. A. J., Sims, R., and Morgan, B. P. (2021). Genetic insights into the impact of complement in Alzheimer's Disease. Genes (Basel) 12:1990. doi: 10.3390/genes12121990
Trippe, J., Mix, A., Aydin-Abidin, S., Funke, K., and Benali, A. (2009). theta burst and conventional low-frequency rTMS differentially affect GABAergic neurotransmission in the rat cortex. Exp. Brain Res. 199, 411–421. doi: 10.1007/s00221-009-1961-8
Turriziani, P., Smirni, D., Zappalà, G., Mangano, G. R., Oliveri, M., and Cipolotti, L. (2012). Enhancing memory performance with rTMS in healthy subjects and individuals with mild cognitive impairment: the role of the right dorsolateral prefrontal cortex. Front. Hum. Neurosci. 6:62. doi: 10.3389/fnhum.2012.00062
Varga, Z., Csabai, D., Miseta, A., Wiborg, O., and Czeh, B. (2017). Chronic stress affects the number of GABAergic neurons in the orbitofrontal cortex of rats. Behav. Brain Res. 316, 104–114. doi: 10.1016/j.bbr.2016.08.030
Wagner, T., Valero-Cabre, A., and Pascual-Leone, A. (2007). Noninvasive human brain stimulation. Annu. Rev. Biomed. Eng. 9, 527–565. doi: 10.1146/annurev.bioeng.9.061206.133100
Wang, R., and Reddy, P. H. (2017). Role of glutamate and NMDA receptors in Alzheimer's Disease. J. Alzheimers Dis. 57, 1041–1048. doi: 10.3233/JAD-160763
Wang, H. N., Wang, L., Zhang, R. G., Chen, Y. C., Liu, L., Gao, F., et al. (2014). Anti-depressive mechanism of repetitive transcranial magnetic stimulation in rat: the role of the endocannabinoid system. J. Psychiatr. Res. 51, 79–87. doi: 10.1016/j.jpsychires.2014.01.004
Wei, L. K., Au, A., Menon, S., Griffiths, L. R., Kooi, C. W., Irene, L., et al. (2017). Polymorphisms of MTHFR, eNOS, ACE, AGT, Apo E, PON1, PDE4D, and ischemic stroke: meta-analysis. J. Stroke Cerebrovasc. Dis. 26, 2482–2493. doi: 10.1016/j.jstrokecerebrovasdis.2017.05.048
Wei, Y., Zhu, J., Pan, S., Su, H., Li, H., and Wang, J. (2017). Meta-analysis of the efficacy and safety of repetitive transcranial magnetic stimulation (rTMS) in the treatment of depression. Shanghai Arch. Psychiatry 29, 328–342. doi: 10.11919/j.issn.1002-0829.217106
Weiler, M., Moreno-Castilla, P., Starnes, H. M., Melendez, E. L. R., Stieger, K. C., Long, J. M., et al. (2021). Effects of repetitive transcranial magnetic stimulation in aged rats depend on pre-treatment cognitive status: toward individualized intervention for successful cognitive aging. Brain Stimul. 14, 1219–1225. doi: 10.1016/j.brs.2021.08.008
Weiler, M., Stieger, K. C., Long, J. M., and Rapp, P. R. (2020). Transcranial magnetic stimulation in Alzheimer's disease: are we ready? eNeuro 7, ENEURO.0235–ENEU19.2019. doi: 10.1523/ENEURO.0235-19.2019
Wu, T., Tang, C., Fan, J., and Tao, J. (2022). Administration of rTMS alleviates stroke-induced cognitive deficits by modulating mi R-409-3p/CTRP3/AMPK/Sirt 1 axis. J. Mol. Neurosci. 72, 507–515. doi: 10.1007/s12031-021-01924-5
Yang, X. R., Kirton, A., Wilkes, T. C., Pradhan, S., Liu, I., Jaworska, N., et al. (2014). Glutamate alterations associated with transcranial magnetic stimulation in youth depression: a case series. J. ECT 30, 242–247. doi: 10.1097/YCT.0000000000000094
Ye, H., and Kaszuba, S. (2017). Inhibitory or excitatory? Optogenetic interrogation of the functional roles of GABAergic interneurons in epileptogenesis. J. Biomed. Sci. 24:93. doi: 10.1186/s12929-017-0399-8
Yu, K. H., Chang, P. Y., Chang, S. C., Wu-Chou, Y. H., Wu, L. A., Chen, D. P., et al. (2017). A comprehensive analysis of the association of common variants of ABCG2 with gout. Sci. Rep. 7:9988. doi: 10.1038/s41598-017-10196-2
Zhang, Y., De, S., Garner, J. R., Smith, K., Wang, S. A., and Becker, K. G. (2010). Systematic analysis, comparison, and integration of disease based human genetic association data and mouse genetic phenotypic information. BMC Med. Genet. 3:1. doi: 10.1186/1755-8794-3-1
Zhao, X., Li, H., Shi, Y., Tang, R., Chen, W., Liu, J., et al. (2006). Significant association between the genetic variations in the 5′ end of the N-methyl-D-aspartate receptor subunit gene GRIN1 and schizophrenia. Biol. Psychiatry 59, 747–753. doi: 10.1016/j.biopsych.2005.10.023
Zheng, L., Liu, W., He, W., Yu, S., and Zhong, G. (2017). Altered effective brain connectivity at early response of antipsychotics in first-episode schizophrenia with auditory hallucinations. Clin. Neurophysiol. 128, 867–874. doi: 10.1016/j.clinph.2017.02.004
Ziemann, U. (2004). TMS and drugs. Clin. Neurophysiol. 115, 1717–1729. doi: 10.1016/j.clinph.2004.03.006
Keywords: non-invasive brain stimulation, microarray, gene expression, aging, genomic
Citation: Weiler M, Stieger KC, Shroff K, Klein JP, Wood WH, Zhang Y, Chandrasekaran P, Lehrmann E, Camandola S, Long JM, Mattson MP, Becker KG and Rapp PR (2023) Transcriptional changes in the rat brain induced by repetitive transcranial magnetic stimulation. Front. Hum. Neurosci. 17:1215291. doi: 10.3389/fnhum.2023.1215291
Edited by:
Marco Filardi, University of Bari Aldo Moro, ItalyReviewed by:
Eric Goldwaser, NewYork-Presbyterian, United StatesMarco Cambiaghi, University of Verona, Italy
Copyright © 2023 Weiler, Stieger, Shroff, Klein, Wood, Zhang, Chandrasekaran, Lehrmann, Camandola, Long, Mattson, Becker and Rapp. This is an open-access article distributed under the terms of the Creative Commons Attribution License (CC BY). The use, distribution or reproduction in other forums is permitted, provided the original author(s) and the copyright owner(s) are credited and that the original publication in this journal is cited, in accordance with accepted academic practice. No use, distribution or reproduction is permitted which does not comply with these terms.
*Correspondence: Kevin G. Becker, YmVja2Vya2V2QGdtYWlsLmNvbQ==