 Isabelle D. Walz1,2
 Sarah Waibel1
 Vittorio Lippi1,3
 Stefan Kammermeier4
 Albert Gollhofer2
 Christoph Maurer1*
- 1Department of Neurology and Neuroscience, Faculty of Medicine, Medical Center, University of Freiburg, Freiburg, Germany
- 2Department of Sport and Sport Science, University of Freiburg, Freiburg, Germany
- 3Faculty of Medicine Freiburg, Institute of Digitalization in Medicine, Medical Center, University of Freiburg, Freiburg, Germany
- 4Department of Neurology, Ludwig Maximilian University, Munich, Germany
Introduction: Gait disturbances are a common consequence of polyneuropathy (PNP) and a major factor in patients’ reduced quality of life. Less is known about the underlying mechanisms of PNP-related altered motor behavior and its distribution across the body. We aimed to capture whole body movements in PNP during a clinically relevant mobility test, i.e., the Timed Up and Go (TUG). We hypothesize that joint velocity profiles across the entire body would enable a deeper understanding of PNP-related movement alterations. This may yield insights into motor control mechanisms responsible for altered gait in PNP.
Methods: 20 PNP patients (61 ± 14 years) and a matched healthy control group (CG, 60 ± 15 years) performed TUG at (i) preferred and (ii) fast movement speed, and (iii) while counting backward (dual-task). We recorded TUG duration (s) and extracted gait-related parameters [step time (s), step length (cm), and width (cm)] during the walking sequences of TUG and calculated center of mass (COM) velocity [represents gait speed (cm/s)] and joint velocities (cm/s) (ankles, knees, hips, shoulders, elbows, wrists) with respect to body coordinates during walking; we then derived mean joint velocities and ratios between groups.
Results: Across all TUG conditions, PNP patients moved significantly slower (TUG time, gait speed) with prolonged step time and shorter steps compared to CG. Velocity profiles depend significantly on group designation, TUG condition, and joint. Correlation analysis revealed that joint velocities and gait speed are closely interrelated in individual subjects, with a 0.87 mean velocity ratio between groups.
Discussion: We confirmed a PNP-related slowed gait pattern. Interestingly, joint velocities in the rest of the body measured in body coordinates were in a linear relationship to each other and to COM velocity in space coordinates, despite PNP. Across the whole body, PNP patients reduce, on average, their joint velocities with a factor of 0.87 compared to CG and thus maintain movement patterns in terms of velocity distributions across joints similarly to healthy individuals. This down-scaling of mean absolute joint velocities may be the main source for the altered motor behavior of PNP patients during gait and is due to the poorer quality of their somatosensory information.
Clinical Trial Registration: https://drks.de/search/de, identifier DRKS00016999.
1. Introduction
Polyneuropathies (PNP) cover a group of diseases that primarily cause damage to peripheral nerve fibers in symmetric, distal, length-dependent “glove and stocking” distribution (Findling et al., 2018). Affected patients suffer from sensitivity impairments that can manifest in paresthesia, dysesthesia, numbness, and pain in the hands and feet (Hanewinckel et al., 2016; Alam et al., 2017). PNP is also associated with reduced muscular strength (Rotta et al., 2000; Ferreira et al., 2017). This may directly result from damage to motor nerve fibers in specific types of PNP or advanced disease settings or indirectly from a lack of movement due to the aforementioned sensitivity symptoms (Andreassen et al., 2006; Martinelli et al., 2013; Hafsteinsdottir and Olafsson, 2016; Broers et al., 2019).
Functionally speaking, PNP significantly raises the risk of postural instability, meaning balance problems and gait disturbances (Mustapa et al., 2016; Kneis et al., 2020b). For example, in older populations, PNP accounts for around 18% of gait disorders (Pirker and Katzenschlager, 2017) and raises the probability of falling (Cavanagh et al., 1992; Richardson and Hurvitz, 1995; Stolze et al., 2004; Hanewinckel et al., 2017; Findling et al., 2018). PNP can therefore reduce both our everyday mobility and quality of life considerably (Hoffman et al., 2015; Win et al., 2019) and strain healthcare resources (Gordois et al., 2003; Pike et al., 2012; Mengel et al., 2018). Standardized clinical tests usually include gait and balance tasks to assess one’s mobility status and fall risk. Observation of these tests can be refined by motion capture systems enabling specific analysis, e.g., about gait abilities. It is well known that people with PNP habitually walk slower, take shorter steps, and reveal more gait variability than age-matched healthy individuals (Wuehr et al., 2014; Hanewinckel et al., 2017; Marshall et al., 2017; Kneis et al., 2020a). However, it remains unclear whether the altered gait, especially in terms of slowness, is caused by the primary deficit, i.e., damaged peripheral nerve structures, or whether it is a secondary strategy to prevent accidents such as falls (Courtemanche et al., 1996; Dingwell et al., 2000; Dingwell and Cavanagh, 2001; Menz et al., 2004; Wuehr et al., 2014). As PNP makes evident, damage to peripheral nervous structures leads to proprioceptive impairments (Hanewinckel et al., 2016; Findling et al., 2018). Reliable proprioceptive feedback is essential for precise posture control, as it contains information about alterations via tendon or muscle lengths and joint angles (Allum et al., 1998; Dietz, 2002; Masani et al., 2003; Shaffer and Harrison, 2007). Disturbances in the proprioceptive signals thus imply inaccurate motor control mechanisms (Dietz et al., 2002; Pearson, 2004). In PNP, this somatosensory deficit is believed to promote the aforementioned balance and gait disturbances. However, its exact interrelation with the slowing of gait remains unclear (Courtemanche et al., 1996; Dingwell et al., 2000; Menz et al., 2004; Wuehr et al., 2014). Besides gait and balance, the functional performance of upper limbs also suffers from PNP. There is evidence of less accuracy and slower execution speed during goal-directed arm movements (Hondzinski et al., 2010), as well as reduced functional hand performance during fine motor tasks compared to healthy individuals, while strength capacity seems unaffected (Kender et al., 2022). Until now, there has been no known whole-body gait movement analysis in PNP considering both upper and lower-body motor behavior. We assume that altered motor pattern in the lower limbs while walking is also reflected in the upper limbs (Wannier et al., 2001; Meyns et al., 2013; Pearcey and Zehr, 2019).
Our approach in the present study is to capture the whole-body movement of PNP patients in a standardized mobility test acknowledged as clinically relevant, i.e., the Timed Up and Go (TUG) test (Salarian et al., 2010; Christopher et al., 2019). The TUG test covers essential demands of daily living (standing up and sitting down, accelerating and decelerating walking, turning around) and, thus, stimulates different body systems responsible for posture stability, coordinated movements, and force development. TUG was originally done at a preferred movement speed (Podsiadlo and Richardson, 1991), operating as a reliable and approved sign of vitality (Studenski et al., 2011; Perera et al., 2016). For a more differentiated perspective of PNP-related sensorimotor impairments, we will add two further TUG conditions that challenge patients’ executive resources: executing TUG while counting backward to provoke cognitive-motor interference (Montero-Odasso et al., 2012; Montero-Odasso and Hachinski, 2014; Bayot et al., 2018; Schniepp et al., 2019), and at a fast movement speed to assess acceleration capacities associated with disability and functional reserve capacity (Wuehr et al., 2014; Artaud et al., 2015; Middleton et al., 2015). For motion behavior analysis, we will extract common gait parameters and additionally focus on joint velocities across the whole body in comparison to matched healthy control individuals. As the first step, we aim to verify that the TUG performance of PNP patients falls below that of healthy individuals. We assume that PNP-related gait alterations will reflect the poorer performance level in each TUG condition. Furthermore, we hypothesize that velocity across the whole body can characterize PNP-specific motion patterns depending on the TUG condition and joints analyzed. We believe that our approach will enable us to derive additional velocity-based parameters that will help us better understand motor behavior and movement organization in neurological diseases.
2. Materials and methods
2.1. Participants
We enrolled 20 patients with clinically confirmed polyneuropathy symptoms (PNP) and 20 healthy control participants (control group, CG) matched to patients’ age, sex, height, and weight. Exclusion criteria for the PNP group cover comorbidities that interact with gait and balance abilities. For CG, we excluded any disease that could be related to PNP symptoms or interfere with gait or balance performance. Patients’ PNP symptoms were objectified by testing reflexes, vibration sense, joint position sense, temperature, and pain sensation in the lower extremities (Liniger et al., 1990; Pestronk et al., 2004; Kneis et al., 2020b). All participants underwent detailed anamnesis, including chronic or acute diseases requiring treatment. Furthermore, we asked for the maximum walking distance as well as the number of falls during the last year and estimated the fear of falling via the validated Falls Efficacy Scale – International (FES-I) (Delbaere et al., 2010). We also clinically assessed mobility performance by applying a common test, i.e., the Performance Oriented Mobility Assessment (Tinetti POMA), with nine items for balance (score 0–16) and eight items for gait (score 0–12): a lower score indicates a higher risk of falling (Tinetti, 1986).
This study was approved by the Ethics Committee of the University of Freiburg (no. 68/19) and conducted according to the Declaration of Helsinki (German Register of Clinical Trials no.: DRKS00016999). Written informed consent was obtained from all individual participants included in the study.
2.2. Assessments
All participants performed the Timed Up and Go (TUG) test in three different conditions twice: performing TUG first at preferred movement speed (preferred condition), secondly while executing an additional cognitive task [counting backward in steps of two (Al-Yahya et al., 2011); dual-task condition], and thirdly as fast as possible without running, meaning one or both feet always in ground contact (fast condition, test instruction: “walk as fast as safely possible”). The instructions were standardized. Participants walked wearing their own footwear. Each TUG condition was performed twice.
2.3. Motion capture
All movements during TUG execution were recorded via a markerless vision-based motion capture system, i.e., The Captury (The Captury GmbH, Saarbrücken, Germany). It uses a visual hull and background subtraction method to estimate the subject’s silhouette. Body movements are tracked by 12 cameras at a 100 Hz sampling rate and resolution of ~1 mm. An automatic scaling process fits a skeleton into the subject (up to 60 s). The system calculates precise position data of the whole body, represented by specific joints, e.g., wrist, elbow, shoulder, hip, knee, and ankle, and center of mass (COM) estimation (Kuhner et al., 2017; Harsted et al., 2019).
2.4. Data processing
A custom build MATLAB™ (R2019b; MathWorks, Natick, Ma) program was used for data processing. For analysis, we relied on the mean values of the two trials per TUG condition. We identified the duration (s) needed to complete each TUG trial (TUG time). Furthermore, we extracted three sequences from the TUG: walk 1 [(s), walk between the stand-up and turning task], turning (s), and walk 2 [(s), walk between turning- and turn-to-sit-task]. For gait-specific analysis, steps during the walking sequences (walk1 + 2) were detected using the ankle speed: steps begin and end if the ankles’ speed approaches zero (threshold = 5.5 cm/s). Turning and turn-to-sit sequences were identified by shoulder axis rotation (>20°). The thresholds were determined based on own datasets for validation. Step detection serves to calculate these gait parameters: step time (s) and step length (cm), as well as step width (cm).
Velocity measures were calculated using the mean values of walk 1 and walk 2. COM velocity refers to space coordinates and thus represents gait speed (cm/s). As the velocity between left and right joints was not asymmetric, individual joint velocities (cm/s) were presented as mean (wrist, elbow, shoulder, hip, knee, and ankle) and calculated with respect to COM during walking. We then derived mean joint velocities (per joint and across all joints) for each group and velocity ratios between groups.
2.5. Statistical analysis
For statistical analysis, IBM SPSS Statistics for Windows, version 26.0 (IBM Corp., Armonk, NY, United States), and for data visualization, RStudio, version 4.0.3 (RStudio, PBC, Boston, United States) was used. Descriptive statistics are reported as median with a 25–75 percentile range. Participants’ characteristics were analyzed using T-Test, Pearson-Chi-Quadrat, and Man-Whitney-U tests. Shapiro–Wilk test was used to test for normal distribution of TUG times, gait parameters, and COM velocity (all parameters were normally distributed, except turning and walking 2 times in PNP). TUG times, gait parameters, and COM velocity were analyzed separately using repeated measures ANOVA, with the condition as the dependent variable (Schmider et al., 2010). Bonferroni was used as a post-hoc test.
Joint velocities were log-transformed to achieve normal distribution, as the original data was skewed to the right. To assess joint velocities, we applied the repeated measures multivariate analysis of variance (MANOVA) to evaluate the complexity of variable relationships by considering two dependent variables (joints and TUG condition) and group designation as independent (repeated measures) variables. As a post-hoc test for TUG condition, we used the Bonferroni, for joints, the Tukey’s Honest Significant Difference (HSD) test. To demonstrate the relations between joint velocities and gait speed (COM), we conducted a correlation analysis. We chose the ankle (as the most distal joint) and hip (as the most proximal joint) to visualize joint behavior relative to gait speed. Spearman-Rho was used to correlate velocity ratios (wrist-, elbow-, shoulder-, hip-, knee-ankle ratio, and overall velocity ratio) with maximum walking distance, fear of falling (FES-I), and mobility performance (Tinetti POMA).
3. Results
No adverse events occurred during the tests, and all participants performed all test conditions. We included data from N = 40 participants (20 PNP:20 CG) in our analysis. The comparative groups PNP and matched CG exhibited similar anthropometric parameters (Table 1). Participants’ characteristics revealed significant group differences in fall incidence, maximum walking distance, fear of falling (FES-I), mobility performance (Tinetti POMA; Table 1), medicine intake, and chronic disabilities (Supplementary Table S1). All included patients had relevant PNP symptoms (Table 2).
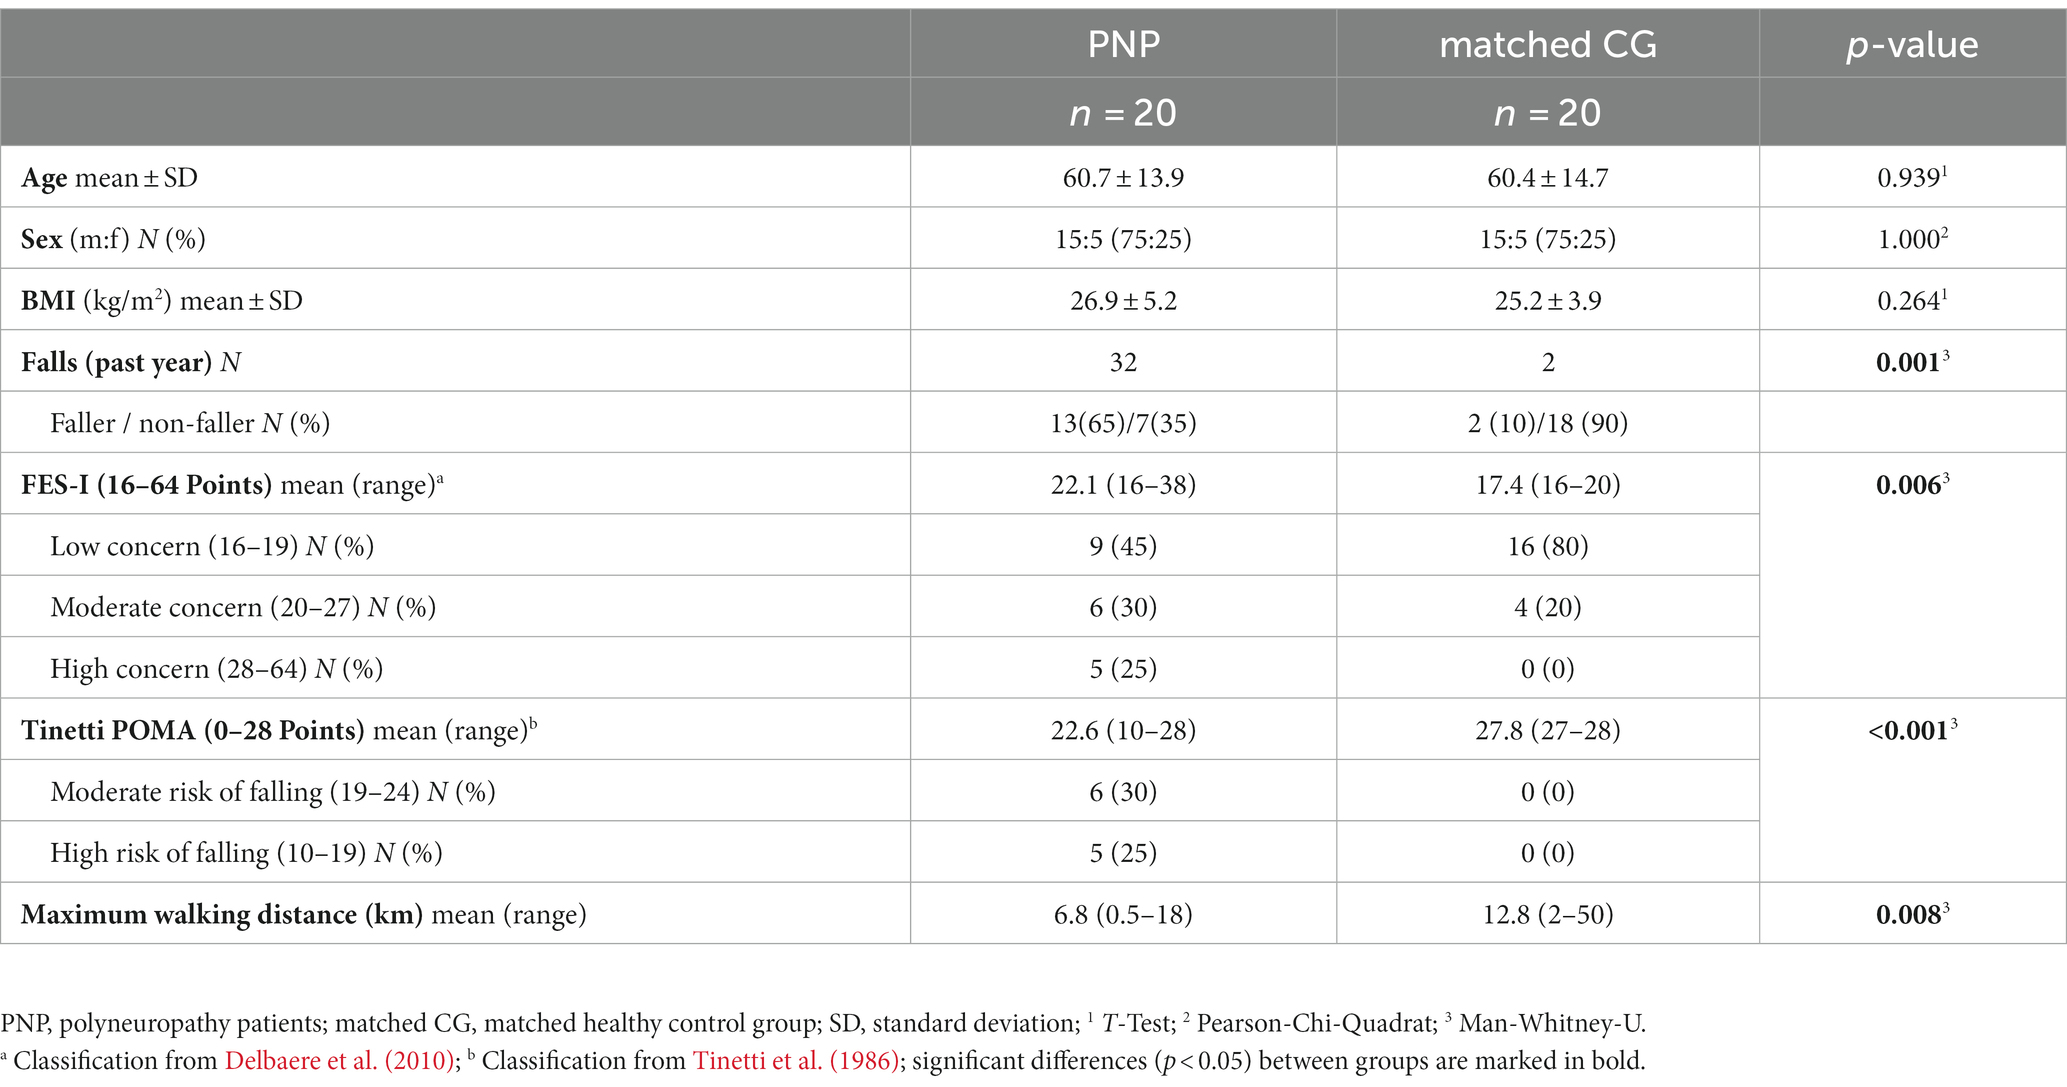
Table 1. Participants’ characteristics.
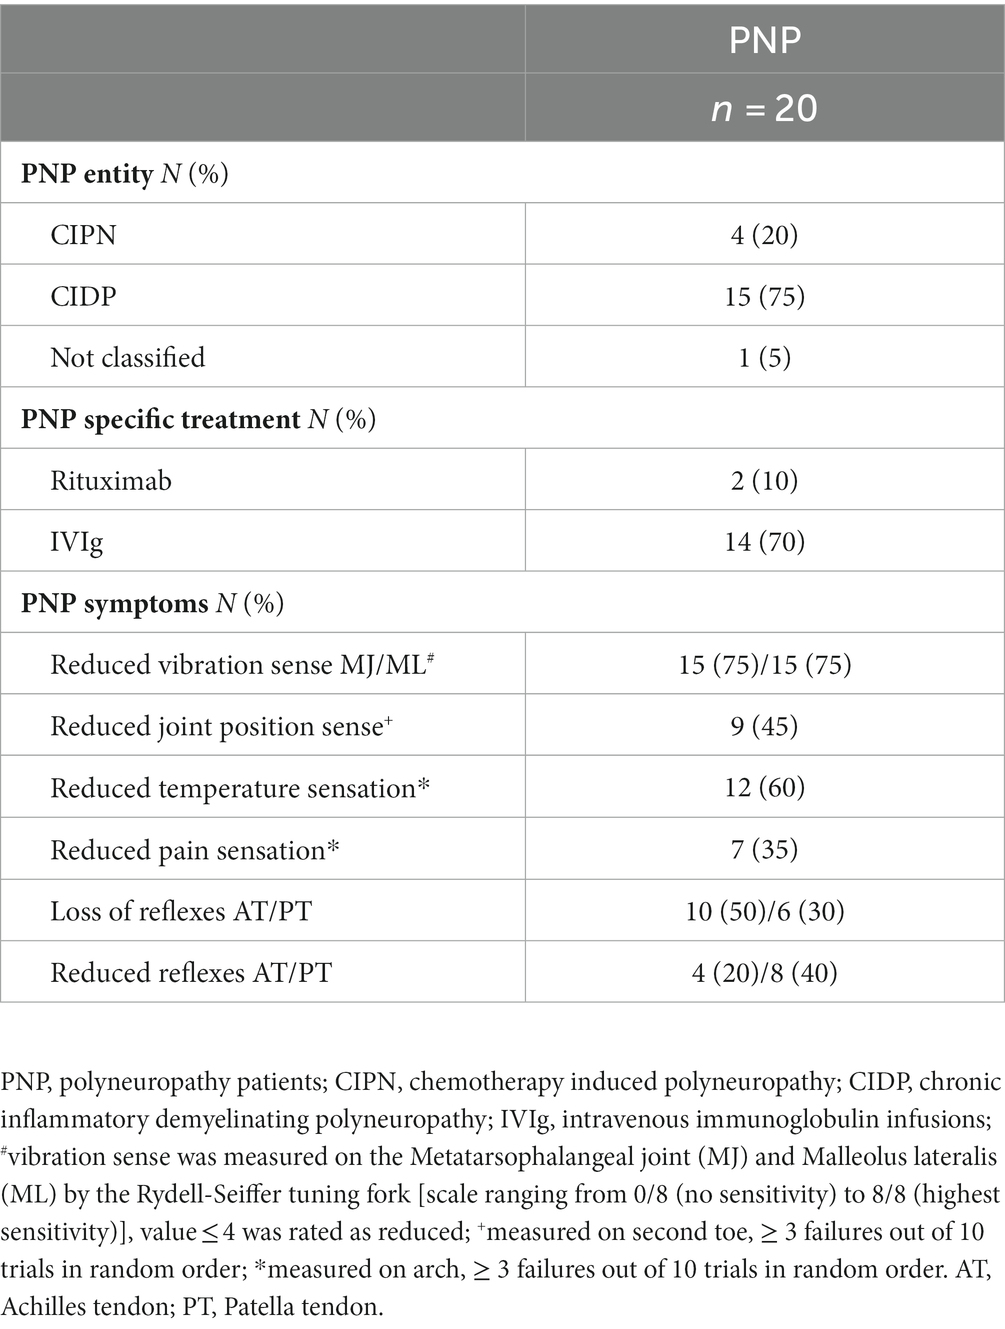
Table 2. PNP-specific characteristics.
3.1. TUG times and TUG-related gait parameters
PNP patients performed slower across all TUG conditions than their matched CG: The PNP group needed more time to complete TUG (4.2 s at preferred, 2.8 s at dual-task, and 1.7 s at fast condition), walked slower (29 cm/s slower gait speed at preferred, 14.8 cm/s at dual-task, and 14.1 cm/s at fast condition) with prolonged step time (5% at preferred, 6% at dual-task, and 6% at fast condition). Patients also took shorter steps during preferred (5.2 cm) and dual-task (5.1 cm) walking, while in the fast condition, the step lengths differed marginally (2.1 cm) (Table 3).
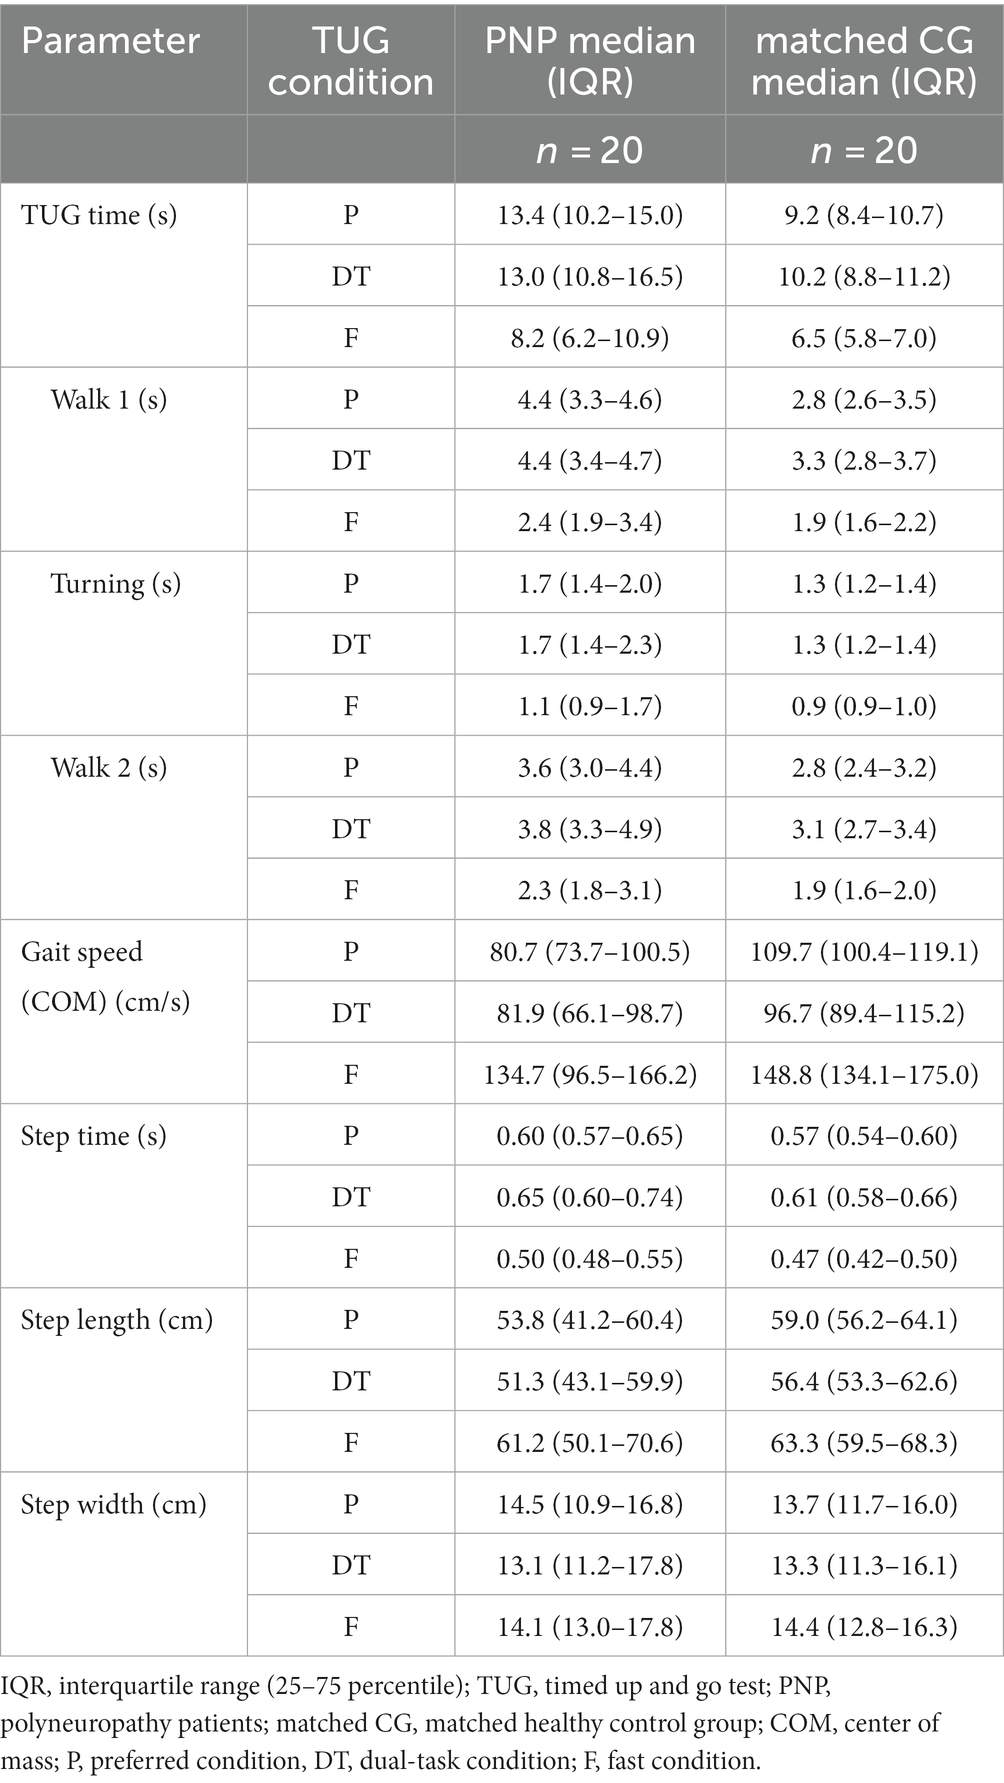
Table 3. Descriptive illustration of the TUG parameters for the different TUG conditions of polyneuropathy patients (PNP) and matched control group (CG).
We detected significant group effects for all TUG times (overall, walk 1, walk 2, turning) and the TUG-related gait parameters gait speed, step time, and length (p < 0.001 respectively), except for step width (p = 0.568). The TUG condition showed a significant effect on all TUG parameters (excluding step width). Post-hoc tests revealed a significant difference between fast and preferred and between fast and dual-task conditions for all TUG parameters (p < 0.001). The step time, additionally, differed between preferred and dual-task (p < 0.001). We found no interaction between group designation and TUG condition (Table 4).
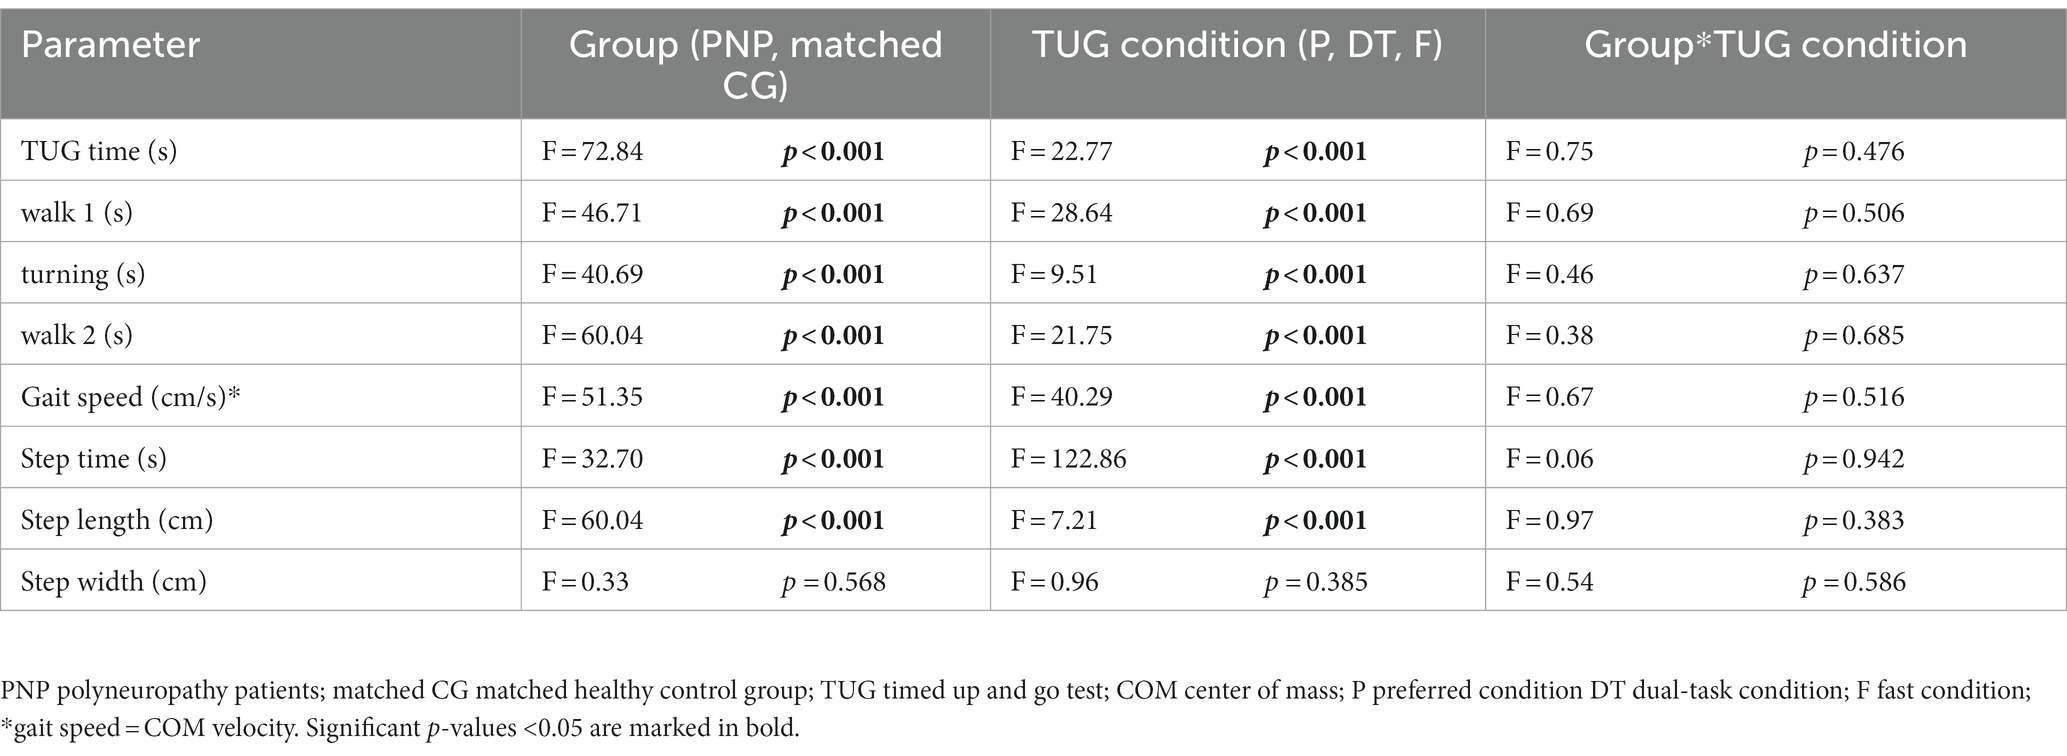
Table 4. Repeated measures ANOVA results for TUG times and TUG-related gait parametersPL.
3.2. Joint velocities
Analysis of joint velocities (MANOVA) revealed a significant influence of the factors group designation (PNP, CG; F = 123.9, p < 0.001, η2 = 0.266, Figures 1A, B), joint (wrist, elbow, shoulder, hip, knee, ankle; F = 1152.6, p < 0.001, η2 = 0.944, Figure 1A), and TUG condition (preferred, dual-task, fast; F = 218.1, p < 0.001, η2 = 0.561, Figure 1B).
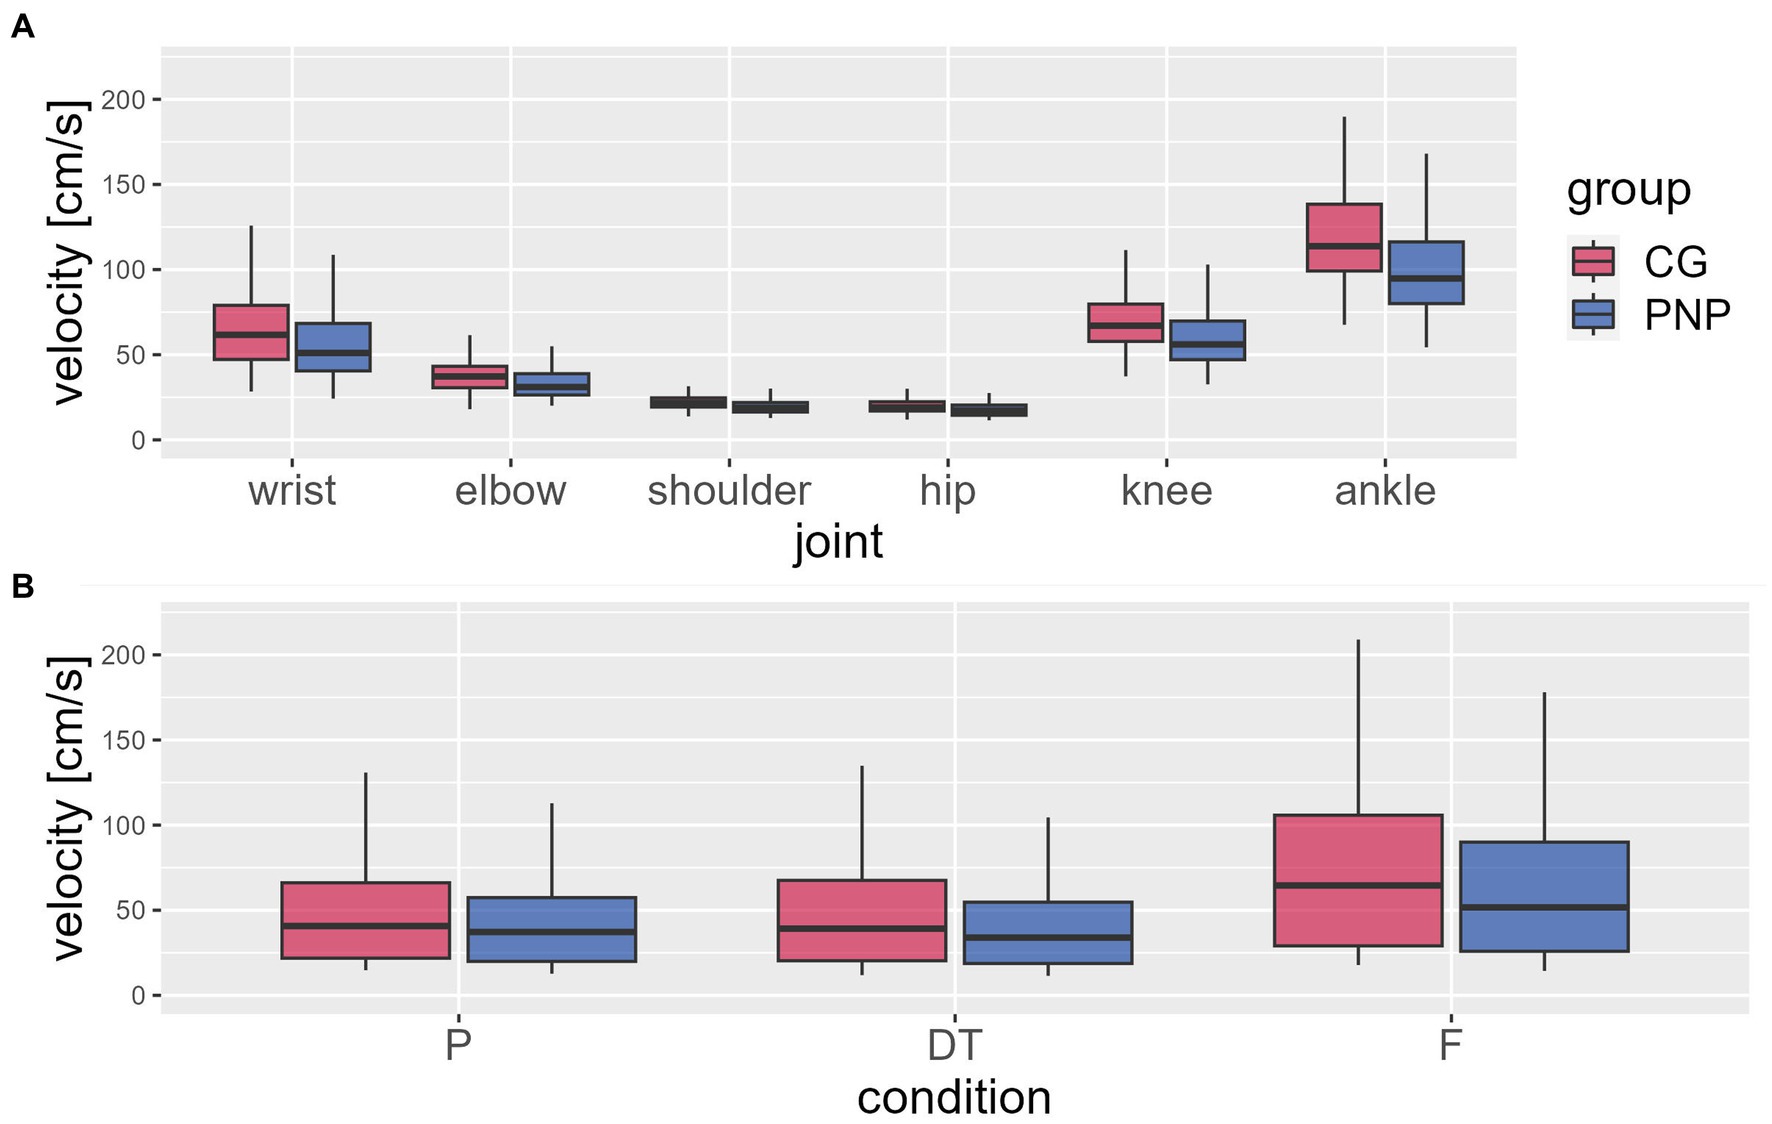
Figure 1. Mean joint velocities. The figure shows the mean joint velocities relative to the center of mass (in body coordinates) (y-axis) extracted from the waking sequences during the timed up and go test (TUG) per group [CG (red), control group; PNP (blue), patients with peripheral neuropathy]: (A) average value per joint (x-axis) across all conditions and (B) per condition (P, preferred; DT, dual-task; F, fast condition) across joints. Boxplots showing the lower quartile (25th percentile), median (50th percentile), upper quartile (75th percentile), and degree of dispersion as 95% confidence interval (95% CI) (whiskers).
The PNP group revealed a significantly slower velocity than CG (−7.9 cm/s, 95%CI −9.1 to −6.6) across all conditions and joints. No group interaction was found for either joint or TUG condition (Figure 1B).
Velocities varied depending on joints (across groups and conditions), with higher velocities at distal joints compared to proximal joints (Figure 1A). For example, the ankle, the most distal joint in this analysis, displayed 80% higher velocity than the hip, the most proximal joint (Figure 1A). Post-hoc-test of joint velocities revealed significant differences in all pairwise joint comparisons (p ≤ 0.001) except for the comparison of knee and wrist (p = 0.082) (See Table 5).
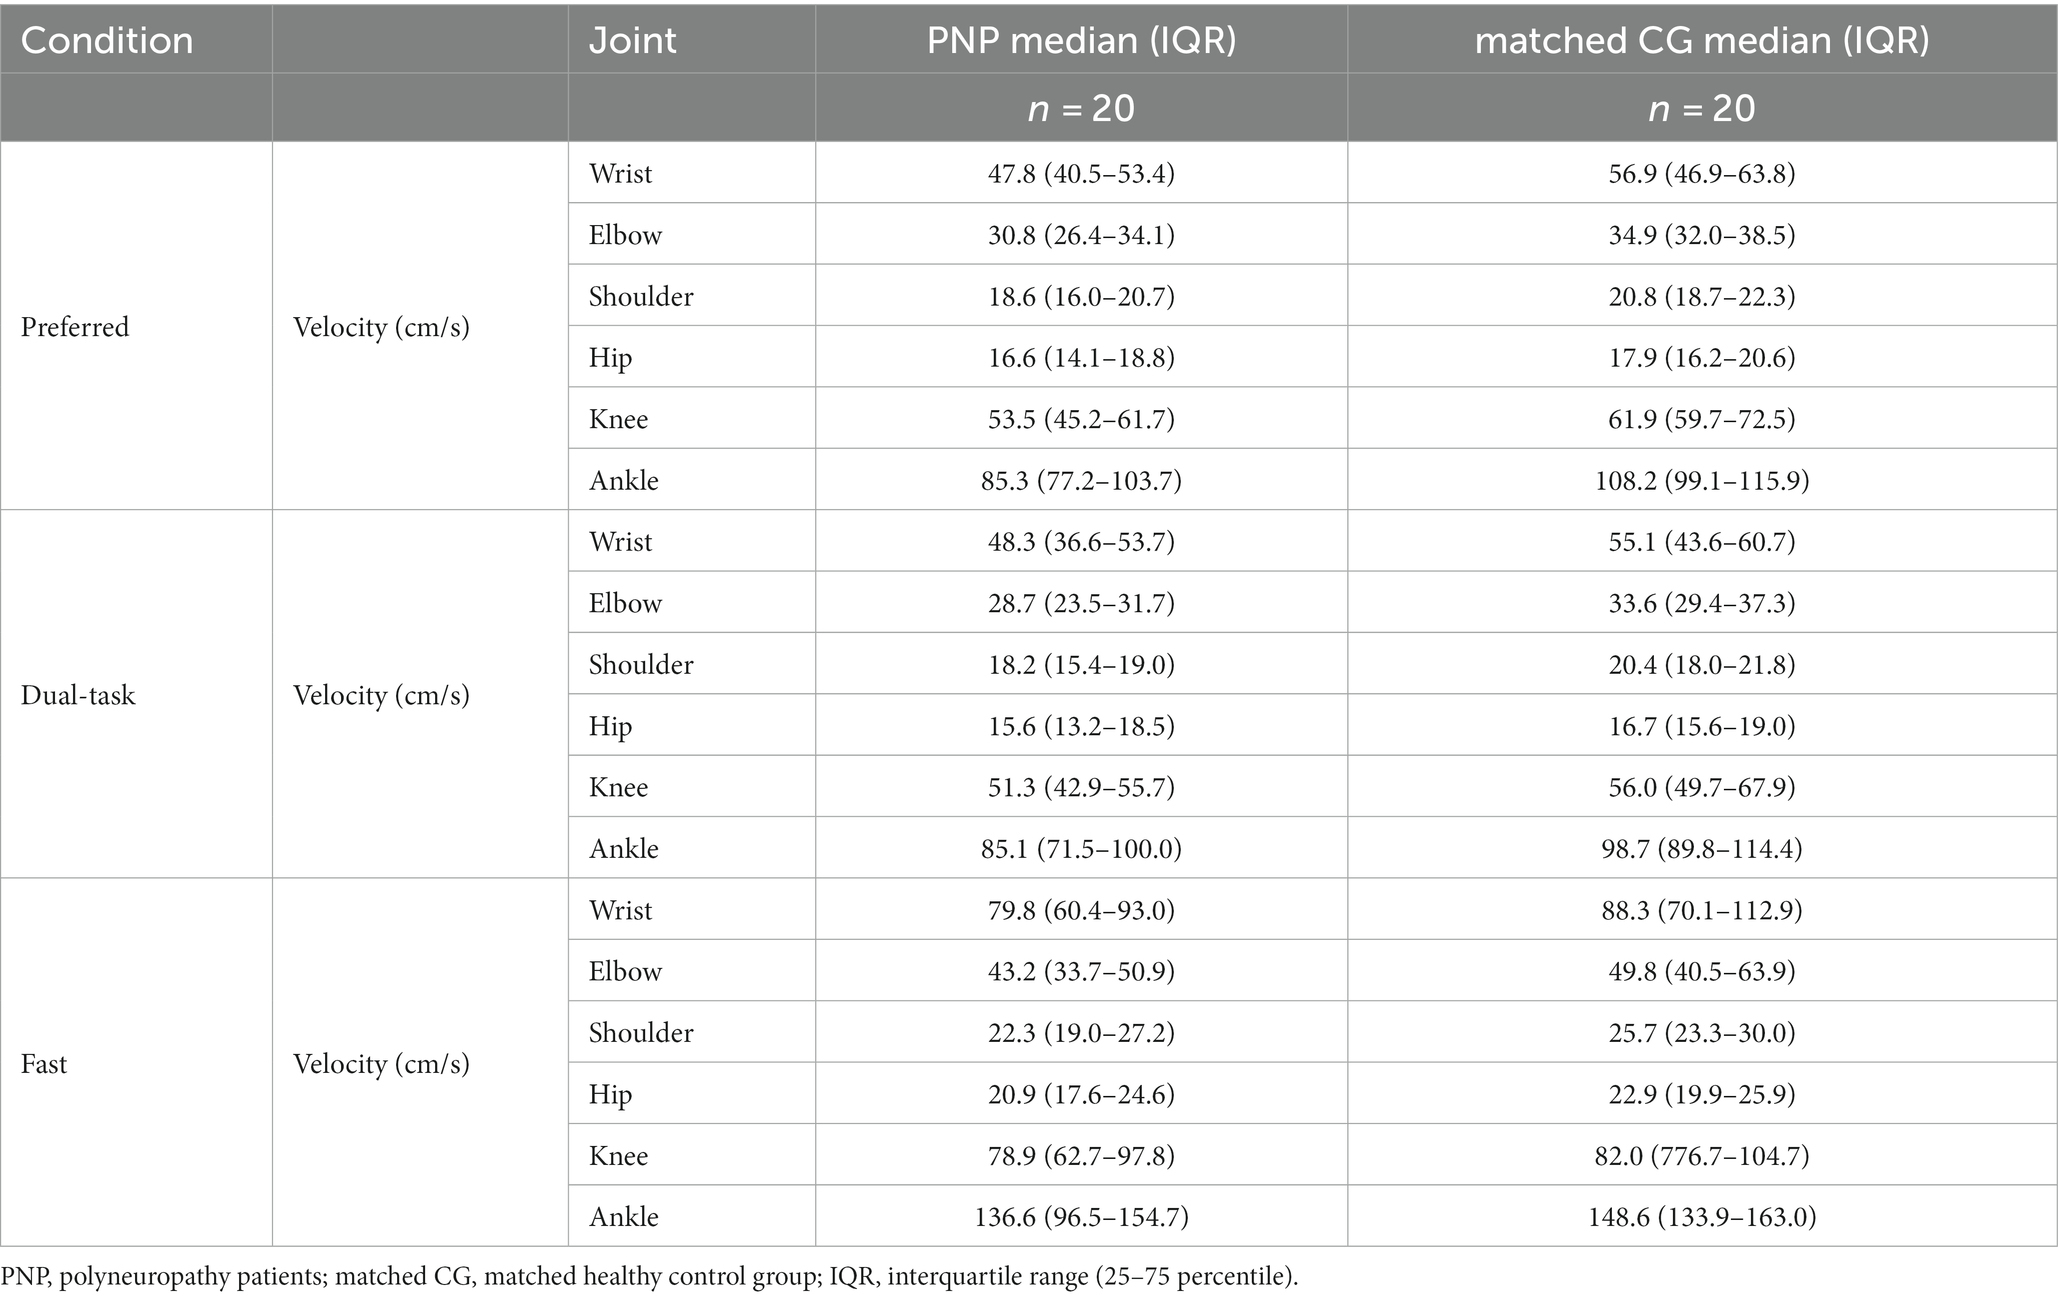
Table 5. Joint velocities of PNP and matched CG in body coordinates relative to COM.
Velocities varied depending on the TUG condition (across groups and joints): the fast condition revealed higher velocities than the preferred (20.7 cm/s, 95%CI 17.9–23.5, p < 0.001) and dual-task condition (23.4 cm/s, 95%CI 20.6–26.2, p < 0.001), moreover, the preferred condition revealed higher velocities than the dual-task condition (p = 0.012) (Figure 1B).
3.3. Correlation analysis
Correlation analysis between gait speed (COM velocity) and all joint velocities within groups revealed that joint velocities and gait speed are positively interrelated in individual subjects (Figure 2A, exemplarily for ankle and hip velocities, see Supplementary Figure S1 for all joint velocities) with a 0.87 mean velocity ratio between groups (Figure 2B). This means that PNP joint velocities are 13% slower than the CG’s regardless of joint and condition.
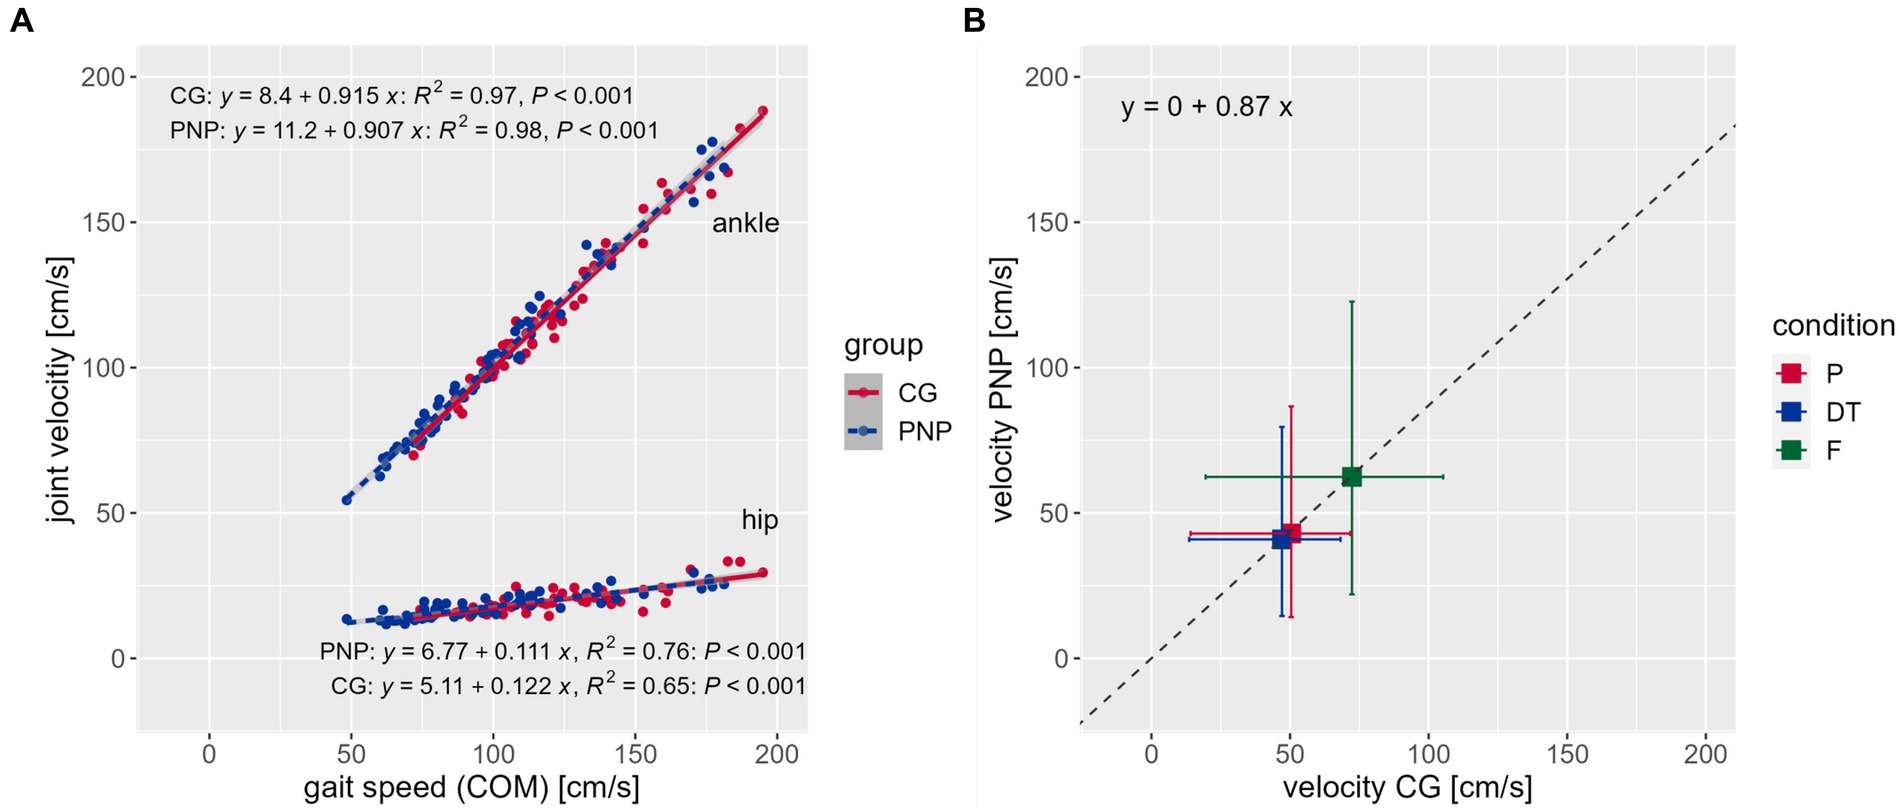
Figure 2. Correlations. (A) Correlations between the center of mass (COM) representing gait speed (x-axis) and joint velocity (y-axis) across conditions exemplarily for the ankle (top) and hip (bottom) joint velocities per group [CG (red), control group; PNP (blue), patients with peripheral neuropathy], including the regression equation, R-squared and value of p, respectively. (B) Displays the mean velocity ratio of 0.87 between groups (see regression equation). Boxes and whiskers show the mean velocities (box) and standard deviation [horizontal whiskers for CG, vertical whiskers for PNP) of the CG (x-axis) against the PNP group (y-axis) per condition (P (red), preferred; DT (blue), dual-task; F (green), fast condition] across joints.
Our PNP correlation analysis showed that the overall velocity ratio correlated negatively with the fear of falling (FES-I, r2 = −0.636, p = 0.003) and positively with mobility performance (Tinetti POMA, r2 = 0.583, p = 0.007). Hip, knee, and ankle ratios correlated positively with self-reported maximum walking distance (hip, r2 = 0.562, p = 0.010; knee, r2 = 0.575, p = 0.008; ankle, r2 = 0.556, p = 0.011), while the overall velocity ratio did not correlate significantly (velocity ratio, r2 = 0.401, p = 0.080). This indicates that a stronger fear of falling and poorer mobility were associated with a slower gait speed in the patient group (Supplementary Figure S2).
4. Discussion
The main objective of the present study was to analyze the motion patterns of PNP patients along the body axis for a deeper understanding of altered motion behavior caused by PNP. We assessed PNP patients’ performance in a clinically relevant functional test, i.e., the Timed-Up-and-Go test (TUG), by comparing gait-related parameters and joint-velocity profiles across the whole body to a group of matched healthy individuals. As hypothesized, PNP patients performed TUG slower than the control group during all test conditions, i.e., at preferred and fast movement speed and while executing a cognitive task (dual-task condition). More specifically, we found a PNP-related slowed gait pattern during TUG execution determined by reduced gait speed, shorter steps, and prolonged step time, as well as lower mean velocities in all other measured body joints. Interestingly, the slowing factor of PNP patients’ joint velocities was independent of the respective joint and, therefore, individual mean joint velocity, which tends to vary across the body. Moreover, this factor applied to each TUG condition similarly and amounted, on average, to 0.87 compared to the healthy control group.
As expected, PNP patients’ overall TUG performance fell below that of the healthy control group across all conditions. Patients needed approximately 20% more time to complete TUG independently of the test condition. By extracting gait-related parameters, we detected a slowed walking pattern in PNP (preferred: 80.7 cm/s; fast: 134.7 cm/s) compared to the CG (preferred: 109.7 cm/s; fast: 148.8 cm/s) determined by shorter steps (preferred: 54 cm vs. 59 cm) and prolonged step time (preferred: 0.60 s vs. 0.57 s). These results concur with other studies investigating PNP-related gait impairments (Fernando et al., 2013; Wuehr et al., 2014; Marshall et al., 2017), identifying 139 cm/s for fast walking (Wuehr et al., 2014), and 93–110 cm/s for preferred walking in PNP patients (Menz et al., 2004; Wuehr et al., 2014; Marshall et al., 2017). In contrast to other studies (Petrofsky et al., 2005; Brach et al., 2008; Wuehr et al., 2014; Brown et al., 2015), we failed to observe a wider gait base in PNP patients than in healthy individuals. Basically, the TUG condition significantly affected TUG performance in both groups in a similar way but at a different speed level.
These findings also apply to joint velocity profiles in PNP compared to CG. As with gait-related parameters, we used the walking sequences of the TUG to extract the mean joint velocities of ankles, knees, hips, shoulders, elbows, and wrists in body coordinates, respectively. Across the whole body, PNP patients reduced, on average, their joint velocities with a factor of 0.87 compared to CG. Interestingly, the velocity reductions occurred independently of the respective joint or test condition. This means that in each of the three test conditions, the average joint velocity of each joint was reduced by 13% in PNP patients compared to healthy individuals. Furthermore, joint velocities (of PNP and CG) were in a linear relationship to each other, and gait speed (COM velocity in space) referred to the respective test condition (Figure 2B). We deduce that despite PNP-related slowing, patients maintained movement patterns in terms of velocity distributions across joints similarly to healthy individuals.
PNP affects the peripheral nerves in a distal symmetric distribution that results in impaired somatosensory information. Especially proprioceptive feedback is essential for posture stability (Dietz, 2002) as proprioceptors provide continuous feedback about joint positions and velocity, thus facilitating our orientation in space with respect to the ground and the different body segments (Lackner and DiZio, 2005; Shaffer and Harrison, 2007). The proprioceptors’ signal carries velocity information relying on changes in lengths (tendons or muscles) or the joint angles that are primarily used to control motion accurately (Allum et al., 1998; Dietz, 2002; Masani et al., 2003; Shaffer and Harrison, 2007). Because of their proprioceptive deficit, PNP patients often suffer from postural instability, which manifests in balance problems (Horlings et al., 2008; Sawacha et al., 2009; Brown et al., 2015; Kneis et al., 2016, 2020b; Mustapa et al., 2016) and gait disturbances (Allet et al., 2008; Sawacha et al., 2009; Shin et al., 2021) and may raise the risk of falls (Stolze et al., 2004; Allet et al., 2008). Patients often experience a loss of muscular strength also due to the PNP-induced impaired sensorimotor interplay (Andreassen et al., 2006; Martinelli et al., 2013; Ferreira et al., 2017). A slower gait speed, including shorter steps and longer step times, may thus become manifest from a diminished propulsion capacity, but it may also follow PNP’s safety management (Dingwell et al., 2000; Mustapa et al., 2016; Findling et al., 2018). Slower, shorter steps imply a relatively higher proportion of the double support phase associated with greater stability (Williams and Martin, 2019). Vice versa, minimizing the support surface during the single-leg stance phase requires more effort to maintain balance, thus challenging the postural system (Williams and Martin, 2019). Furthermore, reducing movement speed may give patients more time to generate an adequate response (Williams and Martin, 2019) and thus contribute to movement accuracy despite the proprioceptive deficit. We are assuming that PNP patients’ slower gait implies the slowdown of upper limbs’ joint velocities according to the hypothesis of strong linear velocity interlimb coupling (Orsal et al., 1990). As mentioned above, our PNP patients showed velocity distributions across joints resembling those of healthy individuals, which corresponds to the manifestation of PNP-induced nerve damage -that is, the symmetrical pattern across extremities.
Despite PNP patients’ reduced overall velocity, we conclude that velocity control mechanisms are largely intact in PNP (Zehr and Duysens, 2004; Meyns et al., 2013). We even propose that slowing movement velocity is potentially a secondary compensatory safety strategy rather than one triggered by the primary physiological deficit. We base this assumption on the fact that our PNP patients were able to adjust their movement speed situationally like healthy individuals but move within a lower individual speed zone. For example, patients increased their movement speed when asked to, as in the fast TUG condition. Furthermore, the concurrent execution of a cognitive task led to the slowing down of movements in PNP to the same extent as in healthy individuals, but again at a lower level. There is evidence that multi-task conditions require an allocation of attentional resources to each task that often results in slowed movement speed (Hausdorff et al., 2008; Montero-Odasso et al., 2012). In general, PNP patients may require greater effort in order to allocate more cognitive resources than healthy individuals to generate well-coordinated movements despite their PNP-related impairments (Courtemanche et al., 1996). We, therefore, suggest that PNP patients scale their postural control strategy along with the quality of the sensory signals they receive. This supposition is supported by findings of studies addressing stance control in PNP patients. We found that the postural behavior of PNP patients is modifiable by an exercise intervention; that people with PNP performed a sensory reweighting and an adjustment of velocity control towards the postural behavior of healthy individuals (Kneis et al., 2019, 2020b).
Our assumption of PNP patients’ preventive safety strategy is highlighted by the correlation between their individual slowing factor with their fear of falling (FES-I), mobility performance (Tinetti POMA), and self-reported maximum walking distance. We suggest that the individual slowing factor measures the degree of PNP mobility impairment.
5. Limitations
The 3-meter walking sequences of the TUG test cover a relatively short distance for gait analysis, encompassing both acceleration and deceleration phases. While we obtained plausible values for the extracted gait parameters, our experimental setup did not adhere to common guidelines for gait analysis. Specifically, it deviated from the standard practice of continuous walking over a minimum distance of 10 to 20 strides, as outlined in the literature (Hollman et al., 2010, 2011). Furthermore, our step detection methodology relied on velocity thresholds derived from our own validation work, rather than direct force plate measurements, which are considered the gold standard (Bilney et al., 2003; Steinert et al., 2019). These factors, coupled with the limited sample size, emphasize the exploratory nature of our research, and underscore the need for a cautious interpretation of the results. The diagnostic utility of the TUG test lies in its multidimensional assessment of functional performance. However, in this study, we deliberately focused only on the walking sequence of the TUG test, excluding other motion tasks such as standing up, turning, and sitting down. These additional sequences are vital for a comprehensive understanding of the significance of the TUG test. In the future, we plan to incorporate these sequences into our motion analysis. Moreover, we will also extract additional biomechanical parameters such as joint torques and moments, offering a more comprehensive view of motor behavior during the TUG test.
6. Conclusion
Our results indicate that PNP patients reduce all their mean joint velocities similarly, resulting in a patient-specific slowness factor (on average 13%) compared to healthy individuals, regardless of joint or condition. This slowing of all joints in body coordinates correlates strongly with the individual gait speed in space coordinates (COM velocity). We assume that this global slowing is caused by the reduced quality of proprioceptive signals. We maintain that PNP patients’ altered gait, as assessed by mean absolute joint velocities, is not only determined by the obvious balance requirements leading to smaller and slower steps but that it results from a shift in general speed of an otherwise undisturbed whole body motion pattern.
Data availability statement
The raw data supporting the conclusions of this article will be made available by the authors, without undue reservation.
Ethics statement
The studies involving humans were approved by Ethics Committee of the University of Freiburg, Germany. The studies were conducted in accordance with the local legislation and institutional requirements. The participants provided their written informed consent to participate in this study.
Author contributions
IW, SW, and CM drafted the manuscript and analyzed and interpreted the data. IW and CM designed the study. IW recruited patients and collected and analyzed data. VL wrote the code for MATLAB and analyzing the TUG parameters. All authors contributed to the article and approved the submitted version.
Funding
IW, SW, and CM were partially funded by the European Union’s Horizon 2020 research and innovation program (grant agreement no. 769574) and the European Union’s Horizon 2021 research and innovation program (grant agreement no. 101057747). We acknowledge the funding of the article processing charge by the Open Access Publication Fund of the University of Freiburg.
Acknowledgments
We thank all study participants. We gratefully acknowledge Sabine Ahrendt for her study assistance.
Conflict of interest
The authors declare that the research was conducted in the absence of any commercial or financial relationships that could be construed as a potential conflict of interest.
Publisher’s note
All claims expressed in this article are solely those of the authors and do not necessarily represent those of their affiliated organizations, or those of the publisher, the editors and the reviewers. Any product that may be evaluated in this article, or claim that may be made by its manufacturer, is not guaranteed or endorsed by the publisher.
Supplementary material
The Supplementary material for this article can be found online at: https://www.frontiersin.org/articles/10.3389/fnhum.2023.1229440/full#supplementary-material
References
Alam, U., Riley, D. R., Jugdey, R. S., Azmi, S., Rajbhandari, S., D’Août, K., et al. (2017). Diabetic neuropathy and gait: a review. Diabetes Ther. 8, 1253–1264. doi: 10.1007/s13300-017-0295-y
Allet, L., Armand, S., Golay, A., Monnin, D., de Bie, R. A., and de Bruin, E. D. (2008). Gait characteristics of diabetic patients: a systematic review. Diabetes Metab. Res. Rev. 24, 173–191. doi: 10.1002/dmrr.809
Allum, J. H. J., Bloem, B. R., Carpenter, M. G., Hulliger, M., and Hadders-Algra, M. (1998). Proprioceptive control of posture: a review of new concepts. Gait Posture 8, 214–242. doi: 10.1016/S0966-6362(98)00027-7
Al-Yahya, E., Dawes, H., Smith, L., Dennis, A., Howells, K., and Cockburn, J. (2011). Cognitive motor interference while walking: a systematic review and meta-analysis. Neurosci. Biobehav. Rev. 35, 715–728. doi: 10.1016/j.neubiorev.2010.08.008
Andreassen, C. S., Jakobsen, J., and Andersen, H. (2006). Muscle weakness: a progressive late complication in diabetic distal symmetric polyneuropathy. Diabetes 55, 806–812. doi: 10.2337/diabetes.55.03.06.db05-1237
Artaud, F., Singh-Manoux, A., Dugravot, A., Tzourio, C., and Elbaz, A. (2015). Decline in fast gait speed as a predictor of disability in older adults. J. Am. Geriatr. Soc. 63, 1129–1136. doi: 10.1111/jgs.13442
Bayot, M., Dujardin, K., Tard, C., Defebvre, L., Bonnet, C. T., Allart, E., et al. (2018). The interaction between cognition and motor control: a theoretical framework for dual-task interference effects on posture, gait initiation, gait and turning. Neurophysiol. Clin. 48, 361–375. doi: 10.1016/j.neucli.2018.10.003
Bilney, B., Morris, M., and Webster, K. (2003). Concurrent related validity of the GAITRite® walkway system for quantification of the spatial and temporal parameters of gait. Gait Posture 17, 68–74. doi: 10.1016/S0966-6362(02)00053-X
Brach, J. S., Talkowski, J. B., Strotmeyer, E. S., and Newman, A. B. (2008). Diabetes mellitus and gait dysfunction: possible explanatory factors. Phys. Ther. 88, 1365–1374. doi: 10.2522/ptj.20080016
Broers, M. C., Bunschoten, C., Nieboer, D., Lingsma, H. F., and Jacobs, B. C. (2019). Incidence and prevalence of chronic inflammatory demyelinating Polyradiculoneuropathy: a systematic review and Meta-analysis. Neuroepidemiology 52, 161–172. doi: 10.1159/000494291
Brown, S. J., Handsaker, J. C., Bowling, F. L., Boulton, A. J. M., and Reeves, N. D. (2015). Diabetic peripheral neuropathy compromises balance during daily activities. Diabetes Care 38, 1116–1122. doi: 10.2337/dc14-1982
Cavanagh, P. R., Derr, J. A., Ulbrecht, J. S., Maser, R. E., and Orchard, T. J. (1992). Problems with gait and posture in neuropathic patients with insulin-dependent diabetes mellitus. Diabet. Med. 9, 469–474. doi: 10.1111/j.1464-5491.1992.tb01819.x
Christopher, A., Kraft, E., Olenick, H., Kiesling, R., and Doty, A. (2019). The reliability and validity of the timed up and go as a clinical tool in individuals with and without disabilities across a lifespan: a systematic review. Disabil. Rehabil. 1–15. doi: 10.1080/09638288.2019.1682066
Courtemanche, R., Teasdale, N., Boucher, P., Fleury, M., Lajoie, Y., and Bard, C. (1996). Gait problems in diabetic neuropathic patients. Arch. Phys. Med. Rehabil. 77, 849–855. doi: 10.1016/S0003-9993(96)90269-5
Delbaere, K., Close, J. C. T., Mikolaizak, A. S., Sachdev, P. S., Brodaty, H., and Lord, S. R. (2010). The falls efficacy scale international (FES-I). A comprehensive longitudinal validation study. Age Ageing 39, 210–216. doi: 10.1093/ageing/afp225
Dietz, V. (2002). Proprioception and locomotor disorders. Nat. Rev. Neurosci. 3, 781–790. doi: 10.1038/nrn939
Dietz, V., Müller, R., and Colombo, G. (2002). Locomotor activity in spinal man: significance of afferent input from joint and load receptors. Brain 125, 2626–2634. doi: 10.1093/brain/awf273
Dingwell, J. B., and Cavanagh, P. R. (2001). Increased variability of continuous overground walking in neuropathic patients is only indirectly related to sensory loss. Gait Posture 14, 1–10. doi: 10.1016/S0966-6362(01)00101-1
Dingwell, J. B., Cusumano, J. P., Sternad, D., and Cavanagh, P. R. (2000). Slower speeds in patients with diabetic neuropathy lead to improved local dynamic stability of continuous overground walking. J. Biomech. 33, 1269–1277. doi: 10.1016/S0021-9290(00)00092-0
Fernando, M., Crowther, R., Lazzarini, P., Sangla, K., Cunningham, M., Buttner, P., et al. (2013). Biomechanical characteristics of peripheral diabetic neuropathy: a systematic review and meta-analysis of findings from the gait cycle, muscle activity and dynamic barefoot plantar pressure. Clin. Biomech. 28, 831–845. doi: 10.1016/j.clinbiomech.2013.08.004
Ferreira, J. P., Sartor, C. D., Leal, Â. M. O., Sacco, I. C. N., Sato, T. O., Ribeiro, I. L., et al. (2017). The effect of peripheral neuropathy on lower limb muscle strength in diabetic individuals. Clin. Biomech. Bristol Avon. 43, 67–73. doi: 10.1016/j.clinbiomech.2017.02.003
Findling, O., van der Logt, R., Nedeltchev, K., Achtnichts, L., and Allum, J. H. J. (2018). A comparison of balance control during stance and gait in patients with inflammatory and non-inflammatory polyneuropathy. PLoS One 13:e0191957. doi: 10.1371/journal.pone.0191957
Gordois, A., Scuffham, P., Shearer, A., Oglesby, A., and Tobian, J. A. (2003). The health care costs of diabetic peripheral neuropathy in the U.S. Diabetes Care 26, 1790–1795. doi: 10.2337/diacare.26.6.1790
Hafsteinsdottir, B., and Olafsson, E. (2016). Incidence and natural history of idiopathic chronic inflammatory demyelinating polyneuropathy: a population-based study in Iceland. Eur. Neurol. 75, 263–268. doi: 10.1159/000445884
Hanewinckel, R., Drenthen, J., Verlinden, V. J. A., Darweesh, S. K. L., van der Geest, J. N., Hofman, A., et al. (2017). Polyneuropathy relates to impairment in daily activities, worse gait, and fall-related injuries. Neurology 89, 76–83. doi: 10.1212/WNL.0000000000004067
Hanewinckel, R., van Oijen, M., Ikram, M. A., and van Doorn, P. A. (2016). The epidemiology and risk factors of chronic polyneuropathy. Eur. J. Epidemiol. 31, 5–20. doi: 10.1007/s10654-015-0094-6
Harsted, S., Holsgaard-Larsen, A., Hestbæk, L., Boyle, E., and Lauridsen, H. H. (2019). Concurrent validity of lower extremity kinematics and jump characteristics captured in pre-school children by a markerless 3D motion capture system. Chiropr. Man. Ther. 27:39. doi: 10.1186/s12998-019-0261-z
Hausdorff, J. M., Schweiger, A., Herman, T., Yogev-Seligmann, G., and Giladi, N. (2008). Dual task decrements in gait among healthy older adults: contributing factors. J. Gerontol. A Biol. Sci. Med. Sci. 63, 1335–1343. doi: 10.1093/gerona/63.12.1335
Hoffman, E. M., Staff, N. P, Robb, J. M., Sauver, J. L. S., Dyck, P. J., and Klein, C. J. (2015). Impairments and comorbidities of polyneuropathy revealed by population-based analyses. Neurology 84, 1644–1651. doi: 10.1212/WNL.0000000000001492
Hollman, J. H., Childs, K. B., McNeil, M. L., Mueller, A. C., Quilter, C. M., and Youdas, J. W. (2010). Number of strides required for reliable measurements of pace, rhythm and variability parameters of gait during normal and dual task walking in older individuals. Gait Posture 32, 23–28. doi: 10.1016/j.gaitpost.2010.02.017
Hollman, J. H., McDade, E. M., and Petersen, R. C. (2011). Normative spatiotemporal gait parameters in older adults. Gait Posture 34, 111–118. doi: 10.1016/j.gaitpost.2011.03.024
Hondzinski, J. M., Li, L., and Welsch, M. (2010). Age-related and sensory declines offer insight to whole body control during a goal-directed movement. Mot. Control. 14, 176–194. doi: 10.1123/mcj.14.2.176
Horlings, C. G. C., Küng, U. M., Bloem, B. R., Honegger, F., Van Alfen, N., Van Engelen, B. G. M., et al. (2008). Identifying deficits in balance control following vestibular or proprioceptive loss using posturographic analysis of stance tasks. Clin. Neurophysiol. 119, 2338–2346. doi: 10.1016/j.clinph.2008.07.221
Julious, S. A. (2005). Sample size of 12 per group rule of thumb for a pilot study. Pharm. Stat. 4, 287–291. doi: 10.1002/pst.185
Kender, Z., Groener, J. B., Jende, J. M. E., Kurz, F. T., Fleming, T., Sulaj, A., et al. (2022). Diabetic neuropathy is a generalized phenomenon with impact on hand functional performance and quality of life. Eur. J. Neurol. 29, 3081–3091. doi: 10.1111/ene.15446
Kneis, S., Straub, E., Walz, I. D., von Olshausen, P., Wehrle, A., Gollhofer, A., et al. (2020a). Gait analysis of patients after allogeneic hematopoietic cell transplantation reveals impairments of functional performance. Integr. Cancer Ther. 19:1534735420915782. doi: 10.1177/1534735420915782
Kneis, S., Wehrle, A., Dalin, D., Wiesmeier, I. K., Lambeck, J., Gollhofer, A., et al. (2020b). A new approach to characterize postural deficits in chemotherapy-induced peripheral neuropathy and to analyze postural adaptions after an exercise intervention. BMC Neurol. 20:23. doi: 10.1186/s12883-019-1589-7
Kneis, S., Wehrle, A., Freyler, K., Lehmann, K., Rudolphi, B., Hildenbrand, B., et al. (2016). Balance impairments and neuromuscular changes in breast cancer patients with chemotherapy-induced peripheral neuropathy. Clin. Neurophysiol. 127, 1481–1490. doi: 10.1016/j.clinph.2015.07.022
Kneis, S., Wehrle, A., Müller, J., Maurer, C., Ihorst, G., Gollhofer, A., et al. (2019). It’s never too late – balance and endurance training improves functional performance, quality of life, and alleviates neuropathic symptoms in cancer survivors suffering from chemotherapy-induced peripheral neuropathy: results of a randomized controlled trial. BMC Cancer 19, 1–11. doi: 10.1186/s12885-019-5522-7
Kuhner, A., Schubert, T., Maurer, C., and Burgard, W. (2017). An online system for tracking the performance of Parkinson’s patients. In 2017 IEEE/RSJ international conference on intelligent robots and systems (IROS), 1664–1669.
Lackner, J. R., and DiZio, P. (2005). Vestibular, proprioceptive, and haptic contributions to spatial orientation. Annu. Rev. Psychol. 56, 115–147. doi: 10.1146/annurev.psych.55.090902.142023
Liniger, C., Albeanu, A., Bloise, D., and Assal, J. P. (1990). The tuning fork revisited. Diabet. Med. J. Br. Diabet. Assoc. 7, 859–864. doi: 10.1111/j.1464-5491.1990.tb01319.x
Marshall, T. F., Zipp, G. P., Battaglia, F., Moss, R., and Bryan, S. (2017). Chemotherapy-induced-peripheral neuropathy, gait and fall risk in older adults following cancer treatment. J. Cancer Res. Pract. 4, 134–138. doi: 10.1016/j.jcrpr.2017.03.005
Martinelli, A. R., Mantovani, A. M., Nozabieli, A. J. L., Ferreira, D. M. A., Barela, J. A., Camargo, M. R., et al. (2013). Muscle strength and ankle mobility for the gait parameters in diabetic neuropathies. Foot 23, 17–21. doi: 10.1016/j.foot.2012.11.001
Masani, K., Popovic, M. R., Nakazawa, K., Kouzaki, M., and Nozaki, D. (2003). Importance of body sway velocity information in controlling ankle extensor activities during quiet stance. J. Neurophysiol. 90, 3774–3782. doi: 10.1152/jn.00730.2002
Mengel, D., Fraune, L., Sommer, N., Stettner, M., Reese, J. P., Dams, J., et al. (2018). Costs of illness in chronic inflammatory demyelinating polyneuropathy in Germany. Muscle Nerve 58, 681–687. doi: 10.1002/mus.26315
Menz, H. B., Lord, S. R., St George, R., and Fitzpatrick, R. C. (2004). Walking stability and sensorimotor function in older people with diabetic peripheral neuropathy11No commercial party having a direct financial interest in the results of the research supporting this article has or will confer a benefit upon the authors(s) or upon any organization with which the author(s) is/are associated. Arch. Phys. Med. Rehabil. 85, 245–252. doi: 10.1016/j.apmr.2003.06.015
Meyns, P., Bruijn, S. M., and Duysens, J. (2013). The how and why of arm swing during human walking. Gait Posture 38, 555–562. doi: 10.1016/j.gaitpost.2013.02.006
Middleton, A., Fritz, S. L., and Lusardi, M. (2015). Walking speed: the functional vital sign. J. Aging Phys. Act. 23, 314–322. doi: 10.1123/japa.2013-0236
Montero-Odasso, M., and Hachinski, V. (2014). Preludes to brain failure: executive dysfunction and gait disturbances. Neurol. Sci. 35, 601–604. doi: 10.1007/s10072-013-1613-4
Montero-Odasso, M., Verghese, J., Beauchet, O., and Hausdorff, J. M. (2012). Gait and cognition: a complementary approach to understanding brain function and the risk of falling. J. Am. Geriatr. Soc. 60, 2127–2136. doi: 10.1111/j.1532-5415.2012.04209.x
Mustapa, A., Justine, M., Mohd Mustafah, N., Jamil, N., and Manaf, H. (2016). Postural control and gait performance in the diabetic peripheral neuropathy: a systematic review. Biomed. Res. Int. 2016:e9305025. doi: 10.1155/2016/9305025
Orsal, D., Cabelguen, J. M., and Perret, C. (1990). Interlimb coordination during fictive locomotion in the thalamic cat. Exp. Brain Res. 82, 536–546. doi: 10.1007/BF00228795
Pearcey, G. E. P., and Zehr, E. P. (2019). We are upright-walking cats: human limbs as sensory antennae during locomotion. Physiology 34, 354–364. doi: 10.1152/physiol.00008.2019
Pearson, K. G. (2004). “Generating the walking gait: role of sensory feedback,” in Progress in Brain Research Brain Mechanisms for the Integration of Posture and Movement. eds. S. Mori, D. G. Stuart, and M. Wiesendanger (Heidelberg: Elsevier), 123–129.
Perera, S., Patel, K. V., Rosano, C., Rubin, S. M., Satterfield, S., Harris, T., et al. (2016). Gait speed predicts incident disability: a pooled analysis. J. Gerontol. A Biol. Sci. Med. Sci. 71, 63–71. doi: 10.1093/gerona/glv126
Pestronk, A., Florence, J., Levine, T., Al-Lozi, M. T., Lopate, G., Miller, T., et al. (2004). Sensory exam with a quantitative tuning fork: rapid, sensitive and predictive of SNAP amplitude. Neurology 62, 461–464. doi: 10.1212/01.WNL.0000106939.41855.36
Petrofsky, J., Lee, S., and Bweir, S. (2005). Gait characteristics in people with type 2 diabetes mellitus. Eur. J. Appl. Physiol. 93, 640–647. doi: 10.1007/s00421-004-1246-7
Pike, C. T., Birnbaum, H. G., Muehlenbein, C. E., Pohl, G. M., and Natale, R. B. (2012). Healthcare costs and workloss burden of patients with chemotherapy-associated peripheral neuropathy in breast, ovarian, head and neck, and nonsmall cell lung cancer. Chemother. Res. Pract. 2012:913848. doi: 10.1155/2012/913848
Pirker, W., and Katzenschlager, R. (2017). Gait disorders in adults and the elderly. Wien. Klin. Wochenschr. 129, 81–95. doi: 10.1007/s00508-016-1096-4
Podsiadlo, D., and Richardson, S. (1991). The timed “up & go”: a test of basic functional mobility for frail elderly persons. J. Am. Geriatr. Soc. 39, 142–148.
Richardson, J. K., and Hurvitz, E. A. (1995). Peripheral neuropathy: a true risk factor for falls. J. Gerontol. A Biol. Sci. Med. Sci. 50, M211–M215. doi: 10.1093/gerona/50a.4.m211
Rotta, F. T., Sussman, A. T., Bradley, W. G., Ram Ayyar, D., Sharma, K. R., and Shebert, R. T. (2000). The spectrum of chronic inflammatory demyelinating polyneuropathy. J. Neurol. Sci. 173, 129–139. doi: 10.1016/S0022-510X(99)00317-2
Salarian, A., Horak, F. B., Zampieri, C., Carlson-Kuhta, P., Nutt, J. G., and Aminian, K. (2010). iTUG, a sensitive and reliable measure of mobility. IEEE Trans. Neural Syst. Rehabil. Eng. 18, 303–310. doi: 10.1109/TNSRE.2010.2047606
Sawacha, Z., Gabriella, G., Cristoferi, G., Guiotto, A., Avogaro, A., and Cobelli, C. (2009). Diabetic gait and posture abnormalities: a biomechanical investigation through three dimensional gait analysis. Clin. Biomech. 24, 722–728. doi: 10.1016/j.clinbiomech.2009.07.007
Schmider, E., Ziegler, M., Danay, E., Beyer, L., and Bühner, M. (2010). Is it really robust? Reinvestigating the robustness of ANOVA against violations of the normal distribution assumption. Methodol. Eur. J. Res. Methods Behav. Soc. Sci. 6, 147–151. doi: 10.1027/1614-2241/a000016
Schniepp, R., Möhwald, K., and Wuehr, M. (2019). Clinical and automated gait analysis in patients with vestibular, cerebellar, and functional gait disorders: perspectives and limitations. J. Neurol. 266, 118–122. doi: 10.1007/s00415-019-09378-x
Shaffer, S. W., and Harrison, A. L. (2007). Aging of the somatosensory system: a translational perspective. Phys. Ther. 87, 193–207. doi: 10.2522/ptj.20060083
Shin, K. J., Kang, J. W., Sung, K. H., Park, S. H., Kim, S. E., Park, K. M., et al. (2021). Quantitative gait and postural analyses in patients with diabetic polyneuropathy. J. Diabetes Complicat. 35:107857. doi: 10.1016/j.jdiacomp.2021.107857
Steinert, A., Sattler, I., Otte, K., Röhling, H., Mansow-Model, S., and Müller-Werdan, U. (2019). Using new camera-based Technologies for Gait Analysis in older adults in comparison to the established GAITRite system. Sensors 20:125. doi: 10.3390/s20010125
Stolze, H., Klebe, S., Zechlin, C., Baecker, C., Friege, L., and Deuschl, G. (2004). Falls in frequent neurological diseases--prevalence, risk factors and aetiology. J. Neurol. 251, 79–84. doi: 10.1007/s00415-004-0276-8
Studenski, S., Perera, S., Patel, K., Rosano, C., Faulkner, K., Inzitari, M., et al. (2011). Gait speed and survival in older adults. JAMA 305, 50–58. doi: 10.1001/jama.2010.1923
Tinetti, M. E. (1986). Performance-oriented assessment of mobility problems in elderly patients. J. Am. Geriatr. Soc. 34, 119–126.
Wannier, T., Bastiaanse, C., Colombo, G., and Dietz, V. (2001). Arm to leg coordination in humans during walking, creeping and swimming activities. Exp. Brain Res. 141, 375–379. doi: 10.1007/s002210100875
Williams, D. S., and Martin, A. E. (2019). Gait modification when decreasing double support percentage. J. Biomech. 92, 76–83. doi: 10.1016/j.jbiomech.2019.05.028
Win, M. M. T. M., Fukai, K., Nyunt, H. H., Hyodo, Y., and Linn, K. Z. (2019). Prevalence of peripheral neuropathy and its impact on activities of daily living in people with type 2 diabetes mellitus. Nurs. Health Sci. 21, 445–453. doi: 10.1111/nhs.12618
Wuehr, M., Schniepp, R., Schlick, C., Huth, S., Pradhan, C., Dieterich, M., et al. (2014). Sensory loss and walking speed related factors for gait alterations in patients with peripheral neuropathy. Gait Posture 39, 852–858. doi: 10.1016/j.gaitpost.2013.11.013
Keywords: motor control, gait, polyneuropathy, instrumented timed-up-and-go, TUG, joint velocity, whole-body motion capture
Citation: Walz ID, Waibel S, Lippi V, Kammermeier S, Gollhofer A and Maurer C (2023) “PNP slows down” – linearly-reduced whole body joint velocities and altered gait patterns in polyneuropathy. Front. Hum. Neurosci. 17:1229440. doi: 10.3389/fnhum.2023.1229440
Edited by:
Jia Han, Shanghai University of Medicine and Health Sciences, ChinaReviewed by:
Jan M. Hondzinski, Louisiana State University, United StatesLijiang Luan, Shanghai University of Sport, China
Copyright © 2023 Walz, Waibel, Lippi, Kammermeier, Gollhofer and Maurer. This is an open-access article distributed under the terms of the Creative Commons Attribution License (CC BY). The use, distribution or reproduction in other forums is permitted, provided the original author(s) and the copyright owner(s) are credited and that the original publication in this journal is cited, in accordance with accepted academic practice. No use, distribution or reproduction is permitted which does not comply with these terms.
*Correspondence: Christoph Maurer, Y2hyaXN0b3BoLm1hdXJlckB1bmlrbGluaWstZnJlaWJ1cmcuZGU=