 Hana Kim
 Jessica Obermeyer
 Robert W. Wiley
- 1Department of Communication Sciences and Disorders, University of South Florida, Tampa, FL, United States
- 2Department of Neurology, The Johns Hopkins University School of Medicine, Baltimore, MD, United States
- 3Department of Communication Sciences and Disorders, University of North Carolina at Greensboro, Greensboro, NC, United States
- 4Department of Psychology, University of North Carolina at Greensboro, Greensboro, NC, United States
Purpose: We aimed to perform the first review of research focusing on written discourse performance in people with acquired neurogenic communication disorders. In studies from 2000 onward, we specifically sought to determine: (1) the differences between patient populations and control groups, (2) the differences between different patient populations, (3) longitudinal differences between patient populations, and (4) modality differences between spoken and written discourse performance.
Methods: We completed a thorough search on MEDLINE, Embase, Cochrane, APAPsycinfo, Web of Science, and Scopus databases. We identified studies that focus on written discourse performance in people with aphasia, primary progressive aphasia, mild cognitive impairment, and Alzheimer’s disease.
Results: Nineteen studies were identified from the review of literature, some of which addressed more than one of our review questions. Fifteen studies included a comparison between clinical populations and controls. Six studies compared different characteristics of patient populations. Three studies reported changes over time in progressive disorders. Six studies targeted different modalities of discourse.
Conclusion: Differences in linguistic features by patient populations are not yet clear due to the limited number of studies and different measures and tasks used across the studies. Nevertheless, there is substantial evidence of numerous linguistic features in acquired neurogenic communication disorders that depart from those of healthy controls. Compared to the controls, people with aphasia tend to produce fewer words, and syntactically simpler utterances compared to the controls. People with Alzheimer’s disease produce less information content, and this feature increases over time, as reported in longitudinal studies. Our review imparts additional information that written and spoken discourse provide unique insights into the cognitive and linguistic deficits experienced by people with aphasia, Alzheimer’s disease, mild cognitive impairment and primary progressive aphasia and provide targets for treatment to improve written communication in these groups.
1 Introduction
Writing plays an essential role in everyday communication. Traditionally, people use writing in a variety of situations, such as writing letters and making lists (Ball and Postman, 2022). Much of the writing that is required for daily communication happens at the discourse level (e.g., emails, electronic messaging, notes), which is defined as language production via speaking or writing (handwriting or typing) beyond the phrase level (Ulatowska and Olness, 2004). Advances in technology mean that writing has become the primary medium of communication through mobile technologies and the internet. However, writing is inherently complicated with the integration of multiple cognitive and linguistic aspects required to deliver a message (Graham et al., 2007). Due to the complexity of processing required for writing, it has been suggested that brain injuries and neurological disease often result in deficits that impact writing (Wilson and Proctor, 2002; Rapp and Fischer-Baum, 2015). Although writing is becoming more and more essential for the completion of activities of daily communication, it is underrepresented in the acquired language disorders literature especially at the discourse level. This review paper provides a summary of the existing research on written discourse in people with aphasia (PWA), primary progressive aphasia (PPA), Alzheimer’s disease (AD), and Mild Cognitive Impairment (MCI). Given the increasing importance of writing in daily life, this review provides a starting point which can inform future research and clinical practice.
Within the frame of cognitive psychology, Hayes and Flower presented a theoretical model to describe writing processes in which three recurrent phases were assumed to take place: planning, generating, and revision (Hayes and Flower, 1980). The planning phase implies writers’ ability to set goals for how to organize the knowledge in response to the topic of the writing activity, while the generating phase usually denotes the actual writing. During the revision phase, writers revisit their writing, and make changes in the text. This model highlights that all of the phases are orchestrated to accomplish written discourse with cognitive systems such as working memory. As this model suggests, written discourse represents a complex level of language production. In a recent qualitative study, eight individuals with aphasia were interviewed about their writing experience (Thiel and Conroy, 2022). Although they were generally frustrated by things like the slow progress and limited content they could produce, they felt happy when they were able to write in real-word situations (e.g., greeting cards and emails). This reflects that for writing, real-world communication is meaningful, and more functional than word-level communication.
One of the specific goals of this review paper is related to the diagnostic sensitivity of written discourse. This goal was addressed by reviewing the literature to identify documented differences in written discourse between PWA, PPA, AD, and MCI and people without acquired language disorders, as well as characteristics of discourse-level writing performance that distinguish different types of acquired language disorders. A second goal was to determine if written discourse analysis is sensitive to measuring change across time, which is especially relevant for future research on writing intervention, and to measure changes in written language in progressive acquired language disorders like AD, MCI, and PPA. We also evaluated the literature on differences between spoken and written discourse, which is relevant to how written discourse is analyzed for the purpose of clinical and research practice. The completion of these goals provides information that is relevant to clinical and research practice in terms of identifying targets for treatment in each population, assisting with differential diagnosis of neurodegenerative communication disorders, and providing methods to evaluate response to treatment or changes in language function over time. Additionally, we provide a summary of elicitation tasks and measures that are currently being used to assess and evaluate written discourse performance, which will provide preliminary information about the state of written discourse research.
1.1 Written discourse as a diagnostic tool
There is a substantive body of literature on the methods of spoken discourse analysis and characteristics of spoken discourse in acquired neurogenic communication disorders (Bryant et al., 2016; Pritchard et al., 2017; Mueller et al., 2018; Suárez-González et al., 2021). There is also a subset of that literature that seeks to evaluate the diagnostic sensitivity of spoken discourse measures as it relates to identifying specific populations in comparison to groups without acquired language disorders (Fleming and Harris, 2008; Kim et al., 2019) and from different clinical populations (Glosser and Deser, 1992; Ash et al., 2013; Fromm et al., 2017). One of the aims of this study is to review the existing literature to determine which written discourse measures consistently distinguish our populations of interest from performance of adults without acquired language disorders and thus may be diagnostically sensitive in a clinical environment. We also summarized the literature to determine how written discourse characteristics differed when compared across populations of people with acquired language disorders. Doing this provides insight into which measures may be relevant when evaluating the written discourse of specific clinical populations and provides important groundwork for written discourse research.
1.2 Using discourse to measure change over time
Performance on discourse tasks reflects the status of progression or recovery in neurological disorders (Brisebois et al., 2021; Kim et al., 2022a,b). Using discourse to monitor longitudinal changes is clinically compelling in that discourse is a sample that is easily accessible for repeated investigations (Ahmed et al., 2013). Discourse samples provide rich information with cost-effective, non-invasive methods (Horigome et al., 2022). Unlike the prevalence of research into spoken discourse ability, there has been less focus on the utility of written discourse to identify clinically meaningful changes. Thus, this review summarized extant evidence that documents how well written discourse is able to capture changes in language and cognitive function that may occur over time in populations with progressive acquired language disorders (AD, MCI, PPA). This topic is also relevant to measuring change after treatment.
1.3 Written vs. spoken discourse
In the written domain, discourse can encompass email, messaging platforms, letters, etc. Historically, spoken discourse has received much more attention than written discourse because most daily communication took place in the spoken modality. In the spoken modality this can include telling stories, giving directions, and participating in conversation. However, the increased use of technology to complete activities of daily living means that people, including people with acquired language disorders, encounter more situations that require writing in the form of typing. For example, common activities such as shopping and banking may now be completed online, and many social outlets can be accessed virtually (social groups, messaging, etc.). These changes mean that people with acquired language disorders are more likely to need discourse level writing skills, especially in the form of typing. However, there is limited research on how to evaluate and treat written language at the discourse level.
Currently, when written discourse is assessed, it is done with tasks and measures that were originally created to evaluate spoken language, due to the lack of specific tools for evaluating written discourse in people with acquired language disorders (Obermeyer and Edmonds, 2018; Jaecks and Jonas, 2022). Further, there is limited research on how to interpret performance and potential changes in written discourse. This lack of information specific to written discourse is problematic because of the known differences between written and spoken discourse performance. For example, it is known that individuals without acquired language impairments tend to use more complicated language in writing than in speaking, and the complexity of writing increases up to adolescence (Wilson and Proctor, 2002). Spoken discourse is more spontaneous and does not allow an opportunity to edit and try out (Behrns et al., 2009), which differentiates it from written discourse. Further, spoken and written languages are developmentally and evolutionarily viewed as independent, and the two language systems are not in a subservient relationship (Pulgram, 1965; Vachek, 1989). Due to the heterogeneous nature of the two modalities and differences in their neural substrates, spoken and written discourse may be differentially affected in people with acquired neurogenic communication disorders and thus writing needs to be specifically evaluated and treated in the clinical environment.
1.4 The need to focus on writing
As we have stated, functional communication increasingly requires written discourse, which means there is an increasing need to focus of writing assessment and treatment earlier in the rehabilitation of people with acquired language disorders. Behrns et al. (2010) also point out that discourse level writing is often not targeted in aphasia assessment or treatment, potentially due to how difficult it is for PWA to produce written discourse, and that many people with aphasia are discharged from speech-language services by the time they would be ready to address written discourse. Given the increased need to write/type in daily life, a paradigm shift is required in research and clinical work to meet the needs of people with acquired language disorders and make it possible for them to access multiple modalities of communication. This shift also corresponds to the International Classification of Functioning, Disability, and Health (ICF) framework that clinical assessments should encompass individuals’ ability to participate in daily activities (World Health Organization, 2007). Thus, this study examined the state of the current literature on written discourse in adults with acquired language disorders, in order to provide evidence of language specific features that can be potentially used for diagnosis and target treatment. Because of how limited the research literature in this area is, we sought to answer specific questions that can be used to inform future research.
1.5 Aims
The goal of this study was to review the extant literature to determine the current status of knowledge related to written discourse performance in adults with select, acquired neurogenic communication disorders (people with aphasia, primary progressive aphasia, mild cognitive impairment, and Alzheimer’s disease). This review aims to summarize the evidence of written discourse deficits in clinical populations, focusing on clinically distinct linguistic features that characterize language impairments. Additionally, we extend our review to examine modality differences between spoken and written discourse and research that has used written discourse to evaluate change across time. Specifically, we sought to determine if current research supports the use of written discourse as a sensitive diagnostic measure that should be incorporated into clinical assessment. In order to capture the current state of written discourse research we also included a summary of the measures and elicitation tasks that can guide clinical practice by identifying tasks and measures that are commonly used to evaluate written discourse. In support of this goal, we identified four research questions:
(1) What are the documented differences in written discourse when comparing PWA, PPA, MCI, and AD to control groups?
(2) Does performance on written discourse tasks/measures distinguish between different patient populations?
(3) Are there written discourse measures that can be used to evaluate change over time in progressive neurogenic communication disorders?
(4) How does written discourse performance compare to spoken discourse performance in people with acquired neurogenic disorders?
2 Methods
2.1 Systematic search
Prior to narrative review, a systematic search was conducted in order to improve the methodological rigor (Grant and Booth, 2009; Ferrari, 2015). The literature search was completed on MEDLINE, Embase, Cochrane, APAPsycinfo, Web of Science, and Scopus databases. The search was run on February 26, 2023. The literature search was completed by research librarians at Johns Hopkins University, following guidelines described by Cochrane. Two main concepts were combined in the search: types of acquired neurogenic communication disorders, and written discourse. The search summary using keywords for the concepts can be found in Supplementary Appendix 1.
2.2 Screening and data extraction
Covidence Systematic Review Software (covidence.org) was used for the screening process. Two reviewers (HK, JO) independently screened titles and abstracts based on inclusion/exclusion criteria. Full texts of articles were obtained for studies that met the inclusion criteria or where abstracts were not sufficient to determine eligibility. The full text articles were then reviewed independently against selection criteria by two reviewers. The conflicts from both abstract and full-text screenings were resolved by a third reviewer (RW).
Articles met inclusion criteria only if they (1) focused on written discourse performance, (2) studied linguistic aspects of written discourse, (3) used discourse elicitation tasks that are replicable in clinical settings, (4) tested the target patient populations (people with aphasia, primary progressive aphasia, mild cognitive impairment, or Alzheimer’s disease), and (5) were peer-reviewed articles published since the year 2000. Studies with participants with mental health issues or other neurological conditions (e.g., Parkinson’s disease) were not included. Studies evaluating only motoric skills of writing were also excluded.
Following the screening process and application of inclusion criteria, we extracted relevant information related to target population, discourse tasks used, linguistic measures used, and findings. Our primary focus of this review was to gather data that reveal potential diagnostic sensitivity of written discourse in individuals with acquired neurogenic communication disorders, identify written discourse measures that are appropriate for capturing the characteristics unique to each clinical population, and to provide methods to evaluate change over time. Results of the search process are presented in Figure 1.
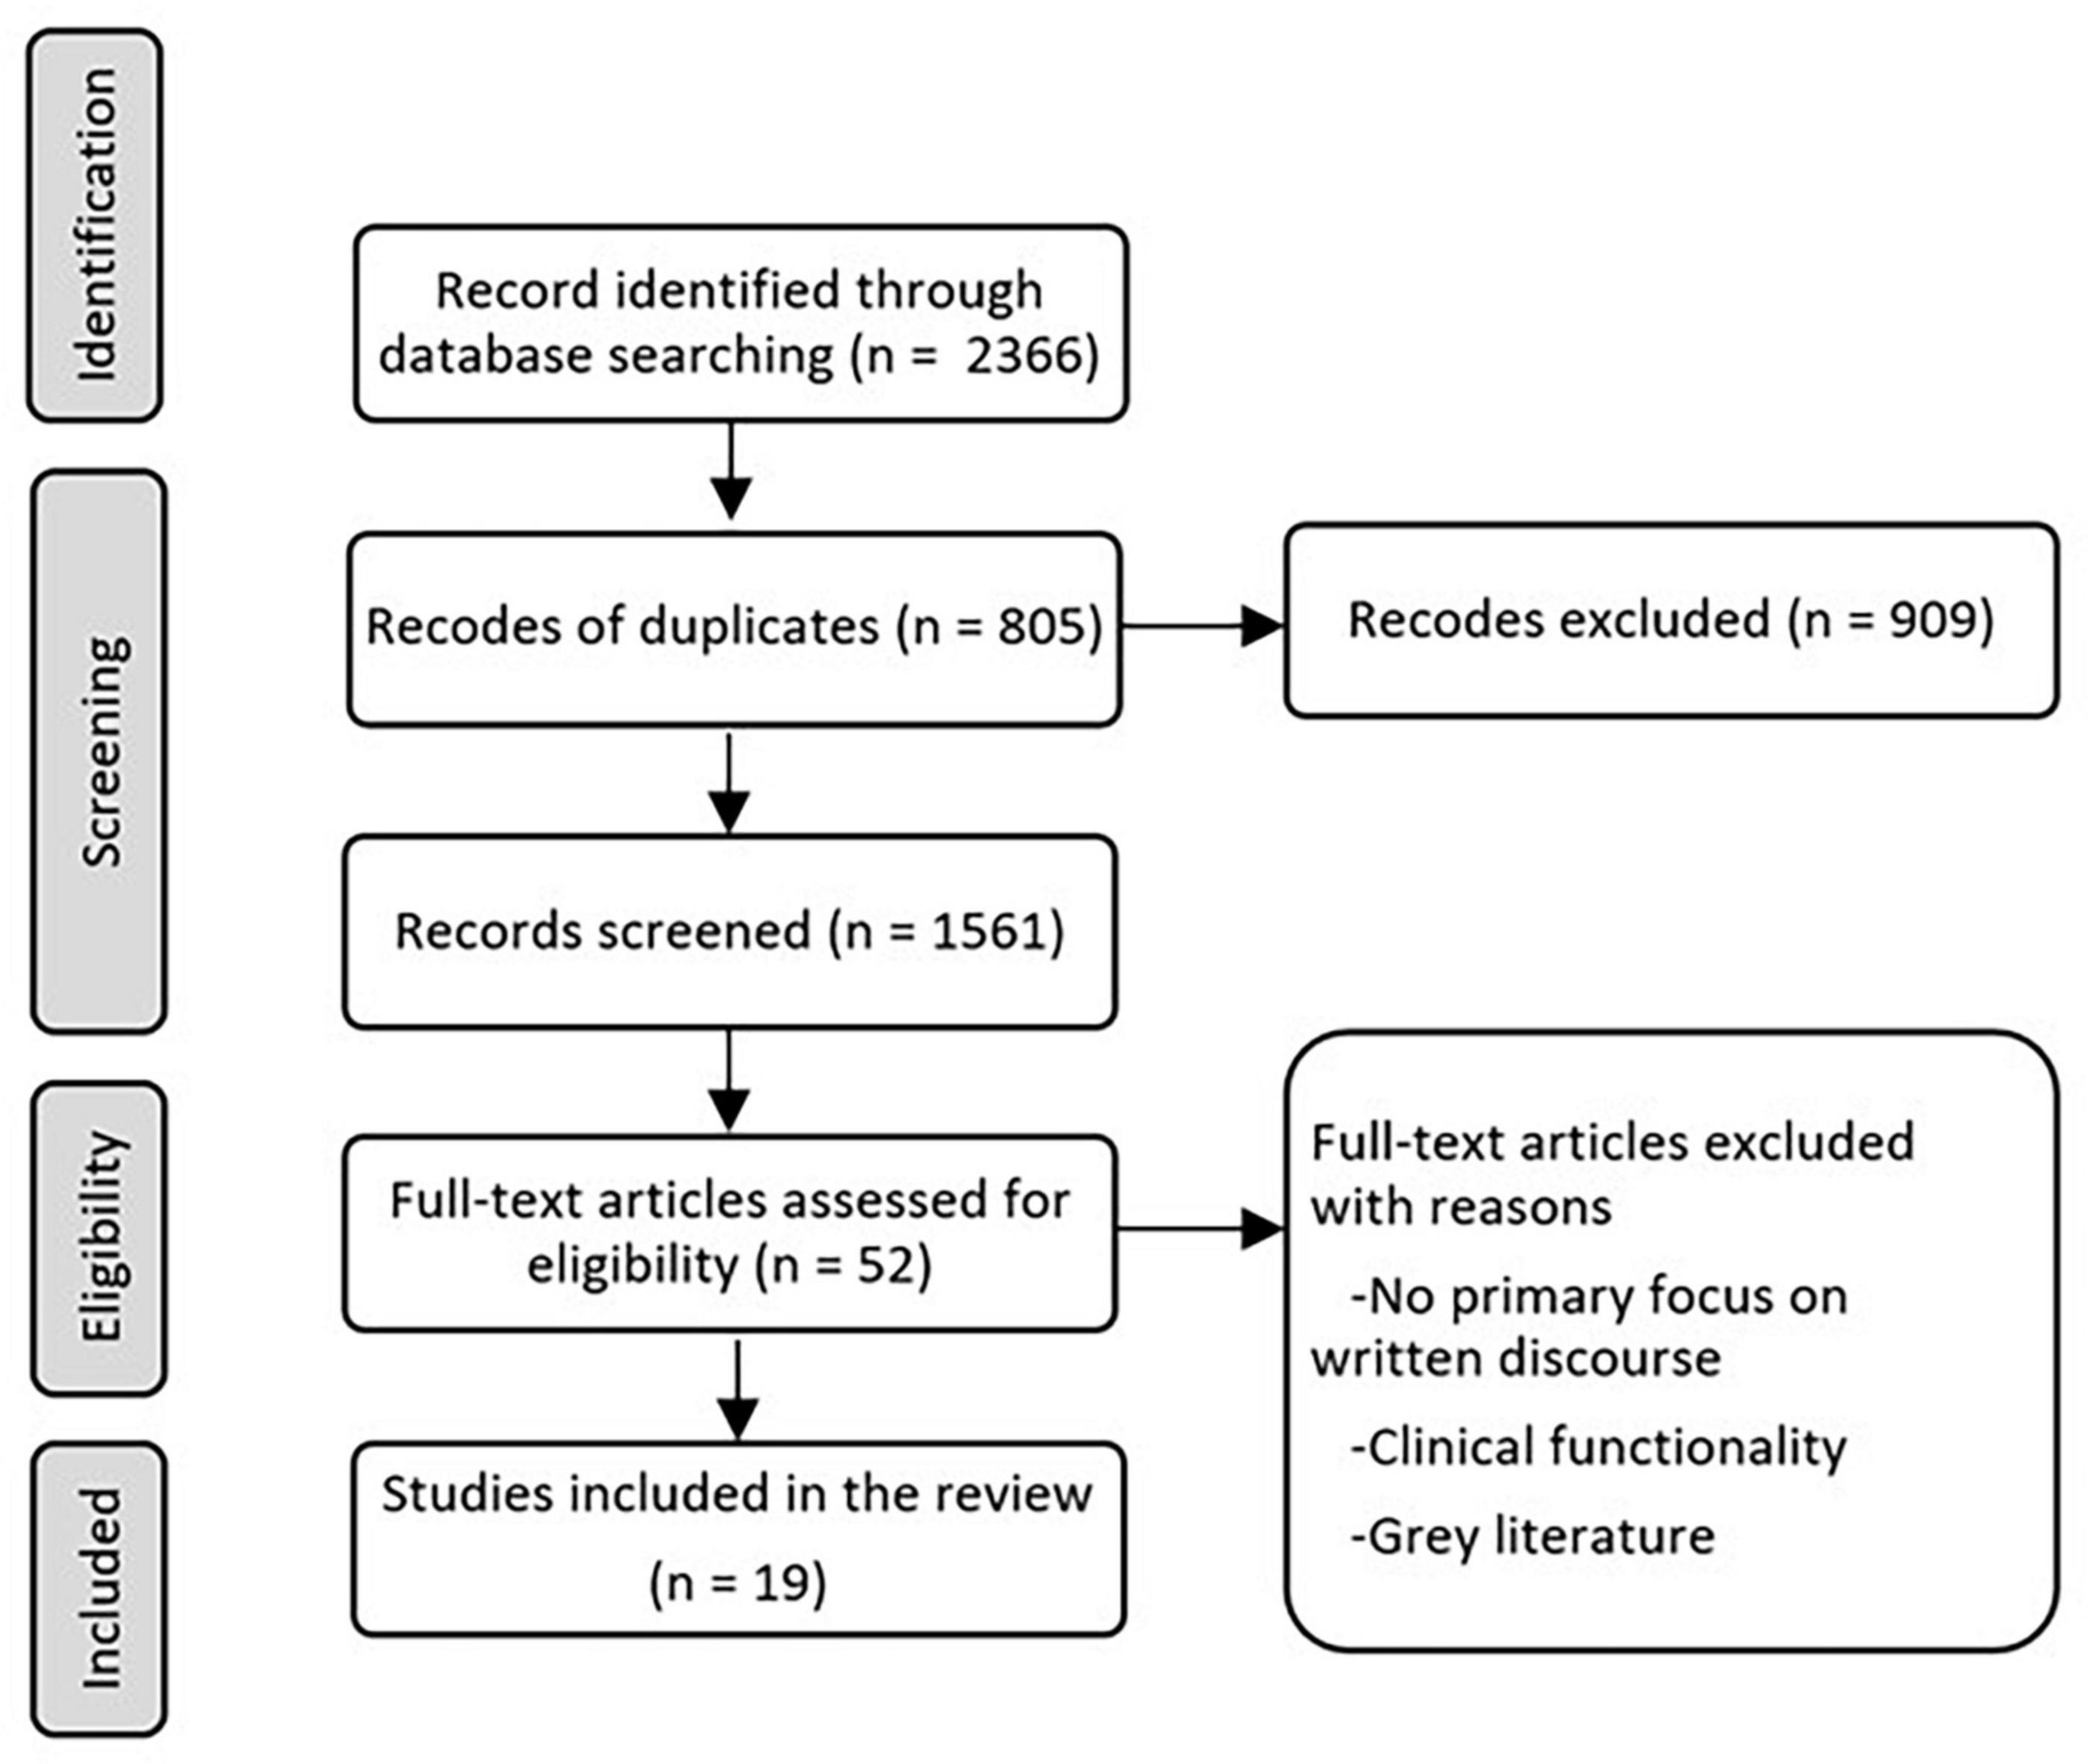
Figure 1. Path diagram describing identification, screening, eligibility, and inclusion.
3 Results
3.1 Study characteristics
A total of 2,366 articles were identified through the literature search. Following the removal of duplicates, 1,561 articles were reviewed at the abstract screening stage. Later, 52 articles were used for full text screening, and a total of 19 studies were identified for inclusion in the review.
Of the studies we reviewed, 15 articles evaluated differences between clinical populations and controls. Six of the papers reviewed addressed written discourse in PWA as compared to a control group (Mortensen, 2005; Behrns et al., 2008, 2009, 2010; Vandenborre et al., 2018; Johansson-Malmeling et al., 2020). Seven articles sought to compare the written discourse of people with Alzheimer’s disease to that of a control group using a variety of discourse elicitation tasks and measures (Forbes et al., 2004; Forbes-McKay and Venneri, 2005; Pekkala et al., 2013; Forbes-McKay et al., 2014; Rodríguez-Ferreiro et al., 2014; Davy et al., 2016). Two additional papers compared the written discourse of people with MCI to that produced by control groups (Aramaki et al., 2016; Smolík et al., 2016), and one paper compared multiple levels of writing produced by people with MCI, AD, and a control group (Hayashi et al., 2015). Identified deficits compared to controls can be targets for treatment. Unfortunately, there were no studies investigating linguistic characteristics in the written discourse performance of people with PPA compared to controls.
Six articles compared differential characteristics of patient populations cross-sectionally. Hayashi et al. (2015) focused on the comparison between people with amnestic MCI and AD, while Forbes et al. (2004), Groves-Wright et al. (2004), and Sand Aronsson et al. (2020) examined the characteristics of written discourse at different stages of AD (subjective cognitive impairment, probable, minimal, mild, moderate AD). Mortensen (2005) examined writing skills of people with aphasia when writing an informal letter to someone whom the study participants were close with. Three other studies conducted a longitudinal investigation on changes in written discourse performance. Sitek et al. (2015) expanded the scope of the patient population by adding people with logopenic PPA. These preliminary data might be helpful in differential diagnosis.
Three studies were specifically interested in changes over time in progressive neurogenic disorders (Pekkala et al., 2013; Forbes-McKay et al., 2014; Kim et al., 2022b). These studies provide assessments to measure change, which might also be applicable for measuring response to treatment.
Six articles targeted the relationship between the written and spoken modalities of discourse: two studies of PWA (Behrns et al., 2009; Vandenborre et al., 2018), two focused on AD (Groves-Wright et al., 2004; Forbes-McKay and Venneri, 2005), and another two studies examined MCI (Aramaki et al., 2016; Smolík et al., 2016).
3.2 Participant characteristics
In the 19 articles reviewed, a total of 1321 participants were included. These participants were comprised of 671 healthy controls, 84 people with aphasia, 9 people with logopenic primary progressive aphasia, 28 people with subjective cognitive impairment, 177 people with mild cognitive impairment (amnestic mild cognitive impairment = 94; multiple domain mild cognitive impairment = 5; unidentified type of mild cognitive impairment = 78), 290 people with Alzheimer’s disease, 47 unidentified individuals (either mild cognitive impairment or Alzheimer’s disease), and 15 people with traumatic brain injury. Three articles by Behrns et al. (2008, 2009, 2010) appear to include the same 8 PWA based on the demographics disclosed.
Nine articles out of 19 included participants whose native language is not English. Five articles included native Swedish speakers for both healthy controls, subjective cognitive impairment, MCI, AD, and PWA; and 2 articles included native Japanese speakers for the control group and the MCI group. Native Dutch speaking PWA and the control groups, and native Spanish probable AD group and controls were included in 2 articles, respectively.
Eleven articles matched age and years of education between participants with communication disorders and their counterparts. Three articles in total did not match age and education between groups (Forbes-McKay and Venneri, 2005; Aramaki et al., 2016; Sand Aronsson et al., 2020). Five articles did not mention whether age or education was matched among the groups (Forbes et al., 2004; Behrns et al., 2008, 2009, 2010; Davy et al., 2016).
3.3 Written discourse tasks
All studies reviewed used some task to elicit written discourse samples for analysis (Table 1). Broadly, discourse tasks can be categorized into two formats: either with or without the presentation of picture stimuli. In some cases, both formats were used to elicit different types of written discourse samples. Fourteen studies included picture stimuli (e.g., the Cookie Theft Picture), while seven studies elicited writing samples without pictures (e.g., asking participants to write about a memorable moment) (Figure 2). For the studies eliciting writing samples, only 1 study used a format of letter writing (e.g., writing a letter to friends), and six studies used personal narratives (Figure 3). Of the 14 studies using picture stimuli, 10 studies included a single picture description task, and five studies used sequential pictures of two to four frame cartoons. Two studies used a wordless picture book (Figure 4). Of note, some studies used single and sequential pictures. The number of studies utilizing discourse tasks sorted by research question can be found in Table 2.
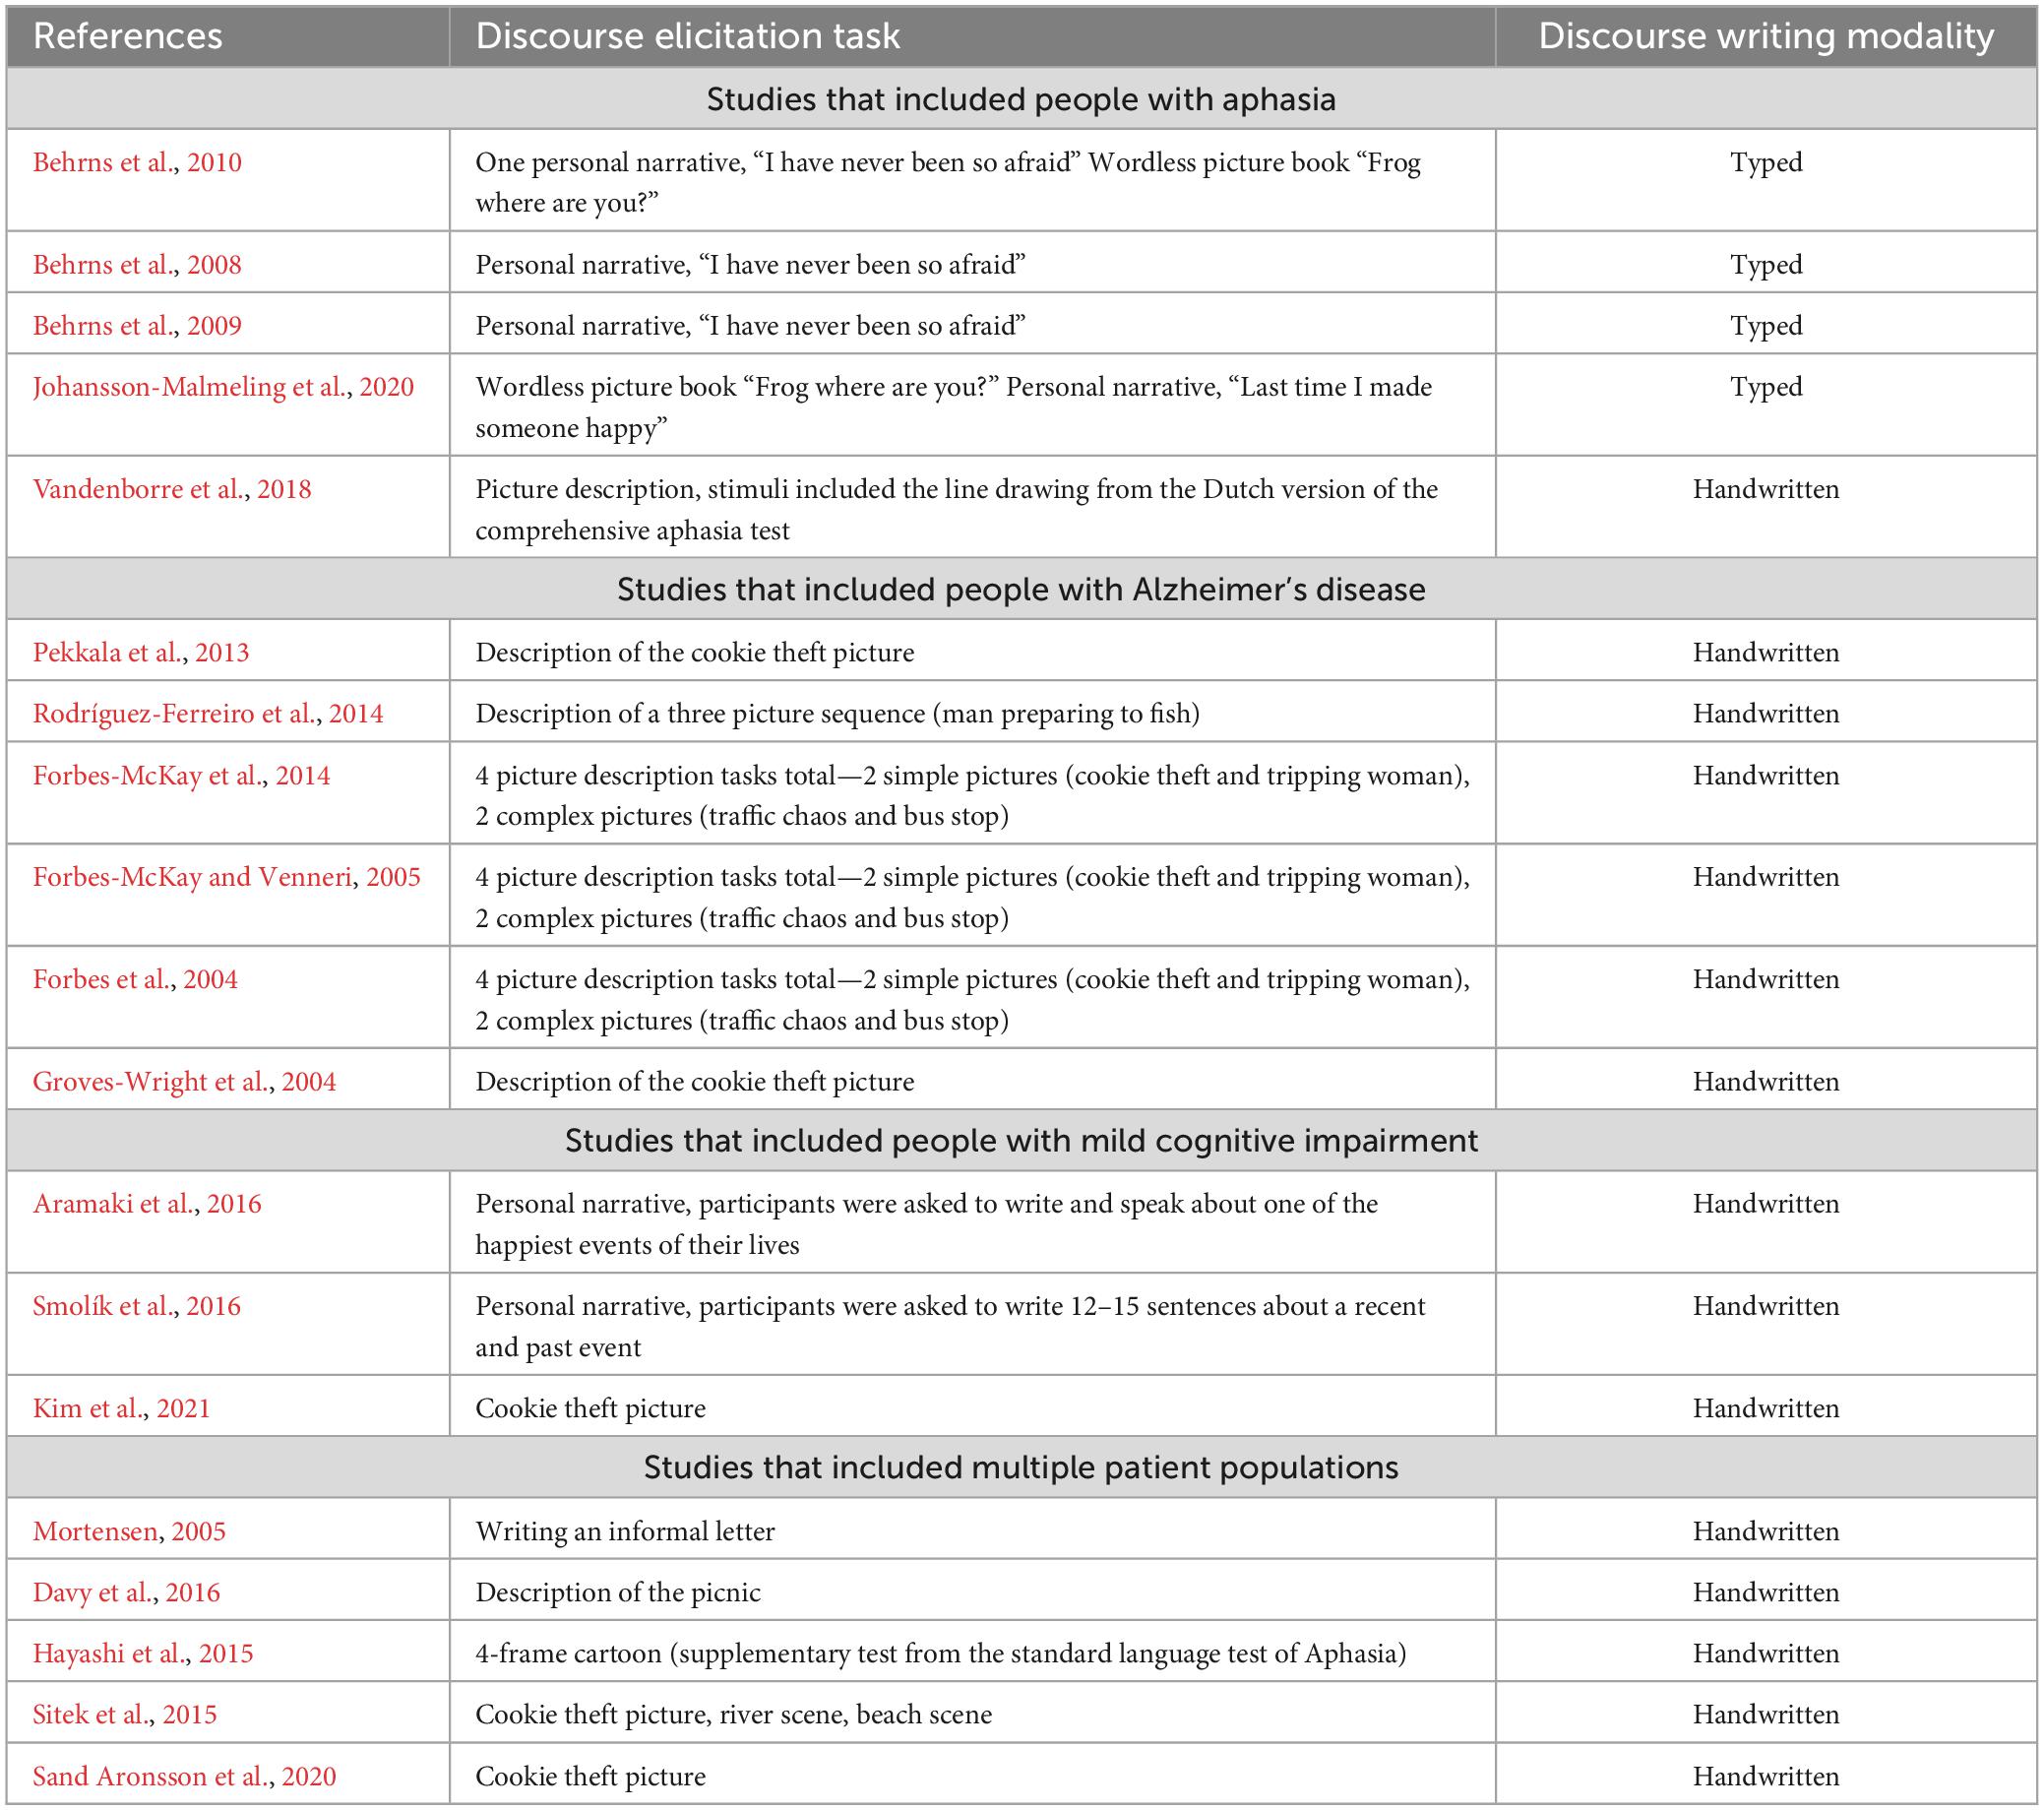
Table 1. Studies organized by participant group with corresponding discourse elicitation stimuli and discourse writing modality.
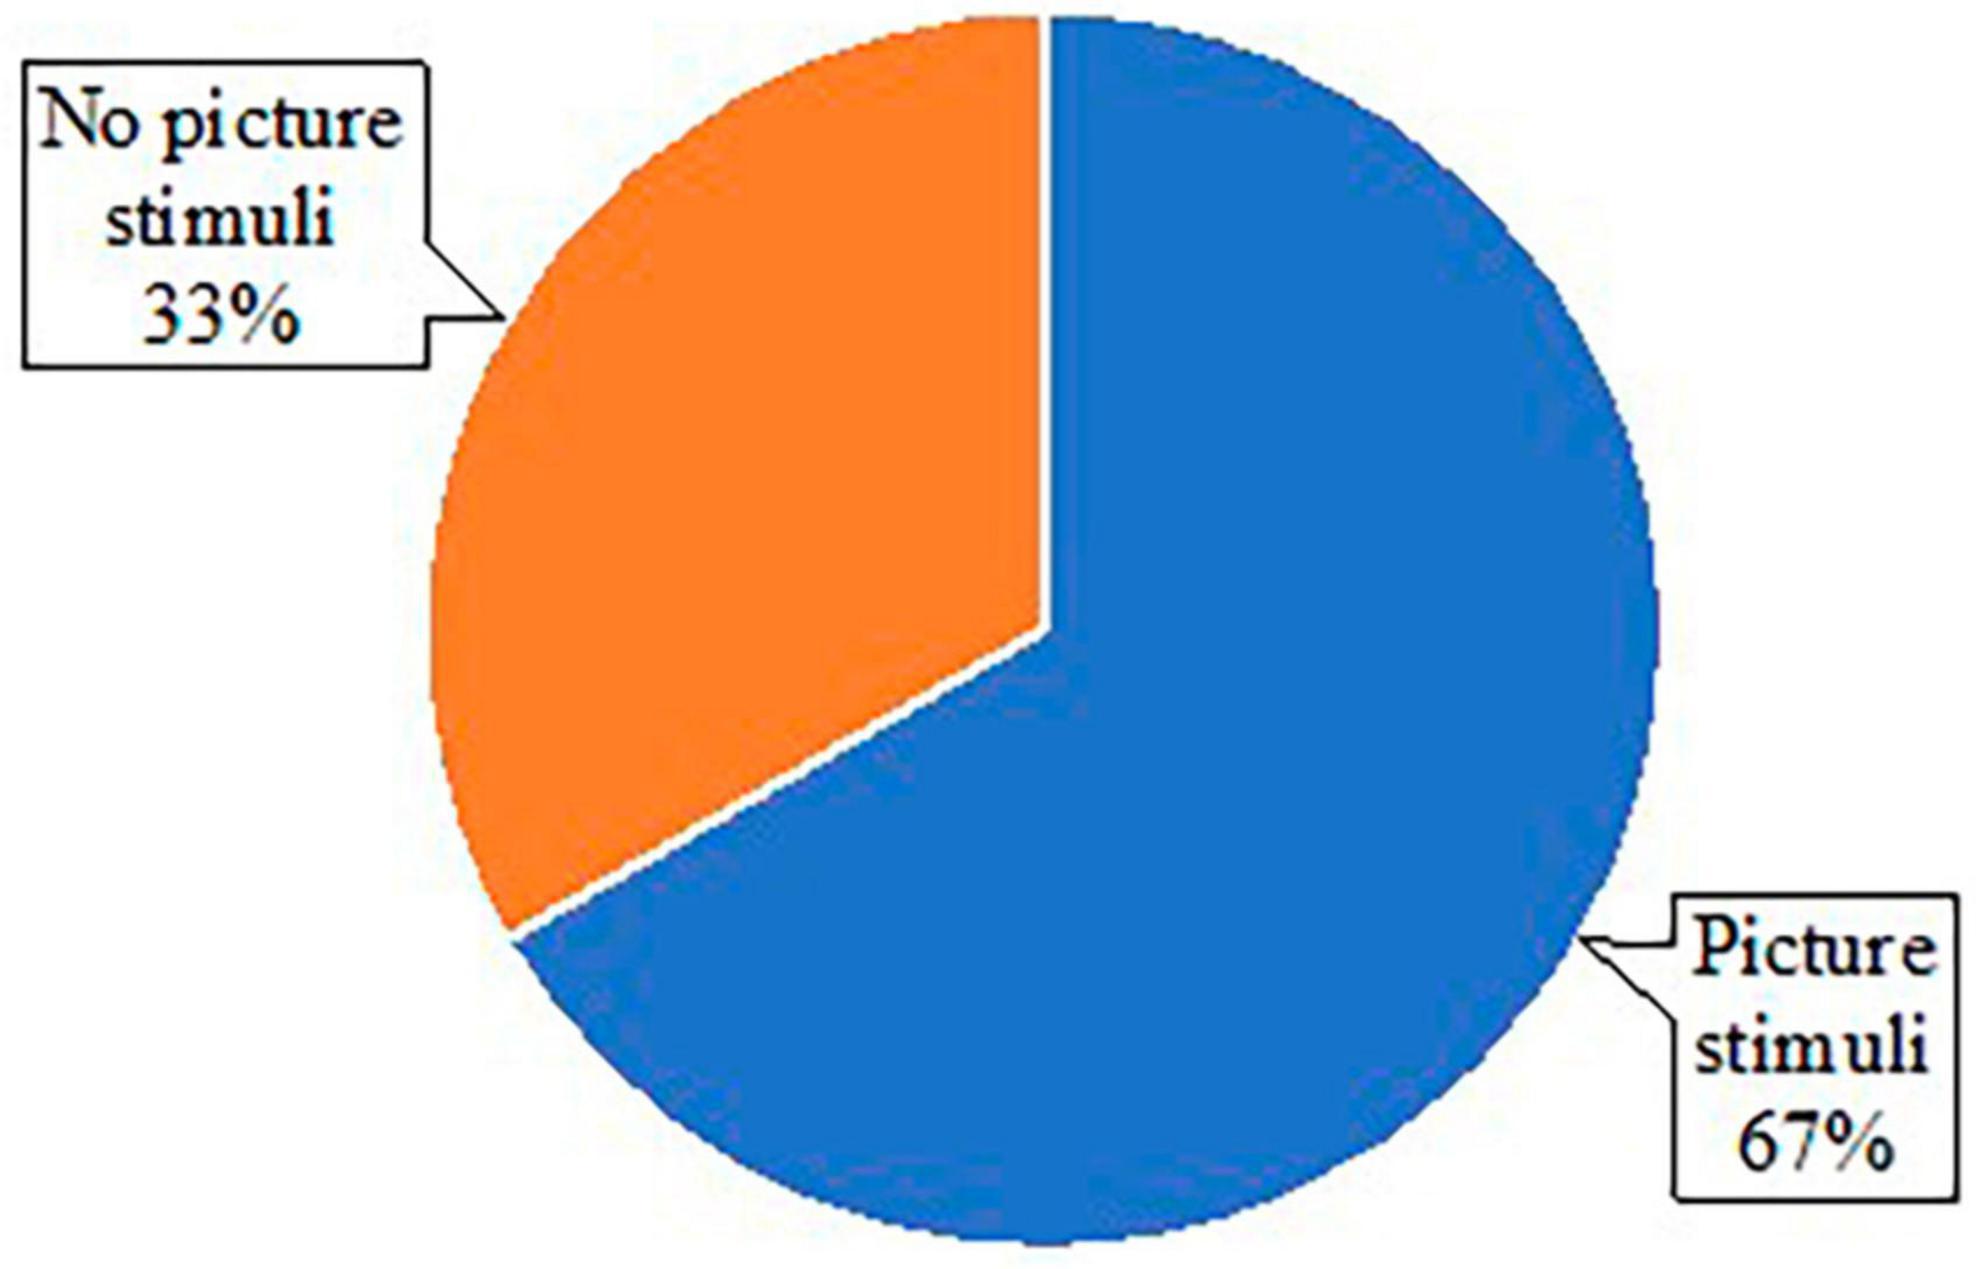
Figure 2. Pie chart of types of stimuli used across studies.
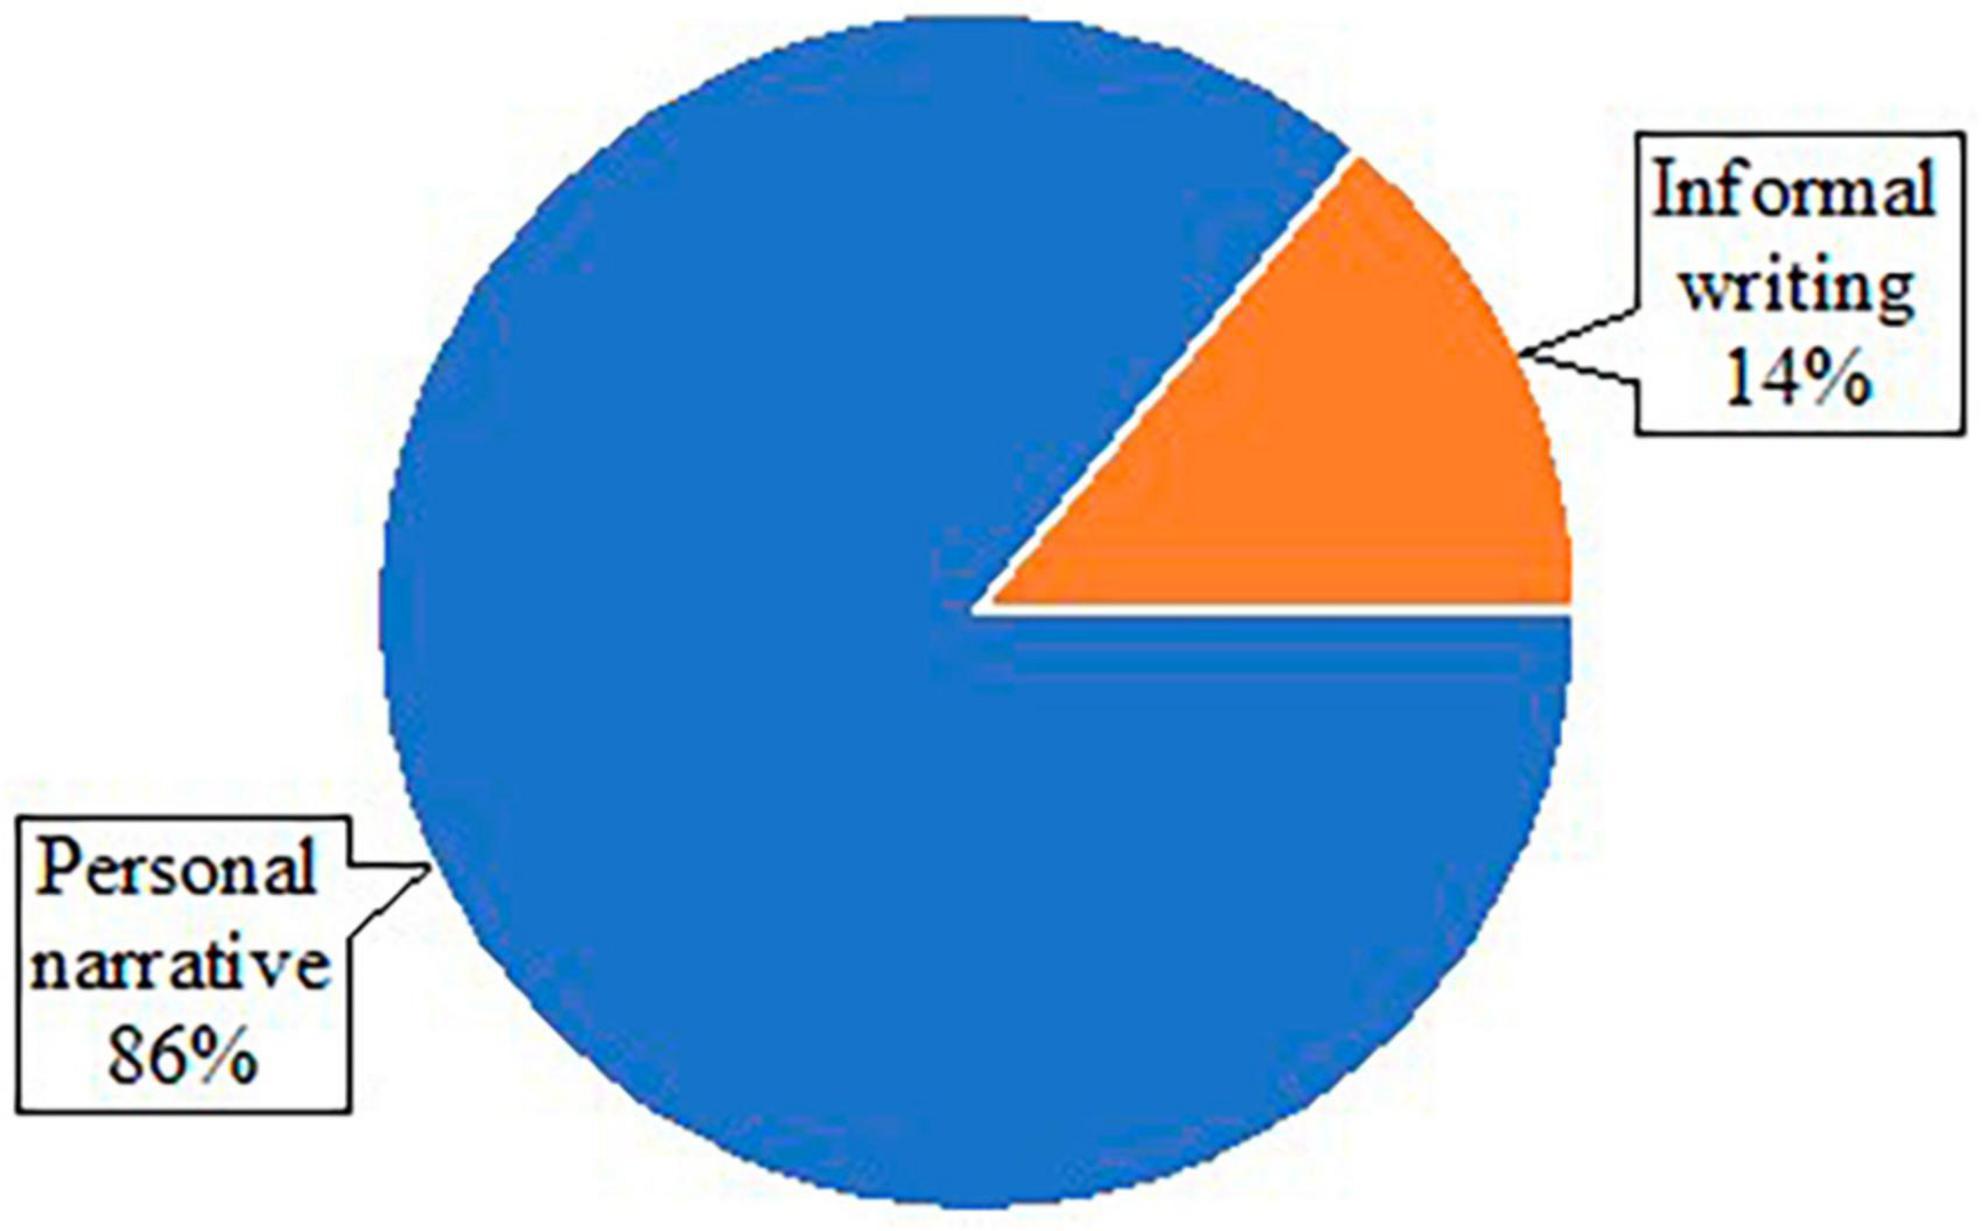
Figure 3. Pie chart of types of stimuli within studies without use of pictures.
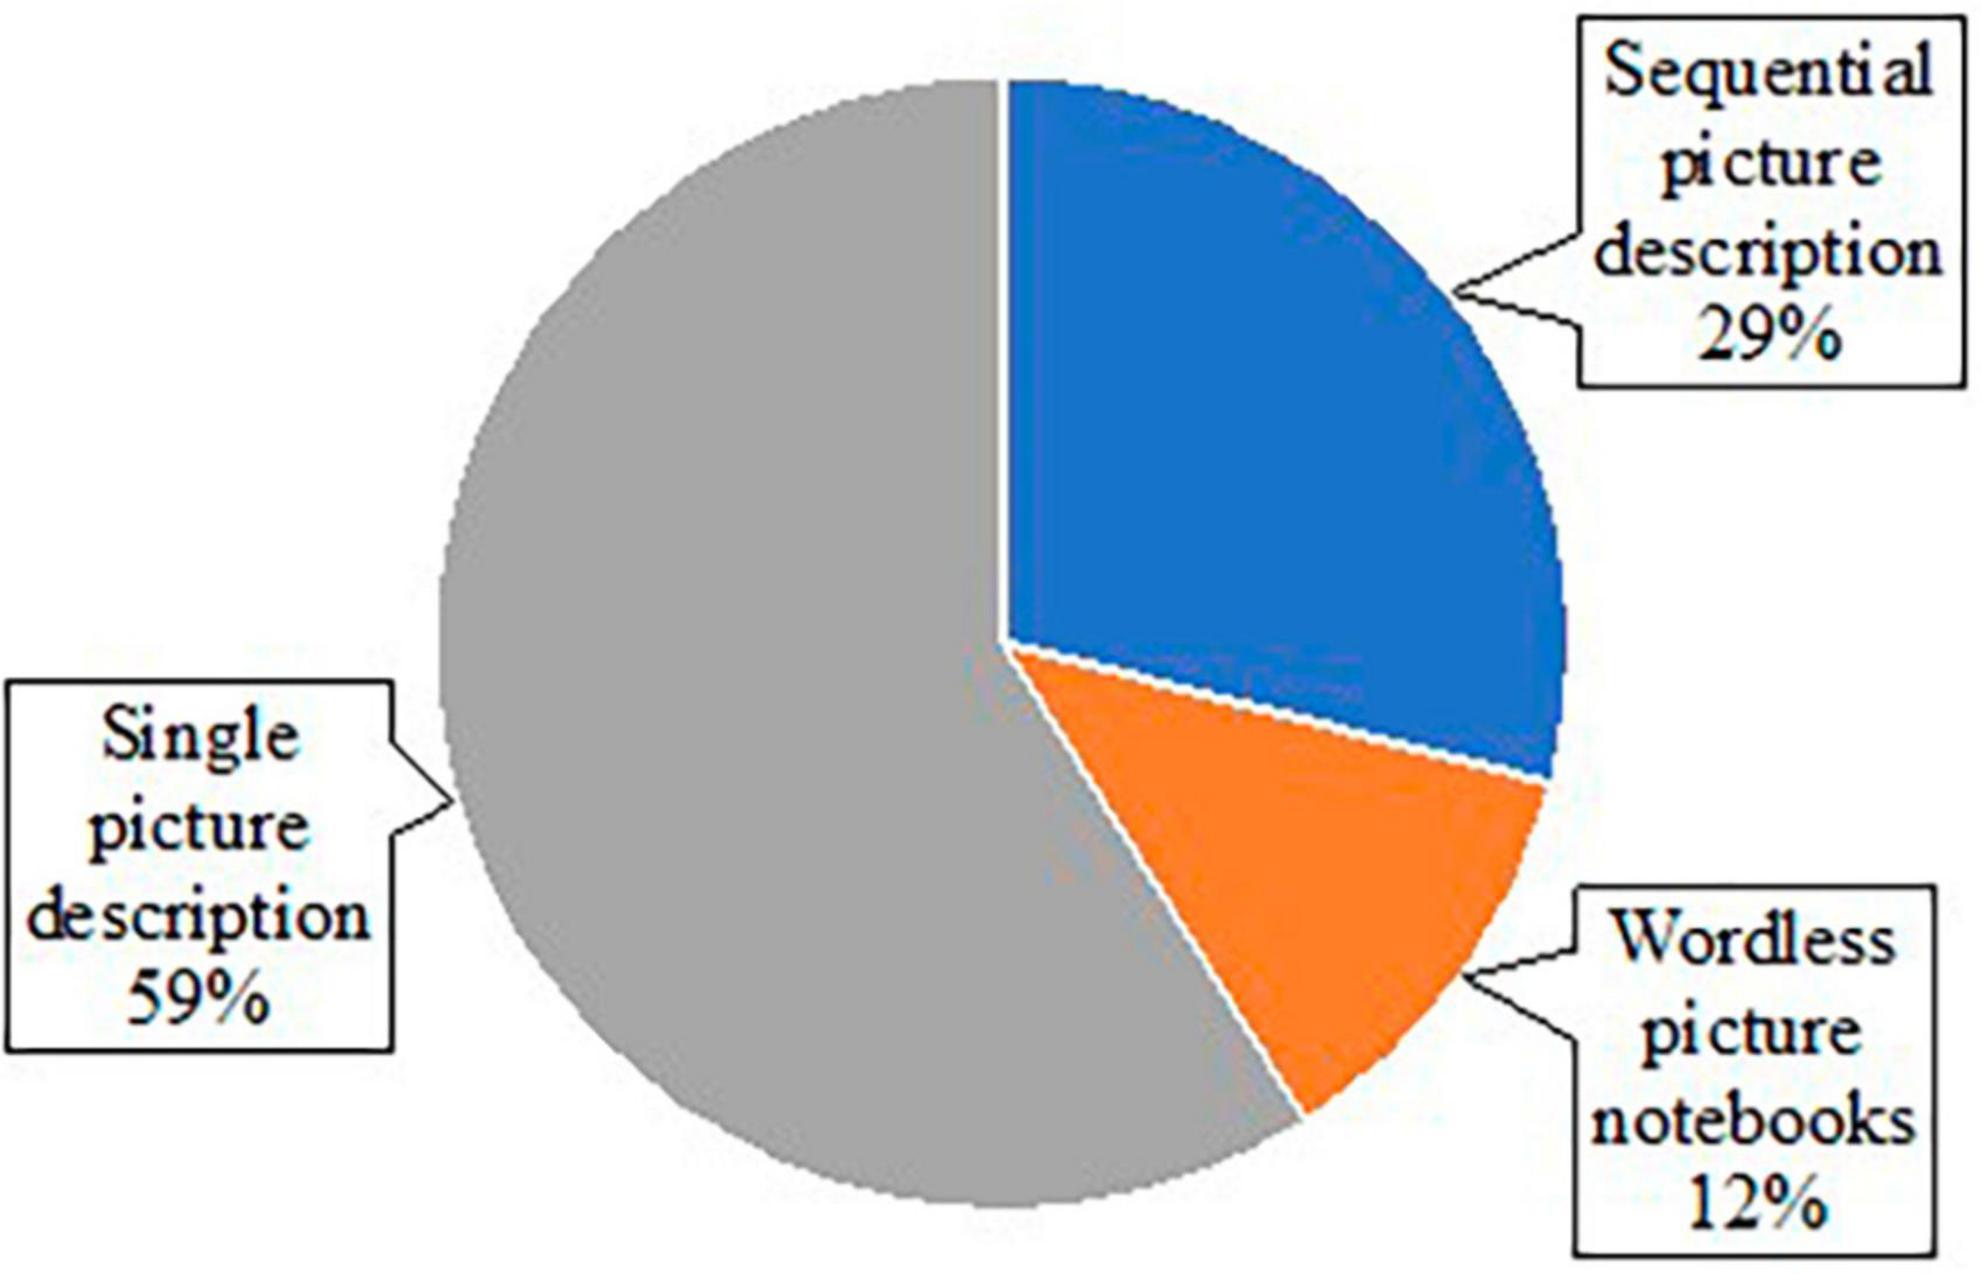
Figure 4. Pie chart of types of pictures used within studies using picture stimuli.
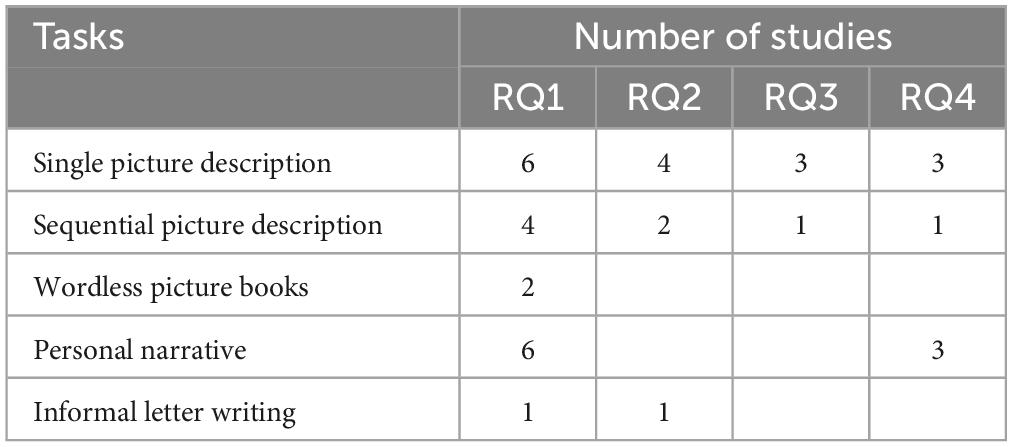
Table 2. The number of studies utilizing discourse tasks sorted by research question.
3.4 Measures used across studies
In the 19 articles reviewed, there are 102 different measures used to quantify or describe various writing behaviors. In Table 3, measures were grouped into nine categories due to a large number of measures. The most frequently utilized measure was the total number of words (n = 7), followed by number of different words, phrase length, grammatical form, pictorial theme, spelling errors, error monitoring, phonemic paragraphias, semantic paragraphias, information content, visual paragraphias, words per minute, and general quality of writing based on Goodglass et al. (2001) (n = 3). For the number of different words, type-token ratios (TTR) were calculated in three articles, and modified TTR were also used in two articles. However, due to the lack of description in the modified TTR in the two articles, it cannot be confirmed whether they are the same measure or not. It appears that different names were utilized to quantify the same aspect of writing performance in some of studies (i.e., target words, core words, important content words). Seventy-eight measures were used in one study, and only 24 measures were repeatedly used in two or more studies (i.e., total number of words, target words, number of important content words, number of different words, proportion of nouns, proportion of verbs, lexical density, lexical diversity, words per T-unit, phrase length, clauses per T-unit, correct sentences, grammatical form, idea density, pictorial theme, spelling errors, error monitoring, phonemic paragraphias, semantic paragraphias, information content, visual paragraphias, words per minute, two different rating scales for assessing quality of writing). It should be noted that Mortensen (2005) is a qualitative study with comprehensive description of writing performance in the study populations, and thus the measures in Table 3 were determined based on research questions mentioned in the original article. The number of studies utilizing linguistic measures sorted by research question can be found in Table 4.
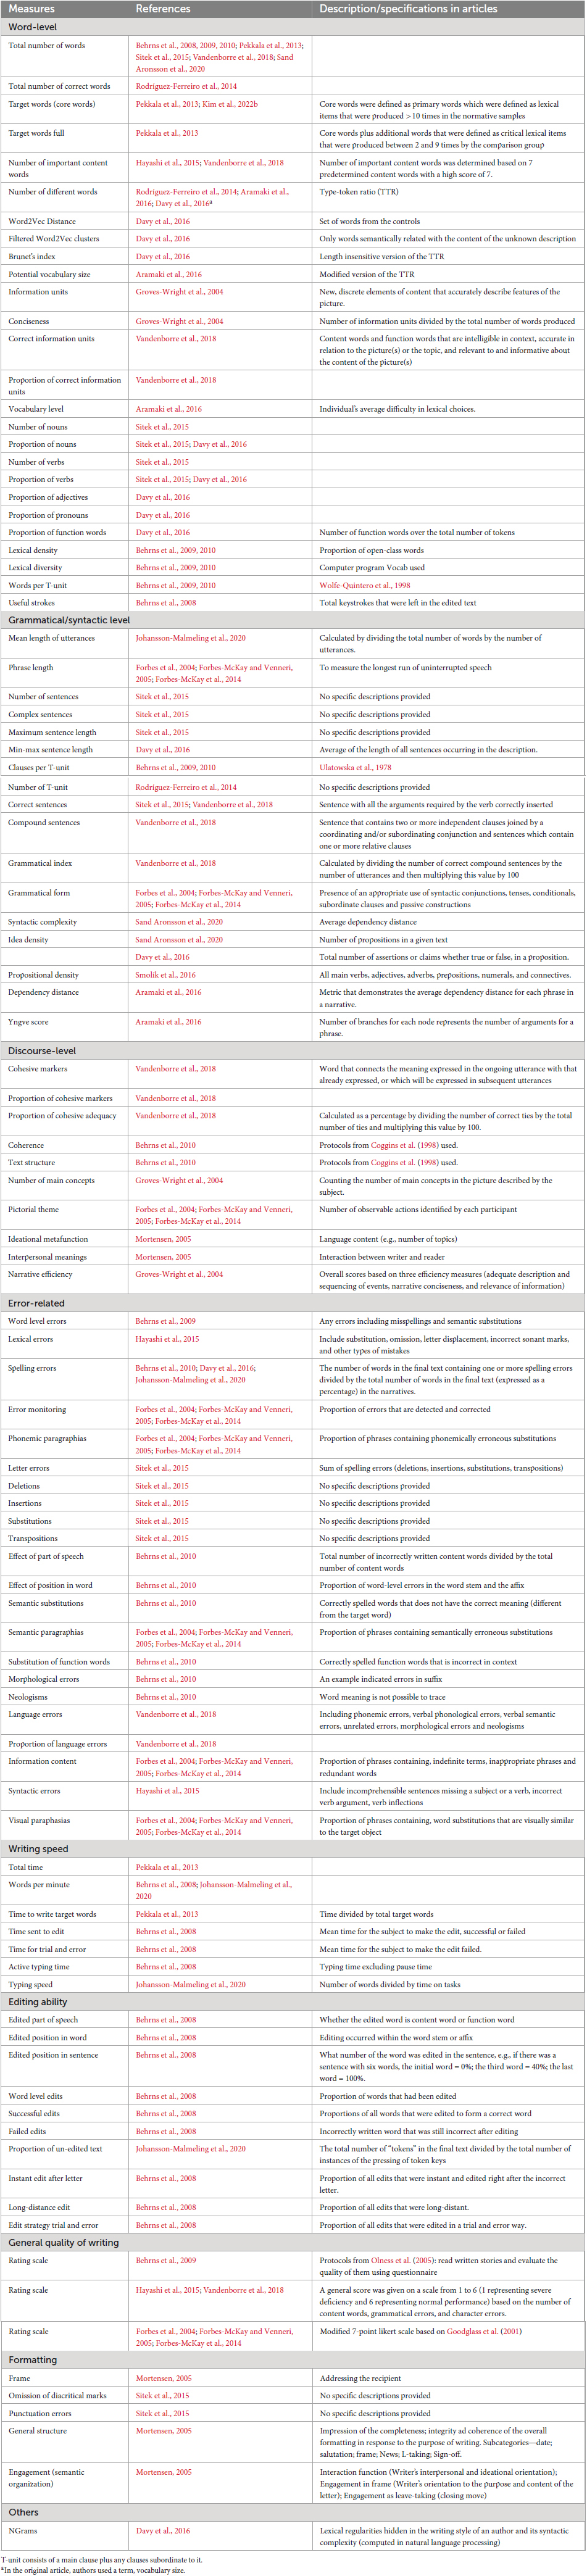
Table 3. Summary of measures used in studies.
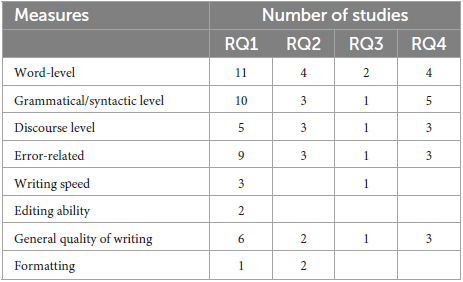
Table 4. The number of studies utilizing linguistic measures sorted by research question.
3.5 Summary of results
This review identified 19 studies that focused on discourse-level writing performance in PWA, PPA, MCI, and AD. The summary section has been organized by research question. Findings in studies reviewed are summarized in Table 5.
RQ1. What are the documented differences in written discourse when comparing PWA, PPA, MCI, and AD to control groups?
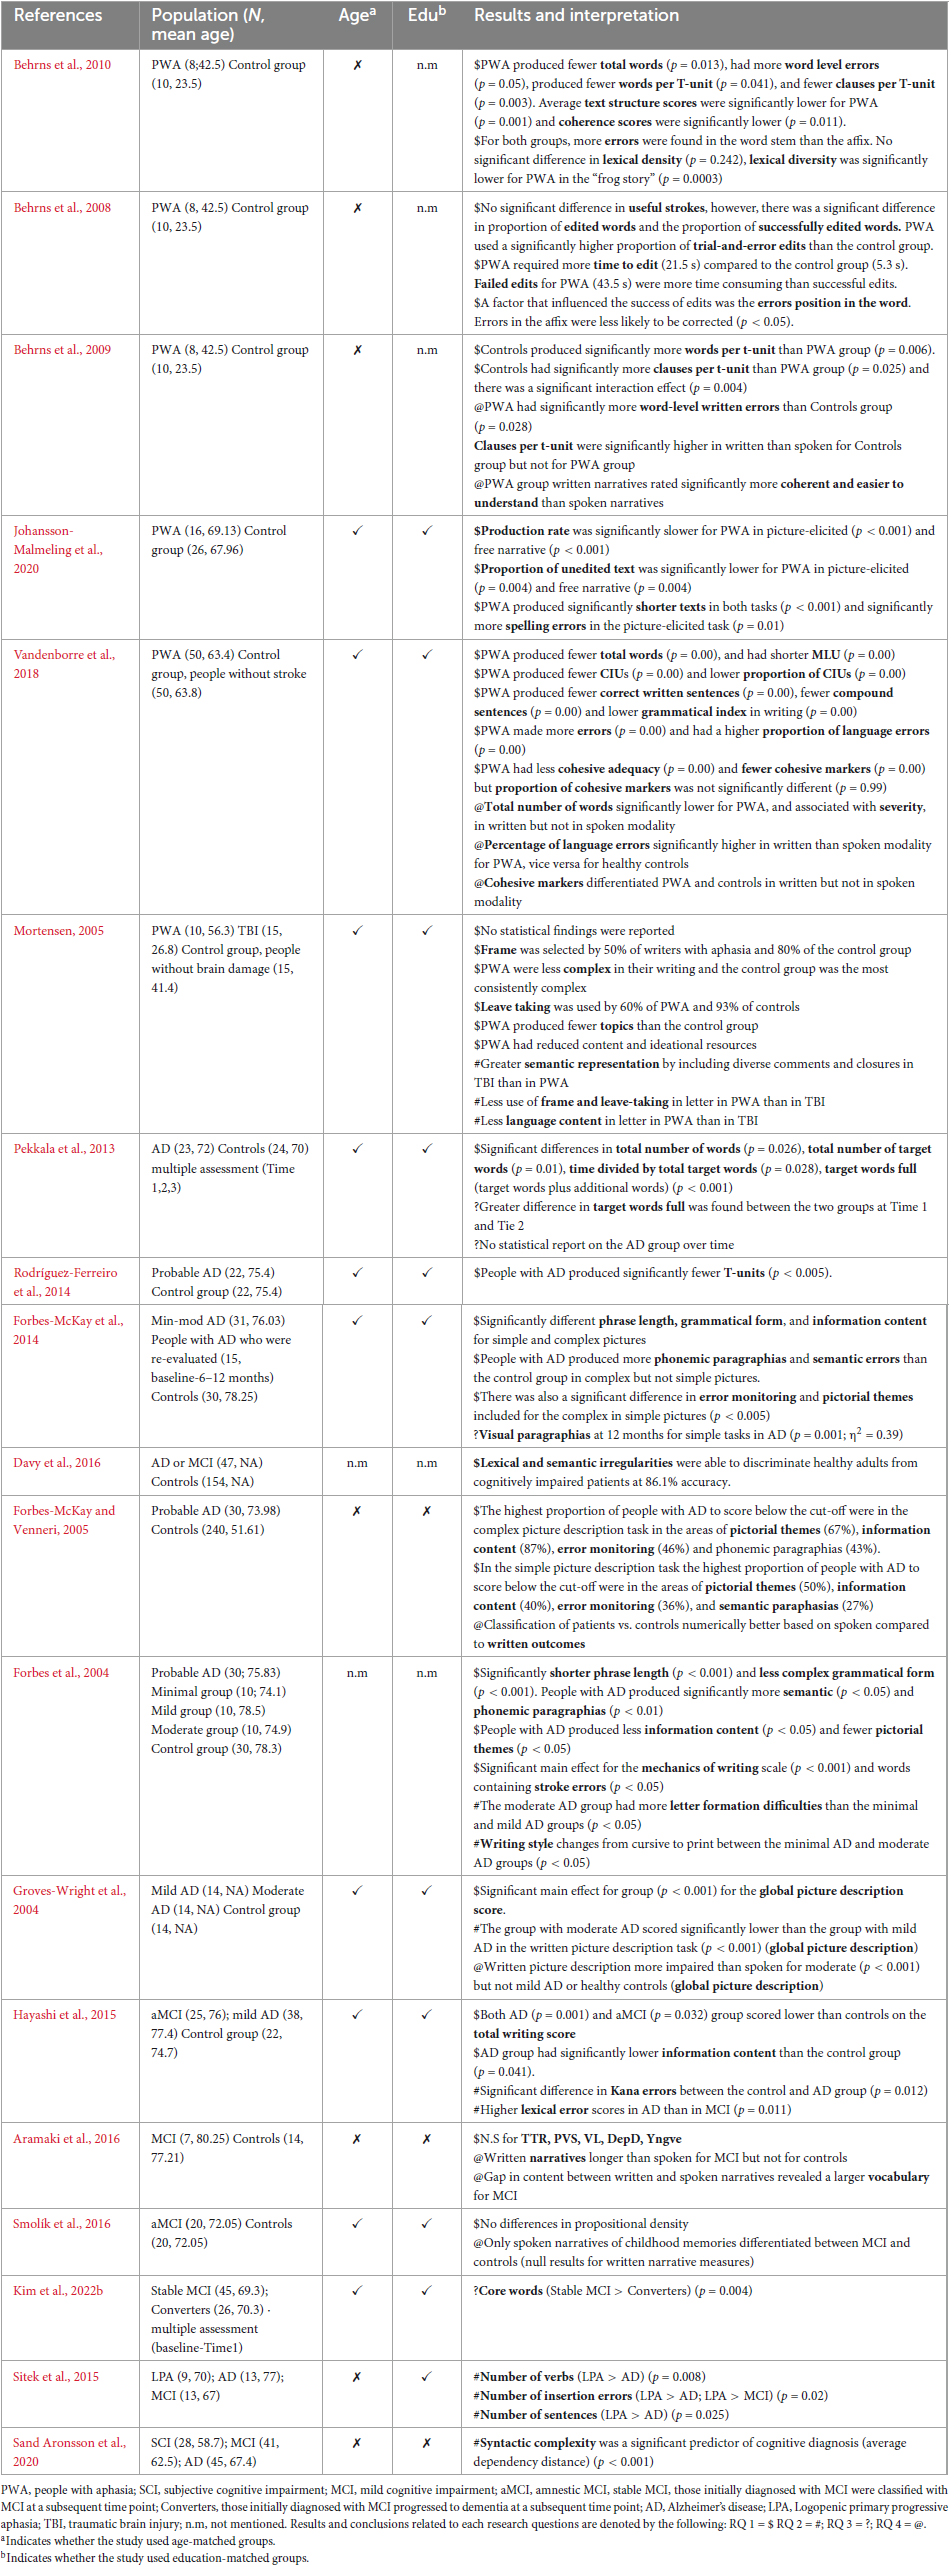
Table 5. Summary of literature.
RQ 1-1. Aphasia vs Controls. Across the articles on written discourse performance in PWA, there was variability in the discourse elicitation tasks selected, written discourse measures, and use of the handwritten and typed modalities. Some of the tasks used to elicit written discourse included wordless picture book prompts, personal stories (e.g., “I have never been so afraid”), a personal letter, and picture descriptions. Discourse measures also varied with five of the six papers evaluating at least one aspect of written discourse microstructure (Behrns et al., 2008, 2009, 2010; Vandenborre et al., 2018; Johansson-Malmeling et al., 2020) and four of the six papers including at least one measure of discourse macrostructure (Mortensen, 2005; Behrns et al., 2009, 2010; Vandenborre et al., 2018).
Although the methods used to evaluate written discourse varied across studies, there were some consistent findings that separated the performance of PWA from a control group and that provide insight into the written discourse of PWA. For example, PWA typically produced fewer words in their written discourse when compared to a control group (Behrns et al., 2010; Vandenborre et al., 2018; Johansson-Malmeling et al., 2020), and produced shorter and syntactically simpler utterances (Behrns et al., 2009, 2010; Vandenborre et al., 2018). Two papers examined the editing process or the efficiency of handwriting/typing in PWA. Results consistently suggested that PWA make more word-level errors and require more time to edit (Behrns et al., 2008; Johansson-Malmeling et al., 2020). PWA were also found to use trial-and-error approaches to editing more frequently than a control group (Behrns et al., 2008) and were less efficient in their ability to convey informative content (Vandenborre et al., 2018). While the majority of papers focused on microstructure, some also evaluated components of macrostructure such as cohesion, letter structure and story ratings from unfamiliar listeners. Cohesive adequacy was rated significantly lower for PWA (Behrns et al., 2009) and they used fewer cohesive markers; however, Vandenborre et al. (2018) found that the proportion of cohesive markers was not significantly different from controls. Mortensen (2005) evaluated written discourse performance at the word level, and found that PWA included the majority of obligatory letter elements, but the writing of PWA was less complex and included fewer topics. PWA were rated significantly lower on a number of other variables such as having adequate choice of words, enjoying telling a story and ease of understanding; however, these ratings included both spoken and written narrative comparisons with the control group (Behrns et al., 2009).
There were also some variables that were similar in the written discourse of PWA and control groups. Lexical density was not different across groups (Behrns et al., 2009, 2010) and there were mostly non-significant differences when comparing lexical diversity.
RQ 1-2. MCI vs. Controls. Despite the limited number of studies, there is a clear pattern in the review that no significant differences were found between MCI and control groups. Both studies utilized similar writing tasks in which the study participants described events that occurred in their lives. Aramaki et al. (2016) study, written discourse samples were obtained, asking participants to describe a happy event. In Smolík et al. (2016) study, descriptions were related to a recent memory, and a past memory from childhood. None of these studies found significant differences, but this reflects the clinical importance of the choice of written discourse elicitation tasks. Although this was a frequently used written discourse task for people with MCI, written discourse samples elicited from recounts may not be sensitive enough to capture subtle linguistic changes. Possibly, recounts that are associated with individuals’ personal life result in great variability in language samples across individuals (Wright and Capilouto, 2012). Because this task allows more latitude by its nature, writers with subtle cognitive impairment can employ compensatory strategies for accommodating their language difficulties, such as using synonyms or providing limited details. Indeed, there is some overlap in the quality of written discourse performance of MCI and control groups. In future studies, written discourse should be evaluated in multiple discourse tasks.
RQ 1-3. AD vs Controls. Eight studies evaluated the performance of people with AD in comparison to a control group. These studies evaluated written discourse using the handwritten modality and all implemented some method of picture elicitation task, although there was variability in the number of pictures and the complexity (i.e., describing a picture sequence vs. a single picture). The discourse measures varied, but many patterns were observed across the study findings.
The most consistent findings were that the written discourse of people with AD contained less information content (Forbes et al., 2004; Groves-Wright et al., 2004; Forbes-McKay and Venneri, 2005; Pekkala et al., 2013; Hayashi et al., 2015) and fewer pictorial themes (Forbes et al., 2004; Forbes-McKay and Venneri, 2005; Forbes-McKay et al., 2014) than the written discourse of the control group. Another apparent pattern in the written discourse of people with AD was the higher frequency of lexical and semantic errors (Forbes et al., 2004; Forbes-McKay and Venneri, 2005; Forbes-McKay et al., 2014; Hayashi et al., 2015; Davy et al., 2016). Phonemic paragraphias were also noted as sensitive for distinguishing between the written discourse of people with AD and a control group (Forbes-McKay and Venneri, 2005; Forbes-McKay et al., 2014). Two studies found that people with AD were less able to monitor for errors (Forbes-McKay and Venneri, 2005; Forbes-McKay et al., 2014). Additionally, two studies evaluated productivity of words or utterances and found that people with AD produced significantly less written discourse than the control group (Pekkala et al., 2013; Rodríguez-Ferreiro et al., 2014), and two studies reported that people with AD have reduced utterance length or complexity (Forbes et al., 2004; Forbes-McKay et al., 2014).
A series of papers used simple and complex pictures to elicit written discourse from people with AD and controls. The simple pictures included seven pictorial themes and the complex scenes had eleven. Further, the complex scenes were noted to require more integration of events. These papers reported differences based on the complexity of the discourse task. People with AD had more impaired written discourse when compared to controls, with greater differences in the complex task than in the simple picture description task, suggesting an effect of cognitive and linguistic demands of the task on writing performance (Forbes et al., 2004; Forbes-McKay et al., 2014).
RQ2. Does performance on written discourse tasks/measures distinguish between different patient populations?
Studies involving different clinical populations in written discourse demonstrated unclear findings Hayashi et al. (2015) used a sequential picture task consisting of five pictures to delineate changes in written language between amnestic MCI and AD. Performance was evaluated in consideration of seven predetermined target words produced, as well as grammatical and character errors. They found that greater errors in target words and kanji characters were able to discriminate MCI from AD. Contrarily, Sitek et al. (2015) did not find any statistical differences on any of their linguistic measures between MCI and AD groups. However, Sitek et al. (2015) reported that the logopenic PPA (lvPPA) group differed from the AD group on both the number of verbs and sentences produced. For the number of spelling errors, the people with lvPPA produced insertion errors in their writing, while the MCI and AD groups did not produce any insertion errors. The authors suggested that insertion errors may help disentangle the similarities in symptoms of the three types of neurodegenerative diseases.
Three studies cross-sectionally investigated the progression of written discourse deficits from subjective cognitive impairment to AD stages (Forbes et al., 2004; Groves-Wright et al., 2004; Sand Aronsson et al., 2020). Sand Aronsson et al. (2020) reported syntactic complexity measured by an average distance between words and their syntactic dependence in phrases or sentences has a significant relationship with cognitive declines from subjective cognitive impairment to AD. Groves-Wright et al. (2004) evaluated written discourse performance in a comprehensive way, considering four different aspects (main concepts, efficiency, information units, and conciseness ratio). They found that the moderate AD group scored lower than the mild AD group. Contrarily, Forbes et al. (2004) did not find any statistical differences in linguistic aspects of written discourse (e.g., information content, syntactic measures, and use of paragraphia), while they found a change in writing style from minimal AD to mild or moderate stages. They reported that writers at the moderate stage had difficulty forming letters, and changed cursive writing to print writing compared to those at the mild stage.
A descriptive study by Mortensen (2005) had a different approach to global structure and semantic organization in people with aphasia and traumatic brain injury (TBI). The author reported a qualitative difference between the two groups. That is, less content and fewer instances of addressing the recipient and closing remarks in the group with aphasia compared to the group with TBI. It should be noted that TBI is beyond the scope of this review. There is a positive finding in relation to this research question that has implications for clinical practice, although there is no unity across studies. To some degree, it is surprising that not all of the studies reported how they calculated each of their outcome measures, and the measures utilized across the four studies varied. This makes it challenging to identify clinically useful linguistic measures in written discourse.
RQ3. Are there written discourse measures that can be used to evaluate change over time in progressive neurogenic communication disorders?
Of note is the importance of specifying variables related to the advancement of disease, such as MCI to AD. We found that semantic aspects of written discourse were one of the common outcome measures across all three studies. Pekkala et al. (2013) determined primary core words that were produced greater than 10 times in their normative samples, and then added more words that were produced between 2 and 9 times by the controls. They were categorized as Target words, and Target words full, respectively, in the article. Subsequently, Kim et al. (2022b) conducted a retrospective chart review to examine whether a converter group who were initially diagnosed with MCI but later progressed to AD demonstrated a deterioration in core word production compared to a stable group at the MCI stage. They used the same word list that Pekkala et al. (2013) developed, and revised the scoring system. For example, Kim and colleagues did not provide points for spelling errors and repetition of the same word item. Interestingly, both studies demonstrated that production of target words was reflective of degradation in cognition.
Further, Forbes-McKay et al. (2014) expanded our knowledge about the trajectory of language deficits in neurodegenerative disease. Using a variety of outcome measures, visual paragraphias (e.g., tray for plate) statistically differentiated the performance between a 12-month follow-up and the previous follow-ups in AD, and no significant difference was found in semantic paragraphia in AD over 1 year. Together, poorer semantic skills are more pervasive throughout the disease progression, and deficits in visual processing become more prominent as the disease progressed.
One factor that aids in the interpretation of these findings is that all three studies utilized the Cookie Theft picture Goodglass et al. (2001) and Forbes-McKay et al. (2014) additionally included three different line-drawing pictures. Forbes-McKay et al. (2014) intended to manipulate the level of complexity (simple vs. complex) in the picture stimuli, and the Cookie Theft picture was categorized as one of the simple tasks. Interestingly, significant differences were found between AD patients over time only with the simple picture description task. Possibly, simple picture description tasks may be appropriate for eliciting written discourse samples for longitudinal investigation from the MCI stage to a clinically more advanced pathology.
RQ4. How does written discourse performance compare to spoken discourse performance in people with acquired neurogenic disorders?
The fourth research question focused on studies that made direct comparisons between written and spoken discourse measures. These studies have both theoretical and practical implications–any evidence of differences between written and spoken outcome measures provides insight into fundamental questions about language modality, and this is true across all populations (including neurotypical control groups). Moreover, finding that written and spoken discourse measures diverge in unique ways between patients and controls might improve understanding of the nature of the underlying deficits, as well as suggest which tasks and measures may be the most sensitive for purposes of diagnosis or prognosis. For example, indications that written, but not spoken, measures differentiate between some patient group and healthy controls would seem to support the application of writing-based tasks for assessment over spoken ones. One result of our review is that too few direct comparisons (equivalent spoken and written measures assessed within the same participants) have so far been reported in the literature, but those that have (six in total reviewed here) are highly suggestive that the two modalities do provide unique insights into the deficits, especially for PWA in other words, administering both spoken and written discourse tasks seems not to be redundant.
Regarding the two studies of PWA that contrasted spoken and written discourse measures (Behrns et al., 2009; Vandenborre et al., 2018), they generally found that written discourse measures were as good as or better than spoken discourse measures in terms of distinguishing between PWA and healthy controls. The two studies focused on AD (Groves-Wright et al., 2004; Forbes-McKay and Venneri, 2005) were less suggestive of the written modality being diagnostic. When written measures did differentiate between patients and controls, it was typically less discerning than the spoken modality. Finally, the two studies that examined MCI found little to no evidence that written narratives are diagnostic (for differentiating from healthy controls) (Aramaki et al., 2016; Smolík et al., 2016). However, we note that both of those studies suggest that the written narratives, which were untimed, afforded more opportunities for the participants to plan and revise, and that this may have resulted in masking any differences compared to healthy controls. A clear implication is that written narratives should be collected in a format more similar to spoken ones, for example by ensuring that resources such as dictionaries are used equally in both modalities (if at all).
The conclusions that can be drawn are limited for several reasons, including heterogeneity of the outcome measures assessed and a lack of statistical comparisons that specifically target the question of whether written and spoken measures provide unique information for the purposes of diagnosis or prognosis. In particular, researchers should consider not only assessing performance in both modalities, but also analyzing their data in such a way as to provide statistical comparisons between the two (as opposed to independently analyzing each modality). For example, a number of results showed statistical differences between patient and control groups in both modalities–while this might seem to suggest that there is redundant information arising from the spoken and written outcomes, it does not preclude the possibility that one is more sensitive than the other to detecting differences between populations. Similarly, while there were a number of null results that suggested the written modality was less diagnostic than the spoken, no analyses were conducted to determine whether some combination of measures based on both modalities would be superior to either alone. For example, although the spoken measure-based classification model of AD patients in Forbes-McKay and Venneri (2005) outperformed the written one, it is unknown whether a classification model with both modalities together would be superior to either on its own. It is also possible that a composite measure combining the two modalities may be more useful than either alone (given that they are not perfectly correlated), and indeed one study (Aramaki et al., 2016) reported that a measure of the gap in performance between the two modalities was diagnostic of early MCI. Therefore, future work should statistically assess the two outcome measures jointly, such as by assessing unique variance explained by one modality when controlling for the other, by investigating interactions between the two modalities, or by developing aggregate scores of spoken and written performance.
4 Discussion
The purpose of the study was to review the existing literature related to written discourse that assists with direct and systematic replication of the existing findings and for potential clinical use. Specifically, the current review aimed to answer the following questions: (1) what are the documented differences in written discourse in PWA, PPA, MCI, and AD compared to control groups (2) does performance on written discourse tasks/measures distinguish between different patient populations (3) are there written discourse measures that can be used to evaluate changes with disease progression, and (4) how does written discourse performance compare to spoken discourse performance in acquired neurogenic disorders? Given the heterogeneity of discourse elicitation protocols and analysis methods reported across studies, our results have not been systematically synthesized. Thus, we conducted this narrative review to answer our research questions using a systematic search.
Written discourse is an emerging area with important implications for functional communication. This review has significant implications which can potentially improve our understanding of the clinical utility of written discourse analysis and provide goals for future research on written discourse. First, many of the studies reviewed reported limited methodological details. There is a wide array of outcome measures utilized across the studies, and only a few measures were consistently present in the literature. Modified TTRs from Aramaki et al. (2016) and Davy et al. (2016) may be the same measure; however, not enough information was reported to make this determination. Simultaneously, considerable variations in the terminology used to describe what was measured exist. For example, information units that Groves-Wright et al. (2004) utilized may have been the same measure as correct information units in Vandenborre et al. (2018). Currently, the lack of information is a critical barrier to replication and generalization of the findings, which is required to strengthen scientific evidence.
Second, performance at macrostructural levels has been sporadically investigated and reported. Among 102 variables identified, only 13 measures (12.7%) (discourse level and general quality of writing domains in Table 3) were related to assessing writing skills beyond the sentence level. Translating and organizing ideas into a message in writing is challenging in people with brain injury (Wheeler et al., 2014; Dinnes and Hux, 2022). As with studies regarding spoken discourse, additional efforts must be made to conduct in-depth investigations of multilevel aspects of written discourse to form a clearer picture of the mechanisms in different patient populations.
Third, there was variability in the discourse elicitation techniques across studies, which in turn affected the quality and quantity of written language samples, such as use of lexical content and discourse organization. Based on our review, there is some evidence that structured tasks (e.g., picture description tasks) may provide more opportunities to observe deficits or breakdowns in written discourse than less structured (e.g., writing personal experience) tasks in neurodegenerative disease populations. Two studies demonstrated greater production of spelling errors found in structured tasks using wordless picture books compared to when less structured tasks were given to PWA (Behrns et al., 2010; Johansson-Malmeling et al., 2020), which provides some evidence for a task effect on written discourse outcomes. However, the value of more functional discourse writing tasks that may better capture everyday writing vs. more structured tasks that may result in more diagnostic sensitivity is not clear based on the current literature. Sixteen out of 19 studies included a single type of discourse task, which does not allow us to draw conclusions about the most appropriate elicitation technique for written discourse. Thus, future work may include manipulating tasks and stimuli to directly contrast writing performances.
Further, many questions about writing format are still unanswered. The literature reviewed included studies that evaluated handwriting and typing with no direct comparisons, although the two have varied cognitive and motoric requirements. With the recent increase in mobile messaging, such as texting and instant messaging, new questions have arisen for how to evaluate written discourse and written conversation. Now that text messaging is a common communication modality and can increase communication opportunities in those with acquired neurogenic communication disorders, it may be necessary to assess texting behaviors to capture the full range and multifaceted nature of functional communication abilities in assessment. This work is only beginning to appear in the literature and will be important for the future of writing research (Kinsey et al., 2022; Lee and Cherney, 2022).
Of note is the importance of variables that influence performance in writing, such as years of education. A high level of education is thought to increase cognitive reserve which can improve outcomes after brain damage (Beausoleil et al., 2003). We found that the level of education is not a variable which contributes to writing performance in PWA (Vandenborre et al., 2018) and people with cognitive impairment (Sand Aronsson et al., 2020). Interestingly, education was found to influence writing performance in cognitively healthy adults (Forbes-McKay and Venneri, 2005; Vandenborre et al., 2018). Mortensen (2005) speculated that variation in writing performance could be attributed to different levels of education in cognitively healthy adults. However, the effect of education in writing performance in acquired neurogenic communication disorders has not been consistently studied, and evidence to support the current findings is lacking.
As mentioned by Thiel et al. (2015), standardized diagnostic tools for functional writing are lacking. Admittedly, this lack could be due to the limited methodological foundation in written discourse research. One major issue in this field is that large-scale group studies are scarce. The lack of large-scale group studies is accompanied by the tendency for writing to still be considered as a subsidiary communication channel in the clinic and in research, despite the fact that individuals with acquired neurogenic communication disorders often report written communication as a primary concern (Thiel and Conroy, 2022). In this review, we found a number of studies that included writing skills as one of the measures but downplayed them in their findings and discussion. Although infrequently done, when both written and spoken discourse tasks were administered, the findings revealed that performance in written modality was often equally as informative, and at times more informative than, the spoken modality (Behrns et al., 2009; Vandenborre et al., 2018). From a cognitive and neurobiological perspective this is unsurprising, considering that mental processes and neural substrates required to produce written text are only partially overlapping with those for spoken language production. Overall, the comparative inattention to written discourse creates a real challenge and places investigations of writing outside the mainstream of linguistic measures.
Lastly, another main weakness in the field included inconsistent testing of reliability and replication of results across studies. For example, 15 studies collected handwriting samples in this review. Eight studies reported reliabilities in their outcome measures, and only two studies reported reliabilities in word-to-word transcription. It is doubtful that handwriting from people with neurogenic disorders is clean and easy to read, and has absolute agreement among assessors. There is a need for more rigorous methodology and evaluation of writing samples for high-quality research. A summary of the key recommendations is provided in Table 6.
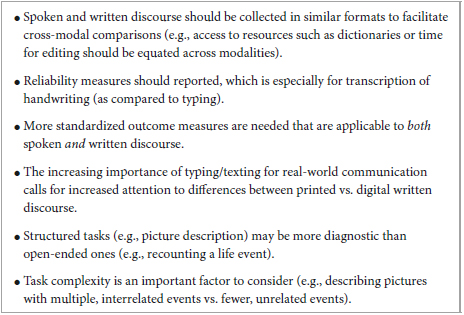
Table 6. Recommendations for future research.
5 Limitations of the current review
We should acknowledge that the current review was limited by the small number of studies published from January 2000 to March 2023. As the focus of this study was to provide a comprehensive description of the current state of research pertaining to discourse-level writing ability in different types of acquired neurogenic communication disorders, we conducted a systematic search. However, we could not conduct a systematic review and meta-analysis due to heterogeneity in methods, study populations, tasks, and outcome measures, and thus results were summarized narratively. This study did not include any gray literature (e.g., dissertation) and included only English-written articles, which might have affected our results. Publication bias could not be estimated due to the small number of articles that targeted the acquired language disorders in this review (fewer than 10 per disorder). Some individuals with specific disorders are underrepresented in this review such as PPA, and thus, we have insufficient evidence to support clinical usability of written discourse at the current stage. Moreover, there are some articles that did not fully report demographic information on study populations, how linguistic variables were computed, how the researchers investigated reliability of the transcription, and/or calculation of linguistic variables. Therefore, data should be interpreted with caution. Lastly, nine articles (47%) are relevant to different languages (e.g., Swedish, Japanese), and the study populations were non-English speakers. In those nine articles, some measures used were originally developed in a particular language (e.g., affix in Swedish, Kana errors related to number of strokes in Japanese). The diversity of linguistic backgrounds in the articles reviewed makes it difficult to draw robust conclusions and recommendations on the feasibility of the approach and clinical practices.
6 Conclusion
The current review is the first attempt to provide an overview of what has been investigated in written discourse ability in people with acquired neurogenic communication disorders. It is evident from this small number studies published for each disorder that research pertaining to discourse-level writing is still at an early stage and is in need of further investigations and replications. Writing activity in daily life has a positive impact on emotions such as depression and isolation, and makes individuals feel more connected with society (Ball and Postman, 2022). Therefore, it is time to build evidence to incorporate discourse-level writing ability into assessments for our clients. We hope that this paper will encourage researchers and clinicians to apply more scrutiny to writing skills at the discourse level. Notably, this paper did not include a review of treatments that address written discourse, but this will be addressed in future work.
Author contributions
HK: Conceptualization, Methodology, Visualization, Writing – original draft, Writing – review and editing. JO: Conceptualization, Methodology, Writing – original draft, Writing – review and editing. RW: Conceptualization, Methodology, Writing – original draft, Writing – review and editing.
Funding
The author(s) declare that no financial support was received for the research, authorship, and/or publication of this article.
Conflict of interest
The authors declare that the research was conducted in the absence of any commercial or financial relationships that could be construed as a potential conflict of interest.
Publisher’s note
All claims expressed in this article are solely those of the authors and do not necessarily represent those of their affiliated organizations, or those of the publisher, the editors and the reviewers. Any product that may be evaluated in this article, or claim that may be made by its manufacturer, is not guaranteed or endorsed by the publisher.
Supplementary material
The Supplementary Material for this article can be found online at: https://www.frontiersin.org/articles/10.3389/fnhum.2023.1264582/full#supplementary-material
References
Ahmed, S., Haigh, A., de Jager, C., and Garrard, P. (2013). Connected speech as a marker of disease progression in autopsy-proven Alzheimer’s disease. Brain 136, 3727–3737. doi: 10.1093/brain/awt269
Aramaki, E., Shikata, S., Miyabe, M., and Kinoshita, A. (2016). Vocabulary size in speech may be an early indicator of cognitive impairment. PLoS One 11:e0155195. doi: 10.1371/journal.pone.0155195
Ash, S., Evans, E., O’Shea, J., Powers, J., Boller, A., Weinberg, D., et al. (2013). Differentiating primary progressive aphasias in a brief sample of connected speech. Neurology 81, 329–336. doi: 10.1212/WNL.0b013e31829c5d0e
Ball, A., and Postman, W. (2022). Written language usage with pen and technology in adults across generations. Commun. Disord. Q. 43, 84–95. doi: 10.1177/1525740120961318
Beausoleil, N., Fortin, R., Blanc, B., and Joanette, Y. (2003). Unconstrained oral naming performance in right-and left-hemisphere-damaged individuals: When education overrides the lesion. Aphasiology 17, 143–158. doi: 10.1080/729255219
Behrns, I., Ahlsén, E., and Wengelin, A. (2010). Aphasia and text writing. Int. J. Lang. Commun. Disord. 45, 230–243. doi: 10.3109/13682820902936425
Behrns, I., Ahlsén, E., and Wengelin, Å (2008). Aphasia and the process of revision in writing a text. Clin. Linguist. Phonetics 22, 95–110. doi: 10.1080/02699200701699603
Behrns, I., Wengelin, Å, Broberg, M., and Hartelius, L. (2009). A comparison between written and spoken narratives in aphasia. Clin. Linguist. Phonetics 23:7. doi: 10.1080/02699200902916129
Brisebois, A., Brambati, S., Boucher, J., Rochon, E., Leonard, C., Désilets-Barnabé, M., et al. (2021). A longitudinal study of narrative discourse in post-stroke aphasia. Aphasiology 36, 805–830. doi: 10.1111/1460-6984.12844
Bryant, L., Ferguson, A., and Spencer, E. (2016). Linguistic analysis of discourse in aphasia: A review of the literature. Clin. Linguist. Phon. 30, 489–518. doi: 10.3109/02699206.2016.1145740
Coggins, T. E., Friet, T., and Morgan, T. (1998). Analyzing narrative productions in older school-age children and adolescents with fatal alcohol syndrome: An experimental tool for clinical applications. Clin. Linguist. Phonetic. 12, 221–236.
Davy, W., Travis, J., Laura, W., Amylou, D., Dona, L., Richard, C., et al. (2016). Towards automatic detection of abnormal cognitive decline and dementia through linguistic analysis of writing samples. Proc. NAACL-HLT 2016, 1198–1207.
Dinnes, C., and Hux, K. (2022). Perceptions about writing by adults with moderate or severe traumatic brain injury. Am. J. Speech-Language Pathol. 31, 838–853. doi: 10.1044/2021_AJSLP-21-00212
Ferrari, R. (2015). Writing narrative style literature reviews. Med. Writ. 24, 230–235. doi: 10.1179/2047480615Z.000000000329
Fleming, V., and Harris, J. (2008). Complex discourse production in mild cognitive impairment: Detecting subtle changes. Aphasiology 22, 729–740. doi: 10.1080/02687030701803762
Forbes, K., Shanks, M., and Venneri, A. (2004). The evolution of dysgraphia in Alzheimer’s disease. Brain Res. Bull. 63, 19–24. doi: 10.1016/j.brainresbull.2003.11.005
Forbes-McKay, K., Shanks, M., and Venneri, A. (2014). Charting the decline in spontaneous writing in Alzheimer’s disease: a longitudinal study. Acta Neuropsychiatr. 26, 246–252. doi: 10.1017/neu.2014.2
Forbes-McKay, K., and Venneri, A. (2005). Detecting subtle spontaneous language decline in early Alzheimer’s disease with a picture description task. Neurol. Sci. 26, 243–254. doi: 10.1007/s10072-005-0467-9
Fromm, D., Forbes, M., Holland, A., Dalton, S., Richardson, J., and MacWhinney, B. (2017). Discourse characteristics in aphasia beyond the Western aphasia battery cutoff. Am. J. Speech-Language Pathol. 26, 762–768. doi: 10.1044/2016_AJSLP-16-0071
Glosser, G., and Deser, T. (1992). A comparison of changes in macrolinguistic and microlinguistic aspects of discourse production in normal aging. J. Gerontol. 47, 266–272. doi: 10.1093/geronj/47.4.p266
Goodglass, H., Kaplan, E., and Barresi, B. (2001). The assessment of aphasia and related disorders. Philadelphia, PA: Lippincott Williams & Wilkins.
Graham, S., Harris, K., and Olinghouse, N. (2007). Addressing Executive Function Problems in Writing: An Example from the Self-Regulated Strategy Development Model. Executive function in education: From theory to practice. New York, NY: The Guilford Press.
Grant, M., and Booth, A. (2009). A typology of reviews: an analysis of 14 review types and associated methodologies. Heal. Inf. Libr. J. 26, 91–108. doi: 10.1111/j.1471-1842.2009.00848.x
Groves-Wright, K., Neils-Strunjas, J., Burnett, R., and O’Neill, M. J. (2004). A comparison of verbal and written language in Alzheimer’s disease. J. Commun. Disord. 37, 109–130. doi: 10.1016/j.jcomdis.2003.08.004
Hayashi, A., Nomura, H., Mochizuki, R., Ohnuma, A., Kimpara, T., Suzuki, K., et al. (2015). Writing impairments in japanese patients with mild cognitive impairment and with mild Alzheimer’s disease. Dement. Geriatr. Cogn. Dis. Extra 5, 309–319. doi: 10.1159/000437297
Hayes, J., and Flower, L. (1980). “Identifying the organisation of the writing process,” in Cognitive Processes in Writing: An Interdisciplinary Approach, eds L. W. Gregg and E. R. Steinberg (Hillsdale, NJ: Lawrence Erlbaum), 3–30.
Horigome, T., Hino, K., Toyoshiba, H., Shindo, N., Funaki, K., Eguchi, Y., et al. (2022). Identifying neurocognitive disorder using vector representation of free conversation. Sci. Rep. 12:12461. doi: 10.1038/s41598-022-16204-4
Jaecks, P., and Jonas, K. (2022). Digital assessment of acquired alexia and Agraphia: On the relevance of written discourse. Front. Commun. 7:798143. doi: 10.3389/fcomm.2022.798143
Johansson-Malmeling, C., Hartelius, L., and Wengelin, Å, and Henriksson, I. (2020). Written text production and its relationship to writing processes and spelling ability in persons with post-stroke aphasia. Aphasiology 35, 615–632. doi: 10.1080/02687038.2020.1712585
Kim, B., Kim, Y., and Kim, H. (2019). Discourse measures to differentiate between mild cognitive impairment and healthy aging. Front. Aging Neurosci 11:221. doi: 10.3389/fnagi.2019.00221
Kim, H., Berube, S., and Hillis, A. (2022a). Core lexicon in aphasia: A longitudinal study. Aphasiology 37, 1679–1691. doi: 10.1080/02687038.2022.2121598
Kim, H., Walker, A., Shea, J., and Hillis, A. (2022b). Written discourse task helps to identify progression from mild cognitive impairment to dementia. Dement. Geriatr. Cogn. Disord. 50, 446–453. doi: 10.1159/000519884
Kinsey, L., Lee, J., Larkin, E., and Cherney, L. (2022). Texting behaviors of individuals with chronic aphasia: A descriptive study. Am. J. Speech-Language Pathol. 31, 99–112. doi: 10.1044/2021_AJSLP-20-00287
Lee, J., and Cherney, L. (2022). Transactional success in the texting of individuals with aphasia. Am. J. Speech-Language Pathol. 31, 2348–2365. doi: 10.1044/2022_AJSLP-21-00291
Mortensen, L. (2005). Written discourse and acquired brain impairment: Evaluation of structural and semantic features of personal letters from a Systemic Functional Linguistic perspective. Clin. Linguist. Phon. 19, 227–247. doi: 10.1080/02699200410001698652
Mueller, K., Hermann, B., Mecollari, J., and Turkstra, L. (2018). Connected speech and language in mild cognitive impairment and Alzheimer’s disease: A review of picture description tasks. J. Clin. Exp. Neuropsychol. 40, 917–939. doi: 10.1080/13803395.2018.1446513
Obermeyer, J., and Edmonds, L. (2018). Attentive reading with constrained summarization adapted to address written discourse in people with mild aphasia. Am. J. Speech-Language Pathol. 27, 392–405. doi: 10.1044/2017_AJSLP-16-0200
Olness, G. S., Ulatowska, H. K., Carpenter, L. J., Williamshubbard, L. J., and Dykes, J. C. (2005). Holistic assessment of narrative quality: A social validation study. Aphasiology 19, 251–262.
Pekkala, S., Wiener, D., Himali, J., Beiser, A., Obler, L., Liu, Y., et al. (2013). Lexical retrieval in discourse: An early indicator of Alzheimer’s dementia. Clin. Linguist. Phonetics 27, 905–921. doi: 10.3109/02699206.2013.815278
Pritchard, M., Hilari, K., Cocks, N., and Dipper, L. (2017). Reviewing the quality of discourse information measures in aphasia. Int. J. Lang. Commun. Disord. 52, 689–732. doi: 10.1111/1460-6984.12318
Pulgram, E. (1965). Graphic and phonic systems: figurae and signs. Word 21, 208–224. doi: 10.1080/00437956.1965.11435424
Rapp, B., and Fischer-Baum, S. (2015). Uncovering the cognitive architecture of spelling. The handbook of adult language disorders. London: Psychology Press.
Rodríguez-Ferreiro, J., Martínez, C., Pérez-Carbajal, A., and Cuetos, F. (2014). Neural correlates of spelling difficulties in Alzheimer’s disease. Neuropsychologia 65, 12–17. doi: 10.1016/j.neuropsychologia.2014.10.006
Sand Aronsson, F., Kuhlmann, M., Jelic, V., and Östberg, P. (2020). Is cognitive impairment associated with reduced syntactic complexity in writing? Evidence from automated text analysis. Aphasiology 35, 1–14. doi: 10.1080/02687038.2020.1742282
Sitek, E., Barczak, A., Kluj-Kozłowska, K., Kozłowski, M., Barcikowska, M., and Sławek, J. (2015). Is descriptive writing useful in the differential diagnosis of logopenic variant of primary progressive aphasia, Alzheimer’s disease and mild cognitive impairment? Neurol. Neurochir. Pol. 49, 239–244. doi: 10.1016/j.pjnns.2015.06.001
Smolík, F., Stepankova, H., Vyhnálek, M., Nikolai, T., Horáková, K., and Matějka. (2016). Propositional density in spoken and written language of czech-speaking patients with mild cognitive impairment. J. Speech Lang. Hear. Res. 59, 1461–1470. doi: 10.1044/2016_JSLHR-L-15-0301
Suárez-González, A., Cassani, A., Gopalan, R., Stott, J., and Savage, S. (2021). When it is not primary progressive aphasia: a scoping review of spoken language impairment in other neurodegenerative dementias. Alzheimer’s Dement. Transl. Res. Clin. Interv. 7, e12205. doi: 10.1002/trc2.12205
Thiel, L., and Conroy, P. (2022). ‘I think writing is everything’: An exploration of the writing experiences of people with aphasia. Int. J. Lang. Commun. Disord. 57, 1381–1398. doi: 10.1111/1460-6984.12762
Thiel, L., Sage, K., and Conroy, P. (2015). Retraining writing for functional purposes: A review of the writing therapy literature. Aphasiology 29, 423–441. doi: 10.1080/02687038.2014.965059
Ulatowska, H. H., Hildebrand, B. H., and Haynes, S. M. (1978). A comparison of written and spoken language in aphasia, in proceedings of the clinical aphasiology (Minneapolis, MN: BRK Publication).
Ulatowska, H., and Olness, G. (2004). lar to coherence in that it is a relational concept; text. Cambridge, MA: MIT Press, 300.
Vandenborre, D., Visch-Brink, E., van Dun, K., Verhoeven, J., and Mariën, P. (2018). Oral and written picture description in individuals with aphasia. Int. J. Lang. Commun. Disord. 53, 294–307. doi: 10.1111/1460-6984.12348
Wheeler, L., Nickerson, S., Long, K., and Silver, R. (2014). Expressive writing in people with traumatic brain injury and learning disability. NeuroRehabilitation 34, 29–37. doi: 10.3233/NRE-131007
Wilson, B., and Proctor, A. (2002). Written discourse of adolescents with closed head injury. Brain Inj. 16, 1011–1024. doi: 10.1080/02699050210147248
Wolfe-Quintero, K., Inagakai, S., and Kim, H. -Y. (1998). Second language development in writing: measures of fluency, accuracy, & complexity. Honolulu, HI: Second Language Teaching & Curriculum Centre, University of Hawai’i University of Hawai’i Press.
World Health Organization (2007). International Classification of Functioning, Disability, and Health (ICF): Children & Youth Version: ICF-CY. Geneva: World Health Organization.
Keywords: written discourse, aphasia, primary progressive aphasia, mild cognitive impairment, writing assessment, Alzheimer’s disease
Citation: Kim H, Obermeyer J and Wiley RW (2024) Written discourse in diagnosis for acquired neurogenic communication disorders: current evidence and future directions. Front. Hum. Neurosci. 17:1264582. doi: 10.3389/fnhum.2023.1264582
Received: 21 July 2023; Accepted: 23 November 2023;
Published: 11 January 2024.
Edited by:
Jessica A. Turner, The Ohio State University, United StatesReviewed by:
Michael Fraas, Independent Researcher, Seattle, WA, United StatesTamer Abou-Elsaad, Mansoura University, Egypt
Copyright © 2024 Kim, Obermeyer and Wiley. This is an open-access article distributed under the terms of the Creative Commons Attribution License (CC BY). The use, distribution or reproduction in other forums is permitted, provided the original author(s) and the copyright owner(s) are credited and that the original publication in this journal is cited, in accordance with accepted academic practice. No use, distribution or reproduction is permitted which does not comply with these terms.
*Correspondence: Hana Kim, aGFuYWtpbTFAdXNmLmVkdQ==