 Alioth Guerrero-Aranda1,2
 Evelin Ramírez-Ponce3
 Oscar Ramos-Quezada3
 Omar Paredes3,4Erick Guzmán-Quezada5,6Alejandra Genel-Espinoza7
 Rebeca Romo-Vazquez3*
 Hugo Vélez-Pérez3*
- 1Depto. de Ciencias de la Salud, Centro Universitario de Los Valles, Universidad de Guadalajara, Guadalajara, Jalisco, Mexico
- 2Clínica de Epilepsia, Hospital “Country 2000,” Guadalajara, Jalisco, Mexico
- 3Depto. de Bioingeniería Traslacional, Centro Universitario de Ciencias Exactas e Ingenierías, Universidad de Guadalajara, Guadalajara, Jalisco, Mexico
- 4Mecatrónica, Instituto Tecnológico y de Estudios Superiores de Monterrey, Escuela de Ingenierías y Ciencias (ITESM) Campus Guadalajara, Zapopan, Mexico
- 5Depto. de Ciencias Computacionales, Centro Universitario de Ciencias Exactas e Ingenierías, Universidad de Guadalajara, Guadalajara, Jalisco, Mexico
- 6Depto. de Electromecánica, Universidad Autónoma de Guadalajara, Zapopan, Jalisco, Mexico
- 7Centro Infantil para el Desarrollo Neuroconductual, Hermosillo, Sonora, Mexico
A typical absence seizure is a generalized epileptic event characterized by a sudden, brief alteration of consciousness that serves as a hallmark for various generalized epilepsy syndromes. Distinguishing between similar interictal and ictal electroencephalographic (EEG) epileptiform patterns poses a challenge. However, quantitative EEG, particularly spectral analysis focused on EEG rhythms, shows potential for differentiation. This study was designed to investigate discernible differences in EEG spectral dynamics and entropy patterns during the pre-ictal and post-ictal periods compared to the interictal state. We analyzed 20 EEG ictal patterns from 11 patients with confirmed typical absence seizures, and assessed recordings made during the pre-ictal, post-ictal, and interictal intervals. Power spectral density (PSD) was used for the quantitative analysis that focused on the delta, theta, alpha, and beta bands. In addition, we measured EEG signal regularity using approximate (ApEn) and multi-scale sample entropy (MSE). Findings demonstrate a significant increase in delta and theta power in the pre-ictal and post-ictal intervals compared to the interictal interval, especially in the posterior brain region. We also observed a notable decrease in entropy in the pre-ictal and post-ictal intervals, with a more pronounced effect in anterior brain regions. These results provide valuable information that can potentially aid in differentiating epileptiform patterns in typical absence seizures. The implications of our findings are promising for precision medicine approaches to epilepsy diagnoses and patient management. In conclusion, our quantitative analysis of EEG data suggests that PSD and entropy measures hold promise as potential biomarkers for distinguishing ictal from interictal epileptiform patterns in patients with confirmed or suspected typical absence seizures.
1. Introduction
A typical absence seizure is a generalized epileptic event characterized by a sudden, brief alteration of consciousness (Bancaud et al., 1981). During these seizures, individuals often experience loss of awareness and may struggle to recall events that occurred during the episode (Fisher et al., 2017). In-depth semiological analysis can reveal subtle clonic movements that affect various facial regions (Sadleir et al., 2006). Oral and manual automatisms are frequently observed, and patients may show a tendency to continue a behavior that was occurring before seizure onset (Sadleir et al., 2009). Typical absence seizures are an important hallmark of many generalized epilepsy syndromes. They can be examined effectively through simple visual observation (Hirsch and Panayiotopoulos, 2005). Recently, video-electroencephalographic (video-EEG) monitoring has become a valuable tool for investigating these seizures, but it may not be readily available in resource-limited regions where EEG procedures often do not include video acquisition. Consequently, if the technician fails to capture the event during EEG recording (i.e., by not examining the patient), the only means to confirm the occurrence of an absence seizure is through EEG analysis.
The classic EEG pattern observed during a typical absence seizure is characterized by regular, generalized spike-and-wave activity, with a predominant anterior distribution occurring at a frequency of 3 Hz (Koutroumanidis et al., 2017). In certain cases, slight variations in this pattern may include faster irregular spike-and-wave activity, ranging from 3.5–6 Hz, or polyspike-and-wave complexes (Panayiotopoulos et al., 1989). It is important to note, however, that patients may also exhibit interictal epileptiform discharges that share similar features with the ictal pattern, making differentiation challenging (Antwi et al., 2019; Springer et al., 2022). Some features may provide clues to the ictal nature of the pattern, including longer duration, greater frequency, morphology, or evolution, as well as the presence of movement artifacts (e.g., blinking) that may be indicative of an ictal pattern (Koutroumanidis et al., 2017).
Differentiating between ictal and interictal EEG patterns in patients with suspected typical absence seizures is crucial for two main reasons. First, accurate diagnoses are essential for patients with suspected epilepsy. Studies have shown that first-degree healthy relatives of individuals with epilepsy can exhibit interictal epileptiform discharges on their EEGs (genetic traits) (Tashkandi et al., 2019). Therefore, distinguishing these patterns accurately is necessary to avoid misdiagnoses in such cases. Second, differentiating between ictal and interictal patterns is crucial for managing patients with confirmed epilepsy, as the presence of an ictal pattern on EEG recordings may indicate treatment failure and the need to readjust the medication prescribed. Correct identification of these patterns, then, will assist clinicians in making appropriate decisions regarding treatment strategies and optimizing patient care.
However, experience has shown that in some cases, qualitative analysis of EEG recordings through simple visual inspection may not suffice to make definitive determinations (Blumenfeld, 2005). Additional diagnostic techniques and expert interpretation may be necessary to accurately differentiate between these patterns (Trenité and Vermeiren, 2005).
Quantitative EEG analysis (qEEG) involves applying mathematical techniques to time series data to reveal, or extract, information that may not be readily apparent to the human eye. In recent years, qEEG has proven to be a valuable tool in various clinical contexts (Kramer and Kromm, 2019; Koberda, 2021; Tenney et al., 2021; Munjal et al., 2022). One widely used approach in clinical practice consists in analyzing spectral components by means of the classic measures that include absolute and relative power.
Numerous studies in the field of epilepsy research have focused on analyzing the EEG power spectrum (Clemens et al., 2021; Irelli et al., 2022; Zhong et al., 2022). Among these, special attention has been given to the alpha rhythm, which is influenced by cortico-thalamic interactions. These cortico-thalamic interaction have been demonstrated to play a crucial role in generating generalized seizures and spike-and-wave discharges (Bai et al., 2010; Carney et al., 2010).
The hypothesis of this work, thus, concerns the neural dynamics that occur in the moments immediately preceding and following a typical absence seizure. We speculate that these dynamics may induce subtle modifications in background EEG activity, such as slowing, which could potentially be detected in the spectral characteristics of the signals recorded. The study, therefore, analyzes whether discernible differences in the spectral content and the regularity of EEGs during the pre-ictal and post-ictal periods, compared to the interictal state, can serve as indicators to distinguish between the ictal and interictal nature of the epileptiform patterns observed.
2. Materials and methods
2.1. Participants and EEG recording
Eleven patients (seven females) were recruited from the Epilepsy Clinic at the “Country 2000” Hospital in Jalisco, Mexico, based on the following criteria: (a) age 5–19 years; (b) confirmed diagnosis of either childhood or juvenile absence epilepsy according to the International League Against Epilepsy classification; (c) presence of ictal EEG patterns (3–4 Hz bilateral spike-and-wave discharges) with normal background; and (d) not on anti-seizure medication at the moment of EEG recording. Potential candidates with (a) structural brain abnormalities; (b) neurological or psychiatric disorders; or (c) excessive interference or poor EEG data quality were excluded.
All these patients were referred to the Clinic to undergo an EEG because of clinical events suspecting typical absence seizures. In fact, the EEG led to the confirmation of the diagnosis. That is why all these patients were not on antiseizure medication at the moment of the EEG. Six out of the seven patients demonstrated a previous normal history and just recently had started with these suspicious clinical events. Only one adolescent patient referred a prior bilateral tonic-clonic (BTC) seizure at the age of 11 (4 years before the EEG). We are aware that the potential underreporting or overlooking of typical absence seizures by patients and their caregivers might complicate the precise onset timing of the epilepsy. Regarding the particular case of the adolescent with the previous BTC seizure, there is a chance that the epilepsy might have started at that moment. However, we could not rule out that it was a symptomatic seizure. Not withstanding, we decided to categorize all these patients with new-onset epilepsy, while acknowledging the possibility of delayed recognition.
A total of 20 typical absence seizures from these patients were extracted from their EEGs for inclusion in the analysis. All seizures were confirmed through behavioral testing by the EEG technician (online) and analyzed by means of video-EEG by expert clinical epileptologists/neurophysiologists (offline). All EEGs were recorded using 21 electrodes placed according to the International 10–20 System, employing a Cadwell Arc Essentia 32 Channel Clinical EEG system (high-pass filter: 0.53 Hz; low-pass filter: 70 Hz; sampling rate: 256 Hz; <5 kΩ) (Figure 1).
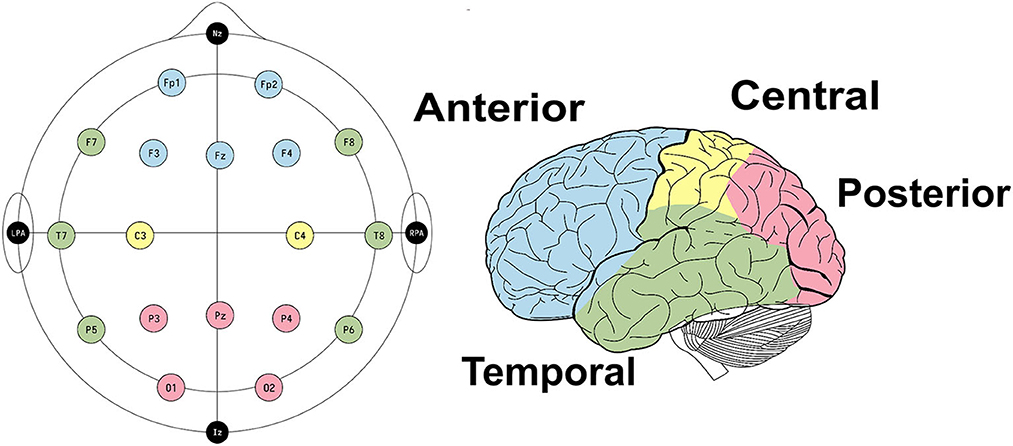
Figure 1. EEG set-up and electrode clusters used to conduct the statistical analysis.
The study protocol was approved by the ethics committee of the “Country 2000” Hospital, and all procedures were conducted following the standards of the Helsinki Declaration. Written informed consent was obtained from each participant (for adults) or her/his parents (for children).
2.2. EEG pre-processing
In this study, EEG recordings were low-filtered with a cutoff frequency of 55 Hz. Distinct pre-ictal, post-ictal, and interictal segments were considered from each EEG seizure recorded. The pre-ictal segment included a temporal window of 1s prior to the onset of the seizure, while the post-ictal segment comprised the 1s interval following the termination of seizure activity (Figure 2). Not always typical absence seizures start and finish abruptly. Therefore, we decided to rule out 1 second prior to the initial deflection of the first spike of the discharge and 1s after the final deflection of the last wave of the discharge. We then selected for the analysis the 1s windows before and after these previously ruled-out windows and categorized them as pre-ictal and post-ictal states respectively. The temporal markers for both the pre-ictal and post-ictal segments were identified by the medical specialist. The interictal segment was selected while patients were in the eyes-closed condition. All segments were standardized to a duration of 1s to ensure the quasi-stationarity of the EEG signals.
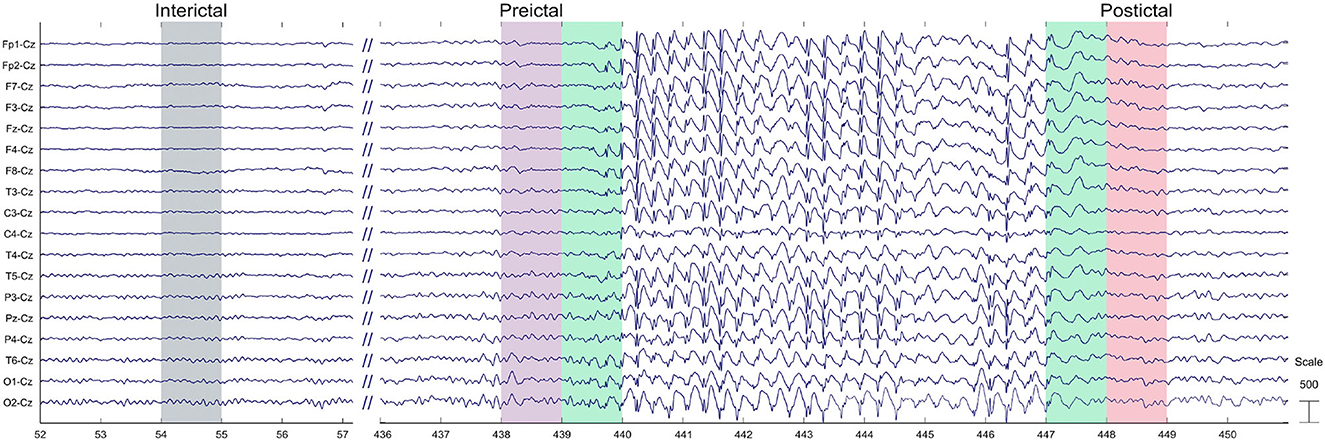
Figure 2. Example of the 1 second windows chosen for the interictal, pre-ictal, and post-ictal states.
2.3. Power spectrum analysis
After pre-processing, the power spectral density (PSD) (Equation 1) of each EEG channel was computed using Fast Fourier Transformation (FFT).
A comprehensive assessment of the absolute energy in specific frequency bands—delta (1–3 Hz), theta (4–7 Hz), alpha (8–13 Hz), and beta (14–30 Hz)—was conducted. To quantify the energy of each frequency band, we estimated the energy of all frequencies. Considering the factor of inter-subject variability, and in order to facilitate comparisons, all energy values were normalized by dividing each one by the standard deviation of the corresponding frequency band. Finally, the mean energy value for each EEG channel was computed for the interictal, pre-ictal, and post-ictal states for each frequency band.
2.4. Entropy
We computed the approximate (ApEn) (Sakkalis et al., 2013) and multi-scale sample entropy (MSE) (Costa et al., 2005) to quantify the regularity of the time series data (Pincus, 1991; Richman and Moorman, 2000). ApEn is used to assess the degree of regularity in the data, with smaller values indicating higher regularity, and larger ones suggesting reduced regularity (Acharya et al., 2012). ApEn can also detect changes in underlying episodic behavior that might not be evident in the data on peak occurrences or amplitudes (Pincus and Keefe, 1992). This tool was also used to compare regularity across the interictal, pre-ictal, and post-ictal states. The computation of ApEn is defined by Equations 2, 3:
with,
where N denotes the number of data points and m represents the number of samples where two segments are expected to exhibit similarity. To address variability in the time scales present in the biological signals recorded, we extended the analysis to multi-scale sample entropy, an approach that enhanced the robustness of our quantification of regularity. In summary, our comprehensive data set incorporates various measures, including the energy in four frequency bands, ApEn, and MSE, for all channels in each time window. Each segment in the dataset was labeled to indicate whether it corresponds to an interictal, pre-ictal, or post-ictal state.
2.5. Statistical analysis
After calculating the average energies and entropies for each electrode, all features were normalized to Z-score values by subtracting their corresponding mean and dividing by their standard deviation (Figure 3). This approach was chosen to (i) mitigate biases resulting from individual feature scales; and (ii) focus on the nature of the distribution. Subsequently, outliers were removed from each feature. An outlier was defined as a value that fell outside 1.5 times the inter-quartile range below the 1st and above the 3rd quartile. To conduct the statistical analysis based on seizure behavior, the electrodes were categorized into four groups: anterior (Fp1, Fp2, F3, F4, Fz), posterior (O1, O2, P3, P4, Pz), temporal (F7, F8, T7, T8, P5, P6), and central (C3, C4) (Figure 1).
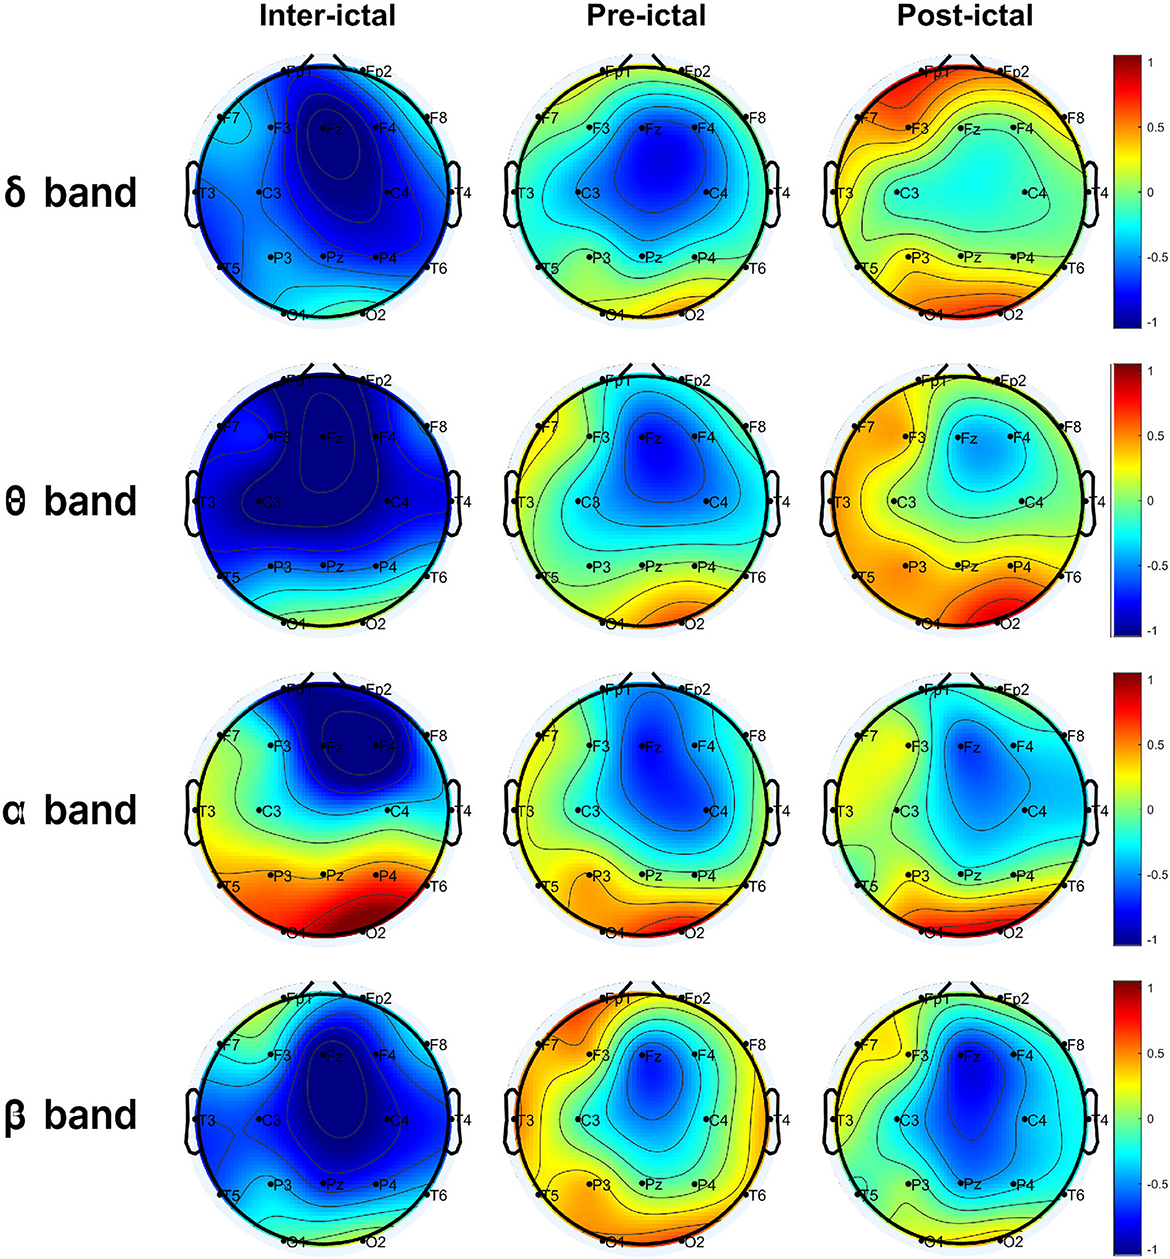
Figure 3. Normalized average energy in the delta (δ), theta (θ), alpha (α), and beta (β) bands of all windows corresponding to the interictal, pre-ictal, and post-ictal states.
After that, a statistical pipeline was driven on each electrode set. The pipeline consisted of a one-way ANOVA test to evaluate significant differences among the interictal, pre-ictal, and post-ictal intervals for each feature. For the characteristics that showed differences, a Benjamini-Hochberg procedure for multiple comparisons was applied between time intervals. This approach allowed us to identify statistical differences between pairs of ictal windows.
3. Results
Electrophysiological activity was analyzed during the three intervals identified above: interictal, pre-ictal, and post-ictal, for each frequency band (delta, theta, alpha, beta). The distributions of energy and entropy are presented in Figures 4, 5, respectively. To explore significant differences among these intervals for regional electrodes, a statistical pipeline was performed, as detailed in the Materials and methods section. Results of the statistical analysis are shown in Tables 1, 2.
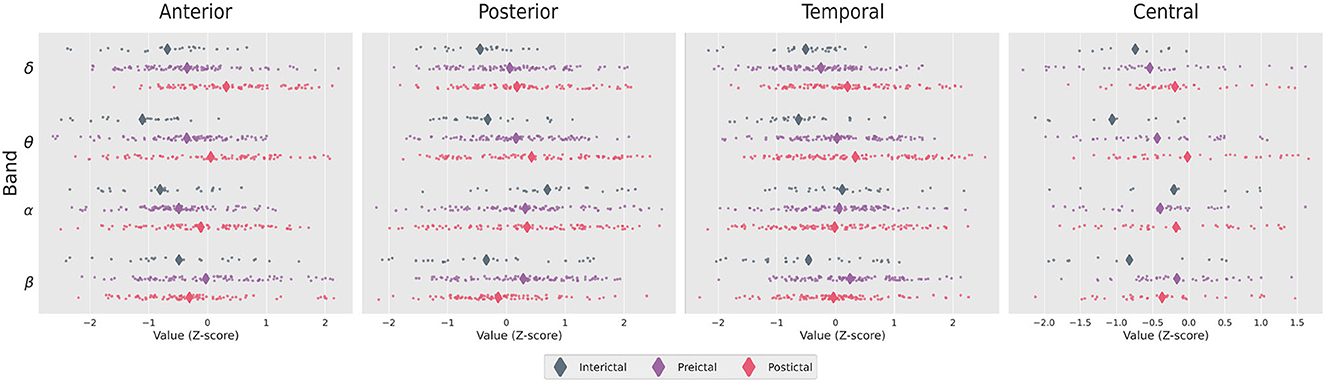
Figure 4. Distribution of Z-score values for the ictal energies in the brain regions studied. Diamonds show the mean of the distribution.
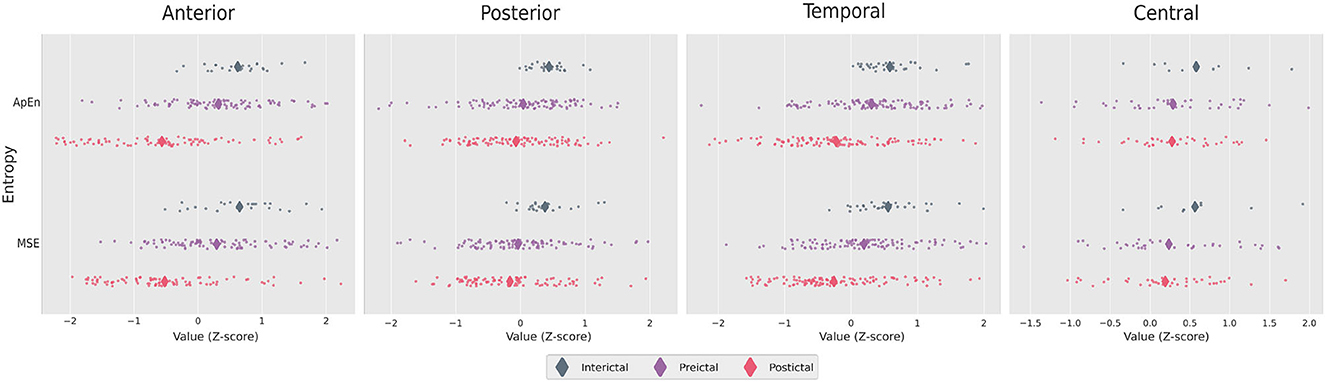
Figure 5. Distribution of Z-score values for the ictal entropies in the brain regions studied. Diamonds show the means of the distributions.
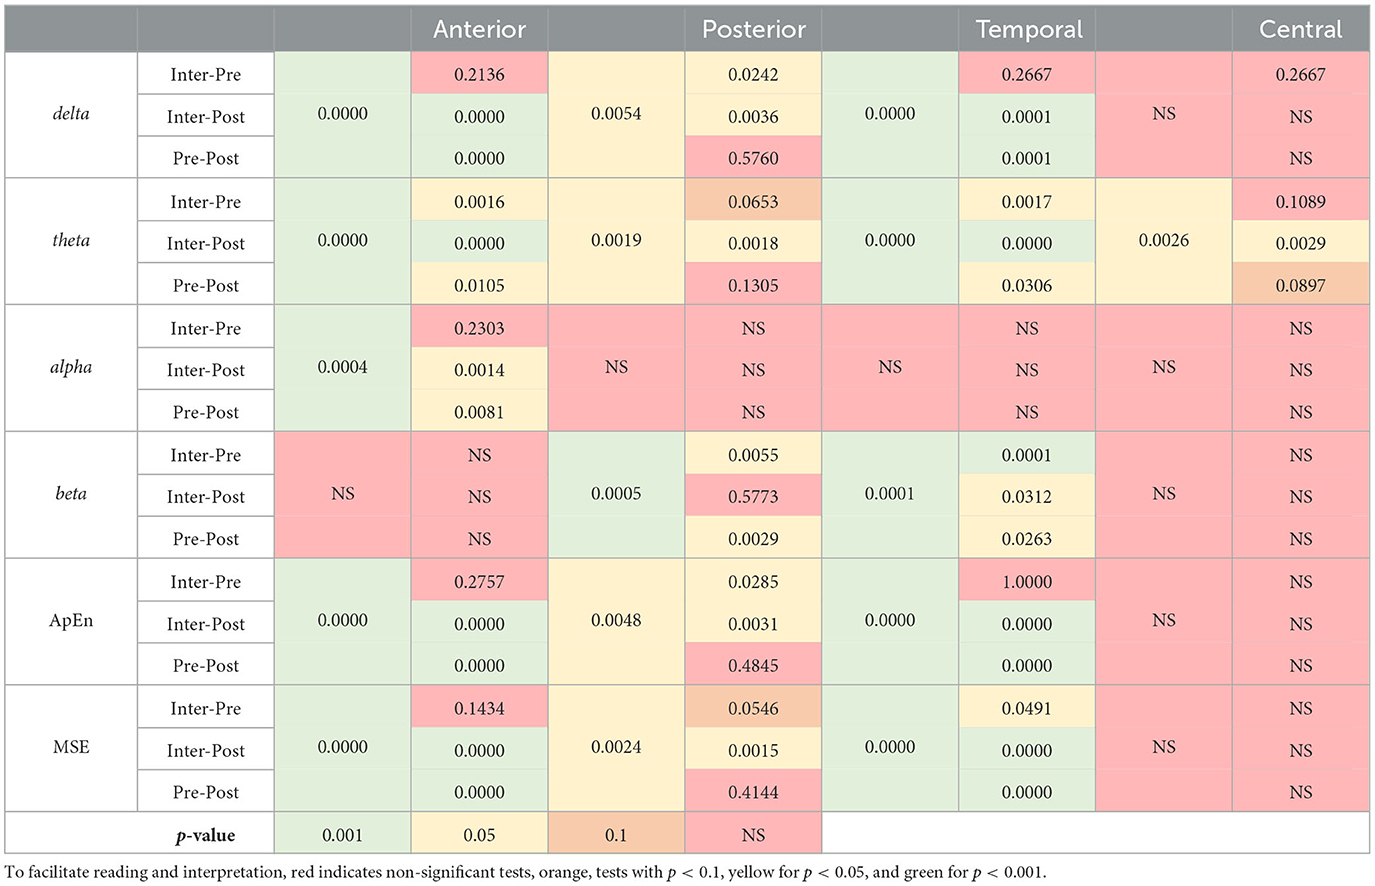
Table 1. P-values obtained in the one-way ANOVA tests and their post-hoc analyzes for each feature between brain regions.
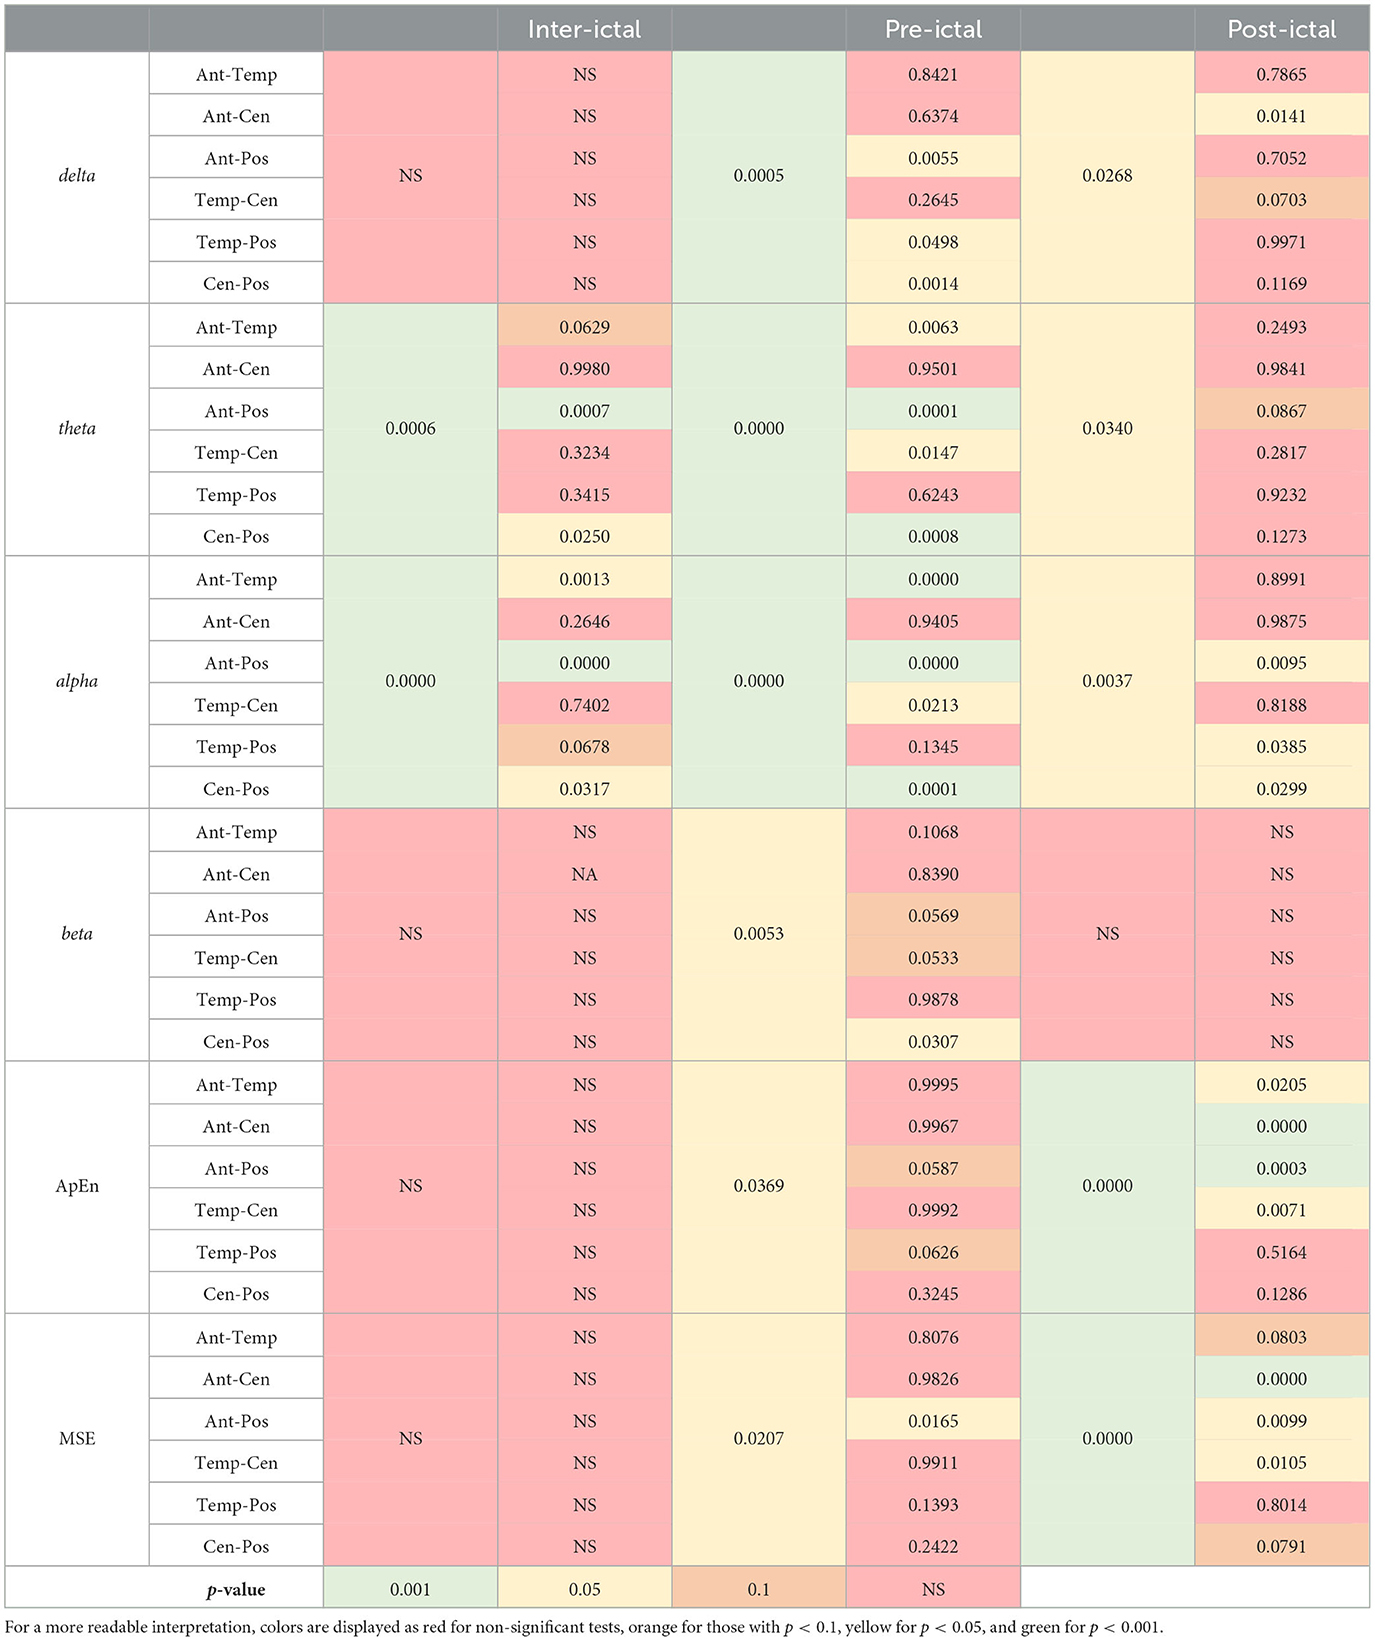
Table 2. P-values obtained in the one-way ANOVA tests and their post-hoc analysis for each feature between brain regions.
3.1. Regions
For the anterior region, we found significant differences in delta, theta, alpha, ApEn, and MSE (p < 0.001 in all cases). Post-hoc analysis revealed that post-ictal delta power was higher than interictal (p < 0.001) and pre-ictal power (p < 0.001), whereas the data for the interictal and pre-ictal periods generated non-significant (NS) differences. Regarding theta power, there was a significant difference among the three intervals, with post-ictal showing higher power than pre-ictal and interictal (p < 0.05, p < 0.001, and p < 0.05, respectively). For the alpha band, pairwise comparisons showed higher power for the post-ictal compared to the pre-ictal (p < 0.05) and interictal (p < 0.05). Regarding entropy, both ApEn and MSE were lower for the post-ictal interval compared to the pre-ictal and interictal intervals (p < 0.001 in all cases).
In the posterior region, we observed significant differences in delta, theta, ApEn and MSE (p < 0.05 in all cases) as well as for the beta (p < 0.001). Pairwise comparisons showed that interictal delta power was lower than pre-ictal (p < 0.05) and post-ictal (p < 0.05), whereas pre-ictal and post-ictal intervals showed non-different powers (NS). Regarding theta, only the post-ictal interval showed higher power compared to the interictal one (p < 0.05). For the beta band, individual comparisons showed lower power for the pre-ictal interval compared to the post-ictal interval (p < 0.05), but higher power when compared to the interictal period (p < 0.05). Regarding entropy, both ApEn and MSE showed non-significant differences when comparing the pre-ictal and post-ictal intervals (NS).
The temporal region showed a similar pattern to the posterior one, with significant differences in delta, theta, beta, ApEn, and MSE (p < 0.001 in all cases). Post-hoc analysis revealed that post-ictal delta power was higher than pre-ictal and interictal (p < 0.001 in both cases), while the pre-ictal and interictal intervals showed non-different powers (NS). Regarding theta, there was a significant difference among the three intervals, with the post-ictal interval showing higher power than the pre-ictal and interictal periods (p < 0.05, p < 0.001, and p < 0.05, respectively).
For the beta band, individual comparisons showed lower power for the pre-ictal interval compared to the post-ictal interval (p < 0.05), but higher powet when compared to the interictal period (p < 0.001). Regarding entropy, only ApEn showed non-significant difference when comparing the interictal and pre-ictal intervals (NS).
The central region only showed a significant difference between the interictal and post-ictal intervals in theta with a higher power in the latter (p < 0.05).
3.2. Intervals
For the interictal interval, significant differences were observed only for theta and alpha (p < 0.001 in both cases). Post-hoc analysis showed that theta power was higher in the posterior region that to the anterior and central regions (p < 0.001 and p < 0.05, respectively). For the alpha band, individual comparisons also showed higher power in the posterior region compared to anterior and central regions (p < 0.001 and p < 0.05, respectively). The temporal region also showed a higher power compared to the anterior one in the alpha band (p < 0.05).
Regarding the pre-ictal interval, there were differences in delta, theta, alpha (p < 0.001 in all cases), and beta, ApEn and MSE (p < 0.05 in these cases). Pairwise comparisons showed that delta power was higher in the posterior region compared to the anterior (p < 0.05), temporal (p < 0.05), and central (p < 0.05) regions. Regarding theta, there was also a higher power in the posterior region compared to the anterior (p < 0.001) and central (p < 0.001)regions, but not to the temporal (NS) region. In addition, a higher theta power was observed in the temporal region compared to the anterior (p < 0.05) and central (p < 0.05) regions.
For the alpha band, individual comparisons also showed higher power in the posterior region compared to the anterior (p < 0.001) and central (p < 0.001), but not to the temporal (NS) region. A higher alpha power was also observed in the temporal region compared to the anterior (p < 0.001) and central (p < 0.05) regions. Beta power only differed statistically between the posterior and central regions (p < 0.05), with a higher power in the former. Regarding entropy, only MSE showed a significant difference between the posterior and anterior regions (p < 0.05), with higher entropy in the latter.
With respect to the post-ictal interval, there were differences in delta (p < 0.05), theta (p < 0.05), alpha (p < 0.05), ApEn, and MSE (p < 0.001 in both cases). Individual comparisons showed only a higher delta power in the anterior compared to the central region (p < 0.05). For the alpha band, higher power was observed in the posterior region compared to the anterior (p < 0.05), temporal (p < 0.05), and central (p < 0.05) regions. Regarding entropy, these comparisons showed significantly higher ApEn and MSE in the anterior region compared to the temporal (ApEn, p < 0.05), central (ApEn and MSE, p < 0.001), and posterior (ApEn, p < 0.001; MSE, p < 0.05) regions. Finally, higher ApEn and MSE values were determined in the temporal region compared to the central region (p < 0.05).
4. Discussion
Differentiating between ictal and interictal EEG patterns in patients with typical absence seizures has long been a focal point for both clinicians and researchers. Recently, interest has grown in utilizing novel qEEG analysis techniques to further explore these phenomena (Antwi et al., 2019; Li et al., 2022; Springer et al., 2022; Zhong et al., 2022). The primary objective of our study was to investigate whether distinguishable differences exist in the spectral and entropy characteristics of EEGs in the pre-ictal and post-ictal periods compared to the interictal interval in a group of patients with typical absence seizures. By exploring these spectral distinctions. We sought to ascertain whether they can potentially serve as valuable clinical indicators that will aid in differentiating between the ictal and interictal nature of observed epileptiform patterns.
Regarding the slow bands (delta and theta), we found a significant difference between the interictal and peri-ictal (pre-ictal and post-ictal) intervals across distinct brain regions. This finding partially concurs with previous reports, as some authors have demonstrated an increase in the power of lower bands during the transition from the pre-ictal to ictal, and ictal to post-ictal, states in patients with childhood absence epilepsy (CAE) (Kumar et al., 2021). However, others have reported findings that lead to the opposite conclusion. For example, Li et al. (2022), found a decrease in delta oscillations from the interictal to the pre-ictal state in a group of 21 patients with CAE. They proposed that this result could be explained by decreased cortical activity associated with slow oscillation in the brain. We, however, find this explanation difficult to support in light of the corpus of earlier observations.
In clinical practice, visual inspection of background EEG activity in children and adolescents occasionally shows slowing. For example, occipital intermittent rhythmic delta activity (OIRDA) is an interictal pattern commonly seen in CAE patients (Hirsch et al., 2022), some of whom may show a continuous transition from OIRDA to an ictal epileptiform pattern (Aird and Gastaut, 1959; Guilhoto et al., 2006). These authors also suggested that an OIRDA pattern should be interpreted as epileptiform in nature (Guilhoto et al., 2006).
An increase in delta and theta activity prior to the ictal epileptiform pattern has also been verified in animal models. For example, van Luijtelaar et al. (2011) showed that the simultaneous presence of delta and theta events in EEGs is a condition for the occurrence of generalized spike-and-wave discharges in WAG/Rij rats. Studies using blood oxygen level dependent functional magnetic resonance imaging (BOLD-fMRI), meanwhile, have evidenced signal increases in various brain regions more than 5s before the onset of electrographic seizures (Bai et al., 2010). It seems, therefore, that a global increase in delta and theta band power immediately before an ictal epileptiform pattern may be a potential biomarker for differentiation compared to an interictal epileptiform pattern, though this possibility needs to be explored in greater depth.
Our study also showed a significantly different pattern of spectral changes between regions. Although we found an increase in the power of the slow bands across all regions, the most pronounced effect was detected in the posterior area. This finding is not in line with previous work, since some authors have reported a predominant change in the frontal region immediately before the seizure, based on both EEG (Li et al., 2022) and BOLD-fMRI analyzes (Bai et al., 2010).
Several theories on the brain onset of absence seizures have been proposed. Most suggest a complex interplay between cortical (i.e., frontal, parietal) and subcortical (i.e., thalamus) structures (Meeren et al., 2005). Because of the well-known spatial resolution limitation of EEG recordings and our low-density electrode array, we decided not to explore this issue in detail. However, our findings suggest that a quantitative spectral metric with greater posterior focus could be more suitable for differentiating ictal vs. interictal epileptiform patterns in cases of epilepsy with typical absence seizures.
Regarding entropy, our study revealed a significant decrease from the interictal to the pre-ictal and post-ictal intervals, a decrease that had an anterior predominance compared to the other regions. Entropy is a non-linear measure of the uncertainty and has been shown to represent the level of chaos that occurs in the brain (Costa et al., 2002). It can be deduced, then, that a system with higher entropy is more irregular or chaotic. Translating this into brain physiology, there is increasing evidence that various pathological processes are associated with atypical and often, but not always, reduced measures of brain physiological complexity or entropy (Escudero et al., 2006; Bosl et al., 2011). Thus, our findings suggest that EEG-based entropy in anterior regions may be a potential biomarker for differentiating ictal vs. interictal epileptiform patterns in cases of epilepsy marked by typical absence seizures.
5. Conclusion
In conclusion, this study focused on investigating distinguishable differences in the spectral characteristics of EEGs during the pre-ictal and post-ictal periods compared to the interictal interval in patients with typical absence seizures. Through the exploration of these spectral distinctions, we sought to identify potential indicators that may aid in differentiating between ictal and interictal epileptiform patterns. As stated above, our findings indicate a significant increase in the power of the slow bands (delta and theta) during the pre-ictal and post-ictal intervals across several brain regions, especially in the posterior area. This suggests that a global increase in delta and theta band power immediately before an ictal epileptiform pattern could serve as a potential biomarker for differentiation.
Our study further revealed a significant decrease in entropy from the interictal to the pre-ictal and post-ictal intervals, with a more pronounced effect in the anterior regions. This decrease suggests a reduction in brain complexity during these intervals, and supports the potential use of EEG-based entropy in anterior regions as a biomarker for differentiating epileptiform patterns.
Despite its numerous valuable insights, however, our work has some limitations that must be considered before confidently generalizing its findings. First, we recognize that the sample size was relatively small, though our research marks a crucial initial step in quantitatively addressing this issue in clinical practice. As we continue forward, expanding the sample size will undoubtedly strengthen the robustness of our conclusions. Second, the absence of a control group (a set of interictal epileptiform patterns) might initially limit the clinical application of our findings. Nonetheless, we are committed to performing a second-step validation study to validate and refine our results, to ensure their reliability and usefulness for the wider medical community. Third, while we explored specific quantitative metrics in this study, we are aware of the potential of other, more complex quantitative measures, for clinical practice, as other researchers have demonstrated (Kramer and Kromm, 2019; Munjal et al., 2022). We envision incorporating these advanced techniques into our future research endeavors to expand the depth and breadth of our findings.
Despite these limitations, our findings support the assertion that quantitative analysis of pre-ictal and post-ictal intervals can be potential EEG biomarkers to identify the ictal nature of the epileptiform discharge and potentially differentiating it from the interictal one in patients with confirmed or suspected typical absence seizures. Future research, with larger sample sizes and more complex quantitative methods, is warranted to validate and expand these findings.
Data availability statement
The data that support the findings of this study are available from the corresponding authors, RR-V and HV-P, upon reasonable request.
Ethics statement
The study protocol was approved by the Ethics Committee of the Country 2000 Hospital. The studies were conducted in accordance with the local legislation and institutional requirements. The participants provided their written informed consent to participate in this study. Written informed consent was obtained from the individual(s) for the publication of any potentially identifiable images or data included in this article.
Author contributions
AG-A: Writing—original draft, Conceptualization, Data curation, Funding acquisition, Investigation, Methodology, Project administration, Resources, Supervision, Validation, Writing—review and editing. ER-P: Investigation, Writing—original draft, Writing—review and editing, Formal analysis, Software, Visualization. OR-Q: Investigation, Writing—original draft, Writing—review and editing, Formal analysis, Software, Visualization. OP: Formal analysis, Investigation, Methodology, Software, Validation, Visualization, Writing—original draft, Writing—review and editing. EG-Q: Software, Visualization, Writing—original draft. AG-E: Data curation, Validation, Resources, Writing—original draft. RR-V: Conceptualization, Funding acquisition, Investigation, Methodology, Project administration, Resources, Supervision, Validation, Writing—original draft, Writing—review and editing. HV-P: Conceptualization, Funding acquisition, Investigation, Methodology, Project administration, Resources, Supervision, Validation, Writing—original draft, Writing—review and editing.
Funding
The author(s) declare financial support was received for the research, authorship, and/or publication of this article. We thank the National Humanities, Science and Technology Council (CONACHyT) for the support received through scholarships CVU-1263518 and CVU-1267961.
Conflict of interest
The authors declare that the research was conducted in the absence of any commercial or financial relationships that could be construed as a potential conflict of interest.
Publisher's note
All claims expressed in this article are solely those of the authors and do not necessarily represent those of their affiliated organizations, or those of the publisher, the editors and the reviewers. Any product that may be evaluated in this article, or claim that may be made by its manufacturer, is not guaranteed or endorsed by the publisher.
References
Acharya, U. R., Molinari, F., Sree, S. V., Chattopadhyay, S., Ng, K.-H., and Suri, J. S. (2012). Automated diagnosis of epileptic EEG using entropies. Biomed. Signal Proc. Control 7, 401–408. doi: 10.1016/j.bspc.2011.07.007
Aird, R. B., and Gastaut, Y. (1959). Occipital and posterior electroencephalographic rythms. Electroencephalogr. Clin. Neurophysiol. 11, 637–656. doi: 10.1016/0013-4694(59)90104-X
Antwi, P., Atac, E., Ryu, J. H., Arencibia, C. A., Tomatsu, S., Saleem, N., et al. (2019). Driving status of patients with generalized spike-wave on eeg but no clinical seizures. Epilepsy Behav. 92, 5–13. doi: 10.1016/j.yebeh.2018.11.031
Bai, X., Vestal, M., Berman, R., Negishi, M., Spann, M., Vega, C., et al. (2010). Dynamic time course of typical childhood absence seizures: Eeg, behavior, and functional magnetic resonance imaging. J. Neurosci. 30, 5884–5893. doi: 10.1523/JNEUROSCI.5101-09.2010
Bancaud, J., Henriksen, O., Rubio-Donnadieu, F., Seino, M., Dreifuss, F. E., and Penry, J. K. (1981). Proposal for revised clinical and electroencephalographic classification of epileptic seizures. Epilepsia 22, 489–501. doi: 10.1111/j.1528-1157.1981.tb06159.x
Blumenfeld, H. (2005). “Consciousness and epilepsy: why are patients with absence seizures absent?,” in The Boundaries of Consciousness: Neurobiology and Neuropathology, ed. S. Laureys (Amsterdam: Elsevier), 271–603. doi: 10.1016/S0079-6123(05)50020-7
Bosl, W., Tierney, A., Tager-Flusberg, H., and Nelson, C. (2011). Eeg complexity as a biomarker for autism spectrum disorder risk. BMC Med. 9, 1–16. doi: 10.1186/1741-7015-9-18
Carney, P., Masterton, R., Harvey, A., Scheffer, I., Berkovic, S., and Jackson, G. (2010). The core network in absence epilepsy. Differences in cortical and thalamic bold response. Neurology 75, 904–911. doi: 10.1212/WNL.0b013e3181f11c06
Clemens, B., Emri, M., Aranyi, S. C., Fekete, I., and Fekete, K. (2021). Resting-state eeg theta activity reflects degree of genetic determination of the major epilepsy syndromes. Clin. Neurophysiol. 132, 2232–2239. doi: 10.1016/j.clinph.2021.06.012
Costa, M., Goldberger, A. L., and Peng, C.-K. (2002). Multiscale entropy analysis of complex physiologic time series. Phys. Rev. Lett.89, 068102. doi: 10.1103/PhysRevLett.89.068102
Costa, M., Goldberger, A. L., and Peng, C.-K. (2005). Multiscale entropy analysis of biological signals. Phys. Rev. E. 71, 10127–10134. doi: 10.1103/PhysRevE.71.021906
Escudero, J., Abásolo, D., Hornero, R., Espino, P., and Lpez, M. (2006). Analysis of electroencephalograms in alzheimer's disease patients with multiscale entropy. Physiol. Measur. 27, 1091–1106. doi: 10.1088/0967-3334/27/11/004
Fisher, R. S., Cross, J. H., French, J. A., Higurashi, N., Hirsch, E., Jansen, F. E., et al. (2017). Operational classification of seizure types by the international league against epilepsy: Position paper of the ilae commission for classification and terminology. Epilepsia 58, 522–530. doi: 10.1111/epi.13670
Guilhoto, L. M., Manreza, M. L. G., and Yacubian, E. M. (2006). Occipital intermittent rythmic delta activity in absence epilepsy. Arquivos Neuro-Psiquiatr. 64, 193–197. doi: 10.1590/S0004-282X2006000200004
Hirsch, E., French, J., Scheffer, I. E., Bogacz, A., Alsaadi, T., Sperling, M. R., et al. (2022). Ilae definition of the idiopathic generalized epilepsy syndromes: Position statement by the ilae task force on nosology and definitions. Epilepsia 63, 1475–1499. doi: 10.1111/epi.17236
Hirsch, E., and Panayiotopoulos, C. P. (2005). “Childhood absence epilepsy and related syndromes,” in Epileptic Syndromes in Infancy, Childhood and Adolescence, ed. J. Roger (Montrouge: John Libbey Eurotext), 315–335.
Irelli, E. C., Leodori, G., Morano, A., and Bonaventura, C. D. (2022). Eeg markers of treatment resistance in idiopathic generalized epilepsy: From standard eeg findings to advanced signal analysis. Biomedicines 10, 2428. doi: 10.3390/biomedicines10102428
Koberda, J. L. (2021). Qeeg as a useful tool for the evaluation of early cognitive changes in dementia and traumatic brain injury. Clin. EEG and Neurosci. 52, 119–125. doi: 10.1177/1550059420914816
Koutroumanidis, M., Arzimanoglou, A., Caraballo, R., Goyal, S., Kaminska, A., Laoprasert, P., et al. (2017). The role of eeg in the diagnosis and classification of the epilepsy syndromes: a tool for clinical practice by the ilae neurophysiology task force (part 1). Epileptic Disord. 19, 233–298. doi: 10.1684/epd.2017.0935
Kramer, A. H., and Kromm, J. (2019). Quantitative continuous eeg: Bridging the gap between the icu bedside and the eeg interpreter. Neurocr. Care 30, 499–504. doi: 10.1007/s12028-019-00694-8
Kumar, A., Lyzhko, E., Hamid, L., Srivastav, A., Stephani, U., and Japaridze, N. (2021). Differentiating ictal/subclinical spikes and waves in childhood absence epilepsy by spectral and network analyses: A pilot study. Clin. Neurophysiol. 132, 2222–2231. doi: 10.1016/j.clinph.2021.06.011
Li, Z., Huang, J., Wei, W., Jiang, S., Liu, H., Luo, H., et al. (2022). Eeg oscillatory networks in peri-ictal period of absence epilepsy. Front. Neurol. 13, 825225. doi: 10.3389/fneur.2022.825225
Meeren, H., van Luijtelaar, G., da Silva, F. L., and Coenen, A. (2005). Evolving concepts on the pathophysiology of absence seizures: The cortical focus theory. Arch. Neurol. 62, 371–376. doi: 10.1001/archneur.62.3.371
Munjal, N. K., Bergman, I., Scheuer, M. L., Genovese, C. R., Simon, D. W., and Patterson, C. M. (2022). Quantitative electroencephalography (eeg) predicting acute neurologic deterioration in the pediatric intensive care unit: A case series. J. Child Neurol. 37, 73–79. doi: 10.1177/08830738211053908
Panayiotopoulos, C. P., Obeid, T., and Waheed, G. (1989). Differentiation of typical absence seizures in epileptic syndromes. a video eeg study of 224 seizures in 20 patients. Brain 112, 1039–1056. doi: 10.1093/brain/112.4.1039
Pincus, S. M. (1991). Approximate entropy as a measure of system complexity. Proc. Nat. Acad. Sci. 88, 2297–2301. doi: 10.1073/pnas.88.6.2297
Pincus, S. M., and Keefe, D. L. (1992). Quantification of hormone pulsatility via an approximate entropy algorithm. Am. J. Physiol. 262, E741–E754. doi: 10.1152/ajpendo.1992.262.5.E741
Richman, J., and Moorman, J. (2000). Physiological time-series analysis using approximate entropy and sample entropy. Am. J. Physiol. Heart Circ. Physiol. 278, H2039–H2049. doi: 10.1152/ajpheart.2000.278.6.H2039
Sadleir, L. G., Farrell, K., Smith, S., Connolly, M. B., and Scheffer, I. E. (2006). Electroclinical features of absence seizures in childhood absence epilepsy. Neurology 67, 413–418. doi: 10.1212/01.wnl.0000228257.60184.82
Sadleir, L. G., Scheffer, I. E., Smith, S., Connolly, M. B., and Farrell, K. (2009). Automatisms in absence seizures in children with idiopathic generalized epilepsy. Arch. Neurol. 66, 729–734. doi: 10.1001/archneurol.2009.108
Sakkalis, V., Giannakakis, G., Farmaki, C., Mousas, A., Pediaditis, M., Vorgia, P., et al. (2013). “Absence seizure epilepsy detection using linear and nonlinear eeg analysis methods,” in 2013 35th Annual International Conference of the IEEE Engineering in Medicine and Biology Society (EMBC) (IEEE), 6333–6336. doi: 10.1109/EMBC.2013.6611002
Springer, M., Khalaf, A., Vincent, P., Ryu, J. H., Abukhadra, Y., Beniczky, S., et al. (2022). A machine-learning approach for predicting impaired consciousness in absence epilepsy. Ann. Clin. Translat. Neurol. 9, 1538–1550. doi: 10.1002/acn3.51647
Tashkandi, M., Baarma, D., Tricco, A. C., Boelman, C., Alkhater, R., and Minassian, B. A. (2019). Eeg of asymptomatic first-degree relatives of patients with juvenile myoclonic, childhood absence and rolandic epilepsy: a systematic review and meta-analysis. Epileptic Disord. 21, 30–41. doi: 10.1684/epd.2019.1024
Tenney, J. R., Gloss, D., Arya, R., Kaplan, P. W., Lesser, R., Sexton, V., et al. (2021). Practice guideline: Use of quantitative eeg for the diagnosis of mild traumatic brain injury: Report of the guideline committee of the american clinical neurophysiology society. J. Clin. Neurophysiol. 38, 287–292. doi: 10.1097/WNP.0000000000000853
Trenité, D. G. K.-N., and Vermeiren, R. (2005). The impact of subclinical epileptiform discharges on complex tasks and cognition: relevance for aircrew and air traffic controllers. Epilepsy Behav. 6, 31–34. doi: 10.1016/j.yebeh.2004.10.005
van Luijtelaar, G., Hramov, A., Sitnikova, E., and Koronovskii, A. (2011). Spike–wave discharges in wag/rij rats are preceded by delta and theta precursor activity in cortex and thalamus. Clin. Neurophysiol. 122, 687–695. doi: 10.1016/j.clinph.2010.10.038
Keywords: EEG, entropy, epilepsy, ictal, interictal, spectral analysis, spike-and-wave, typical absence seizure
Citation: Guerrero-Aranda A, Ramírez-Ponce E, Ramos-Quezada O, Paredes O, Guzmán-Quezada E, Genel-Espinoza A, Romo-Vazquez R and Vélez-Pérez H (2023) Quantitative EEG analysis in typical absence seizures: unveiling spectral dynamics and entropy patterns. Front. Hum. Neurosci. 17:1274834. doi: 10.3389/fnhum.2023.1274834
Received: 08 August 2023; Accepted: 21 September 2023;
Published: 17 October 2023.
Edited by:
Luis Montesinos, Tecnologico de Monterrey, MexicoReviewed by:
Jeffrey Tenney, Cincinnati Children's Hospital Medical Center, United StatesAbeer Hani, Lebanese American University, Lebanon
Copyright © 2023 Guerrero-Aranda, Ramírez-Ponce, Ramos-Quezada, Paredes, Guzmán-Quezada, Genel-Espinoza, Romo-Vazquez and Vélez-Pérez. This is an open-access article distributed under the terms of the Creative Commons Attribution License (CC BY). The use, distribution or reproduction in other forums is permitted, provided the original author(s) and the copyright owner(s) are credited and that the original publication in this journal is cited, in accordance with accepted academic practice. No use, distribution or reproduction is permitted which does not comply with these terms.
*Correspondence: Hugo Vélez-Pérez, aHVnby52ZWxlekBhY2FkZW1pY29zLnVkZy5teA==; Rebeca Romo-Vazquez, cmViZWNhLnJvbW9AYWNhZGVtaWNvcy51ZGcubXg=