 Kristel C. Tjandra1†
 Nikhil Ram-Mohan1†
 Manuel Roshardt2†Elizabeth J. Zudock1Zhaonan Qu3
 Kathleen E. Mach4Okyaz Eminaga4Joseph C. Liao4,5
 Samuel Yang1*Pak Kin Wong2,6*
- 1Department of Emergency Medicine, Stanford University School of Medicine, Palo Alto, CA, United States
- 2Department of Biomedical Engineering, The Pennsylvania State University, University Park, PA, United States
- 3Department of Economics, Stanford University, Palo Alto, CA, United States
- 4Department of Urology, Stanford University School of Medicine, Palo Alto, CA, United States
- 5Veterans Affairs Palo Alto Health Care System, Palo Alto, CA, United States
- 6Department of Mechanical Engineering, The Pennsylvania State University, University Park, PA, United States
Introduction: Multidrug-resistant Enterobacteriaceae are among the most urgent global public health threats associated with various life-threatening infections. In the absence of a rapid method to identify antimicrobial susceptibility, empirical use of broad-spectrum antimicrobials such as carbapenem monotherapy has led to the spread of resistant organisms. Rapid determination of antimicrobial resistance is urgently needed to overcome this issue.
Methods: By capturing dynamic single-cell morphological features, including growth-independent, antibiotic-induced changes, of cells from 19 strains of Klebsiella pneumoniae, we evaluated data processing strategies based on time and concentration differentials to develop models for classifying its susceptibility to a commonly used carbapenem, meropenem, and predicting their minimum inhibitory concentrations (MIC).
Results and discussion: We report morphometric antimicrobial susceptibility testing (MorphoAST), a growth independent, computer vision-based machine learning workflow, for rapid determination of antimicrobial susceptibility by single-cell morphological analysis within sub-doubling time of K. pneumoniae. We demonstrated the technological feasibility of predicting MIC/antimicrobial susceptibility in a fraction of the bacterial doubling time (<50 min). The classifiers achieved as high as 97% accuracy in 20 min (two-fifths of the doubling time) and reached over 99% accuracy within 50 min (one doubling time) in predicting the antimicrobial response of the validation dataset. A regression model based on the concentration differential of individual cells from nineteen strains predicted the MIC with 100% categorical agreement and essential agreement for seven unseen strains, including two clinical samples from patients with urinary tract infections with different responsiveness to meropenem, within 50 min of treatment. The expansion of this innovation to other drug-bug combinations could have significant implications for the future development of rapid antimicrobial susceptibility testing.
Introduction
The emergence of multidrug-resistant pathogens is a worldwide calamity. Multidrug-resistant bacteria, such as the carbapenemase-producing Enterobacteriaceae, pose an increasing threat to public health due to their high mortality rate and rapid acquisition of resistance to available antimicrobials (Nordmann et al., 2011; Durante-Mangoni et al., 2019). Klebsiella pneumoniae, a member of the Klebsiella genus of Enterobacteriaceae, is an emerging multidrug-resistant opportunistic pathogen that causes a wide range of diseases, including pneumonia, meningitis, and liver abscess. As with the case for Enterobacteriaceae nosocomial infections, broad-spectrum carbapenems like meropenem, an intravenous beta-lactam antimicrobial, are often prescribed until the antimicrobial susceptibility test (AST) results are available to guide more targeted therapy. In the absence of a rapid method to determine antimicrobial susceptibility, empirical use of antimicrobials is warranted as urgent treatment is linked with improved outcomes. Inappropriate antimicrobial treatment results in almost twice the higher mortality rate in infected patients and accelerates the emergence and spread of superbugs (Jernigan et al., 2020). Therefore, rapid determination of antimicrobial susceptibility to guide treatment is crucial to save lives and curb the widespread of multidrug-resistant pathogens.
Phenotypic AST, such as broth microdilution and ETEST, evaluates the ability of an antimicrobial to inhibit bacteria growth and is the gold standard for determining antimicrobial susceptibility. The turbidity of liquid media or the formation of bacterial colonies provides a measure of bacteria growth with the presence of an antimicrobial and generates quantitative minimum inhibitory concentration (MIC; Jorgensen and Ferraro, 2009). Nevertheless, phenotypic AST, which relies on bacterial growth for 18 h or more, is incompatible with a rapid turnaround. This limitation of current AST propelled the development of novel approaches to improve both speed and accuracy (Vasala et al., 2020; Tjandra et al., 2022; Baltekin et al., 2017; Li et al., 2019; Choi et al., 2014). Single-cell imaging analysis is an emerging strategy that offers the possibility of reducing the turnaround time and improving the diagnostic resolution. By visualizing the replication of individual cells, the response of bacteria to antimicrobials can be in principle reduced to one or a few doubling times of the bacteria (Li et al., 2019; Choi et al., 2014; Lu et al., 2013; Zhang et al., 2020; Choi et al., 2013). However, rapid AST techniques that rely on the area occupied by the cells as a measure of the growth could mistake a transient increase in cell sizes due to antimicrobial tolerance as growth (Choi et al., 2014). Phenotypic variants, drug accumulation, and growth phase can also introduce uncertainties in rapid AST assays (Łapińska et al., 2022; Brauner et al., 2016). Therefore, existing approaches relying on cell replication often require at least 2 h, if not more, to deliver reliable results, especially for slow-growing and fastidious bacteria (Choi et al., 2014; Veses-Garcia et al., 2018; Matsumoto et al., 2016; Avesar et al., 2017; Kalashnikov et al., 2017). While there are ample examples of rapid AST, the search for a technique that can deliver AST results (1) rapidly in a point-of-care timeframe, (2) quantitatively with MIC determination, and (3) efficiently with a small inoculum size is still ongoing.
A promising strategy for rapidly determining bacteria response to antimicrobials is to monitor their morphological changes (Bourne, 2021). In addition to growth and replication, bacteria undergo a wide variety of morphological changes in response to the environment (Yang et al., 2016). These changes, such as filamentation, bulging, and lysis, indicate stress in bacteria and have been applied for investigating the mechanisms of action of antimicrobials (Baltekin et al., 2017; Bruus, 2012; Zahir et al., 2019; Nonejuie et al., 2013). For instance, distinct morphological transformations could be induced in Escherichia coli depending on the type of beta-lactam antimicrobials (Yao et al., 2012). Pseudomonas aeruginosa, which are known to be highly tolerant against beta-lactams, undergo a transition from rod-shaped to viable spherical cells when treated with meropenem (Monahan et al., 2014). The minute change in the bacterial morphology could be indicative of the bacterial response to antimicrobials before cell replication.
Many promising examples of bacterial analysis at the single-cell level have emerged (Rosłoń et al., 2022; Scherer et al., 2021; Kaushik et al., 2021). A successful example of the use of imaging modality for ID/AST is the FDA-cleared AcceleratePheno system by Accelerate Diagnostics. Their assays track changes in bacteria growth kinetic and cluster morphology to assess any anomalies in cell growth and division, which then translate into information about antibiotic responses (Shamsheyeva et al., 2013). The strength of this method is its robust inputs ranging from cell mass, division, fluorescence, and colony formation, achieving ID information in 2 h and antibiotic susceptibility in 7. Gathering such comprehensive data to achieve this result was possible with the use of high-end instrumentation and modeling. Others such as the Sysmex Astrego's AST offers susceptibility information (S/R) in < 30 min after the bacteria were grown for 2 h, but without an MIC (Baltekin et al., 2017). Meanwhile, the Gradientech QuickMIC system delivers susceptibility information with MIC after 3–4 h of live imaging (Malmberg et al., 2022). These commercial AST systems depend on cell growth and replication as the key marker of antibiotic response.
We sought to develop a truly growth and replication independent, morphometric approach for rapid AST and MIC before cell doubling. Herein, we devised a proof-of-concept computer vision-based machine learning workflow, termed morphometric antimicrobial susceptibility test (MorphoAST), and demonstrated with Klebsiella pneumoniae and meropenem that we can achieve both AST and MIC quantification in a fraction of the bacterial doubling time. The workflow combines single-cell imaging, computer vision feature extraction, and supervised machine learning models for predicting the response of bacteria to antimicrobials. We measured dynamic morphological features of individual K. pneumoniae in the presence of meropenem. We initially assessed time and concentration differential data processing strategies on a set of five K. pneumoniae strains and trained machine learning models to classify the antimicrobial response. We then expanded the concentration differential strategy on a more diverse set of 19 K. pneumoniae strains to develop a regression model to predict MIC. The models were cross-validated and tested against cells from seven unseen strains, including two samples from patients with urinary tract infections to provide an unbiased evaluation of the trained model. The results were reported according to the CLSI performance standards for antimicrobial susceptibility testing (M100) guideline.
Materials and methods
Bacteria culture
Klebsiella pneumoniae isolates (Supplementary Table 1) from the CDC & FDA Antimicrobial Resistance (AR) bank, Johns Hopkins University, and American Type Culture Collective (ATCC) were grown in Mueller Hinton Broth (MHB) at 37°C overnight. The next day, cells were sub-cultured in fresh MHB media for 3 h (growth phase) to a density equivalent to OD600 = 0.5. Bacteria cells (10 μL) were treated with 10 μL meropenem at varying final concentrations of 0 (control), 0.05, 0.5, 5, and 50 μg/mL to ascertain the physiological responses of cells. A subset of these isolates was treated with finer range of antimicrobial concentrations (0.02, 0.04, 0.016, 0.032, 0.064, 0.125, 0.5, 1, and 2 μg/mL) to train the algorithm for quantitative prediction of MIC. The MICs of the isolates were experimentally obtained and confirmed in triplicate using broth microdilution method according to CLSI guidelines.
Bacteria imaging
Bacteria cells and meropenem in liquid media are briefly vortexed before mounting on a 1% (v/v) UltraPure agarose pad (10 x 20 mm, Invitrogen US) in M9 minimal media (Gibco, US) on a micro slide covered with a glass coverslip (#1.5, 22 x 30 mm). Bacteria imaging was performed using a Nikon Ti2-E inverted microscope equipped with a DS-Qi2 CMOS camera and an Okolab stage-top temperature control chamber (37°C, 5% CO2). Images were acquired using a Nikon CFI Plan Apochromat l DM 100X oil objective lens and an external Phase Contrast (Ph3) module. Each isolate was observed over a period of 75 min (15–90 min after mixing with the antimicrobial). One field of view is collected for each time point.
Feature extraction
Time-series images were stacked and corrected for shifts in the time series using the Template Matching and Slice Alignment ImageJ plugin (Qingzong, 2022). Each stack was then analyzed using the MicrobeJ plugin for ImageJ (Ducret et al., 2016). The plugin, designed for the detection and analysis of bacterial cells, uses computer vision algorithms to automatically identify a cell and determine a suite of morphological features, such as its area, length, circularity, and perimeter (Supplementary Table 2). The tracking data were summarized as a table and exported as a .csv file for further analysis.
Data analysis and machine learning
The morphological data were analyzed to predict the susceptibility and MIC of the bacterial strain before the average doubling time (~50 min). Two differential strategies based on the time-dependent or antimicrobial concentration-dependent changes of the bacteria were applied. The processed data were then applied for susceptibility classification and MIC prediction. A schematic of the workflow is shown in Figure 1.
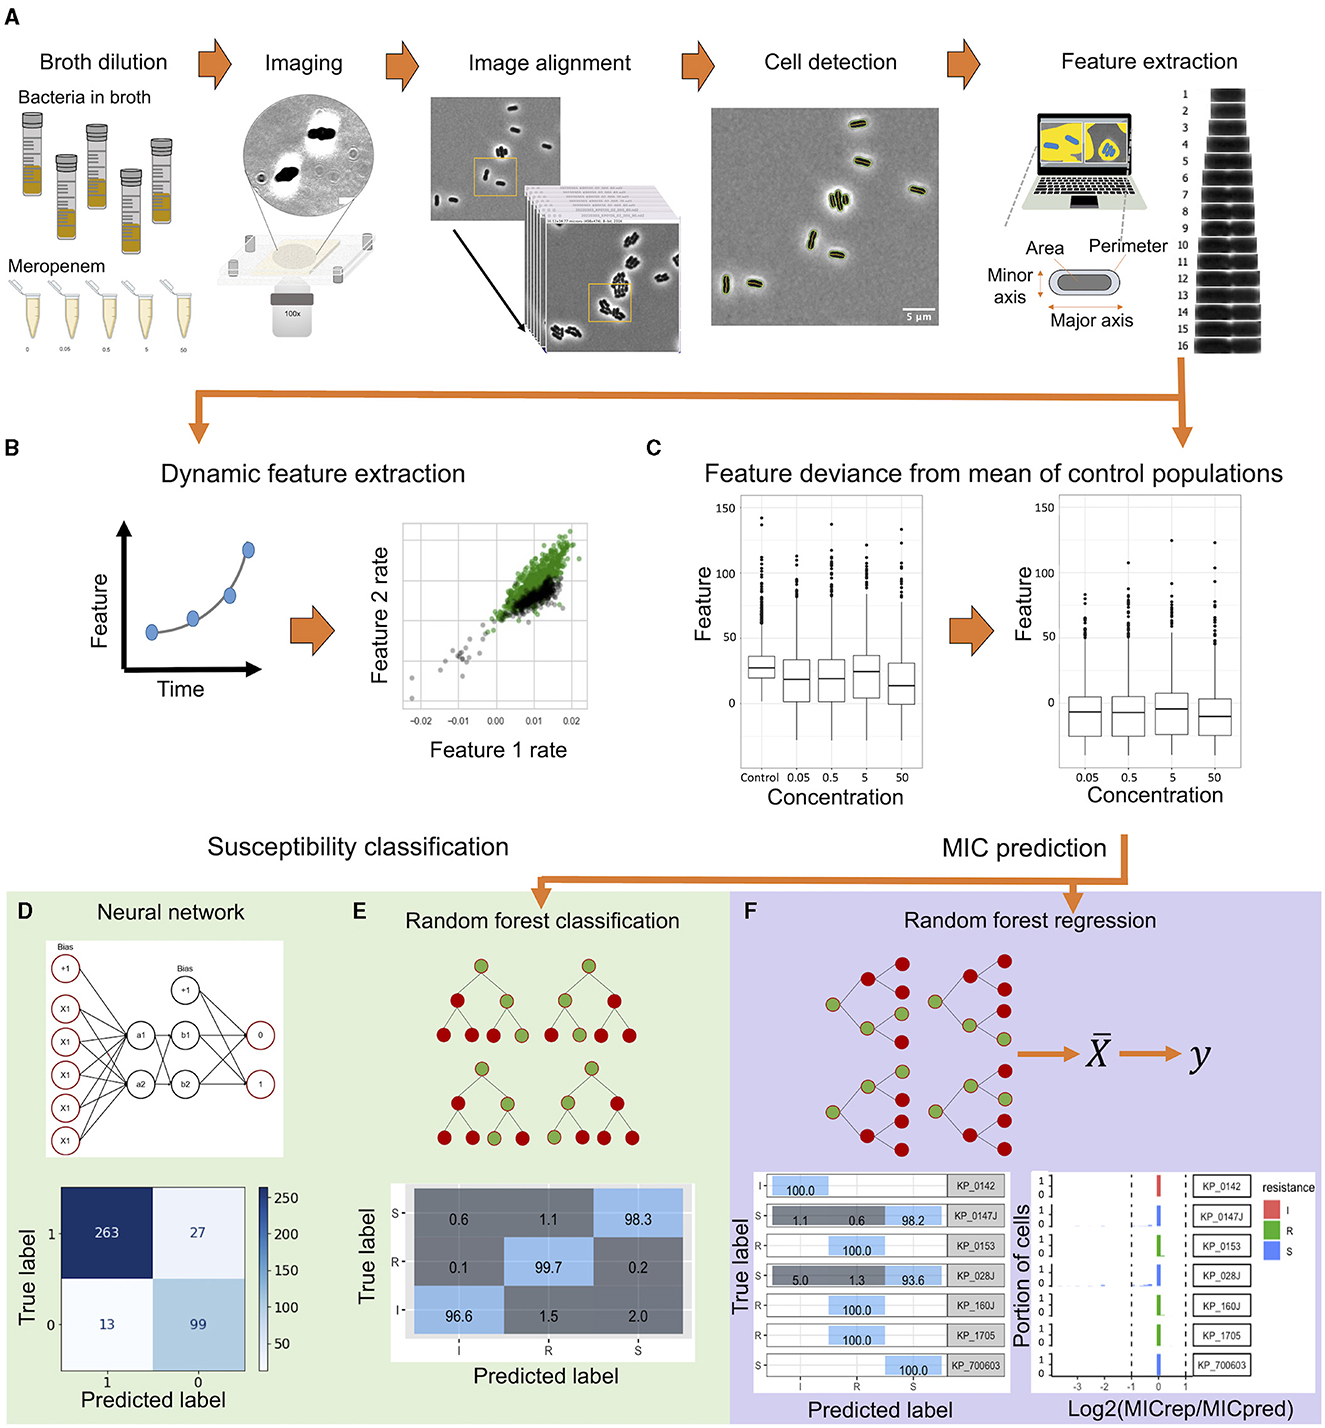
Figure 1. A schematic flowchart of the single-cell MorphoAST workflow for susceptibility classification and minimum inhibitory concentration (MIC) prediction. (A) The workflow starts with time-lapse imaging of individual bacteria under various antimicrobial concentrations. The morphological features of the bacteria are extracted automatically using MicrobeJ, an ImageJ plugin. (B) In the time differential approach, the feature changing rates are extracted by exponential curve fitting from the time-lapse data. (C) In the concentration differential approach, all features extracted from MicrobeJ are normalized against the feature mean of the control population. All datasets are visualized and separated into training and validation sets. (D, E) The feature-changing rate datasets are applied to train an artificial neural network to create a classification model. In parallel, the normalized dataset is trained using a random forest classifier with cross-validation. The trained models are then validated with the validation dataset for analyzing the prediction accuracy for susceptibility classification. (F) A Random Forest regression model is generated by the normalized data. The regressor model is validated through cross-validation and tested against unseen cells for evaluating categorical agreement and essential agreement of the assay.
In the time differential (or dynamic) approach, processed image stacks for Klebsiella pneumoniae isolates (KP_016, KP_0140, KP_1705, KP_0153, and KP_0142) at various antimicrobial concentrations were evaluated. The cells were labeled as division (resistant) or no division (susceptible). Data analyses were performed using Python with data analysis and machine learning libraries (Wes McKinney, 2017; Harris et al., 2020). To explore AST in a sub-doubling time, time-lapse data from the first 35 min (corresponding to 15–50 min after antimicrobial exposure) at a 5-min interval were analyzed. Erroneous data (e.g., missing bacteria) were detected and removed. Feature-changing rates of individual cells were determined by fitting the time-lapse data with the exponential function to accommodate non-linear behaviors. The area, aspect ratio, circularity, length, and perimeter were the most relevant dynamic features. The data were separated into training (75%) and validation (25%) sets. The changing rates of these features for each cell, along with the meropenem concentration, time of tracking, the bacterial strain, and the label for division/no division, were used to train the K-Nearest Neighbor and artificial neural network (MLPClassifier) models from the scikit-learn machine learning library (Pedregosa et al., 2011). For the K-Nearest Neighbor model, k was optimal at 20. The optimal structure of the artificial neural network was found at three hidden layers with five neurons each, even though a simple grid (two hidden layers with two neurons each) was sufficient for well-separated data (e.g., 50-min data). The accuracy of each model was obtained by averaging the values of 10 runs. The best model was assessed against the cells in the validation set.
In the concentration differential approach, the effect of each concentration of meropenem on individual cells of the same 5 strains as above was determined as a deviation from the population mean of untreated cells at the same time point for each of the 19 features, concentrations, and strains. Only cells detected within the first three time points and with no missing data were included in the analysis. If a cell died within the observation timeframe, the subsequent time points were marked with zero values for the features. The best modeling strategy for the classification of the normalized data was chosen among Random Forest, Naive Bayes, K-Nearest Neighbor, and Support Vector Machine based on the accuracy of models trained at the first time point (Supplementary Table 3). Random Forest classification models were trained against the reported susceptibility on normalized dataset for 80% of the cells for each time point with 5-fold cross-validation and 10 repetitions using the R package caret (Kuhn, 2008). The models with the highest accuracy were retained and tested against the 20% leave-out test set.
To develop the regression model for MIC prediction, processed image stacks for 24 K. pneumoniae strains (Supplementary Table 1) that spanned 10 resistant, 12 susceptible, and two intermediate against meropenem were used. We searched for an optimal training set of 19/24 strains (~80%; eight resistant, 10 susceptible, and one intermediate) that encompasses the diverse morphological changes and has the best model performance through 30 iterations of the possible combinations. The data were normalized as described above in the random forest. The best modeling strategy for the prediction of MIC was chosen among Linear Regression, Neural Net, Random Forest, K-Nearest Neighbor, Support Vector Machine, and Gaussian Process Regression based on the lowest root mean square error (RMSE) and highest coefficient of determination (R2) for models trained at the first time point (Supplementary Table 4). Training data with the optimal combination of strains were weighted to account for any class-level imbalance by dividing the number of cells in the intermediate category by the number of cells in the corresponding susceptible, resistant, and intermediate categories. Random Forest regression models were trained for each time point with 5-fold cross-validation and five repetitions using R packages ranger (Wright and Ziegler, 2017) and caret (Kuhn, 2008). Models were trained against the experimental MIC for these strains, and the model with the lowest RMSE, mean absolute error (MAE), and highest R2 was selected. The final models were tested against the five left-out unseen strains (two resistant, two susceptible, and one intermediate) and an additional two clinical isolates from patients with UTI. Mode MIC for the population of cells for each strain was attributed as the MIC for the strain. Categorical agreement (CA) and essential agreement (EA) for the cross-validated test as well as the validation datasets were determined. The major error (ME) and very major error (VME) rates were calculated for the model.
Clinical urine samples
Two de-identified, remaindered urine samples (10 mL) from patients infected with Klebsiella pneumoniae were collected from the Veterans Affairs Palo Alto Health Care System clinical microbiology laboratory. Klebsiella was identified by the clinical lab and confirmed by plating on ChromAgar Orientation (BD). The urine samples were stored in the −80°C freezer until used. Next, the urine samples were streaked on ChromoSelect selective agar (Millipore) and grown overnight to obtain isolated colonies. The MIC for these strains against meropenem was determined through micro-broth dilution in triplicate. The isolates were grown, treated with meropenem, and imaged as described above.
Results
The MorphoAST workflow for rapid Klebsiella pneumoniae AST
We developed a machine learning workflow for rapid AST determination for K. pneumoniae against meropenem in a sub-doubling time of the bacteria (Figure 1A). The MorphoAST workflow started with imaging of individual bacteria under various antimicrobial concentrations. Cells were grown to a log phase and treated with varying concentrations of meropenem. Cells without any antimicrobials were imaged in the same manner as controls for the experiment. Live bacteria were mounted on an agarose pad to minimize cell movement due to cell motility and Brownian motion. Time-lapse images were taken every 5 min. Images were aligned to match the location of individual cells at each frame and then subject to MicrobeJ analysis for extracting morphological features (Ducret et al., 2016). Visual observation of the bacterial cell division showed that untreated cells divide at between 40 and 50 min depending on the strain. A total of 21 automatically-extracted parameters (Supplementary Table 2) describing the cellular dimension and orientation were generated. The data have been analyzed either fitting with an exponential function to extract the feature changing rates (Figure 1B) or normalized against the untreated control to extract the feature differentials (Figure 1C). The data were applied to train and validate machine learning classifiers to predict the antimicrobial response (Figure 1D) and regressors to predict the MIC of the bacterial strain against the antimicrobial (Figure 1E).
Single-cell imaging and feature extraction
A total of 24 K. pneumoniae strains bearing various carbapenem resistance genes and sensitivity toward meropenem were monitored over time (Supplementary Table 1). Changes in bacterial morphology were observed over 90 min post-antimicrobial incubation. Only the first 50 min, which is approximately the doubling time of K. pneumoniae (Hafza et al., 2018), was analyzed. Each strain showed a unique morphological response to the varying antimicrobial concentration based on their MIC. Figures 2A, B show and example of K. pneumoniae (KP_0142) treated with and without meropenem. Bulging of the bacteria was only observed in the meropenem case. Supplementary Figure 1 compares three strains (KP_0016—Susceptible, KP_0142—Intermediate, and KP_0143—Resistant) at the early time points (see also Movies S1–3). Similarly, at 5 μg/mL meropenem, which is higher than the breakpoint MIC for meropenem, susceptible and intermediate strains (KP_0016 and KP_0142) showed noticeable “bulging” or protrusion around the center of the cell that was not observed in the resistant strain (KP_0143).
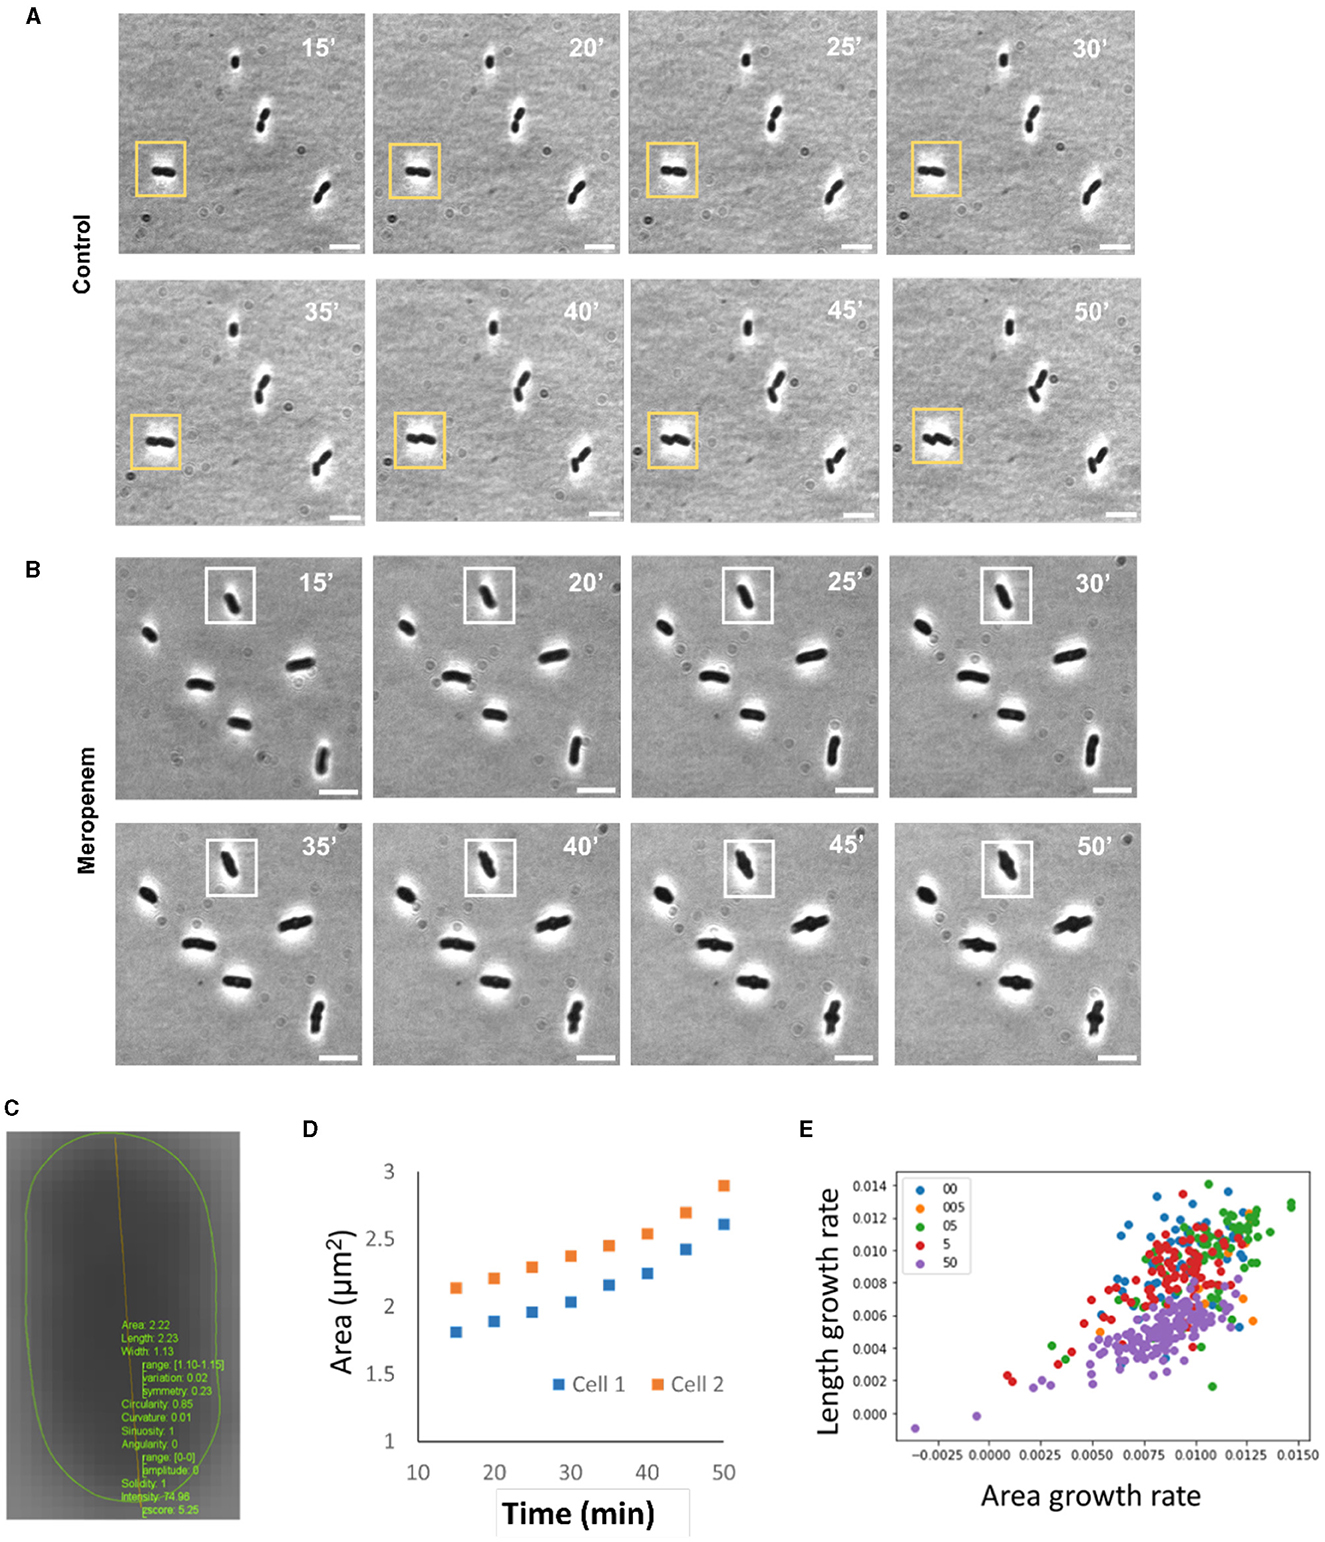
Figure 2. Representative results of single cell MorphoAST of K. pneumoniae treated with an intravenous β-lactam antibiotic, meropenem. (A) Time-lapse images of a K. pneumoniae strain (KP0142) without any antibiotic treatment. A yellow box denotes a cell that undergoes cell division. (B) Time-lapse images of the same KP strain treated with meropenem concentrations at 5 μg/ml. The minimum inhibitory concentration of KP0142 was clinically determined to be 2 μg/ml. Time-lapse cell imaging was performed at a 5-min interval 15 min after mixing with meropenem. The doubling time of the bacteria was ~50 min. A white box denotes a cell undergoing shape changes. The cells did not display any observable cell division within the duration of the experiment (90 min). (C) Morphological analysis with an ImageJ plugin for extracting the area, length, width, circularity, curvature, sinuosity, angularity, solidity, and intensity. (D) Examples of two growth curves for fitting the exponential area growth rate. (E) Distributions of area (μm2/m) and length (μm/m) growth rates of single bacteria extracted using procedures in (C, D). Cells in whole imaging frame is taken into account for the actual experiment to avoid bias. Scale bars: 5 μm.
To automate the analysis and avoid subjectivity, the MicrobeJ plugin was applied for recognizing bacteria and extracting morphological features (Figure 2C). The cell behaviors were summarized by extracting the changing rates of each feature from the data (Figure 2D and Supplementary Figure 2). Figure 2E shows an example of the distributions of length and area changing rates of a single strain (KP_0142) under various meropenem concentrations. The centroids of the changing rates varied with the antimicrobial concentration. However, there were large variations among individual bacteria at the same concentrations and substantial overlaps between different concentrations. It could be challenging to accurately predict the bacteria response based on one or two features. A statistical approach, specifically machine learning algorithms, is required to analyze the multiparametric data for improving classification accuracy. Subsequently, we next set forth to independently develop the time differential and concentration differential strategies of data processing and machine learning on a subset of bacterial strains prior to developing a final working model on the larger, complete set of bacterial strains.
Classification of bacterial response to antimicrobial with dynamic features
We first evaluated the dynamic (or time differential) approach for predicting the bacterial response to meropenem. The dynamic features of a total of 1,338 bacterial cells from 5 KP strains (KP_016, KP_0140, KP_1705, KP_0153, and KP_0142) from various antimicrobial concentrations were measured. The cells were labeled as 1 (resistant or division) or 0 (susceptible or no division) at the strain-concentration combination based on the CDC-reported meropenem MIC for K. pneumoniae. Since the behaviors of individual bacteria were highly diverse, one to seven bacteria under the same strain-concentration combinations were randomly grouped. The average feature changing rates were calculated for each group. As shown in the principal component analysis (PCA) plots (Figure 3A), grouping bacteria substantially reduced the variation within a group and increased the separation between the “resistant” and “susceptible” groups. The separation between the groups increased with the number of bacteria in the group. The grouped data were trained and validated using the training and validation datasets with the K-Nearest Neighbors and artificial neural network classifiers (Figures 3B and C) owing to its simplicity and parameter optimization, respectively. For the 35-min data (i.e., 15–50 min of exposure), groups of one bacterium resulted in an accuracy of 89 and 90% with the K-Nearest Neighbors and artificial neural network classifiers, respectively. The prediction accuracy was generally improved by increasing the number of bacteria (Figure 3D). With groups of seven bacteria, both classification algorithms reached over 99% accuracy. The improvement can be understood by a reduction of the statistical variation of individual cells by averaging data from multiple bacteria.
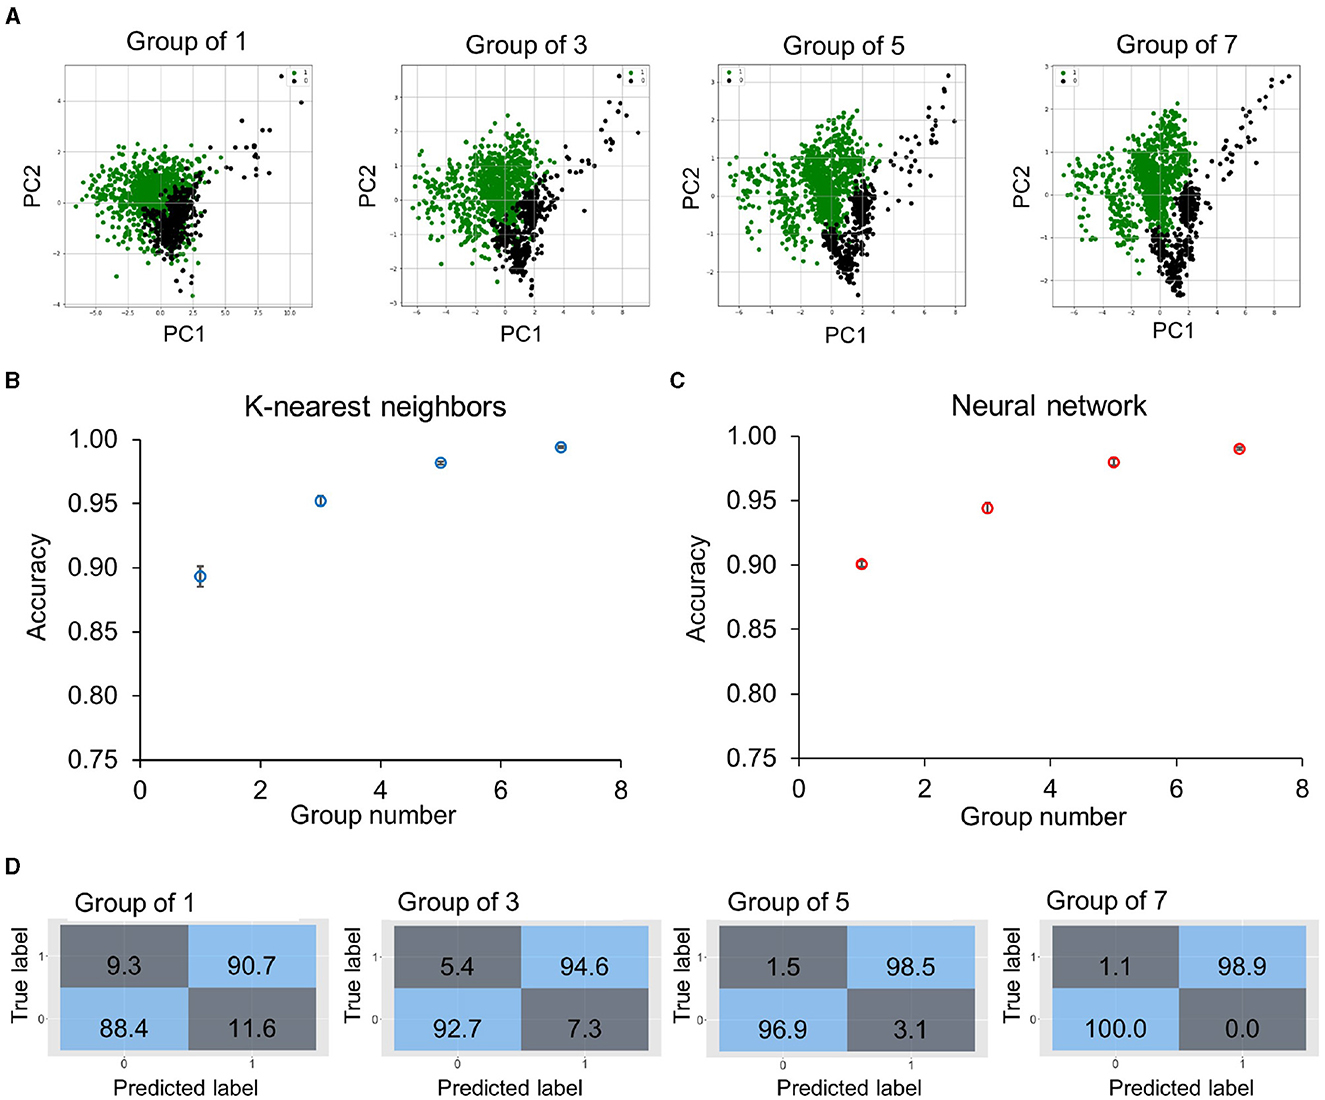
Figure 3. Classification accuracy of bacteria groups using the time differential approach. (A) Principal component analysis plots of dynamic features of 1,338 bacteria from five KP strains (KP_0142, KP_135, KP_120, KP_016, and KP_0010) and antimicrobial concentrations. The data are labeled as 1 (division or resistant, green points) or 0 (no division or susceptible, black points). Bacteria are randomly selected from the same strain-concentration combination to form a group, and the dynamic features are averaged for groups of 1, 3, 5, and 7 bacteria from the training dataset (75%). (B, C) Prediction accuracy was obtained by (B) K-Nearest Neighbors and (C) artificial neural network algorithms for different group sizes in the validation dataset (25%). For single bacteria, the accuracy was slightly higher for the artificial neural network (~90%). With groups of seven bacteria, both models obtained over 99% accuracy. The accuracy values are an average of 10 repetitions. (D) Evolution of confusion matrices of neural network classifiers with groups of 1–7 bacteria. Both the major error (true susceptible and predicted resistant) and the very major error (true resistant and predicted susceptible) were reduced with an increasing number of bacteria.
We then evaluated the accuracy of the classification model with sub-doubling times. The feature change rates were extracted using different durations of the data (5–35 min), corresponding to 15–50 min of antimicrobial incubation. Similarly, the data are summarized and visualized by the PCA plots (Figure 4A). The data with a 5-min duration (i.e., between 15 and 20 min after antimicrobial exposure) displayed a considerable variance and overlapped substantially. Nevertheless, the centroids of division and no division groups were distinct, and the separation improved with data of a longer duration. Clear separations between the groups could be observed in data with 25- or 35-min durations. Again, we trained machine learning classifiers, including the K-Nearest Neighbors and artificial neural network algorithms (Figures 4B, C) on averaged features from groups of seven cells to result in a class ratio of ~2:1 for susceptible (273) to resistant (128). These algorithms exhibited similar performances and had an accuracy of ~80% with the 5-min data. The results reached around 95% with the 25-min data and over 99% with the 35-min data. The confusion matrices indicated a false positive rate close to zero and a false negative rate of ~1.1% (Figure 4D) against the 25% validation dataset. These results support the use of dynamic morphological features, i.e., the time differential approach, for predicting the antimicrobial response in a sub-doubling time.
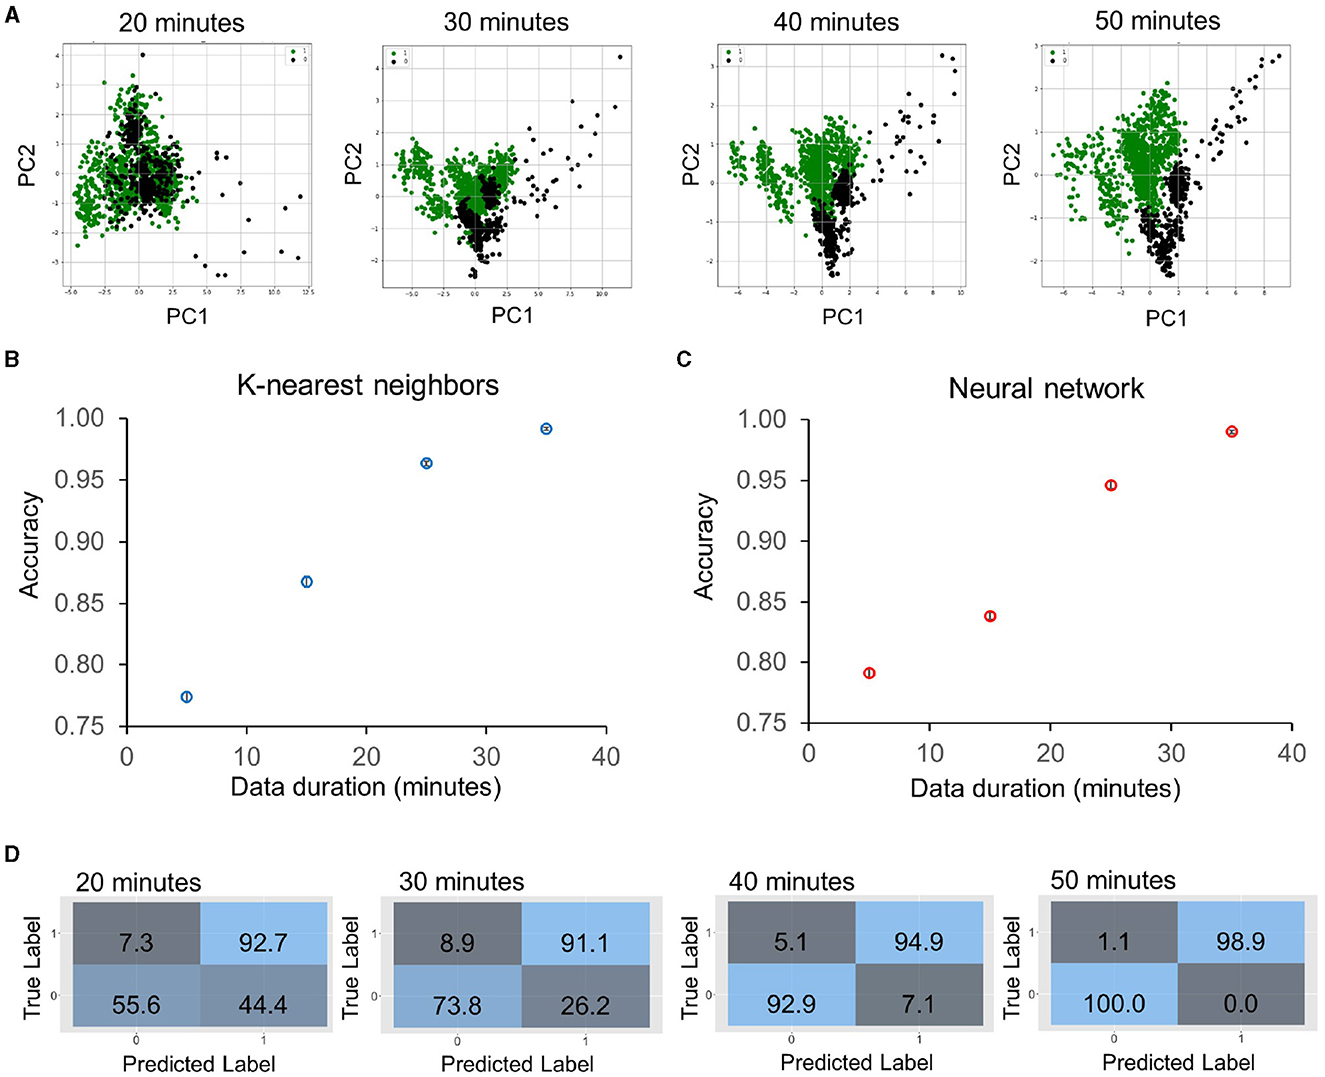
Figure 4. Classification accuracy of sub-doubling time susceptibility prediction using the time differential approach on five KP strains (KP_0142, KP_135, KP_120, KP_016, and KP_0010) treated with meropenem in log phase. (A) Principal component analysis plots of feature changing rates with 20–50 min of antimicrobial exposure, which correspond to 5–35 min duration of dynamic data. The data are labeled as 1 (division or resistant, green points) or 0 (no division or susceptible, black points) at the strain-concentration combination with groups of seven bacteria. (B, C) Prediction accuracy against validation dataset (25%) was obtained by (B) K-Nearest Neighbors and (C) artificial neural network algorithms trained on 75% of the dataset for different durations of data. The accuracy was ~80% for a 5-min duration, and the value improved to over 99% accuracy with a 35-min duration of data. The accuracy values are an average of 10 repetitions. (D) Evolution of confusion matrices of neural network classifiers with groups of 20–50 min of antimicrobial exposure. Both the major error (true susceptible and predicted resistant) and the very major error (true resistant and predicted susceptible) were reduced with the duration of the data.
Susceptibility classification with concentration differential features
We next evaluated the concentration differential approach for predicting antimicrobial susceptibility. A total of 5,050 bacterial cells from 5 KP strains (KP_016, KP_0140, KP_1705, KP_0153, and KP_0142) with various antimicrobial concentrations were included in the prediction of resistance and susceptibility to antimicrobial exposure. The deviations of morphological features from the population means of untreated cells were calculated at each time point. Since the bacterial features against various antimicrobial concentrations were measured, the differential data were applied to classify the interpretive categories (i.e., Susceptible “S,” Intermediate “I,” and Resistant “R”) according to the CLSI guideline. Figure 5A shows the PCA plots of the data. The centroids of the S, I, and R groups are separated after 20 min of antimicrobial exposure, and there was a considerable amount of overlap. The separation widened when the antimicrobial exposure time increased. We trained and cross-validated 80% (4,040 cells) of the data with various classification algorithms, including Random Forest, Naive Bayes, K-Nearest Neighbor, and Support Vector Machine. The results suggest the Random Forest algorithm outperformed other models (Supplementary Table 3). The categorical agreement (CA), which is the percentage of interpretive agreement between the predicted and true labels, was determined in the training set (Figure 5B). The Random Forest model achieved a 97% accuracy in as early as 20 min (two-fifths of the doubling time) and reached over 99% accuracy in 40 min (four-fifths of the doubling time). In contrast to the dynamic approach, grouping multiple bacteria, however, did not improve the accuracy (Supplementary Figure 3).
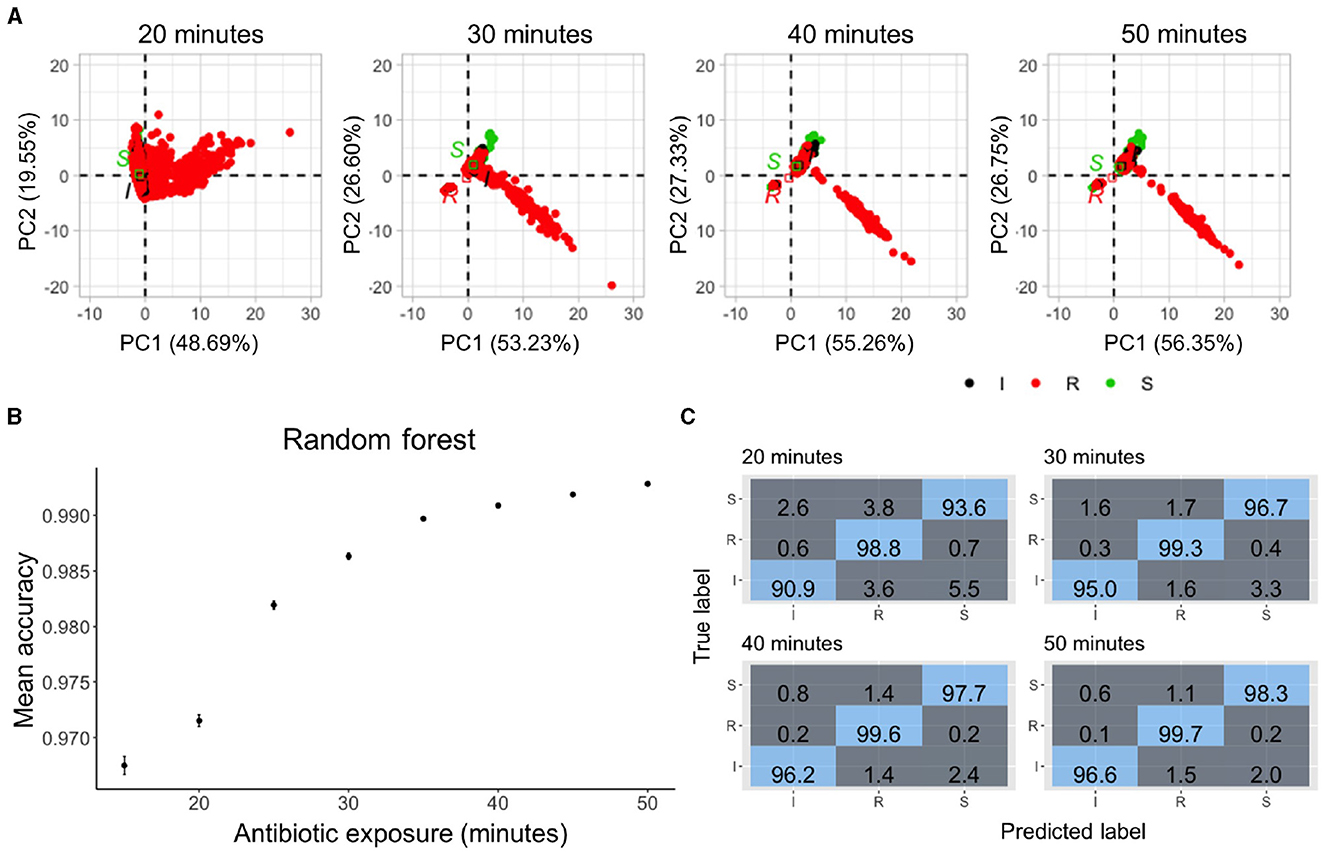
Figure 5. Classification accuracy of sub-doubling time susceptibility prediction using the concentration differential approach. (A) Principal component analysis plots of the normalized data with 20–50 min of antimicrobial exposure. The data are labeled based on the susceptibility to meropenem—red for resistant, black for intermediate, and green for susceptible. (B) Prediction accuracy of random forest classifiers trained on 80% of the data with different durations of antimicrobial exposure. Median accuracy was determined using 5-fold cross-validation and 10 repetitions. Multiclass prediction accuracy was >96% as early as 15 min of antimicrobial exposure with increasing accuracy over time. (C) Evolution of confusion matrices of Random Forest classifiers against the 20% test dataset with groups of 20–50 min of antimicrobial exposure. Resistant cells were classified with 98.8% accuracy in 20 min. The accuracy increased to 99.7% in 50 min.
Next, the accuracy of predicting each class was estimated by examining the confusion matrices (Figure 5C). With 20 min of meropenem exposure, the Random Forest model had a multiclass area under the curve (AUC) of 94.5%, error rate of 2.8%, and precision and recall of 94.4% each against the validation dataset with >98% of the resistant cells being accurately predicted. The performance of the Random Forest model further improved with an increase in the antimicrobial exposure time. Within just 40 min of exposure, this model achieved a multiclass AUC of 97.85%, error rate of 1%, and precision and recall of 97.8% each against the validation dataset supporting the use of morphological features for rapid single-cell AST.
Minimum inhibitory concentration prediction in sub-doubling times
We further expanded on the use of the concentration differential data processing to evaluate its utility for MIC prediction. A Random Forest regressor was trained on a total of 39,135 cells from an optimal combination of 19 strains (KP_0004, KP_0005, KP_0010, KP_0016, KP_0034, KP_0120, KP_0140, KP_0160, KP_0542, KP_0548, KP_0555, KP_0556, KP_0558, KP_1705, KP_700603, KP_U2, KP_U4, KP_U5, and KP_U7) across the concentrations. The model, including historic data (i.e., earlier time points), had a cumulative improvement in performance measured by the root-mean-square error (RMSE = ), R-squared (Rsquared = ), and mean absolute error (MAE = ) values with increased exposure time (Figure 6A). The Random Forest regressor predicted the MIC in the 5-fold cross-validated training dataset with an RMSE of 0.8, MAE of 0.2, and an R2 of 0.93. The performance of the model was assessed against 5 unseen KP strains (KP_003, KP_0142, KP_139, KP_552, and KP_U3), which comprised 6,067 cells. The experimental MIC and predicted MIC of the 5 unseen strains based on the Random Forest regressor are compared in Figure 6B. The data showed a strong correlation, and the regressor collectively predicted the MIC within plus or minus, 1-2-fold dilution for all strains, resulting in an 80% essential agreement (EA) with 40 min of antimicrobial exposure that increases to 100% EA with 50 min of exposure.
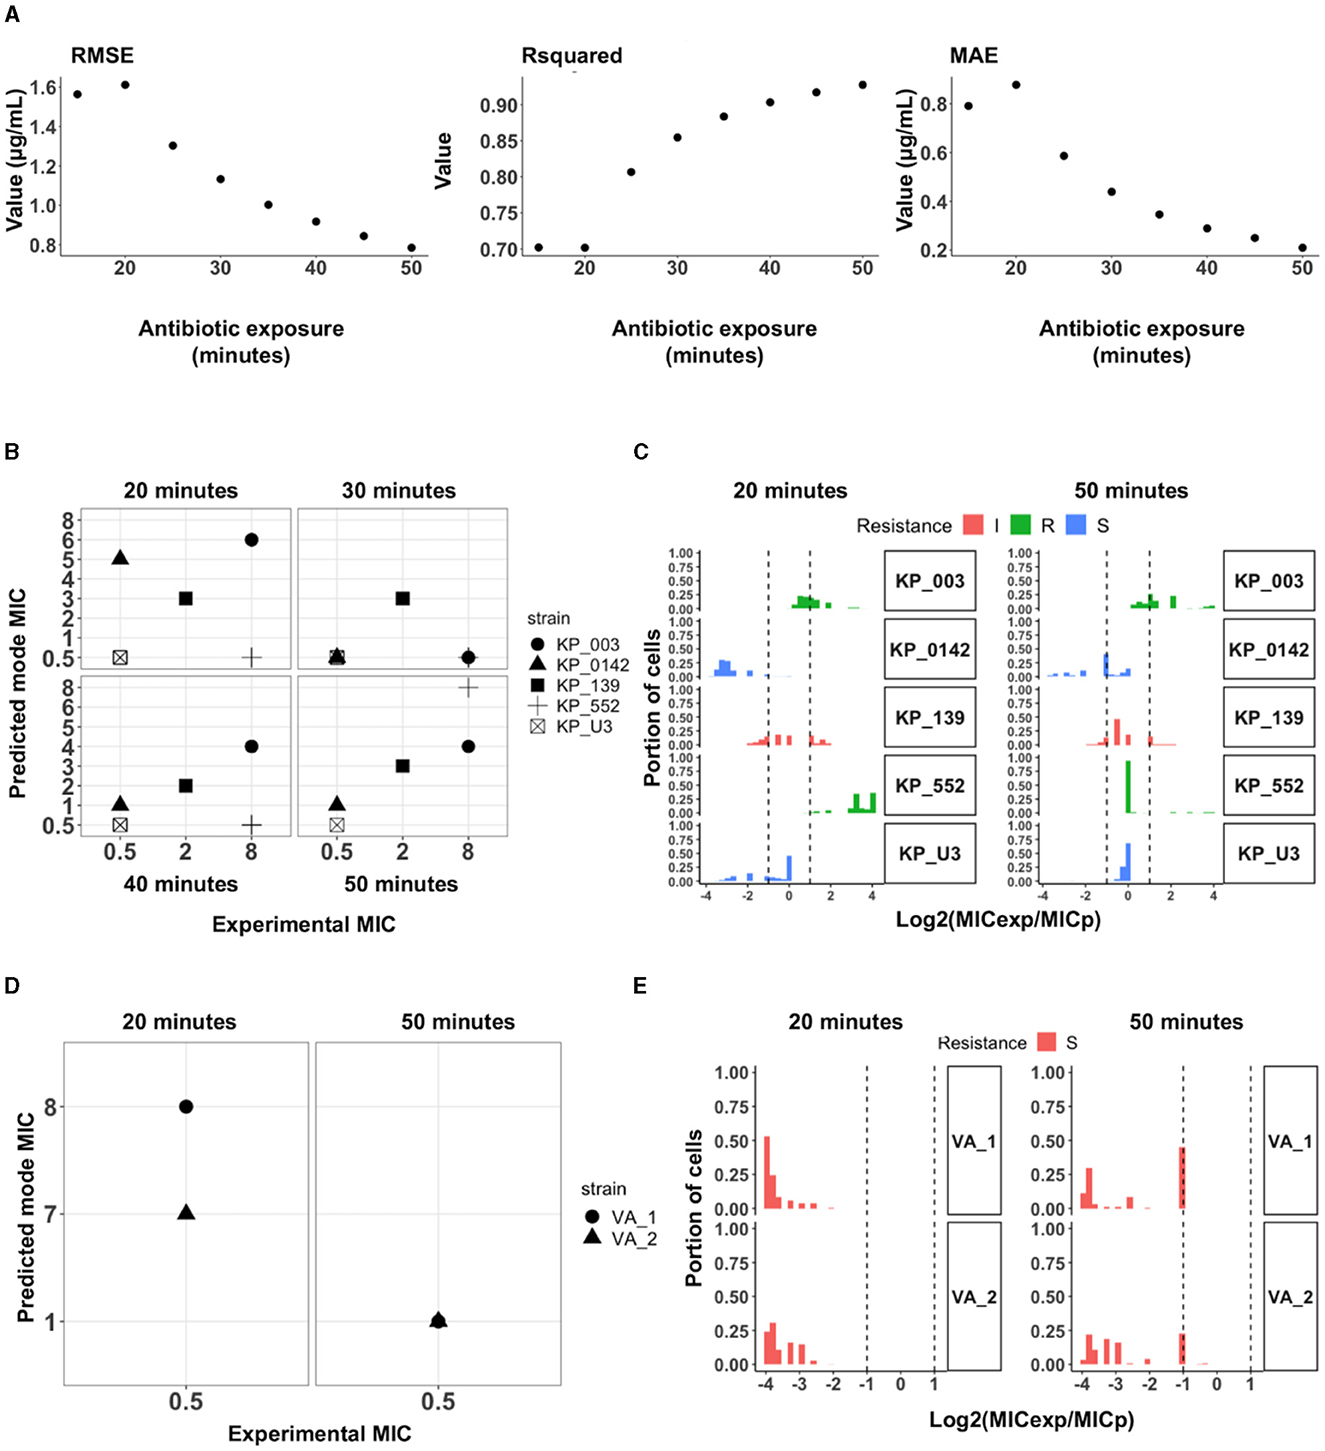
Figure 6. Minimum inhibitory concentration prediction with a random forest regressor using the concentration differential approach. (A) Evaluation of the regression model with root-mean-square error (RMSE), R-squared and mean absolute error (MAE) values. The regression model trained on the best set of 19 strains was assessed for the lowest RMSE and MAE and highest R-squared values. With historical data and accumulated time, the model performs better as seen in all metrics. (B) Mode of predicted MIC for each unseen test strain in comparison to the experimental MIC for each strain. The regressor achieved 100% essential agreement in the predicted mode MIC within 50 min. (C) Histogram of the log2 dilution of the ratio between experimental MIC (MICexp) and CDC reported MIC (MICp) for all the cells in the test strains. ~85.1% of all cells had predicted MIC within 1-2-fold dilution from the experimental MIC after 50 min of exposure to meropenem. (D) MIC prediction and susceptibility classification of two clinical isolates from patients with urinary tract infections with 922 (VA_1) and 648 (VA_2) cells imaged across multiple concentrations of meropenem. The model predicts the mode MIC for VA_1 and VA_2 to be 1 μg/mL and accurately classified both to be susceptible. (E) Histogram of the log2 dilution of the ratio between reported MIC (MICrep) and CDC reported MIC (MICpred). Extensive heterogeneity in the populations of the clinical isolates, even within 50 min, only ~40% of the cells from the two isolates starts to show susceptibility phenotype.
The predicted and experimentally reported labels (i.e., Susceptible “S,” Intermediate “I,” or Resistant “R”) were also compared. Based on the predicted MIC for each strain within 30 min of exposure, the model performed poorly against the resistant strains but correctly predicted 100% (2/2) of the susceptible and intermediate (1/1) bacteria. Similar to the classifier models, the performance of the model increased with the antimicrobial exposure time and achieved 100% CA with 0% ME and 0% VME in 50 min. We then evaluated the model performance in predicting the MIC for individual cells within each population of the unseen strains tested (Figure 6C). While there is heterogeneity in calls for individual cells from a single population, ~79.9% of cells from 3/5 strains tested (KP_003, KP_139, and KP_U3) had predicted MICs within 1-2-fold dilution from the experimental MIC after 20 min of antimicrobial exposure. After 50 min of exposure, ~85.1% of all cells from 5/5 tested strains had predicted MICs within 1-2 fold dilution from experimental MIC.
In addition to validation against unseen strains, the model was tested against imaging data from two clinical samples of KP obtained from patients visiting the VA (Palo Alto) with urinary tract infections (Figures 6D, E). The experimental MICs for these clinical samples (VA_1 and VA_2) was 0.5 μg/mL, i.e., susceptible. Within 20 min of meropenem treatment, the model did not observe patterns for susceptibility it had learned from the training data and predicted both strains to be resistant with an MIC of 8 and 7 μg/mL, respectively. When the incubation time was increased to 50 min, both strains were predicted to have a mode MIC of 1 μg/mL which accurately classifies both clinical isolates as susceptible with an MIC within 1-2 fold dilution from the experimental MIC resulting. Notably, heterogeneity within the population is more readily apparent with the clinical isolates where even after the 50 min of exposure, only a subset of the population started portraying susceptibility features as determined by the predicted MIC—~45% of VA_1 and ~23.3% of VA_2 had predicted MICs within 1-2 fold dilution with the mode MIC of 1 μg/mL. These results suggest a sufficient number of bacteria should be considered to compensate the heterogeneity of clinical samples in order to accurately predict the MIC (Smith and Kirby, 2018).
Discussion
This study demonstrated a rapid, growth independent strategy for determining the antimicrobial susceptibility of K. pneumoniae against meropenem using time-lapse single-cell imaging, computer vision, and machine learning models. By tracking the antimicrobial-induced morphological changes of individual cells, the MorphoAST workflow predicted the susceptibility category and MIC with high accuracy within doubling time of the bacteria. We compared two data processing strategies based on the time and concentration differentials. Both strategies successfully predicted the susceptibility of left-out cells from the same strains used in the training in as few as 20 min (two-fifths of the doubling time) of antimicrobial exposure with high accuracy. The concentration differential approach with the random forest classifier achieved an overall better accuracy and resolution for predicting the susceptibility category (CA >97% in as few as 20 min) against the test cells. Therefore, the concentration differential approach should be applied whenever possible. The time differential approach, however, could be useful when only a small number of bacteria is available (e.g., direct detection of bacteria from clinical samples) and only limited antimicrobial concentrations can be measured (e.g., a point-of-care device that detects only a small number of conditions). Our data also suggested that the prediction accuracy was generally improved with the antimicrobial exposure time, the number of bacteria being analyzed, and the number of testing conditions. These results underscore important considerations and tradeoffs in the design of the single-cell AST workflow and provide examples of future assay designs (Li et al., 2023).
Our results showed that morphological features alone, including growth-independent changes induced by antibiotics, are useful information for rapid AST. In particular, the formation of bulges among K. pneumoniae with varying meropenem MIC are distinct and allowed us to classify susceptibility in a sub-doubling time. Bulge formation has been associated with the disruption of peptidoglycan and cell wall degradation before cell lysis (Yao et al., 2012). Prior studies have also reported the formation of cell-wall deficient spheroplasts in carbapenem-tolerant K. pneumoniae strains, after exposure to meropenem (Cross et al., 2019; Murtha et al., 2022). While antimicrobial-induced shape changes in bacterial cells are not fully understood in general, recent quantitative modeling reveals potential advantages of this physiological adaptation, which include decreasing antimicrobial influx and diluting intracellular antimicrobials, leading to a higher tolerance (Ojkic et al., 2022). The size and shape regulation differs from one organism to another, but importantly, provides a general reflection of their response in a short time frame (Ojkic and Banerjee, 2021). As demonstrated in this study, MorphoAST provides a workflow for utilizing the potential of morphological features for rapid AST. The workflow should be compatible with various morphological features, such as filamentation, bulging, and lysis, induced by specific antimicrobial-bacteria combinations. The methodical procedure identifies and distinguishes key morphological features that can be captured before and after the treatment (time differential) or with various antimicrobial dilutions (concentration differential).
The bacteria used in this study to demonstrate the proof-of-concept methodology typically takes 2.5-−3 h to reach the mid-log phase, followed by as little as 20 min of imaging after antimicrobial treatment to obtain results. Compared to commercial systems such as AccelerateDiagnostics' PhenoTest and Gradientech's QuickMIC systems which provide MIC information in 7 and 3 h respectively, the MorphoAST can potentially match or shorten the time-to-result by about 3 h (Malmberg et al., 2022; Ullberg and Özenci, 2020). MorphoAST can also deliver categorical (S/I/R) information in less time (20 min), with a turnaround time that is on par with commercial system, such as the Sysmex Astrego system (Baltekin et al., 2017). Given that MorphoAST achieves these results without the need to determine growth rates of the bacteria, it could potentially shorten turnaround times when dealing with fastidious organisms.
As the morphological features can be captured in a fraction of the doubling time, it reduces the assay time compared to the standard phenotypic AST (e.g., broth microdilution), which typically requires one or more days. The approach bypasses the requirement of cell replication in other single-cell AST techniques (Pancholi et al., 2018). This characteristic will be particularly useful for diagnosing slow-growing and difficult-to-culture bacteria in normal laboratory conditions. As imaging is common in AST (Song and Lei, 2021; Salido et al., 2022) and low-cost microscopes are readily available, the MorphoAST workflow which offers a relatively simple setup consisting mainly of agar pads and a microscope can be integrated with existing systems and implemented in a variety of settings. These advantages and characteristics will potentially increase the utility of MorphoAST for direct sample AST testing, especially in critical diseases like sepsis where the bacteria load in the blood is typically very low. The small inoculum will also considerably reduce the time to AST results at the point of care.
In both validation strains and clinical isolates, results from our MIC predictor regressor model demonstrate outstanding categorical agreement (100%) and essential agreement (100%), which are above the FDA acceptable level (≥90%) for new AST devices. The machine learning models consistently had 0% VME after 50 min of antimicrobial exposure, which is ideal and substantially better than the acceptable VME rate (≤ 1.5%). A low VME rate is particularly important as missing a resistant strain could result in the prescription of an ineffective antimicrobial for the patient.
While we demonstrated the utility of MorphoAST with a single drug-bug combination as proof of concept, the extension of MorphoAST upon future validation with other drug-bug combinations, diverse resistance mechanisms, and inoculum sizes will potentially accelerate microbiological analysis for combating multidrug-resistant bacteria while accounting for the varied factors that affect susceptibility and MIC. The effect of various antimicrobials on the shape and size of organisms such as Acinetobacter baumannii, and Bacillus subtilis has been described elsewhere and serves as a useful reference for future studies that seeks to apply similar imaging approaches (Ojkic and Banerjee, 2021). Further optimization by incorporating population size and dynamics into the training methodology could shorten the time to decision and potentially increase the accuracy with smaller population sizes. Bacterial populations are heterogenous, and cells do not all portray susceptibility phenotypes simultaneously, and hence, deciphering the dynamics of a population trending toward susceptibility early can accelerate AST further. Toward clinical translation of the proof-of-concept MorphoAST, additional drug-bug combinations should be tested to evaluate the accuracy of the approach in other settings. Automation of the drug mixing and bacteria trapping steps will shorten the initial preparation time and capture changes in bacterial morphologies at earlier time points. Implementing the workflow in an integrated, low-cost imaging system, instead of a microscope, will also be important for translating the computer-based workflow for managing a wide spectrum of infectious diseases.
Data availability statement
The raw data supporting the conclusions of this article will be made available by the authors, without undue reservation.
Author contributions
KT: Conceptualization, Investigation, Methodology, Validation, Writing – original draft, Writing – review & editing. NR-M: Conceptualization, Data curation, Formal analysis, Investigation, Methodology, Validation, Visualization, Writing – original draft, Writing – review & editing. MR: Conceptualization, Data curation, Formal analysis, Investigation, Methodology, Visualization, Writing – original draft, Writing – review & editing. EZ: Data curation, Investigation, Methodology, Writing – review & editing. ZQ: Formal analysis, Investigation, Methodology, Writing – review & editing. KM: Investigation, Methodology, Resources, Writing – review & editing. OE: Investigation, Methodology, Writing – review & editing. JL: Conceptualization, Funding acquisition, Resources, Writing – review & editing. SY: Conceptualization, Funding acquisition, Investigation, Project administration, Resources, Supervision, Writing – review & editing. PW: Conceptualization, Funding acquisition, Investigation, Project administration, Resources, Supervision, Writing – review & editing.
Funding
The author(s) declare financial support was received for the research, authorship, and/or publication of this article. This work was supported in part by NIH NIAID (R01AI153133).
Acknowledgments
We acknowledge technical support from Youngbin Lim from the Stanford Cell Sciences Imaging Facility. We are grateful for the insightful discussions and computational support from Dean Deng from Stanford University. This work was performed, in part, at the Stanford Cell Sciences Imaging Facility of Stanford University. All computational analyses were performed on the Stanford Genomic Cluster of the Stanford Research Computing Center.
Conflict of interest
The authors declare that the research was conducted in the absence of any commercial or financial relationships that could be construed as a potential conflict of interest.
Publisher's note
All claims expressed in this article are solely those of the authors and do not necessarily represent those of their affiliated organizations, or those of the publisher, the editors and the reviewers. Any product that may be evaluated in this article, or claim that may be made by its manufacturer, is not guaranteed or endorsed by the publisher.
Supplementary material
The Supplementary Material for this article can be found online at: https://www.frontiersin.org/articles/10.3389/fimag.2024.1418669/full#supplementary-material
References
Avesar, J., Rosenfeld, D., Truman-Rosentsvit, M., Ben-Arye, T., Geffen, Y., Bercovici, M., et al. (2017). Rapid phenotypic antimicrobial susceptibility testing using nanoliter arrays. Proc. Natl. Acad. Sci. U. S. A. 114, E5787–E5795. doi: 10.1073/pnas.1703736114
Baltekin, Ö., Boucharin, A., Tano, E., Andersson, D. I., and Elf, J. (2017). Antibiotic susceptibility testing in less than 30 min using direct single-cell imaging. Proc. Natl. Acad. Sci. U. S. A. 114, 9170–9175. doi: 10.1073/pnas.1708558114
Bourne, C. R. (2021). Bacterial growth mindset: structural plasticity in defense systems. Structure 29, 97–98. doi: 10.1016/j.str.2021.01.007
Brauner, A., Fridman, O., Gefen, O., and Balaban, N. Q. (2016). Distinguishing between resistance, tolerance and persistence to antibiotic treatment. Nat. Rev. Microbiol. 14, 320–330. doi: 10.1038/nrmicro.2016.34
Bruus, H. (2012). Acoustofluidics 10: scaling laws in acoustophoresis. Lab. Chip 12:1578. doi: 10.1039/c2lc21261g
Choi, J., Jung, Y. G., Kim, J., Kim, S., Jung, Y., Na, H., et al. (2013). Rapid antibiotic susceptibility testing by tracking single cell growth in a microfluidic agarose channel system. Lab/ Chip 13, 280–287. doi: 10.1039/C2LC41055A
Choi, J., Yoo, J., Lee, M., Kim, E. G., Lee, J. S., Lee, S., et al. (2014). A rapid antimicrobial susceptibility test based on single-cell morphological analysis. Sci. Transl. Med. 6:9650. doi: 10.1126/scitranslmed.3009650
Cross, T., Ransegnola, B., Shin, J. H., Weaver, A., Fauntleroy, K., VanNieuwenhze, M. S., et al. (2019). Spheroplast-mediated carbapenem tolerance in gram-negative pathogens. Antimicrob. Agents Chemother. 63:19. doi: 10.1128/AAC.00756-19
Ducret, A., Quardokus, E. M., and Brun, Y. V. (2016). MicrobeJ, a tool for high throughput bacterial cell detection and quantitative analysis. Nat. Microbiol. 1, 1–7. doi: 10.1038/nmicrobiol.2016.77
Durante-Mangoni, E., Andini, R., and Zampino, R. (2019). Management of carbapenem-resistant enterobacteriaceae infections. Clin. Microbiol. Infect. 25, 943–950. doi: 10.1016/j.cmi.2019.04.013
Hafza, N., Challita, C., Dandachi, I., Bousaab, M., Dahdouh, E., Daoud, Z., et al. (2018). Competition assays between ESBL-producing E. coli and K. pneumoniae isolates collected from lebanese elderly: an additional cost on fitness. J. Infect/ Publ. Health 11, 393–397. doi: 10.1016/j.jiph.2017.09.010
Harris, C. R., Millman, K. J., van der Walt, S. J., Gommers, R., Virtanen, P., Cournapeau, D., et al. (2020). Array programming with NumPy. Nature 585, 357–362. doi: 10.1038/s41586-020-2649-2
Jernigan, J. A., Hatfield, K. M., Wolford, H., Nelson, R. E., Olubajo, B., Reddy, S. C., et al. (2020). Multidrug-resistant bacterial infections in U.S. hospitalized patients, 2012–2017. N. Engl. J. Med. 382, 1309–1319. doi: 10.1056/NEJMoa1914433
Jorgensen, J. H., and Ferraro, M. J. (2009). Antimicrobial susceptibility testing: a review of general principles and contemporary practices. Clin. Infect. Dis. 49, 1749–1755. doi: 10.1086/647952
Kalashnikov, M., Mueller, M., McBeth, C., Lee, J. C., Campbell, J., Sharon, A., et al. (2017). Rapid phenotypic stress-based microfluidic antibiotic susceptibility testing of gram-negative clinical isolates. Sci. Rep/ 7, 1–10. doi: 10.1038/s41598-017-07584-z
Kaushik, A. M., Hsieh, K., Mach, K. E., Lewis, S., Puleo, C. M., Carroll, K. C., et al. (2021). Droplet-based single-cell measurements of 16S RRNA enable integrated bacteria identification and pheno-molecular antimicrobial susceptibility testing from clinical samples in 30 min. Adv. Sci. 8, 1–14. doi: 10.1002/advs.202003419
Kuhn, M. (2008). Building predictive models in R using the caret package. J. Stat. Softw/ 28, 1–26. doi: 10.18637/jss.v028.i05
Łapińska, U., Voliotis, M., Lee, K. K., Campey, A., Stone, M. R. L., Tuck, B., et al. (2022). Fast bacterial growth reduces antibiotic accumulation and efficacy. Elife 11, 1–33. doi: 10.7554/eLife.74062
Li, H., Hsieh, K., Wong, P. K., Mach, K. E., Liao, J. C., Wang, T. H., et al. (2023). Single-cell pathogen diagnostics for combating antibiotic resistance. Nat. Revi. Methods Prim. 3:190. doi: 10.1038/s43586-022-00190-y
Li, H., Torab, P., Mach, K. E., Surrette, C., England, M. R., Craft, D. W., et al. (2019). Adaptable microfluidic system for single-cell pathogen classification and antimicrobial susceptibility testing. Proc. Natl. Acad. Sci. U. S. A. 2019:201819569. doi: 10.1073/pnas.1819569116
Lu, Y., Gao, J., Zhang, D. D., Gau, V., Liao, J. C., Wong, P. K., et al. (2013). Single cell antimicrobial susceptibility testing by confined microchannels and electrokinetic loading. Anal. Chem. 85, 3971–3976. doi: 10.1021/ac4004248
Malmberg, C., Torpner, J., Fernberg, J., Öhrn, H., Ångström, J., Johansson, C., et al. (2022). Evaluation of the speed, accuracy and precision of the QuickMIC rapid antibiotic susceptibility testing assay with gram-negative bacteria in a clinical setting. Front. Cell Infect/ Microbiol. 12:758262. doi: 10.3389/fcimb.2022.758262
Matsumoto, Y., Sakakihara, S., Grushnikov, A., Kikuchi, K., Noji, H., Yamaguchi, A., et al. (2016). Microfluidic channel method for rapid drug-susceptibility testing of Pseudomonas aeruginosa. PLoS ONE 11, 1–17. doi: 10.1371/journal.pone.0148797
Monahan, L. G., Turnbull, L., Osvath, S. R., Birch, D., Charles, I. G., Whitchurch, C. B., et al. (2014). Rapid conversion of Pseudomonas aeruginosa to a spherical cell morphotype facilitates tolerance to carbapenems and penicillins but increases susceptibility to antimicrobial peptides. Antimicrob. Agents Chemother. 58, 1956–1962. doi: 10.1128/AAC.01901-13
Murtha, A. N., Kazi, M. I., Schargel, R. D., Cross, T., Fihn, C., Cattoir, V., et al. (2022). High-level carbapenem tolerance requires antibiotic-induced outer membrane modifications. PLoS Pathog. 18, 1–19. doi: 10.1371/journal.ppat.1010307
Nonejuie, P., Burkart, M., Pogliano, K., and Pogliano, J. (2013). Bacterial cytological profiling rapidly identifies the cellular pathways targeted by antibacterial molecules. Proc. Natl. Acad. Sci. U. S. A. 110, 16169–16174. doi: 10.1073/pnas.1311066110
Nordmann, P., Naas, T., and Poirel, L. (2011). Global spread of carbapenemase producing enterobacteriaceae. Emerg. Infect. Dis. 17, 1791–1798. doi: 10.3201/eid1710.110655
Ojkic, N., and Banerjee, S. (2021). Bacterial cell shape control by nutrient-dependent synthesis of cell division inhibitors. Biophys. J. 120, 2079–2084. doi: 10.1016/j.bpj.2021.04.001
Ojkic, N., Serbanescu, D., and Banerjee, S. (2022). Antibiotic resistance via bacterial cell shape-shifting. mBio 2022:22. doi: 10.1128/mbio.00659-22
Pancholi, P., Carroll, K. C., Buchan, B. W., Chan, R. C., Dhiman, N., Ford, B., et al. (2018). Multicenter evaluation of the accelerate PhenoTest BC kit for rapid identification and phenotypic antimicrobial susceptibility testing using morphokinetic cellular analysis. J. Clin. Microbiol. 56:17. doi: 10.1128/JCM.01329-17
Pedregosa, F., Michel, V., Grisel, O., Blondel, M., Prettenhofer, P., Weiss, R., et al. (2011). Scikit-learn: machine learning in Python. J. Machine Learn. Res. 12, 2825–2830.
Qingzong, T. (2022). Template Matching and Slice Alignment. Available at: https://sites.google.com/site/qingzongtseng/template-matching-ij-plugin#credit (accessed June 28, 2022).
Rosłoń, I. E., Japaridze, A., Steeneken, P. G., Dekker, C., and Alijani, F. (2022). Probing nanomotion of single bacteria with graphene drums. Nat. Nanotechnol. 17, 637–642. doi: 10.1038/s41565-022-01111-6
Salido, J., Bueno, G., Ruiz-santaquiteria, J., and Cristobal, G. (2022). A review on low-cost microscopes for open science. Microsc. Res. Tech. 85, 3270–3283. doi: 10.1002/jemt.24200
Scherer, B., Surrette, C., Li, H., Torab, P., Kvam, E., Galligan, C., et al. (2021). Digital electrical impedance analysis for single bacterium sensing and antimicrobial susceptibility testing. Lab. Chip 21, 1073–1083. doi: 10.1039/D0LC00937G
Shamsheyeva, A., Howson, D. C., and Metzger, S. W. (2013). Rapid Determination of Microbial Growth and Antimicrobial Susceptibility.
Smith, K. P., and Kirby, J. E. (2018). The inoculum effect in the era of multidrug resistance: minor differences in inoculum have dramatic effect on MIC determination. Antimicrob. Agents Chemother. 62:18. doi: 10.1128/AAC.00433-18
Song, D., and Lei, Y. (2021). Mini-review: recent advances in imaging-based rapid antibiotic susceptibility testing. Sens. Actuat. Rep. 2021:100053. doi: 10.1016/j.snr.2021.100053
Tjandra, K. C., Ram-mohan, N., Abe, R., Hashemi, M. M., Lee, J., Chin, S. M., et al. (2022). Diagnosis of bloodstream infections : an evolution of technologies towards accurate and rapid identification and antibiotic susceptibility testing. Antibiotics 11:511. doi: 10.3390/antibiotics11040511
Ullberg, M., and Özenci, V. (2020). Identification and antimicrobial susceptibility testing of gram-positive and gram-negative bacteria from positive blood cultures using the accelerate PhenoTM system. Eur. J. Clin. Microbiol. Infect. Dis. 39, 139–149. doi: 10.1007/s10096-019-03703-y
Vasala, A., Hytönen, V. P., and Laitinen, O. H. (2020). Modern tools for rapid diagnostics of antimicrobial resistance. Front. Cell Infect. Microbiol. 10:308. doi: 10.3389/fcimb.2020.00308
Veses-Garcia, M., Antypas, H., Löffler, S., Brauner, A., Andersson-Svahn, H., Richter-Dahlfors, A., et al. (2018). Rapid phenotypic antibiotic susceptibility testing of uropathogens using optical signal analysis on the nanowell slide. Front. Microbiol. 9, 1–10. doi: 10.3389/fmicb.2018.01530
Wes McKinney (2017). Python for Data Analysis, Vol. 71. Available at: https://wesmckinney.com/book/
Wright, M. N., and Ziegler, A. (2017). Ranger : a fast implementation of random forests for high dimensional data in C++ and R. J. Stat. Softw. 77:i01. doi: 10.18637/jss.v077.i01
Yang, D. C., Blair, K. M., and Salama, N. R. (2016). Staying in shape: the impact of cell shape on bacterial survival in diverse environments. Microbiol. Mol. Biol. Rev. 80, 187–203. doi: 10.1128/MMBR.00031-15
Yao, Z., Kahne, D., and Kishony, R. (2012). Distinct single-cell morphological dynamics under beta-lactam antibiotics. Mol. Cell 48, 705–712. doi: 10.1016/j.molcel.2012.09.016
Zahir, T., Camacho, R., Vitale, R., Ruckebusch, C., Hofkens, J., Fauvart, M., et al. (2019). High-throughput time-resolved morphology screening in bacteria reveals phenotypic responses to antibiotics. Commun. Biol. 2, 1–13. doi: 10.1038/s42003-019-0480-9
Keywords: multidrug-resistant bacteria, artificial intelligence, antimicrobial susceptibility test, minimum inhibitory concentration, microscopy
Citation: Tjandra KC, Ram-Mohan N, Roshardt M, Zudock EJ, Qu Z, Mach KE, Eminaga O, Liao JC, Yang S and Wong PK (2024) Growth independent morphometric machine learning workflow for single-cell antimicrobial susceptibility testing of Klebsiella pneumoniae to meropenem. Front. Imaging. 3:1418669. doi: 10.3389/fimag.2024.1418669
Received: 16 April 2024; Accepted: 11 September 2024;
Published: 26 September 2024.
Edited by:
Pankaj K. Sa, National Institute of Technology Rourkela, IndiaReviewed by:
José Manuel Rodriguez-Martínez, Sevilla University, SpainHideaki Tsutsui, University of California, Riverside, United States
Copyright © 2024 Tjandra, Ram-Mohan, Roshardt, Zudock, Qu, Mach, Eminaga, Liao, Yang and Wong. This is an open-access article distributed under the terms of the Creative Commons Attribution License (CC BY). The use, distribution or reproduction in other forums is permitted, provided the original author(s) and the copyright owner(s) are credited and that the original publication in this journal is cited, in accordance with accepted academic practice. No use, distribution or reproduction is permitted which does not comply with these terms.
*Correspondence: Samuel Yang, c3lhbmc1QHN0YW5mb3JkLmVkdQ==; Pak Kin Wong, cGFrQGVuZ3IucHN1LmVkdQ==
†These authors have contributed equally to this work