 Yihao Chen1†
 Shengpan Chen
 Jianbo Chang
 Junji Wei
 Ming Feng
 Renzhi Wang
- 1Department of Neurosurgery, Peking Union Medical College Hospital, Peking Union Medical College, Chinese Academy of Medical Sciences, Beijing, China
- 2Department of Neurosurgery, Guangdong Provincial People’s Hospital, Guangdong Institute of Neuroscience, Guangdong Academy of Medical Sciences, Guangdong, China
Intracerebral hemorrhage (ICH) has one of the worst prognoses among patients with stroke. Surgical measures have been adopted to relieve the mass effect of the hematoma, and developing targeted therapy against secondary brain injury (SBI) after ICH is equally essential. Numerous preclinical and clinical studies have demonstrated that perihematomal edema (PHE) is a quantifiable marker of SBI after ICH and is associated with a poor prognosis. Thus, PHE has been considered a promising therapeutic target for ICH. However, the findings derived from existing studies on PHE are disparate and unclear. Therefore, it is necessary to classify, compare, and summarize the existing studies on PHE. In this review, we describe the growth characteristics and relevant underlying mechanism of PHE, analyze the contributions of different risk factors to PHE, present the potential impact of PHE on patient outcomes, and discuss the currently available therapeutic strategies.
Introduction
The prognosis of patients with hemorrhagic stroke is extremely poor, resulting in long hospital stays and high costs (1). Each year, approximately 2.8 million people die of intracerebral hemorrhage (ICH) worldwide (2), and only 25% of ICH survivors are able to live independently 6 months after ICH onset (3). The functional neurological outcome of ICH is associated with mechanical destruction of nerve fibers and ICH-induced secondary brain injury (SBI).
Perihematomal edema (PHE) manifests when the water content increases in the brain tissue adjacent to the intraparenchymal hematoma. The development of PHE has been considered a quantifiable marker of SBI and is associated with thrombin activation, an inflammatory immune response, blood–brain barrier (BBB) dysfunction, and hemoglobin cytotoxicity after ICH (4–6). PHE also induces a significant mass effect, and rapid growth of PHE may result in severe intracranial hypertension. The International Surgical Trial in Intracerebral Hemorrhage (STICH) I and II showed no clinical benefit of early surgical evacuation of the hematoma in patients with ICH (7, 8); therefore, whether targeted treatment for PHE can provide favorable effects has become of great interest to researchers. Evidence obtained from high-quality preclinical research is required to investigate this issue. A comprehensive understanding of the pathogenesis and natural course of PHE is urgently needed to discover novel therapeutic targets for ICH-induced SBI.
Most research on PHE in patients with ICH has been retrospective. However, it is challenging to obtain good congruity in the timing of head computed tomography (CT) examinations in retrospective studies (9, 10). Previous studies adopted different severity indices and measurements for PHE and used CT scanning more often than head magnetic resonance imaging (MRI) (11, 12). These factors have led to discrepant findings in the exploration of the natural course and prognosis of PHE. In the present review, the PHE literature is assessed to describe the development characteristics of, pathophysiologic mechanisms of, and risk factors for PHE. This review also discusses the impacts of PHE on the clinical outcomes of patients with ICH and the currently available therapeutics for PHE in an effort to provide deeper insights into ICH-induced SBI and provide relevant data for innovative trials.
Natural Course of PHE
An experimental study of ICH showed that PHE was initiated in the acute phase, peaked at 3 to 4 days, and persisted for 7 days after onset (13). These findings are consistent with the neuropathological changes in experimental animals reported by Enzmann et al. (13), who found significant rupture of perihematomal erythrocytes and a peak perihematomal neuroinflammatory response 4 days after inducement of ICH. Additionally, Sun et al. (14) found that the aquaporin-4 (AQP-4) involved in brain water accumulation peaked at 48 h in a rat model of autologous blood injection.
Because PHE occurs predominantly in white matter, and because a significant discrepancy in the development of white matter exists between humans and animals (especially rodents), PHE growth is expected to be even more prominent in human beings (Figure 1) (15). In one human imaging study, all patients with ICH developed PHE within 6 h of symptom onset (12). The ultra-early stage of ICH is commonly regarded as the rapid growth phase of PHE (Figure 2). Wu et al. (10) reported that PHE grows rapidly within 24 h after onset and that the edema extension distance (EED) at 24 h accounts for 60% of the peak EED. Other researchers have reported that the time window from symptom onset to 48 or 72 h after symptom onset is the phase of most rapid PHE growth (16, 17). These discrepant findings are partly related to the heterogeneous timing of follow-up CT scans in retrospective studies of patients with PHE as well as the various metrics reflecting the severity of PHE that were adopted among different studies.
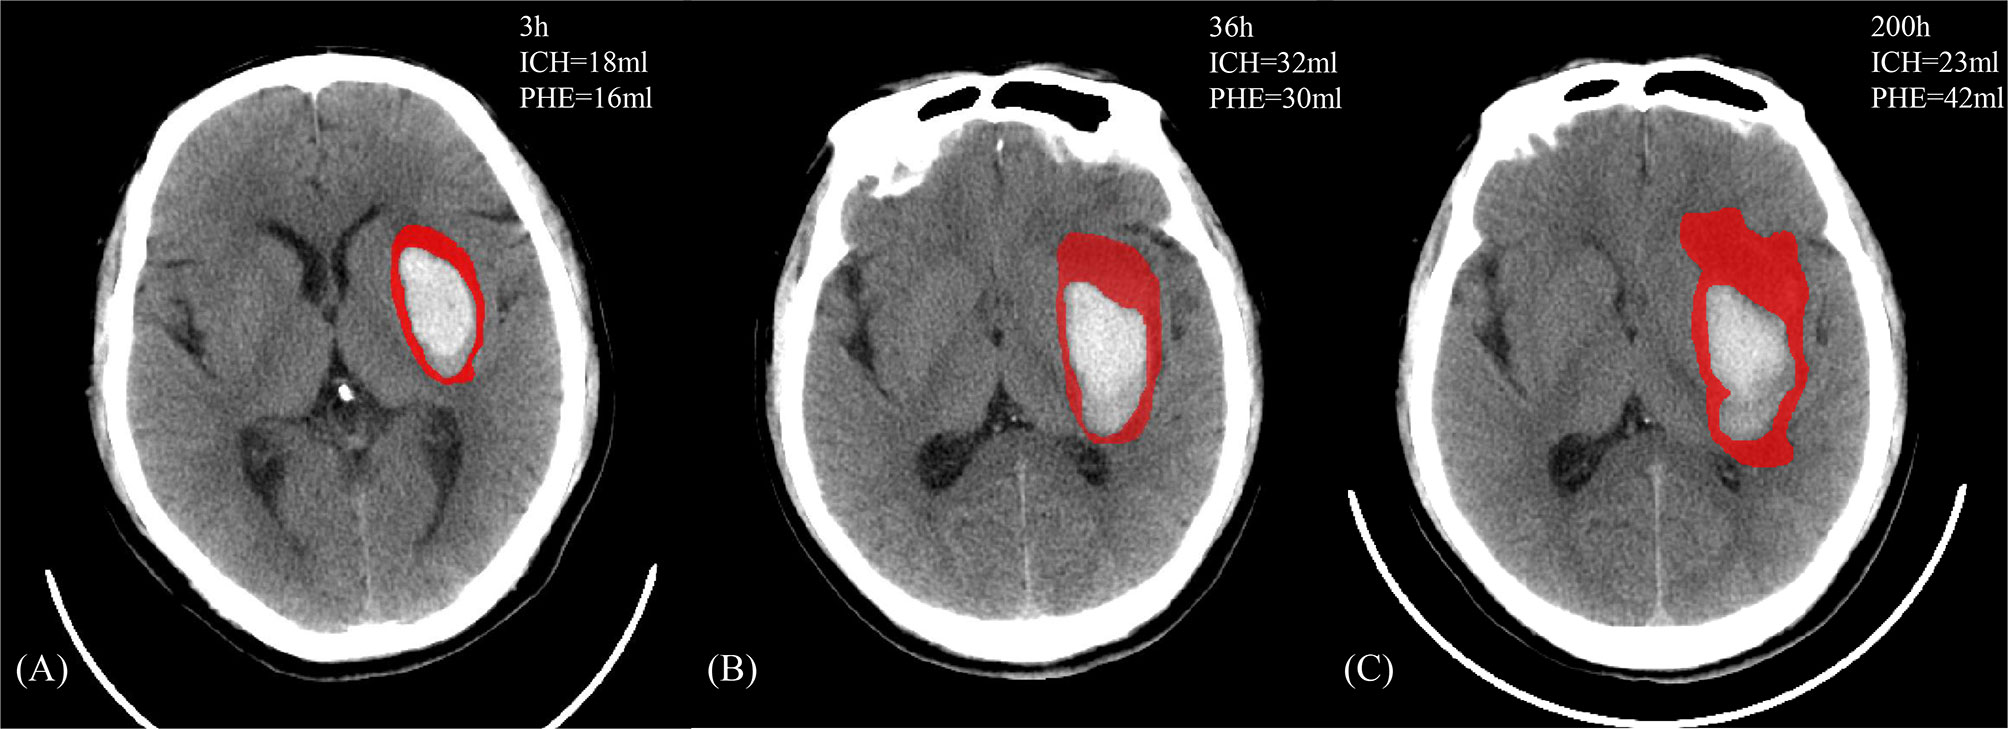
Figure 1 A 47-year-old male who manifested weakness of the right limb and gradually developed mild disturbance of consciousness without clear inducement. There exists a past medical history with hypertension, which the admission blood pressure is 166/106 mmHg and the Glasgow Coma Scale score was 12. The head NCCT revealed left basal ganglia hemorrhage. The patient received the standardized medical management, and the discharge Glasgow Outcome Scale score is 3. (A–C) The image features of PHE (in red) and ICH against the onset time.
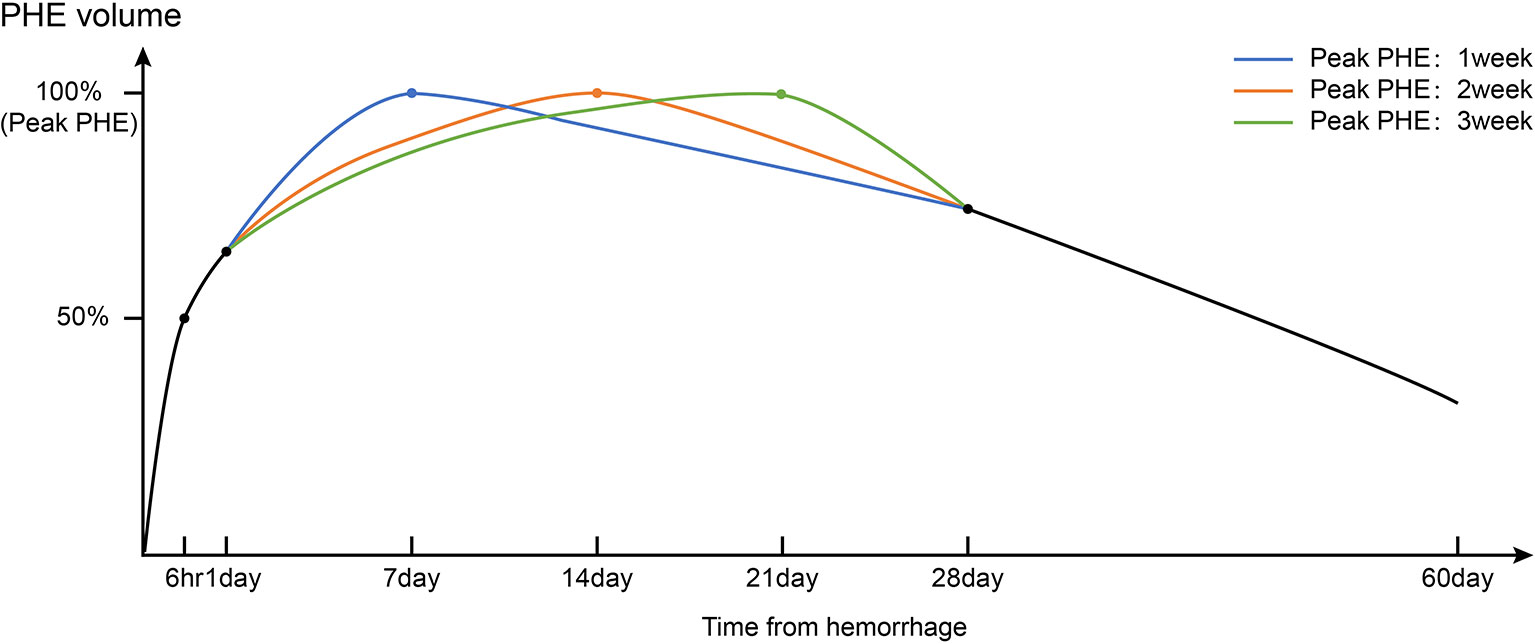
Figure 2 Timeline of PHE volumes after intracerebral hemorrhage based on real-world clinical research of the natural history of PHE. Triphasic patterns of growth of PHE (fast-growing phase: 1–3 days; slow-growing phase and peak period: 1–3 weeks; resorption phase: >3 weeks) were observed.
The growth rate of PHE gradually decreases after the rapid growth phase (Figure 2). Wu et al. (10) reported that the line of best fit between the growth rate of the EED (y, cm) and the symptom onset time (x, days) can be calculated as follows: y = 0.162x−0.927 (R2 = 0.820). The PHE volume peaks at around 1 to 2 weeks after onset of ICH (17–19). However, growth of PHE in a small number of patients persists up to 3 weeks after onset, which might be associated with a high hematocrit at admission. In contrast, one study showed that an early peak in PHE growth may be associated with rupture of the hematoma into the ventricle (16). This may be clinically relevant because a high hematocrit indicates higher red blood cell (RBC) degradation, which has been identified as an essential factor for promotion of PHE. The abovementioned study showed that in patients with rupture of the hematoma into the ventricle, the deposition of lysed erythrocytes in the brain parenchyma was alleviated by the dilutional effect of the cerebrospinal fluid. Unexpectedly, the initial hematoma volume did not appear to affect the peak time of PHE (16). The peak time points may also differ according to the location of ICH. Sprügel et al. (20) reported that lobar ICH was associated with earlier peak PHE onset and a greater initial PHE volume than deep ICH. This likely occurred because of the irregular shape of the lobar ICH within the relatively loose brain tissue, promoting a higher PHE volume per unit of the hematoma surface area. Therefore, it is clinically important to evaluate the PHE growth patterns when differentiating the common causes of lobar ICH (e.g., cerebral amyloid angiopathy) and deep ICH (e.g., hypertensive ICH). Peng et al. (21) showed that in about 30% of patients, the PHE volume at 2 to 3 weeks after ICH was 3 ml greater than that within 1 week after ICH, and this increase in volume was an independent risk factor for a poor prognosis. However, a clear definition of delayed PHE formation is still lacking.
After peaking, PHE enters a phase in which it slightly decreases in volume (Figure 2). One study showed that in patients who did not undergo curative surgery, the PHE volume at 4 weeks was similar to that at 1 week after onset (22). However, Fung et al. (23) found that in patients with a large initial PHE volume, about 60 days was required for the PHE to return to the baseline level regardless of whether the patient had undergone decompression. For patients with ICH who undergo hematoma removal procedures, the natural postoperative course of PHE differs from that before surgery. Horowitz et al. (24) defined postoperative PHE as “pericavity edema” and investigated its time course. They found that pericavity edema grew mainly within the first 2 days postoperatively, after which the growth maintained a steady state. A higher percentage of hematoma removal resulted in slower growth of pericavity edema (24).
Mechanisms of PHE
Cytotoxic Edema vs. Vasogenic Edema
Although the complex mechanism of PHE growth is not yet completely clear, preclinical evidence suggests that different pathophysiologic mechanisms dominate the development of PHE at different stages of ICH (Figure 3) (4–6, 25). The essential phenomenon underlying PHE formation is an imbalance of the perivascular fluid interchange based on Starling’s principle (26). Specifically, the formation of an osmotic gradient and the elevation of capillary hydrostatic forces drive the flow of fluids that result in the development of PHE. Starling’s classic formula is JV = KH(PC − PI) − KO(πC − πI), where JV is the net transendothelial fluid transfer in brain capillaries; KO and KH are the filtration coefficients of oncotic conductivity and hydraulic conductivity, respectively; πC − πI is the difference in oncotic pressure between the capillaries and interstitial tissue; and PC – PI is the difference in hydraulic pressure between the capillaries and interstitial tissue.
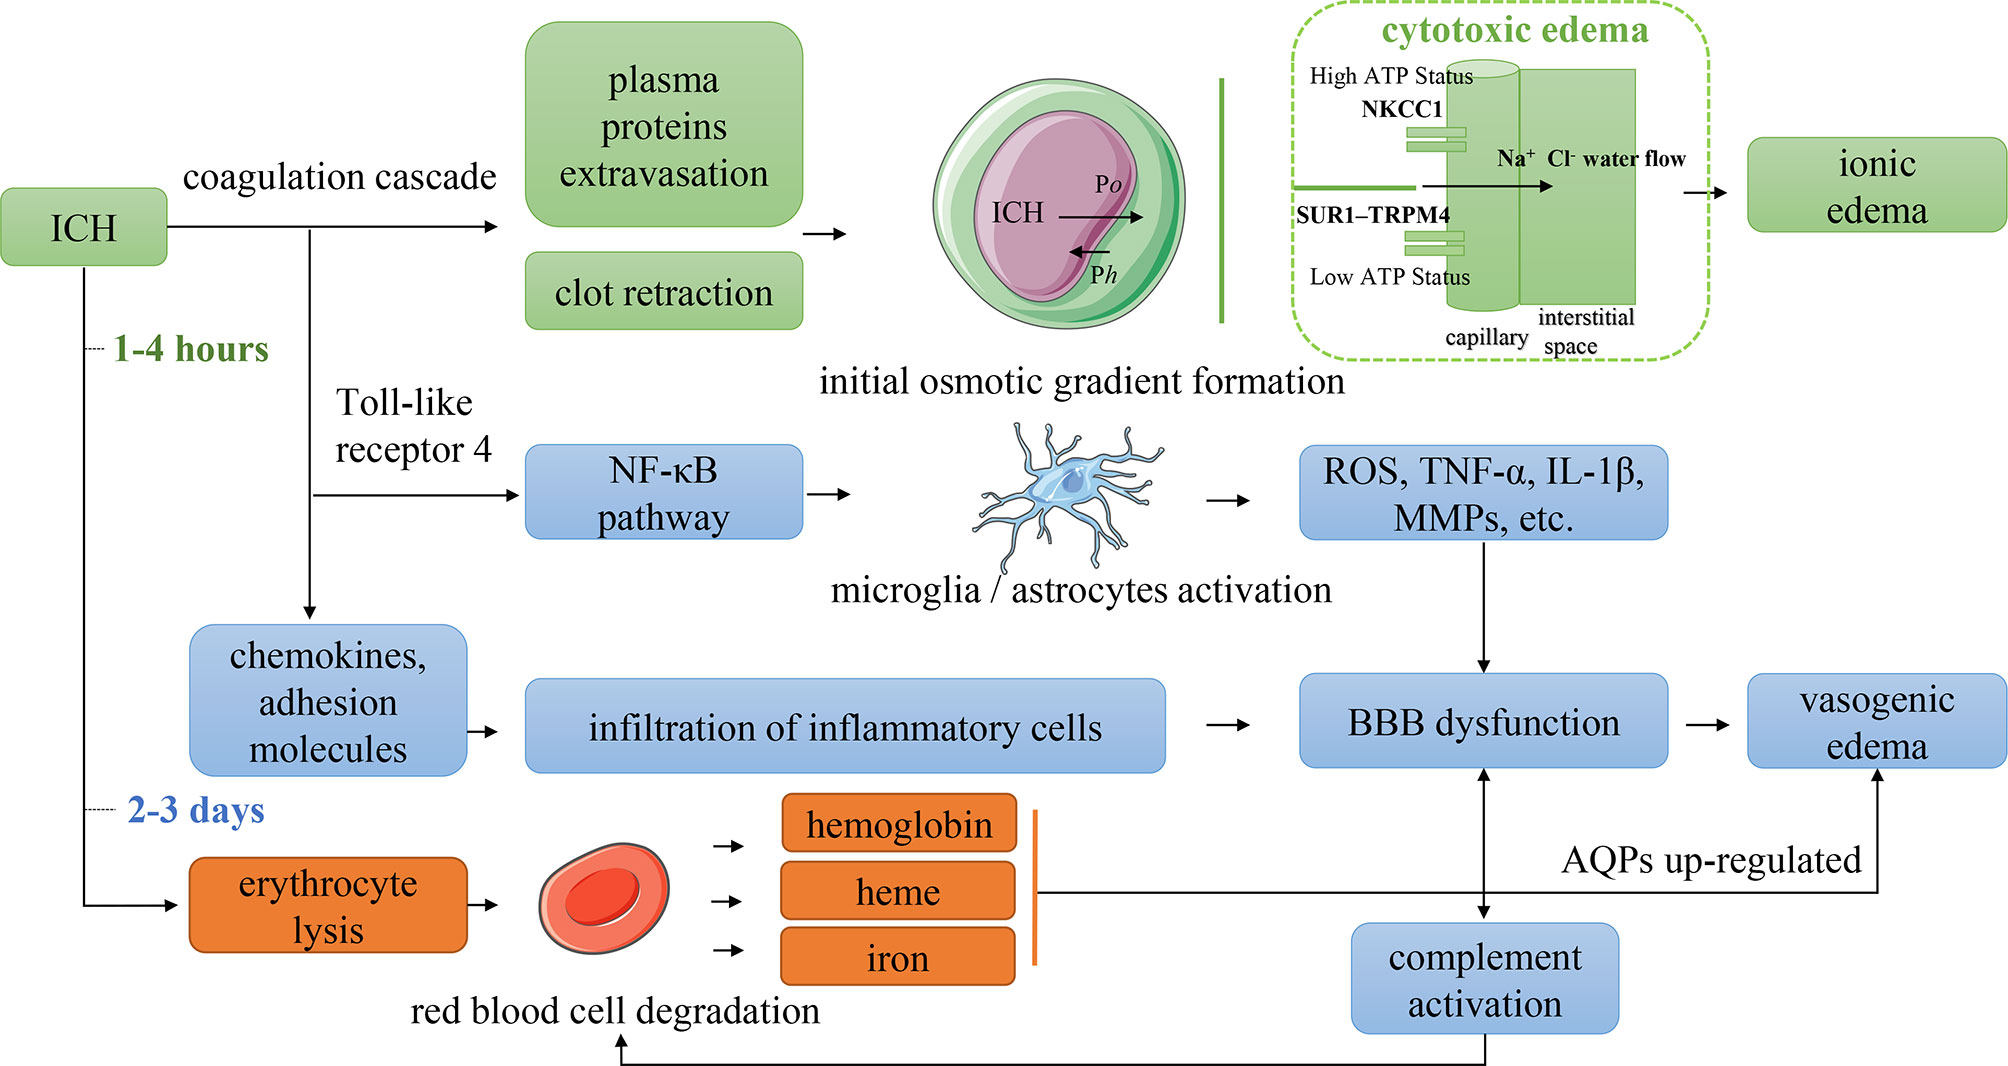
Figure 3 Mechanism of PHE formation. Po indicated the difference in oncotic pressure between the capillaries and interstitial tissue. Ph indicated the difference in hydraulic pressure between the capillaries and interstitial tissue. NKCC1, Na–K–Cl cotransporter 1; SUR1–TRPM4, sulfonylurea receptor 1–transient receptor potential cation channel subfamily M member 4; ROS, reactive oxygen species; TNF-α, tumor necrosis factor-α; IL-1β, interleukin 1β; MMPs, matrix metalloproteinases; BBB, blood–brain barrier; AQPs, aquaporins.
Both cytotoxic edema and vasogenic edema play particularly significant roles in PHE formation. Cytotoxic edema dominates the initial stage of PHE and is a premorbid precursor to extracellular ionic edema resulting from the dysfunction or abnormal activation of ion pumps in endothelial cells and astrocytes. Perihematomal glutamate deposition may contribute to cytotoxic edema (27). The extracellular concentration of glutamate in patients with stroke or traumatic brain injury can be 20 times higher than that in healthy individuals (28, 29). The opening of ion channels increases the movement of water from the extracellular to intracellular space, causing cell swelling and even cell death (30, 31). The essential mechanism of cytotoxic edema is the variation in the brain water distribution, which does not induce true tissue space swelling; however, the transendothelial osmotic gradients derived from cytotoxic edema provide the driving force for ionic edema. Astrocyte swelling is a typical manifestation of cytotoxic edema. When cytotoxic edema occurs, water gains access to the central nervous system through the AQP-4 expressed in astrocytic foot processes (32). Upregulated AQP-4 expression has been identified in patients with ischemic stroke and facilitates ionic edema formation (33). However, how AQP-4 affects ion transcellular transport remains unclear.
Vasogenic edema dominates the second stage of PHE formation, which is characterized by BBB dysfunction caused by a series of neuroinflammatory responses associated with the mechanical destruction of ICH, thrombin activation, and toxic effects of erythrocyte lysis (4–6). Vasogenic edema is a consequence of multifactorial actions. In the immune response associated with neuroinflammation, the disruption of tight junctions between vascular endothelial cells increases vascular permeability via inflammatory cell chemotaxis, cytokine and chemokine release, and upregulation of vascular endothelial growth factor (VEGF) and matrix metalloproteinase-9 (MMP-9) (4, 5, 26). The endothelial cell swelling and cell membrane breakdown caused by cytotoxic edema may also increase the permeability of the BBB (34). After BBB injury, both the filtration coefficients of oncotic conductivity and the hydraulic conductivity rise (26), the water and macromolecular substances can more easily pass through the cell membrane and enter the interstitial tissue of the brain, causing vasogenic edema. The intracranial pressure, blood pressure, and concentration of intravascular osmotically active molecules influence the relevant hydraulic pressure and oncotic pressure, thereby affecting the formation of PHE (26). BBB opening is associated with rapid activation of the complement cascade. Complement fragments (e.g., C3a, C5a, and others) amplify the inflammatory response in a positive feedback loop to disrupt the BBB (35), producing anaphylatoxins and membrane attack complexes that lyse erythrocytes and thus promote the formation of iron-induced PHE (36).
First Stage of PHE Formation
In the first few hours after ICH onset, during which the coagulation cascade is activated, the blood clot retraction, cell death, and brain atrophy induced by destruction of the hematoma produces a relatively large perihematomal space, leading to a reduction in the perihematomal hydrostatic pressure (37). The serum protein that is extruded secondary to the blood clot retraction leads to an increase in the interstitial oncotic pressure (38). Together, these changes induce the initial transport of water into the brain tissue, leading to edema. An important point to note is that the ionic edema driven by the cytotoxic edema dominates the first stage of PHE. The development of cytotoxic edema reportedly involves aberrant regulation of ion transport channels expressed on vascular endothelial cells (e.g., Na-K-Cl cotransporter 1 (NKCC1), which plays a role in the brain edema associated with ischemic stroke) and the sulfonylurea receptor 1–transient receptor potential cation channel subfamily M member 4 (SUR1-TRPM4) (39).
In the early stage of ICH, after transition from the closed to open state of the NKCC1 secondary to perihematomal glutamate deposition (28), Na+ is transported across the membrane to the interstitial tissue; this transport is driven by the transendothelial forces produced by the cytotoxic edema. Ionic edema forms as the Cl− and water follow the movement of Na+ to maintain electrical and osmotic neutrality (40). When adenosine triphosphate depletion occurs, the NKCC1 closes while the SUR1-TRPM4 opens, allowing the Na+ and water to be transferred to the interstitial tissue along their gradient, resulting in edema (39). Nevertheless, the associated molecular pathways of ionic edema remain poorly understood, and the involvement of cytotoxic edema in PHE is not well defined.
Second Stage of PHE Formation
Within 2 days after ICH onset, the vasogenic edema induced by the inflammatory immune response dominates the second stage of PHE (4–6). Numerous molecules are involved in this response, and four main pathways have been recognized. First, the thrombin and mechanical destruction of the hematoma activate Toll-like receptor 4 and the nuclear factor κB (NF-κB) pathway. NF-κB activates and regulates the transcription of cytokines, chemokines, and MMPs, leading to BBB dysfunction (41). The expression of Toll-like receptor 4 begins at 6 h after ICH onset and persists for almost 7 days, also triggering microglial activation (42, 43). Second, the activated thrombin induces the expression of chemokines and adhesion molecules, promoting the recruitment and infiltration of inflammatory cells (e.g., neutrophils, macrophages, and lymphocytes) to perihematomal sites (44). These recruited inflammatory cells release cytokines, reactive oxygen species, tumor necrosis factor-α, and MMPs, leading to BBB injury (45). Chemotaxis of neutrophils and polymorphonuclear leukocytes begins shortly after ICH onset and peaks at 3 days (46). Third, thrombin can further activate astrocytes and microglia via proteinase-activated receptor 4. The hyperactivation of microglia may exaggerate neuroinflammation through the secretion of reactive oxygen species, tumor necrosis factor-α, and cytokines (4, 5). Because microglial activation peaks at 3 days and significantly decreases 1 week after ICH (47), the SBI induced by these activated microglia is still maintained despite the fact that the leukocyte infiltration gradually resolves after 2 to 3 days (4). Notably, M2 microglia promote endogenous clearance of the hematoma following ICH (48). However, in the acute and subacute phases, the M2-dominant microglia quickly switch to M1-phenotype microglia (49); these M1 microglia excessively release destructive proinflammatory mediators and neurotoxic substances, leading to BBB dysfunction, PHE, and neurologic dysfunction (50). Thus, conversion of M1 to M2 microglia may be a potential treatment modality for ICH-induced SBI. Fourth, the activated complement cascade increases the production of anaphylatoxins and chemokines, resulting in increased permeability of the BBB (35).
Third Stage of PHE Formation
Although erythrocyte lysis is initiated within 24 h after ICH (4), erythrocyte lysis with resultant hemoglobin and iron-related toxicity still dominates the PHE process 3 days after ICH onset. Specifically, the erythrocytes are dissolved to hemoglobin by complement-produced membrane attack complexes, and the hemoglobin is then oxidized into methemoglobin, which rapidly liberates its heme. The heme is then degraded into free iron via heme oxygenase enzymes (36). An experimental rat model showed that iron deposition occurs within 24 h after ICH, peaks after 7 days, and is maintained at a high concentration for at least 2 weeks (51). The free iron also stimulates the production of reactive oxygen species and MMP-9, promoting an inflammatory reaction and BBB dysfunction (45). The deposition of hemosiderin upregulates AQP-4, which exacerbates the brain edema and peaks at 3 to 7 days (5, 52). The hemoglobin and heme can also directly activate Toll-like receptor 4, microglia, and the NF-κB pathway to further promote the inflammatory reaction (53, 54). Consequently, the third stage of PHE is also arguably a delayed stage of vasogenic edema induced by erythrocyte lysis.
Measurement of PHE
During head MRI, PHE appears as a hyperintense lesion with a clear boundary on T2-weighted imaging and fluid-attenuated inversion recovery. Although these two imaging techniques are the best choices for measuring the volume of PHE, the use of MRI may not be possible in emergency settings. Additionally, measuring PHE by CT examination is challenging because the PHE may be difficult to distinguish from periventricular leukoaraiosis over time. Manual segmentation of PHE is undoubtedly reliable but is not practical because it is a highly laborious process. Moreover, the consistency of manual segmentation may be lower than that of automatic segmentation. A CT value-based semiautomatic segmentation tool has been applied in numerous studies of PHE (10, 21, 55). The use of this segmentation tool requires researchers to manually delineate the region of interest, after which all voxels within the threshold range of edema (5–33 HU) are accumulated to obtain the PHE volume. Volbers et al. (56) verified that the performance of semiautomatic PHE segmentation is more consistent than that of manual PHE segmentation and shows less interference by periventricular leukoaraiosis. Urday et al. (57) found that the PHE volume obtained from both semiautomatic segmentation and manual segmentation was similar (R2 = 0.98, p < 0.0001). However, there are potential limitations regarding the accuracy of semiautomatic segmentation because there may be a certain degree of variability of neuroanatomic characteristics among individual patients. External validation of semiautomatic segmentation is required to verify its efficacy in real clinical settings, and this method still needs to be refined to reduce the processing time of generating segmentation. Deep learning methods based on convolutional neural networks have become another option for automatic PHE segmentation. Zhao et al. (58) developed a deep learning model based on an U-Net for PHE segmentation. However, the best dice value was only 0.71. These findings indicate that automatic PHE segmentation is considerably more difficult than hematoma segmentation because of the lower clarity of PHE on CT scans (58, 59), necessitating refinement of the performance of automatic PHE segmentation.
Various parameters reflecting the severity of PHE have been adopted by separate studies (9, 10, 60). An indicator of the absolute PHE volume or absolute change (or absolute growth rate) of the PHE volume is frequently used to assess PHE and its progression. However, it would be inappropriate to evaluate the true effect of PHE on patients’ prognosis by using these indicators because the absolute PHE volume is strongly dependent on the initial ICH volume (61, 62). The relative PHE volume is the ratio of the absolute PHE volume to the ICH volume, which enables researchers to better compare the severity of PHE in patients with different initial ICH volumes. However, when using the relative PHE volume or the relative change of the PHE volume to predict the prognosis in patients with ICH, mismatch between the predictive results and the actual outcome may be obtained when the initial hematoma is small (63). Furthermore, it would be inappropriate to evaluate the severity of edema in patients with a hematoma that has ruptured into the ventricles using the indicator of the relative PHE volume because erythrocyte lysis in the brain parenchyma is alleviated by the dilutional effects of the cerebrospinal fluid. The absolute or relative peak PHE volume has also been used as an indicator of PHE severity and was considered to be associated with the 3-month neurological outcome (20). However, it is difficult to obtain an accurate peak PHE volume in the clinical setting. No effective methods with which to predict the peak PHE growth rate and volume in individual patients have yet been established. The EED represents the average thickness in centimeters of the edema beyond the boundary of the hematoma (64). Wu et al. (10) found that an unexpected EED within 72 h of onset was associated with a 6-month mortality rate. The EED is calculated using the following formula: . However, the EED is calculated based on the assumption that both the hematoma and the total lesion (hematoma + PHE) are ellipsoid, introducing controversy into use of the EED to evaluate the PHE severity with irregularly shaped ICH (60).
Risk Factors for PHE
Imaging Features
Numerous studies have demonstrated that the initial hematoma volume determines PHE formation (9, 10, 12, 65), which shows good agreement with the aforementioned mechanism in which a greater ICH volume is associated with stronger thrombin cascades, erythrocytes lysis, and ICH-related toxicity. Several studies have revealed that a higher percentage of surgical hematoma removal results in slower PHE growth (24, 66). However, Sprügel et al. (20) indicated that the surface of the hematoma, not the initial hematoma volume, is the primary driver of PHE growth because a smaller hematoma has a larger relative surface area, contributing to a higher PHE volume per unit of the hematoma’s surface area. The evidence that irregular ICH and relatively minor ICH (<30 ml) generate a higher relative PHE volume was verified, supporting the surface-driven hypothesis. Notably, however, irregular and relatively minor ICH has a higher relative, not absolute, PHE volume. A recent study showed that certain CT imaging signs, such as the blend sign, black hole sign, and island sign, are capable of predicting hematoma expansion (67) and are associated with PHE growth in the acute phase of ICH (68). However, there is currently no evidence supporting an association between hematoma expansion and PHE formation. Rodriguez-Luna et al. (12) found that patients with spot signs on baseline CTA had a larger absolute PHE volume. Nevertheless, using the absolute PHE to predict hematoma expansion would be inappropriate because the PHE strongly depends on the initial hematoma volume. There is great controversy regarding the severity of PHE in different ICH locations. Sprügel et al. (20) found that lobar ICH had a larger initial PHE volume and higher early PHE growth rate. However, there was no significant difference in the peak PHE volume between deep and lobar ICH after adjusting for the hematoma volume (20). McCarron et al. (69) found that PHE was not affected by the location of ICH within 24 h after onset. In contrast, Grunwald et al. (11) found that the growth rate of lobar PHE within 24 h of ICH was significantly higher than that of deep ICH and was associated with the 90-day mortality rate. However, there was no significant difference in the growth rate of PHE within 72 h of onset between lobar and deep ICH. Cerebral amyloidosis was found to be a common cause of lobar ICH, which has localized anticoagulant and thrombolytic properties (70). However, we found no evidence indicating that lobar PHE is significantly smaller than deep PHE. We speculate that different shapes and growth patterns of PHE exist in different locations, and these differences are probably due to the different morphologies of the hematoma and the heterogeneity of the targeted population with diverse characteristics of ICH.
Baseline Characteristics
In addition to imaging features, the patient’s baseline neurological status (e.g., as measured by the National Institutes of Health Stroke Scale score, Glasgow Coma Scale score, and other indexes) is also significantly associated with PHE progression (10). Advanced age is an independent risk factor for PHE (10, 61). However, Peng et al. (21) indicated that younger patients are more likely to develop delayed PHE formation, which may be due to age-related differences in brain atrophy. Whether sex influences PHE continues to be debated. Wagner et al. (71) found that the PHE volume in women with supratentorial ICH is lower than that in men which may be associated with the higher levels of estrogen in women, enabling alleviation of iron-induced PHE. However, other studies have produced different or even contrary conclusions (16, 65). Because poorly controlled hypertension and unstable blood pressure at admission are assumed to be risk factors for hematoma expansion (72, 73), the role of blood pressure in PHE is also attracting interest. The Intensive Blood Pressure Reduction in Acute Cerebral Haemorrhage Trial (INTERACT) showed that a history of hypertension was positively correlated with the relative growth of PHE, whereas lower systolic blood pressure at admission was positively associated with the absolute growth of PHE (65). In the ICH Acutely Decreasing Arterial Pressure Trial (ICH ADAPT) performed by McCourt et al. (74), aggressive antihypertensive treatment (diastolic blood pressure of <150 mmHg) was found to affect neither the perihematomal cerebral blood flow nor PHE progression. A clinical trial of hypothermia administration for PHE revealed that a higher number of hypertension attacks at admission was associated with a larger initial PHE volume (61). Moreover, the Antihypertensive Treatment of Acute Cerebral Hemorrhage-2 (ATACH-2) trial also demonstrated that intensive antihypertensive therapy (target systolic blood pressure of 110–139 mmHg within 2 h) effectively reduced the relative expansion rate of PHE within 24 h after onset (62). In general, intensive antihypertensive therapy has been demonstrated to be safe in the treatment of PHE. However, whether the control of blood pressure mediates the PHE by modulating hematoma expansion is unclear. Previous studies have shown that a shorter interval between onset and the initial CT scan is associated with a higher risk of hematoma expansion and more rapid relative PHE growth (65, 75). However, Rodriguez-Luna et al. (12) indicated that the ICH onset time did not affect the relative PHE volume within 6 h of onset. Because obtaining a precise onset time is significant for determining the optimal treatment of ICH, whether the onset time affects the PHE needs to be further investigated. Additionally, the imaging features of ICH and PHE may help to predict the onset time.
Laboratory Testing
Several laboratory parameters that have been confirmed to affect hematoma expansion, such as hyperglycemia, a high MMP-9 level, and a high white blood cell count, may also be positively associated with PHE progression (10, 61, 76, 77). Gusdon et al. (78) found that the ratio of neutrophils to lymphocytes is effective in predicting PHE growth. Because MMP-3, MMP-9, VEGF, and angiopoietin-1 are all related to vascular function, they might be predictive of vasogenic edema (79). A high RBC count and high hematocrit at admission are associated with delayed peak PHE (16). This may be relevant because a high RBC count and high hematocrit are indicative of higher RBC degradation, which has been identified as an essential factor for promoting PHE. A high platelet count promotes increases in the VEGF level and capillary permeability, thereby exacerbating PHE (16). A prolonged partial thromboplastin time is significantly associated with PHE growth (16, 61, 80). This could be due to a consumptive coagulopathy resulting from significant release of coagulation factors after ICH, manifesting as platelet dysfunction and prolonging the partial thromboplastin time (80, 81). Some studies have shown that hyperglycemia is associated with earlier PHE progression (10, 82), which might be due to the fact that hyperglycemia promotes an oxidative stress response with consequent BBB dysfunction (83). However, hyperglycemia can merely be a stress response to ICH instead of a contributing factor for PHE. Feng et al. (84) found that hyperglycemia did not significantly affect PHE after adjusting for the initial ICH volume.
Others
Apolipoprotein E (ApoE) has been considered an independent risk factor for lobar ICH (85). Apo-E plays an essential role in maintaining normal lipid homeostasis in the central nervous system (86) and mitochondrial resistance to oxidative stress (87). James et al. (88) found that APOE-ϵ4 positivity was associated with a larger PHE volume. However, McCarron et al. (89) demonstrated that APOE-ϵ4 positivity was not associated with PHE after adjusting for race, age, and type of bleeding. These two studies reached different conclusions, which might be related to the selection of different time windows for PHE observation. Further studies are still needed to understand the role of ApoE in PHE progression.
Impact of PHE on ICH Prognosis
Whether PHE directly affects the prognosis of ICH remains controversial. From a pathogenesis perspective, PHE formation in the ultra-early stage of ICH might be clinically meaningful because the blood clot retraction and activated thrombin cascade are effective in promoting hemostasis (90). A recent magnetic resonance spectroscopy study of an experimental ICH model showed that the recovery of N-acetylaspartate, choline, and creatine was faster in the PHE area than in the non-PHE area, suggesting that the PHE may maintain the integrity of the perihematomal tissue and provide a protective buffer against irreversible impairment (91). Levine et al. (92) reported that a higher absolute PHE volume was associated with lower 90-day mortality. Similar results were obtained by two other studies using the indicator of the relative PHE volume to predict the functional status after ICH (90, 93). However, real-world cohort studies, such as the INTERACT-1/2 trials, have shown that absolute PHE growth is associated with poor outcomes of ICH (94). The absolute or relative PHE growth rate within 72 h of onset is considered an independent predictor of death and poor functional prognosis (modified Rankin scale score of ≥3) (9, 11, 65). Urday et al. (60) found that the PHE expansion rate within 24 h significantly affected mortality within 90 days of ICH onset even after adjusting for the initial hematoma volume. Wu et al. (10) found that patients with a larger initial EED were more likely to develop a significant midline shift and brain herniation, which were related to the 6-month mortality rate after ICH. However, not all studies have shown that PHE significantly affects the ICH prognosis after adjusting for the initial hematoma volume (61, 65). Appelboom et al. (95) found that the absolute PHE volume is correlated with the prognosis of patients with an ICH volume of <30 ml, whereas the relative PHE volume does not affect the modified Rankin scale score upon hospital discharge. The impact of PHE from different ICH locations on the prognosis remains controversial. The finding that lobar PHE was not associated with the 3-month modified Rankin scale score may have resulted from different morphological characteristics of hematomas among different ICH locations (11). The ATACH-2 trial showed that PHE of basal ganglia hemorrhage, but not thalamic hemorrhage, was associated with the 3-month prognosis. This result was most likely obtained because thalamic hemorrhage is more possible to develop intraventricular hemorrhage, which is a potential confounder (62). Peng et al. (21) reported that delayed PHE formation was an independent predictor of a poor prognosis at discharge. In their study, delayed PHE was defined as an absolute PHE volume that is 3 ml greater at 12 to 20 days than at 5 to 9 days. This is a particularly interesting finding because it seems revealed that a mild unsteady state of PHE on the delayed phase instead of acute phase significantly affects the prognosis. Notably, however, there is currently no consensus on the definition of delayed PHE, and whether delayed PHE affects the prognosis of ICH remains unclear.
Because the time of the follow-up CT scan differed among the population of various retrospective studies on PHE, and because heterogenous metrics reflecting the severity of PHE were adopted by separate studies, the ability of PHE to predict prognosis remains unclear. The results of PHE-based prognostic studies are summarized in Tables 1–4.
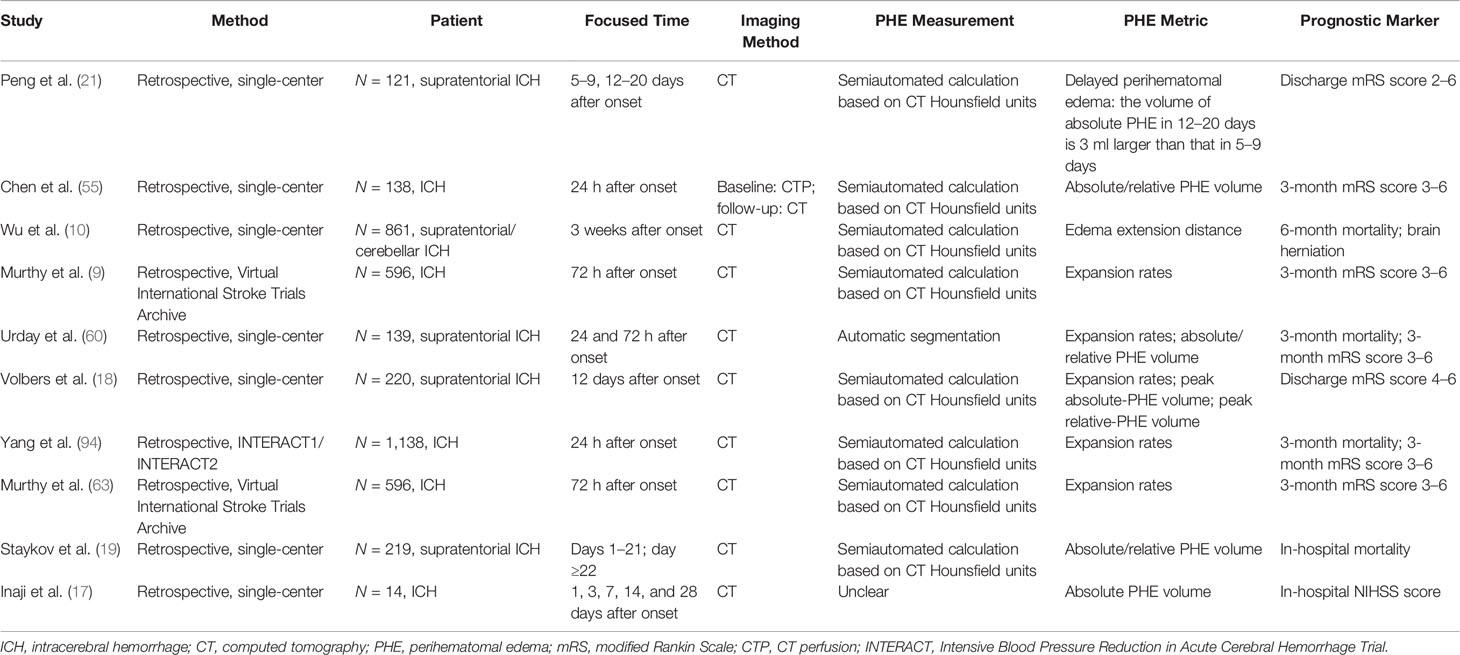
Table 1 Summary of prognostic research of PHE—the PHE was associated with poor ICH outcome.
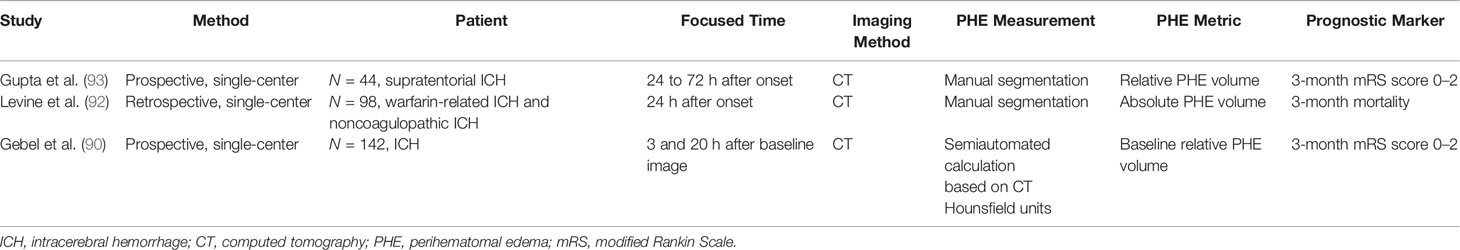
Table 2 Summary of prognostic research of PHE—the PHE was associated with improved ICH outcome.
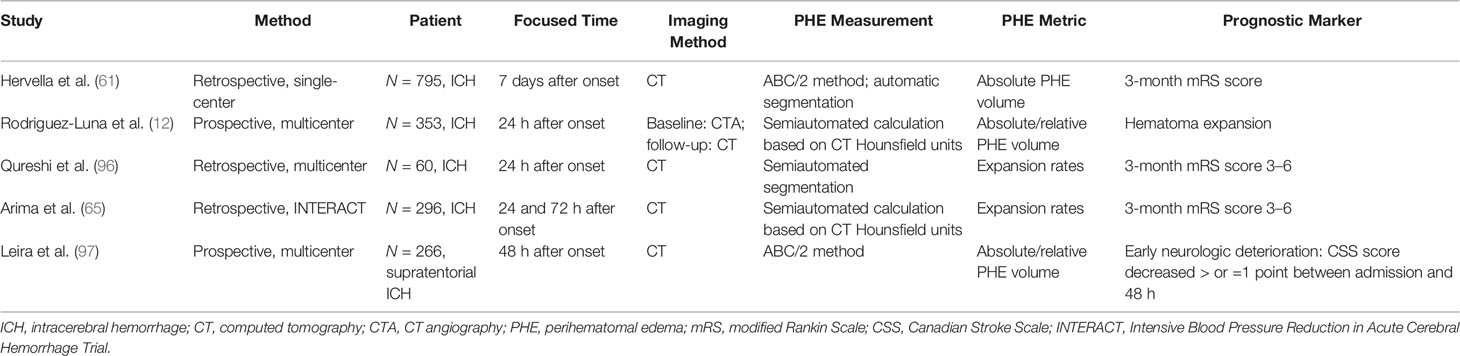
Table 3 Summary of prognostic research of PHE—the PHE was not associated with ICH outcome.
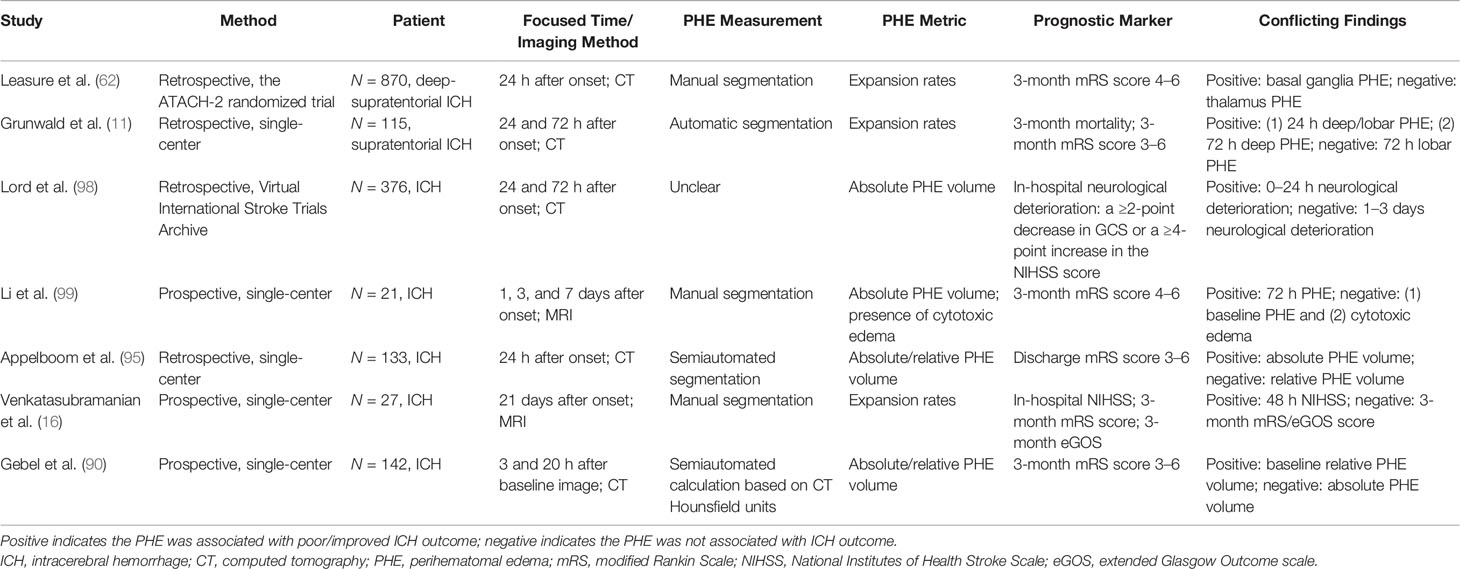
Table 4 Summary of prognostic research of PHE—the conflicting findings.
Potential Therapies for PHE
Targeted Strategies for Cytotoxic Edema
The formation of the perihematomal osmotic gradient, which is driven by cytotoxic edema, dominates PHE in the ultra-early phase of ICH (25, 38). Compared with mannitol, the currently available dehydrating drug that is commonly used to decrease the intracranial pressure, continuous infusion of hypertonic saline has been identified as a safe method for controlling PHE progression in the early phase of ICH, and it does not seem to affect the BBB (100, 101). Given the putative advantages of hypertonic saline in improving cerebral perfusion, Cook et al. (102) reported that hypertonic saline possesses a better capacity for controlling PHE and the corresponding intracranial hypertension than mannitol. However, in a recent multicenter randomized controlled trial, Roquilly et al. (103) found that continuous infusion of 20% hypertonic saline solution did not improve the neurological outcome 6 months after onset among patients with moderate to severe traumatic brain injury. As previously described, during the stage of cytotoxic edema, the SUR1-TRPM4 channel was confirmed to be upregulated, promoting ionic edema (5, 104). Jiang et al. (105) established a model of autologous blood-induced ICH and found that glibenclamide (a SUR1 inhibitor) effectively reduced the PHE volume, which was associated with cognitive deficit improvement. However, another study involving a model of collagenase-induced ICH showed that glibenclamide neither aggravated nor ameliorated the PHE volume or neurological dysfunction (106). Sheth et al. (107) conducted a double-blind, randomized controlled trial of patients with cerebral hemispheric infarcts and found that glibenclamide therapy significantly reduced the midline shift and MMP-9 level compared with the control group, revealing the potential role of glibenclamide in alleviating PHE after stroke. Additional clinical trials are needed to investigate preclinical strategies for cytotoxic edema.
Targeted Strategies for Vasogenic Edema
The thrombin cascades, inflammatory response, and BBB dysfunction have been confirmed to exert essential functions in PHE formation (4). Thus, treatments targeting critical molecules in the formation of vasogenic edema (such as VEGF, MMPs, and AQPs) may be promising (5, 108). In one study, the anti-inflammatory drug fingolimod alleviated the progression of PHE and improved the functional independence of patients with ICH at 90 days (109). However, patients with a sizeable initial hematoma (>30 ml) were not included. Given that PHE is strongly dependent on the primary hematoma, whether fingolimod can benefit critically ill patients with ICH remains to be explored. Statins are HMG-CoA reductase inhibitors that exert their neuroprotective effects by anti-inflammatory actions and facilitation of neo-angiogenesis (110). Statins have also been found to reduce the absolute or relative PHE volume (111), and most relevant studies have shown that statin use does not increase the risk of ICH recurrence (112). However, the effect of statins on the growth rate of PHE has not been demonstrated. Celecoxib is a selective cyclo-oxygenase 2 receptor inhibitor that attenuates the inflammatory reaction and edema by inhibiting the generation of prostaglandins (113). A multicenter randomized controlled trial confirmed the efficacy of using celecoxib to reduce the expansion rate of PHE (114). However, because the time to initial CT was longer in the celecoxib group than in the control group in that study, the primary outcome was defined as a ≥20% change in PHE from onset to an average of 1 week, which may be inappropriate because a longer time to initial CT may represent a steady state for PHE (10, 98). Antiadrenergic drugs such as β-blockers and α2-agonists have also been used to manage hypertension in patients with ICH. A retrospective analysis of a prospective cohort of patients with cerebral hemorrhage (CHANT trial) showed that the administration of antiadrenergic drugs effectively reduced PHE within 72 h after onset (115), suggesting that a reduction of central/peripheral sympathetic activity attenuates neuroinflammation and thereby alleviates the PHE. Notably, the reduction of PHE might not have been due to the antihypertensive actions of these antiadrenergic drugs because other kinds of blood pressure-lowering drugs did not result in the same degree of PHE reduction. The transcription factor peroxisome proliferator-activated receptor gamma (PPAR-γ) plays a significant role in modulating the biomarkers of oxidative stress and inflammation (116). One study showed that the PPAR-γ agonist rosiglitazone significantly reduced the expression of proinflammatory genes such as tumor necrosis factor-α, interleukin-β, and MMP-9 in a rat model of ICH and consequently attenuated the SBI (117). However, there is a scarcity of clinical trial data regarding the use of PPAR-γ agonists in patients with ICH. The iron chelator deferoxamine is a potential candidate for ICH treatment, and its effectiveness in alleviating PHE has been confirmed in experimental models of ICH (118, 119). A meta-analysis of the efficacy of deferoxamine in an experimental ICH model showed that deferoxamine reduced the brain water content by 85.7%, although the effect lasted for only 24 h after onset (120). However, it is discouraging to note that a double-blind, randomized controlled clinical trial showed no association between administration of deferoxamine mesylate and better neurological outcomes in patients with ICH (121). Indeed, because deferoxamine is characterized by a small effect size, it would be better to enroll a considerably high number of patients to verify the drug’s utility and validity when conducting studies targeting a small effect size. Li et al. recently performed an unbiased genome-wide transcript sequencing study for surgical removal of perihematomal brain tissue in patients with ICH and identified abundant expression of formyl peptide receptor 1 (FPR1), which promotes neuroinflammatory reactions. Under the screening of a computer-aided drug design system, the research group further selected an FPR1 inhibitor (T-0080) that can cross the BBB and successfully reduced the PHE by about 35% in experimental ICH models to improve the neurological status (122). This FPR1 inhibitor may be a promising candidate for ICH therapy. Antidiuretic hormone maintains the brain water content by regulating the permeability of capillaries. Conivaptan is an antidiuretic hormone receptor antagonist that was confirmed to reduce brain edema and repair the BBB function in an experimental ICH model (123). The effects of conivaptan on the treatment of PHE might be correlated with a reduction in the expression of AQP-4 (124). A recent phase I clinical trial verified the safety of conivaptan in the treatment of PHE (125). A phase II clinical trial of antidiuretic hormone receptor antagonists is urgently needed to further explore their efficacy on SBI in patients with ICH.
Comprehensive Treatments
The MISTIE II trial showed that minimally invasive surgery combined with tissue-type plasminogen activator effectively reduces the PHE volume (126). In the MISTIE III trial, the patients in the surgery group had improved neurological outcomes at 1 year when no more than 15 ml of hematoma remained at the end of the treatment (127). Similarly, a recent study showed that minimally invasive endoscopic surgery for ICH evacuation alleviated the postoperative PHE progression. A higher percentage of hematoma removal results in slower PHE growth (24). Although hematoma evacuation surgery has been shown to be a promising treatment for PHE, whether the patient’s prognosis can be significantly improved remains unclear. Fung et al. (23) reported that patients who underwent simple decompression surgery (without hematoma removal) developed more severe PHE than patients in the control group. However, there was no significant difference in the 90-day neurological function between the decompressive craniectomy group and the control group (23). Perhaps when the surgical indications for ICH become more detailed and standardized, the benefits of surgical interventions in reducing the complications of SBI (e.g., PHE) will gradually emerge.
Supportive treatments, including hypothermia therapy (61, 128), intensive antihypertensive therapy (62), and hyperbaric oxygen therapy (129), have also been reported to reduce PHE growth. However, the number of existing clinical studies is small, and inevitable bias and confounding factors have limited these studies. A large‐scale prospective follow‐up study for validation is warranted.
Conclusion
Because of the lack of significant progress in treating hematomas in patients with ICH, damage secondary to ICH (especially PHE) has recently become a promising therapeutic target. This article has reviewed the mechanisms and growth patterns of PHE after ICH and has introduced potential treatments. However, previous studies have various limitations. For example, the sample sizes, especially in studies involving brain MRI, are limited; no standard indicator of PHE severity has been established; and prospective primary data are entirely lacking. Randomized controlled trials of PHE are urgently needed. Furthermore, researchers are expected to employ more effective measuring technologies to analyze high-quality imaging data, effectively explore the laws involved in PHE growth, and develop new therapeutic options for patients with ICH.
Author Contributions
All authors listed have made a substantial, direct, and intellectual contribution to the work and approved it for publication. All authors contributed to the article and approved the submitted version.
Funding
This work was supported by the National Natural Science Foundation of China (82001389), Chinese Academy of Medical Sciences (CAMS) Innovation Fund for Medical Science (2020-I2M-C&T-B-031), CAMS/PUMC Postgraduate Teaching Innovation Fund (No. 10023201900107), National Key R&D Program of China (2018YFA0108600), and Huazhong University of Science and Technology Union Shenzhen Hospital Fund (NS202001).
Conflict of Interest
The authors declare that the research was conducted in the absence of any commercial or financial relationships that could be construed as a potential conflict of interest.
Publisher’s Note
All claims expressed in this article are solely those of the authors and do not necessarily represent those of their affiliated organizations, or those of the publisher, the editors and the reviewers. Any product that may be evaluated in this article, or claim that may be made by its manufacturer, is not guaranteed or endorsed by the publisher.
Abbreviations
ApoE, apolipoprotein E; AQPs, aquaporin; ATACH, antihypertensive treatment of acute cerebral hemorrhage; ATP, adenosine triphosphate; BBB, blood–brain barrier; CT, computed tomography; CTA, CT angiography; DC, decompressive craniectomy; EED, edema extension distance; FPR1, formyl peptide receptor 1; ICH ADAPT, ICH Acutely Decreasing Arterial Pressure Trial; ICH, intracerebral hemorrhage; INTERACT, Intensive Blood Pressure Reduction in Acute Cerebral Haemorrhage Trial; MISTIE, minimally invasive surgery and rt-PA in ICH evacuation; MRI, magnetic resonance imaging; MMP, matrix metalloproteinases; NKCC1, Na–K–Cl cotransporter 1; NF-κB, nuclear factor κB; PHE, perihematomal edema; PT, partial thromboplastin; PPAR-γ, peroxisome proliferator activated receptor gamma; RBC, red blood cell; STICH, Surgical Trial in Intracerebral Hemorrhage; SUR, sulfonylurea receptor; SUR1–TRPM4, sulfonylurea receptor 1–transient receptor potential cation channel subfamily M member 4; TPA, tissue-type plasminogen activator; VEGF, vascular endothelial growth factor.
References
1. Wang Y, Li Z, Zhao X, Wang D, Li H, Xian Y, et al. Stroke Care Quality in China: Substantial Improvement, and a Huge Challenge and Opportunity. Int J Stroke (2017) 12(3):229–35. doi: 10.1177/1747493017694392
2. Benjamin EJ, Muntner P, Alonso A, Bittencourt MS, Callaway CW, Carson AP, et al. Heart Disease and Stroke Statistics-2019 Update: A Report From the American Heart Association. Circulation (2019) 139(10):e56–528. doi: 10.1161/CIR.0000000000000659
3. van Asch CJ, Luitse MJ, Rinkel GJ, van der Tweel I, Algra A, Klijn CJ. Incidence, Case Fatality, and Functional Outcome of Intracerebral Haemorrhage Over Time, According to Age, Sex, and Ethnic Origin: A Systematic Review and Meta-Analysis. Lancet Neurol (2010) 9(2):167–76. doi: 10.1016/S1474-4422(09)70340-0
4. Ziai WC. Hematology and Inflammatory Signaling of Intracerebral Hemorrhage. Stroke (2013) 44(6 Suppl 1):S74–8. doi: 10.1161/STROKEAHA.111.000662
5. Urday S, Kimberly WT, Beslow LA, Vortmeyer AO, Selim MH, Rosand J, et al. Targeting Secondary Injury in Intracerebral Haemorrhage–Perihaematomal Oedema. Nat Rev Neurol (2015) 11(2):111–22. doi: 10.1038/nrneurol.2014.264
6. Wu H, Zhang Z, Li Y, Zhao R, Li H, Song Y, et al. Time Course of Upregulation of Inflammatory Mediators in the Hemorrhagic Brain in Rats: Correlation With Brain Edema. Neurochem Int (2010) 57(3):248–53. doi: 10.1016/j.neuint.2010.06.002
7. Mendelow AD, Gregson BA, Rowan EN, Murray GD, Gholkar A, Mitchell PM. Early Surgery Versus Initial Conservative Treatment in Patients With Spontaneous Supratentorial Lobar Intracerebral Haematomas (STICH II): A Randomised Trial. Lancet (2013) 382(9890):397–408. doi: 10.1016/S0140-6736(13)60986-1
8. Mendelow AD, Gregson BA, Fernandes HM, Murray GD, Teasdale GM, Hope DT, et al. Early Surgery Versus Initial Conservative Treatment in Patients With Spontaneous Supratentorial Intracerebral Haematomas in the International Surgical Trial in Intracerebral Haemorrhage (STICH): A Randomised Trial. Lancet (2005) 365(9457):387–97. doi: 10.1016/S0140-6736(05)17826-X
9. Murthy SB, Urday S, Beslow LA, Dawson J, Lees K, Kimberly WT, et al. Rate of Perihaematomal Oedema Expansion Is Associated With Poor Clinical Outcomes in Intracerebral Haemorrhage. J Neurol Neurosurg Psychiatry (2016) 87(11):1169–73. doi: 10.1136/jnnp-2016-313653
10. Wu TY, Sharma G, Strbian D, Putaala J, Desmond PM, Tatlisumak T, et al. Natural History of Perihematomal Edema and Impact on Outcome After Intracerebral Hemorrhage. Stroke (2017) 48(4):873–9. doi: 10.1161/STROKEAHA.116.014416
11. Grunwald Z, Beslow LA, Urday S, Vashkevich A, Ayres A, Greenberg SM, et al. Perihematomal Edema Expansion Rates and Patient Outcomes in Deep and Lobar Intracerebral Hemorrhage. Neurocrit Care (2017) 26(2):205–12. doi: 10.1007/s12028-016-0321-3
12. Rodriguez-Luna D, Stewart T, Dowlatshahi D, Kosior JC, Aviv RI, Molina CA, et al. Perihematomal Edema Is Greater in the Presence of a Spot Sign But Does Not Predict Intracerebral Hematoma Expansion. Stroke (2016) 47(2):350–5. doi: 10.1161/STROKEAHA.115.011295
13. Enzmann DR, Britt RH, Lyons BE, Buxton JL, Wilson DA. Natural History of Experimental Intracerebral Hemorrhage: Sonography, Computed Tomography and Neuropathology. AJNR Am J Neuroradiol (1981) 2(6):517–26. doi: 10.1055/s-2007-1020978
14. Sun Z, Zhao Z, Zhao S, Sheng Y, Zhao Z, Gao C, et al. Recombinant Hirudin Treatment Modulates Aquaporin-4 and Aquaporin-9 Expression After Intracerebral Hemorrhage In Vivo. Mol Biol Rep (2009) 36(5):1119–27. doi: 10.1007/s11033-008-9287-3
15. Okauchi M, Hua Y, Keep RF, Morgenstern LB, Xi G. Effects of Deferoxamine on Intracerebral Hemorrhage-Induced Brain Injury in Aged Rats. Stroke (2009) 40(5):1858–63. doi: 10.1161/STROKEAHA.108.535765
16. Venkatasubramanian C, Mlynash M, Finley-Caulfield A, Eyngorn I, Kalimuthu R, Snider RW, et al. Natural History of Perihematomal Edema After Intracerebral Hemorrhage Measured by Serial Magnetic Resonance Imaging. Stroke (2011) 42(1):73–80. doi: 10.1161/STROKEAHA.110.590646
17. Inaji M, Tomita H, Tone O, Tamaki M, Suzuki R, Ohno K. Chronological Changes of Perihematomal Edema of Human Intracerebral Hematoma. Acta Neurochir Suppl (2003) 86:445–8. doi: 10.1007/978-3-7091-0651-8_91
18. Volbers B, Willfarth W, Kuramatsu JB, Struffert T, Dorfler A, Huttner HB, et al. Impact of Perihemorrhagic Edema on Short-Term Outcome After Intracerebral Hemorrhage. Neurocrit Care (2016) 24(3):404–12. doi: 10.1007/s12028-015-0185-y
19. Staykov D, Wagner I, Volbers B, Hauer EM, Doerfler A, Schwab S, et al. Natural Course of Perihemorrhagic Edema After Intracerebral Hemorrhage. Stroke (2011) 42(9):2625–9. doi: 10.1161/STROKEAHA.111.618611
20. Sprugel MI, Kuramatsu JB, Volbers B, Gerner ST, Sembill JA, Madzar D, et al. Perihemorrhagic Edema: Revisiting Hematoma Volume, Location, and Surface. Neurology (2019) 93(12):e1159–70. doi: 10.1212/WNL.0000000000008129
21. Peng WJ, Li Q, Tang JH, Reis C, Araujo C, Feng R, et al. The Risk Factors and Prognosis of Delayed Perihematomal Edema in Patients With Spontaneous Intracerebral Hemorrhage. CNS Neurosci Ther (2019) 25(10):1189–94. doi: 10.1111/cns.13219
22. Suga S, Sato S, Yunoki K, Mihara B. Sequential Change of Brain Edema by Semiquantitative Measurement on MRI in Patients With Hypertensive Intracerebral Hemorrhage. Acta Neurochir Suppl (Wien) (1994) 60:564–7. doi: 10.1007/978-3-7091-9334-1_156
23. Fung C, Murek M, Klinger-Gratz PP, Fiechter M, Z’Graggen WJ, Gautschi OP, et al. Effect of Decompressive Craniectomy on Perihematomal Edema in Patients With Intracerebral Hemorrhage. PloS One (2016) 11(2):e149169. doi: 10.1371/journal.pone.0149169
24. Horowitz ME, Ali M, Chartrain AG, Allen OS, Scaggiante J, Glassberg B, et al. Definition and Time Course of Pericavity Edema After Minimally Invasive Endoscopic Intracerebral Hemorrhage Evacuation. J Neurointerv Surg (2021). doi: 10.1136/neurintsurg-2020-017077
25. Majidi S, Rahim B, Gilani SI, Gilani WI, Adil MM, Qureshi AI. CT Evolution of Hematoma and Surrounding Hypodensity in a Cadaveric Model of Intracerebral Hemorrhage. J Neuroimaging (2016) 26(3):346–50. doi: 10.1111/jon.12306
26. Simard JM, Kent TA, Chen M, Tarasov KV, Gerzanich V. Brain Oedema in Focal Ischaemia: Molecular Pathophysiology and Theoretical Implications. Lancet Neurol (2007) 6(3):258–68. doi: 10.1016/S1474-4422(07)70055-8
27. Brunswick AS, Hwang BY, Appelboom G, Hwang RY, Piazza MA, Connolly EJ. Serum Biomarkers of Spontaneous Intracerebral Hemorrhage Induced Secondary Brain Injury. J Neurol Sci (2012) 321(1-2):1–10. doi: 10.1016/j.jns.2012.06.008
28. Wahl F, Obrenovitch TP, Hardy AM, Plotkine M, Boulu R, Symon L. Extracellular Glutamate During Focal Cerebral Ischaemia in Rats: Time Course and Calcium Dependency. J Neurochem (1994) 63(3):1003–11. doi: 10.1046/j.1471-4159.1994.63031003.x
29. Obrenovitch TP, Urenjak J. Is High Extracellular Glutamate the Key to Excitotoxicity in Traumatic Brain Injury? J Neurotrauma (1997) 14(10):677–98. doi: 10.1089/neu.1997.14.677
30. Winkler EA, Minter D, Yue JK, Manley GT. Cerebral Edema in Traumatic Brain Injury: Pathophysiology and Prospective Therapeutic Targets. Neurosurg Clin N Am (2016) 27(4):473–88. doi: 10.1016/j.nec.2016.05.008
31. Hudak AM, Peng L, Marquez DLPC, Thottakara J, Moore C, Harper C, et al. Cytotoxic and Vasogenic Cerebral Oedema in Traumatic Brain Injury: Assessment With FLAIR and DWI Imaging. Brain Inj (2014) 28(12):1602–9. doi: 10.3109/02699052.2014.936039
32. Higashida T, Kreipke CW, Rafols JA, Peng C, Schafer S, Schafer P, et al. The Role of Hypoxia-Inducible Factor-1alpha, Aquaporin-4, and Matrix Metalloproteinase-9 in Blood-Brain Barrier Disruption and Brain Edema After Traumatic Brain Injury. J Neurosurg (2011) 114(1):92–101. doi: 10.3171/2010.6.JNS10207
33. Stokum JA, Mehta RI, Ivanova S, Yu E, Gerzanich V, Simard JM. Heterogeneity of Aquaporin-4 Localization and Expression After Focal Cerebral Ischemia Underlies Differences in White Versus Grey Matter Swelling. Acta Neuropathol Commun (2015) 3:61. doi: 10.1186/s40478-015-0239-6
34. Jha RM, Kochanek PM, Simard JM. Pathophysiology and Treatment of Cerebral Edema in Traumatic Brain Injury. Neuropharmacology (2019) 145(Pt B):230–46. doi: 10.1016/j.neuropharm.2018.08.004
35. Ducruet AF, Zacharia BE, Hickman ZL, Grobelny BT, Yeh ML, Sosunov SA, et al. The Complement Cascade as a Therapeutic Target in Intracerebral Hemorrhage. Exp Neurol (2009) 219(2):398–403. doi: 10.1016/j.expneurol.2009.07.018
36. Bodmer D, Vaughan KA, Zacharia BE, Hickman ZL, Connolly ES. The Molecular Mechanisms That Promote Edema After Intracerebral Hemorrhage. Transl Stroke Res (2012) 3(Suppl 1):52–61. doi: 10.1007/s12975-012-0162-0
37. Wagner KR, Xi G, Hua Y, Kleinholz M, de Courten-Myers GM, Myers RE, et al. Lobar Intracerebral Hemorrhage Model in Pigs: Rapid Edema Development in Perihematomal White Matter. Stroke (1996) 27(3):490–7. doi: 10.1161/01.str.27.3.490
38. Xi G, Keep RF, Hoff JT. Pathophysiology of Brain Edema Formation. Neurosurg Clin N Am (2002) 13(3):371–83. doi: 10.1016/s1042-3680(02)00007-4
39. Simard JM, Kahle KT, Gerzanich V. Molecular Mechanisms of Microvascular Failure in Central Nervous System Injury–Synergistic Roles of NKCC1 and SUR1/TRPM4. J Neurosurg (2010) 113(3):622–9. doi: 10.3171/2009.11.JNS081052
40. Yan Y, Dempsey RJ, Flemmer A, Forbush B, Sun D. Inhibition of Na(+)-K(+)-Cl(-) Cotransporter During Focal Cerebral Ischemia Decreases Edema and Neuronal Damage. Brain Res (2003) 961(1):22–31. doi: 10.1016/s0006-8993(02)03832-5
41. Aronowski J, Zhao X. Molecular Pathophysiology of Cerebral Hemorrhage: Secondary Brain Injury. Stroke (2011) 42(6):1781–6. doi: 10.1161/STROKEAHA.110.596718
42. Yang Z, Liu B, Zhong L, Shen H, Lin C, Lin L, et al. Toll-Like Receptor-4-Mediated Autophagy Contributes to Microglial Activation and Inflammatory Injury in Mouse Models of Intracerebral Haemorrhage. Neuropathol Appl Neurobiol (2015) 41(4):e95–106. doi: 10.1111/nan.12177
43. Teng W, Wang L, Xue W, Guan C. Activation of TLR4-Mediated NFkappaB Signaling in Hemorrhagic Brain in Rats. Mediators Inflamm (2009) 2009:473276. doi: 10.1155/2009/473276
44. Wang J. Preclinical and Clinical Research on Inflammation After Intracerebral Hemorrhage. Prog Neurobiol (2010) 92(4):463–77. doi: 10.1016/j.pneurobio.2010.08.001
45. Keep RF, Hua Y, Xi G. Intracerebral Haemorrhage: Mechanisms of Injury and Therapeutic Targets. Lancet Neurol (2012) 11(8):720–31. doi: 10.1016/S1474-4422(12)70104-7
46. Nguyen HX, O’Barr TJ, Anderson AJ. Polymorphonuclear Leukocytes Promote Neurotoxicity Through Release of Matrix Metalloproteinases, Reactive Oxygen Species, and TNF-Alpha. J Neurochem (2007) 102(3):900–12. doi: 10.1111/j.1471-4159.2007.04643.x
47. Wang J, Dore S. Inflammation After Intracerebral Hemorrhage. J Cereb Blood Flow Metab (2007) 27(5):894–908. doi: 10.1038/sj.jcbfm.9600403
48. Chang CF, Massey J, Osherov A, Angenendt DCL, Sansing LH. Bexarotene Enhances Macrophage Erythrophagocytosis and Hematoma Clearance in Experimental Intracerebral Hemorrhage. Stroke (2020) 51(2):612–8. doi: 10.1161/STROKEAHA.119.027037
49. Hu X, Leak RK, Shi Y, Suenaga J, Gao Y, Zheng P, et al. Microglial and Macrophage Polarization-New Prospects for Brain Repair. Nat Rev Neurol (2015) 11(1):56–64. doi: 10.1038/nrneurol.2014.207
50. Bai Q, Xue M, Yong VW. Microglia and Macrophage Phenotypes in Intracerebral Haemorrhage Injury: Therapeutic Opportunities. Brain (2020) 143(5):1297–314. doi: 10.1093/brain/awz393
51. Qing WG, Dong YQ, Ping TQ, Lai LG, Fang LD, Min HW, et al. Brain Edema After Intracerebral Hemorrhage in Rats: The Role of Iron Overload and Aquaporin 4. J Neurosurg (2009) 110(3):462–8. doi: 10.3171/2008.4.JNS17512
52. Xu J, Qiu GP, Huang J, Zhang B, Sun SQ, Gan SW, et al. Internalization of Aquaporin-4 After Collagenase-Induced Intracerebral Hemorrhage. Anat Rec (Hoboken) (2015) 298(3):554–61. doi: 10.1002/ar.23055
53. Lin S, Yin Q, Zhong Q, Lv FL, Zhou Y, Li JQ, et al. Heme Activates TLR4-Mediated Inflammatory Injury via MyD88/TRIF Signaling Pathway in Intracerebral Hemorrhage. J Neuroinflamm (2012) 9:46. doi: 10.1186/1742-2094-9-46
54. Wang YC, Zhou Y, Fang H, Lin S, Wang PF, Xiong RP, et al. Toll-Like Receptor 2/4 Heterodimer Mediates Inflammatory Injury in Intracerebral Hemorrhage. Ann Neurol (2014) 75(6):876–89. doi: 10.1002/ana.24159
55. Chen L, Xu M, Yan S, Luo Z, Tong L, Lou M. Insufficient Cerebral Venous Drainage Predicts Early Edema in Acute Intracerebral Hemorrhage. Neurology (2019) 93(15):e1463–73. doi: 10.1212/WNL.0000000000008242
56. Volbers B, Staykov D, Wagner I, Dorfler A, Saake M, Schwab S, et al. Semi-Automatic Volumetric Assessment of Perihemorrhagic Edema With Computed Tomography. Eur J Neurol (2011) 18(11):1323–8. doi: 10.1111/j.1468-1331.2011.03395.x
57. Urday S, Beslow LA, Goldstein DW, Vashkevich A, Ayres AM, Battey TW, et al. Measurement of Perihematomal Edema in Intracerebral Hemorrhage. Stroke (2015) 46(4):1116–9. doi: 10.1161/STROKEAHA.114.007565
58. Zhao X, Chen K, Wu G, Zhang G, Zhou X, Lv C, et al. Deep Learning Shows Good Reliability for Automatic Segmentation and Volume Measurement of Brain Hemorrhage, Intraventricular Extension, and Peripheral Edema. Eur Radiol (2021) 31(7):5012–20. doi: 10.1007/s00330-020-07558-2
59. Dhar R, Falcone GJ, Chen Y, Hamzehloo A, Kirsch EP, Noche RB, et al. Deep Learning for Automated Measurement of Hemorrhage and Perihematomal Edema in Supratentorial Intracerebral Hemorrhage. Stroke (2020) 51(2):648–51. doi: 10.1161/STROKEAHA.119.027657
60. Urday S, Beslow LA, Dai F, Zhang F, Battey TW, Vashkevich A, et al. Rate of Perihematomal Edema Expansion Predicts Outcome After Intracerebral Hemorrhage. Crit Care Med (2016) 44(4):790–7. doi: 10.1097/CCM.0000000000001553
61. Hervella P, Rodriguez-Yanez M, Pumar JM, Avila-Gomez P, Da SA, Lopez-Loureiro I, et al. Antihyperthermic Treatment Decreases Perihematomal Hypodensity. Neurology (2020) 94(16):e1738–48. doi: 10.1212/WNL.0000000000009288
62. Leasure AC, Qureshi AI, Murthy SB, Kamel H, Goldstein JN, Walsh KB, et al. Intensive Blood Pressure Reduction and Perihematomal Edema Expansion in Deep Intracerebral Hemorrhage. Stroke (2019) 50(8):2016–22. doi: 10.1161/STROKEAHA.119.024838
63. Murthy SB, Moradiya Y, Dawson J, Lees KR, Hanley DF, Ziai WC. Perihematomal Edema and Functional Outcomes in Intracerebral Hemorrhage: Influence of Hematoma Volume and Location. Stroke (2015) 46(11):3088–92. doi: 10.1161/STROKEAHA.115.010054
64. Parry-Jones AR, Wang X, Sato S, Mould WA, Vail A, Anderson CS, et al. Edema Extension Distance: Outcome Measure for Phase II Clinical Trials Targeting Edema After Intracerebral Hemorrhage. Stroke (2015) 46(6):e137–40. doi: 10.1161/STROKEAHA.115.008818
65. Arima H, Wang JG, Huang Y, Heeley E, Skulina C, Parsons MW, et al. Significance of Perihematomal Edema in Acute Intracerebral Hemorrhage: The INTERACT Trial. Neurology (2009) 73(23):1963–8. doi: 10.1212/WNL.0b013e3181c55ed3
66. Hanley DF, Thompson RE, Muschelli J, Rosenblum M, McBee N, Lane K, et al. Safety and Efficacy of Minimally Invasive Surgery Plus Alteplase in Intracerebral Haemorrhage Evacuation (MISTIE): A Randomised, Controlled, Open-Label, Phase 2 Trial. Lancet Neurol (2016) 15(12):1228–37. doi: 10.1016/S1474-4422(16)30234-4
67. Morotti A, Dowlatshahi D, Boulouis G, Al-Ajlan F, Demchuk AM, Aviv RI, et al. Predicting Intracerebral Hemorrhage Expansion With Noncontrast Computed Tomography: The BAT Score. Stroke (2018) 49(5):1163–9. doi: 10.1161/STROKEAHA.117.020138
68. Li YL, Lv XN, Wei X, Yang WS, Li R, Deng L, et al. Relationship Between Non-Contrast Computed Tomography Imaging Markers and Perihemorrhagic Edema Growth in Intracerebral Hemorrhage. Neurocrit Care (2021). doi: 10.1007/s12028-021-01188-2
69. McCarron MO, McCarron P, Alberts MJ. Location Characteristics of Early Perihaematomal Oedema. J Neurol Neurosurg Psychiatry (2006) 77(3):378–80. doi: 10.1136/jnnp.2005.070714
70. McCarron MO, Nicoll JA. Cerebral Amyloid Angiopathy and Thrombolysis-Related Intracerebral Haemorrhage. Lancet Neurol (2004) 3(8):484–92. doi: 10.1016/S1474-4422(04)00825-7
71. Wagner I, Volbers B, Kloska S, Doerfler A, Schwab S, Staykov D. Sex Differences in Perihemorrhagic Edema Evolution After Spontaneous Intracerebral Hemorrhage. Eur J Neurol (2012) 19(11):1477–81. doi: 10.1111/j.1468-1331.2011.03628.x
72. Gerner ST, Kuramatsu JB, Sembill JA, Sprugel MI, Endres M, Haeusler KG, et al. Association of Prothrombin Complex Concentrate Administration and Hematoma Enlargement in Non-Vitamin K Antagonist Oral Anticoagulant-Related Intracerebral Hemorrhage. Ann Neurol (2018) 83(1):186–96. doi: 10.1002/ana.25134
73. Chung PW, Kim JT, Sanossian N, Starkmann S, Hamilton S, Gornbein J, et al. Association Between Hyperacute Stage Blood Pressure Variability and Outcome in Patients With Spontaneous Intracerebral Hemorrhage. Stroke (2018) 49(2):348–54. doi: 10.1161/STROKEAHA.117.017701
74. McCourt R, Gould B, Gioia L, Kate M, Coutts SB, Dowlatshahi D, et al. Cerebral Perfusion and Blood Pressure do Not Affect Perihematoma Edema Growth in Acute Intracerebral Hemorrhage. Stroke (2014) 45(5):1292–8. doi: 10.1161/STROKEAHA.113.003194
75. Li Q, Liu QJ, Yang WS, Wang XC, Zhao LB, Xiong X, et al. Island Sign: An Imaging Predictor for Early Hematoma Expansion and Poor Outcome in Patients With Intracerebral Hemorrhage. Stroke (2017) 48(11):3019–25. doi: 10.1161/STROKEAHA.117.017985
76. Abilleira S, Montaner J, Molina CA, Monasterio J, Castillo J, Alvarez-Sabin J. Matrix Metalloproteinase-9 Concentration After Spontaneous Intracerebral Hemorrhage. J Neurosurg (2003) 99(1):65–70. doi: 10.3171/jns.2003.99.1.0065
77. Liu J, Gao BB, Clermont AC, Blair P, Chilcote TJ, Sinha S, et al. Hyperglycemia-Induced Cerebral Hematoma Expansion Is Mediated by Plasma Kallikrein. Nat Med (2011) 17(2):206–10. doi: 10.1038/nm.2295
78. Gusdon AM, Gialdini G, Kone G, Baradaran H, Merkler AE, Mangat HS, et al. Neutrophil-Lymphocyte Ratio and Perihematomal Edema Growth in Intracerebral Hemorrhage. Stroke (2017) 48(9):2589–92. doi: 10.1161/STROKEAHA.117.018120
79. Li N, Liu YF, Ma L, Worthmann H, Wang YL, Wang YJ, et al. Association of Molecular Markers With Perihematomal Edema and Clinical Outcome in Intracerebral Hemorrhage. Stroke (2013) 44(3):658–63. doi: 10.1161/STROKEAHA.112.673590
80. Sansing LH, Kaznatcheeva EA, Perkins CJ, Komaroff E, Gutman FB, Newman GC. Edema After Intracerebral Hemorrhage: Correlations With Coagulation Parameters and Treatment. J Neurosurg (2003) 98(5):985–92. doi: 10.3171/jns.2003.98.5.0985
81. Naidech AM, Bernstein RA, Levasseur K, Bassin SL, Bendok BR, Batjer HH, et al. Platelet Activity and Outcome After Intracerebral Hemorrhage. Ann Neurol (2009) 65(3):352–6. doi: 10.1002/ana.21618
82. Qureshi AI, Palesch YY, Martin R, Novitzke J, Cruz-Flores S, Ehtisham A, et al. Association of Serum Glucose Concentrations During Acute Hospitalization With Hematoma Expansion, Perihematomal Edema, and Three Month Outcome Among Patients With Intracerebral Hemorrhage. Neurocrit Care (2011) 15(3):428–35. doi: 10.1007/s12028-011-9541-8
83. Allen CL, Bayraktutan U. Antioxidants Attenuate Hyperglycaemia-Mediated Brain Endothelial Cell Dysfunction and Blood-Brain Barrier Hyperpermeability. Diabetes Obes Metab (2009) 11(5):480–90. doi: 10.1111/j.1463-1326.2008.00987.x
84. Feng W, Tauhid S, Goel S, Sidorov EV, Selim M. Hyperglycemia and Outcome in Intracerebral Hemorrhage: From Bedside to Bench-More Study Is Needed. Transl Stroke Res (2012) 3(Suppl 1):113–8. doi: 10.1007/s12975-012-0163-z
85. Biffi A, Sonni A, Anderson CD, Kissela B, Jagiella JM, Schmidt H, et al. Variants at APOE Influence Risk of Deep and Lobar Intracerebral Hemorrhage. Ann Neurol (2010) 68(6):934–43. doi: 10.1002/ana.22134
86. Gong JS, Kobayashi M, Hayashi H, Zou K, Sawamura N, Fujita SC, et al. (ApoE) Isoform-Dependent Lipid Release From Astrocytes Prepared From Human ApoE3 and ApoE4 Knock-in Mice. J Biol Chem (2002) 277(33):29919–26. doi: 10.1074/jbc.M203934200
87. Gibson GE, Haroutunian V, Zhang H, Park LC, Shi Q, Lesser M, et al. Mitochondrial Damage in Alzheimer’s Disease Varies With Apolipoprotein E Genotype. Ann Neurol (2000) 48(3):297–303. doi: 10.1002/1531-8249(200009)48:3<297::AID-ANA3>3.0.CO;2-Z
88. James ML, Blessing R, Bennett E, Laskowitz DT. Apolipoprotein E Modifies Neurological Outcome by Affecting Cerebral Edema But Not Hematoma Size After Intracerebral Hemorrhage in Humans. J Stroke Cerebrovasc Dis (2009) 18(2):144–9. doi: 10.1016/j.jstrokecerebrovasdis.2008.09.012
89. McCarron MO, Hoffmann KL, DeLong DM, Gray L, Saunders AM, Alberts MJ. Intracerebral Hemorrhage Outcome: Apolipoprotein E Genotype, Hematoma, and Edema Volumes. Neurology (1999) 53(9):2176–9. doi: 10.1212/wnl.53.9.2176
90. Gebel JJ, Jauch EC, Brott TG, Khoury J, Sauerbeck L, Salisbury S, et al. Relative Edema Volume Is a Predictor of Outcome in Patients With Hyperacute Spontaneous Intracerebral Hemorrhage. Stroke (2002) 33(11):2636–41. doi: 10.1161/01.str.0000035283.34109.ea
91. Haque ME, Gabr RE, George SD, Zhao X, Boren SB, Zhang X, et al. Serial Metabolic Evaluation of Perihematomal Tissues in the Intracerebral Hemorrhage Pig Model. Front Neurosci (2019) 13:888. doi: 10.3389/fnins.2019.00888
92. Levine JM, Snider R, Finkelstein D, Gurol ME, Chanderraj R, Smith EE, et al. Early Edema in Warfarin-Related Intracerebral Hemorrhage. Neurocrit Care (2007) 7(1):58–63. doi: 10.1007/s12028-007-0039-3
93. Gupta M, Verma R, Parihar A, Garg RK, Singh MK, Malhotra HS. Perihematomal Edema as Predictor of Outcome in Spontaneous Intracerebral Hemorrhage. J Neurosci Rural Pract (2014) 5(1):48–54. doi: 10.4103/0976-3147.127873
94. Yang J, Arima H, Wu G, Heeley E, Delcourt C, Zhou J, et al. Prognostic Significance of Perihematomal Edema in Acute Intracerebral Hemorrhage: Pooled Analysis From the Intensive Blood Pressure Reduction in Acute Cerebral Hemorrhage Trial Studies. Stroke (2015) 46(4):1009–13. doi: 10.1161/STROKEAHA.114.007154
95. Appelboom G, Bruce SS, Hickman ZL, Zacharia BE, Carpenter AM, Vaughan KA, et al. Volume-Dependent Effect of Perihaematomal Oedema on Outcome for Spontaneous Intracerebral Haemorrhages. J Neurol Neurosurg Psychiatry (2013) 84(5):488–93. doi: 10.1136/jnnp-2012-303160
96. Qureshi AI, Palesch YY, Martin R, Novitzke J, Cruz-Flores S, Ehtisham A, et al. Effect of Systolic Blood Pressure Reduction on Hematoma Expansion, Perihematomal Edema, and 3-Monthoutcome Among Patients With Intracerebral Hemorrhage: Results From the Antihypertensive Treatment of Acute Cerebral Hemorrhage Study. Arch Neurol (2010) 67(5):570–6. doi: 10.1001/archneurol.2010.61
97. Leira R, Davalos A, Silva Y, Gil-Peralta A, Tejada J, Garcia M, et al. Early Neurologic Deterioration in Intracerebral Hemorrhage: Predictors and Associated Factors. Neurology (2004) 63(3):461–7. doi: 10.1212/01.wnl.0000133204.81153.ac
98. Lord AS, Gilmore E, Choi HA, Mayer SA. Time Course and Predictors of Neurological Deterioration After Intracerebral Hemorrhage. Stroke (2015) 46(3):647–52. doi: 10.1161/STROKEAHA.114.007704
99. Li N, Worthmann H, Heeren M, Schuppner R, Deb M, Tryc AB, et al. Temporal Pattern of Cytotoxic Edema in the Perihematomal Region After Intracerebral Hemorrhage: A Serial Magnetic Resonance Imaging Study. Stroke (2013) 44(4):1144–6. doi: 10.1161/STROKEAHA.111.000056
100. Wagner I, Hauer EM, Staykov D, Volbers B, Dorfler A, Schwab S, et al. Effects of Continuous Hypertonic Saline Infusion on Perihemorrhagic Edema Evolution. Stroke (2011) 42(6):1540–5. doi: 10.1161/STROKEAHA.110.609479
101. Joshi S, Singh-Moon R, Wang M, Bruce JN, Bigio IJ, Mayevsky A. Real-Time Hemodynamic Response and Mitochondrial Function Changes With Intracarotid Mannitol Injection. Brain Res (2014) 1549:42–51. doi: 10.1016/j.brainres.2013.12.036
102. Cook AM, Morgan JG, Hawryluk G, Mailloux P, McLaughlin D, Papangelou A, et al. Guidelines for the Acute Treatment of Cerebral Edema in Neurocritical Care Patients. Neurocrit Care (2020) 32(3):647–66. doi: 10.1007/s12028-020-00959-7
103. Roquilly A, Moyer JD, Huet O, Lasocki S, Cohen B, Dahyot-Fizelier C, et al. Effect of Continuous Infusion of Hypertonic Saline vs Standard Care on 6-Month Neurological Outcomes in Patients With Traumatic Brain Injury: The COBI Randomized Clinical Trial. JAMA (2021) 325(20):2056–66. doi: 10.1001/jama.2021.5561
104. Simard JM, Woo SK, Schwartzbauer GT, Gerzanich V. Sulfonylurea Receptor 1 in Central Nervous System Injury: A Focused Review. J Cereb Blood Flow Metab (2012) 32(9):1699–717. doi: 10.1038/jcbfm.2012.91
105. Jiang B, Li L, Chen Q, Tao Y, Yang L, Zhang B, et al. Role of Glibenclamide in Brain Injury After Intracerebral Hemorrhage. Transl Stroke Res (2017) 8(2):183–93. doi: 10.1007/s12975-016-0506-2
106. Wilkinson CM, Brar PS, Balay CJ, Colbourne F. Glibenclamide, a Sur1-Trpm4 Antagonist, Does Not Improve Outcome After Collagenase-Induced Intracerebral Hemorrhage. PloS One (2019) 14(5):e215952. doi: 10.1371/journal.pone.0215952
107. Sheth KN, Elm JJ, Molyneaux BJ, Hinson H, Beslow LA, Sze GK, et al. Safety and Efficacy of Intravenous Glyburide on Brain Swelling After Large Hemispheric Infarction (GAMES-RP): A Randomised, Double-Blind, Placebo-Controlled Phase 2 Trial. Lancet Neurol (2016) 15(11):1160–9. doi: 10.1016/S1474-4422(16)30196-X
108. Chodobski A, Zink BJ, Szmydynger-Chodobska J. Blood-Brain Barrier Pathophysiology in Traumatic Brain Injury. Transl Stroke Res (2011) 2(4):492–516. doi: 10.1007/s12975-011-0125-x
109. Fu Y, Hao J, Zhang N, Ren L, Sun N, Li YJ, et al. Fingolimod for the Treatment of Intracerebral Hemorrhage: A 2-Arm Proof-of-Concept Study. JAMA Neurol (2014) 71(9):1092–101. doi: 10.1001/jamaneurol.2014.1065
110. Chen J, Zhang ZG, Li Y, Wang Y, Wang L, Jiang H, et al. Statins Induce Angiogenesis, Neurogenesis, and Synaptogenesis After Stroke. Ann Neurol (2003) 53(6):743–51. doi: 10.1002/ana.10555
111. Naval NS, Abdelhak TA, Urrunaga N, Zeballos P, Mirski MA, Carhuapoma JR. An Association of Prior Statin Use With Decreased Perihematomal Edema. Neurocrit Care (2008) 8(1):13–8. doi: 10.1007/s12028-007-0081-1
112. Chen PS, Cheng CL, Chang YC, Kao YY, Yeh PS, Li YH. Early Statin Therapy in Patients With Acute Intracerebral Hemorrhage Without Prior Statin Use. Eur J Neurol (2015) 22(5):773–80. doi: 10.1111/ene.12649
113. Chu K, Jeong SW, Jung KH, Han SY, Lee ST, Kim M, et al. Celecoxib Induces Functional Recovery After Intracerebral Hemorrhage With Reduction of Brain Edema and Perihematomal Cell Death. J Cereb Blood Flow Metab (2004) 24(8):926–33. doi: 10.1097/01.WCB.0000130866.25040.7D
114. Lee SH, Park HK, Ryu WS, Lee JS, Bae HJ, Han MK, et al. Effects of Celecoxib on Hematoma and Edema Volumes in Primary Intracerebral Hemorrhage: A Multicenter Randomized Controlled Trial. Eur J Neurol (2013) 20(8):1161–9. doi: 10.1111/ene.12140
115. Sansing LH, Messe SR, Cucchiara BL, Lyden PD, Kasner SE. Anti-Adrenergic Medications and Edema Development After Intracerebral Hemorrhage. Neurocrit Care (2011) 14(3):395–400. doi: 10.1007/s12028-010-9498-z
116. Zhao X, Zhang Y, Strong R, Grotta JC, Aronowski J. 15d-Prostaglandin J2 Activates Peroxisome Proliferator-Activated Receptor-Gamma, Promotes Expression of Catalase, and Reduces Inflammation, Behavioral Dysfunction, and Neuronal Loss After Intracerebral Hemorrhage in Rats. J Cereb Blood Flow Metab (2006) 26(6):811–20. doi: 10.1038/sj.jcbfm.9600233
117. Zhao X, Sun G, Zhang J, Strong R, Song W, Gonzales N, et al. Hematoma Resolution as a Target for Intracerebral Hemorrhage Treatment: Role for Peroxisome Proliferator-Activated Receptor Gamma in Microglia/Macrophages. Ann Neurol (2007) 61(4):352–62. doi: 10.1002/ana.21097
118. Xie Q, Gu Y, Hua Y, Liu W, Keep RF, Xi G. Deferoxamine Attenuates White Matter Injury in a Piglet Intracerebral Hemorrhage Model. Stroke (2014) 45(1):290–2. doi: 10.1161/STROKEAHA.113.003033
119. Nakamura T, Keep RF, Hua Y, Schallert T, Hoff JT, Xi G. Deferoxamine-Induced Attenuation of Brain Edema and Neurological Deficits in a Rat Model of Intracerebral Hemorrhage. Neurosurg Focus (2003) 15(4):P4. doi: 10.3171/foc.2003.15.4.10
120. Cui HJ, He HY, Yang AL, Zhou HJ, Wang C, Luo JK, et al. Efficacy of Deferoxamine in Animal Models of Intracerebral Hemorrhage: A Systematic Review and Stratified Meta-Analysis. PloS One (2015) 10(5):e127256. doi: 10.1371/journal.pone.0127256
121. Selim M, Foster LD, Moy CS, Xi G, Hill MD, Morgenstern LB, et al. Deferoxamine Mesylate in Patients With Intracerebral Haemorrhage (I-DEF): A Multicentre, Randomised, Placebo-Controlled, Double-Blind Phase 2 Trial. Lancet Neurol (2019) 18(5):428–38. doi: 10.1016/S1474-4422(19)30069-9
122. Li Z, Li Y, Han J, Zhu Z, Li M, Liu Q, et al. Formyl Peptide Receptor 1 Signaling Potentiates Inflammatory Brain Injury. Sci Transl Med (2021) 13(605). doi: 10.1126/scitranslmed.abe9890
123. Tan Q, Li Y, Guo P, Zhou J, Jiang Z, Liu X, et al. Tolvaptan Attenuated Brain Edema in Experimental Intracerebral Hemorrhage. Brain Res (2019) 1715:41–6. doi: 10.1016/j.brainres.2019.01.033
124. Trabold R, Krieg S, Scholler K, Plesnila N. Role of Vasopressin V(1a) and V2 Receptors for the Development of Secondary Brain Damage After Traumatic Brain Injury in Mice. J Neurotrauma (2008) 25(12):1459–65. doi: 10.1089/neu.2008.0597
125. Corry JJ, Asaithambi G, Shaik AM, Lassig JP, Marino EH, Ho BM, et al. Conivaptan for the Reduction of Cerebral Edema in Intracerebral Hemorrhage: A Safety and Tolerability Study. Clin Drug Investig (2020) 40(5):503–9. doi: 10.1007/s40261-020-00911-9
126. Mould WA, Carhuapoma JR, Muschelli J, Lane K, Morgan TC, McBee NA, et al. Minimally Invasive Surgery Plus Recombinant Tissue-Type Plasminogen Activator for Intracerebral Hemorrhage Evacuation Decreases Perihematomal Edema. Stroke (2013) 44(3):627–34. doi: 10.1161/STROKEAHA.111.000411
127. Hanley DF, Thompson RE, Rosenblum M, Yenokyan G, Lane K, McBee N, et al. Efficacy and Safety of Minimally Invasive Surgery With Thrombolysis in Intracerebral Haemorrhage Evacuation (MISTIE III): A Randomised, Controlled, Open-Label, Blinded Endpoint Phase 3 Trial. Lancet (2019) 393(10175):1021–32. doi: 10.1016/S0140-6736(19)30195-3
128. Volbers B, Herrmann S, Willfarth W, Lucking H, Kloska SP, Doerfler A, et al. Impact of Hypothermia Initiation and Duration on Perihemorrhagic Edema Evolution After Intracerebral Hemorrhage. Stroke (2016) 47(9):2249–55. doi: 10.1161/STROKEAHA.116.013486
Keywords: intracerebral hemorrhage, perihematomal edema, neuroinflammation, pathophysiology, therapies
Citation: Chen Y, Chen S, Chang J, Wei J, Feng M and Wang R (2021) Perihematomal Edema After Intracerebral Hemorrhage: An Update on Pathogenesis, Risk Factors, and Therapeutic Advances. Front. Immunol. 12:740632. doi: 10.3389/fimmu.2021.740632
Received: 13 July 2021; Accepted: 27 September 2021;
Published: 19 October 2021.
Edited by:
Yujie Chen, Army Medical University, ChinaReviewed by:
Weilin Xu, Zhejiang University, ChinaGaiqing Wang, The Third People’s Hospital of Hainan Province, China
Devin William McBride, University of Texas Health Science Center at Houston, United States
Copyright © 2021 Chen, Chen, Chang, Wei, Feng and Wang. This is an open-access article distributed under the terms of the Creative Commons Attribution License (CC BY). The use, distribution or reproduction in other forums is permitted, provided the original author(s) and the copyright owner(s) are credited and that the original publication in this journal is cited, in accordance with accepted academic practice. No use, distribution or reproduction is permitted which does not comply with these terms.
*Correspondence: Renzhi Wang, wangrz@126.com
†These authors have contributed equally to this work