 Aberham Abere1*
 Solomon Ayalew2Bealemlay Wondale2Fentahun Tigabu2Nigus Gizachew2Takele Tesfaye2Getnet Ayalew3Banchamlak Tegegne4Mulat Yimer Melaku5
 Yibeltal Aschale6
 Adane Tilahun6
 Mebratu Tamir1Fentahun Megabiaw1
 Tegegne Eshetu1
 Adane Derso1
- 1Department of Medical Parasitology, School of Biomedical and Laboratory Science, College of Medicine and Health Science, University of Gondar, Gondar, Ethiopia
- 2School of Biomedical and Laboratory Science, College of Medicine and Health Science, University of Gondar, Gondar, Ethiopia
- 3Department of Medical Microbiology, School of Biomedical and Laboratory Science, College of Medicine and Health Science, University of Gondar, Gondar, Ethiopia
- 4Amhara Public Health Institute (APHI), Bahir Dar, Ethiopia
- 5Department of Medical Laboratory Sciences, College of Medicine and Health Sciences, Bahir Dar University, Bahir Dar, Ethiopia
- 6Department of Medical Laboratory Sciences, College of Medicine and Health Sciences, Debre Markos University, Debre Markos, Ethiopia
Background: Despite the WHO’s extensive efforts to eliminate malaria from sub-Saharan Africa, including Ethiopia, it remains the most serious public health issue, with seasonal variations and high mortality. This study aimed to assess the 10-year trend in the prevalence of malaria in northwest Ethiopia.
Methods: A retrospective study was carried out at the Maraki Health Center, northwest Ethiopia. Blood film results from a 10-year period (from January 2012 to December 2021) were recorded using a data extraction sheet, with data sourced from a laboratory logbook. The 10-year trend of malaria incidence was observed by year, month, and season, with respect to age and gender. The species distribution of the causative agents was determined in the study area.
Results: Over 10 years, 15,978 blood films were requested for malaria diagnosis, and 57.5% were from male respondents. Approximately 68.0% of the respondents were under the age group of 15 years old. The mean prevalence rate of malaria was 25.2% (n = 4,019) (95% CI: 23.83–26.59). The highest peaks of total malaria cases were observed in 2012 and October, whereas the lowest peaks were observed in 2016 and April (mean annual case = 401.9). Plasmodium falciparum was the dominant malaria species throughout the 10-year study period. The highest and lowest Plasmodium vivax counts were observed in 2012 and 2018, respectively.
Conclusion: The study revealed a drop in annual transmission rates in 2016–2017; however, to date, there has been a gradual rise. Moreover, shifts in the predominant malaria species were observed in 2012, 2014, and 2015, with P. falciparum as the dominant species. Sustained efforts are still essential to decrease the transmission of malaria to a level where it no longer threatens public health.
Background
Despite extensive scientific efforts to advance research and achieve the goal of eradicating malaria, malaria remains one of the most devastating global challenges for humanity (Monroe et al., 2022). The sustained impact of malaria is largely due to triple resistance to insecticides, antimalarial drugs, and rapid diagnostic tests (Alonso, 2021). Malaria is a protozoan disease caused by Plasmodium parasites that is typically transmitted through the bite of an infected female Anopheles mosquito (Nateghpour et al., 2017). Plasmodium falciparum, Plasmodium vivax, Plasmodium ovale, and Plasmodium malariae are typically infectious to humans (Mandefro et al., 2024). Meanwhile, Plasmodium knowlesi is the most prevalent cause of zoonotic malaria in humans (Anstey et al., 2021). Among these, P. falciparum and P. vivax are the widely existing species in Africa, including Ethiopia. Plasmodium falciparum particularly causes the most severe and deadliest spectrum of the disease (Saravu et al., 2014; Kendie et al., 2021). Clinically, the symptoms of malaria include the presence of fever, sweating, chills, fatigue, hepatosplenomegaly, severe anemia, hypoglycemia, organ failure, pulmonary edema, and other various signs (Saravu et al., 2014). Although malaria is highly prevalent among populations living across all five continents, sub-Saharan regions are affected by the disease and death burden. Pregnant women and children under 5 years of age are facing the lion’s share of challenges (Monroe et al., 2022).
Globally, in 2023, an estimated 247 million malaria cases and 619,000 deaths occurred in 84 malaria-endemic countries, with 93% cases and 94% deaths occurring in Africa (Organization WH, 2023). In addition, research indicates that 80% of malaria-related mortality among children under five occurred in sub-Saharan Africa (Haque et al., 2009; Organization WH, 2023). Ethiopia is one of the African countries where 75% of its population is at risk of malaria, with increasing incidence rates of outpatient visits, hospitalizations, high disability-adjusted life years, and inpatient fatalities (Woyessa et al., 2002). In Ethiopia, the introduction of a new malaria vector (Anopheles stephensi), political instability, population displacement, and urbanization are key factors for the alteration and expansion of malaria transmission cycles, including in urban areas (Teka et al., 2023). At present, malaria in Ethiopia threatens not just the health of the people but also the country’s social and economic development (Alkadir et al., 2020). The peaks of malaria cases in the country occur during two crucial seasons: crop plantation and crop harvesting (Teka et al., 2023). Poor healthcare system, histidine-rich protein 2/3 gene deletion of P. falciparum, poor professional diagnostic skill, and mosquito resistance to pesticides are the main obstacles to controlling and preventing malaria (Alonso, 2021). The distribution and transmission of malaria differ from one country to another, influenced by factors such as rainfall patterns, altitude, and variations in ecology and climate (Tesfaye and Yesuf, 2024). Meteorological conditions play a crucial role in malaria transmission by directly or indirectly impacting both the malaria parasites and their vectors. Temperature, rainfall, and humidity are linked to the dynamics of malaria vector populations, which in turn affect the spread of the disease (Craig et al., 1999). However, there is still seasonal and severe variable incidence, drawing from topographical, temperature, and rainfall patterns, including the study area (Deribew et al., 2017; Alelign et al., 2018). Of the 11 administrative regions in Ethiopia, the Amhara region primarily faces high malaria burden, accounting for approximately 93.1% of the regional crisis (Workineh et al., 2021; Teka et al., 2023; Tesfaye and Yesuf, 2024). Thus, spatial and temporal analyses of malaria data are critical for developing area-specific evidence-based interventions, making informed decisions, tracking the efficacy of malaria control efforts, and preventing the burden of malaria and associated complications. However, little is known regarding the trend of malaria in health institutions, and there is a lack of published studies on this topic. Consequently, this study aimed to assess the 10-year trend of malaria transmission in northwest Ethiopia.
Methods
Study design, period, and setting
A health facility-based retrospective cohort study was conducted from 27 June 2022 to 30 September 2022 at Maraki Health Center located in Maraki Sub-city administration, Gondar Town, northwest Ethiopia. The Central Gondar Zone is found in the Amhara region and is geographically located at 170°29′32″ north latitude and 420°38′25″ east longitude. The mean annual rainfall ranges from 875 to 1,025 mm, and the temperature ranges from 18°C to 35°C (Mengist et al., 2019). According to the 2007 national census conducted by the Central Statistical Agency of Ethiopia (CSA), the town of Gondar had a total population of 333,432, of whom 163,381 were men and 170,051 women. In the Ethiopian health system, microscopy is the standard for malaria diagnosis in health centers and hospitals, whereas rapid diagnostic tests are used at community-level health posts. The Maraki Health Center offers routine malaria microscopic diagnostics and treatment services to over 5,000 individuals annually. Malaria remains a significant public health challenge in the Amhara region. In 2012, the region reported a total of 1,127,241 malaria cases. Of the eight zones in the region, only five of them accounted for 93.1% of the total malaria burden. The South Gondar zone accounted for the third greatest number of cases in the region, next to the West Gojjam and North Gondar zones (Mengist et al., 2019) (Figure 1). The blood film results were regularly recorded in a laboratory logbook for quality assurance (QA) and backed up in separate files within health centers. Overall, the 10-year blood film results at the Maraki Health Center that fulfilled the inclusion criteria (year of examination, age, gender, microscopic result, and Plasmodium species) were conveniently recorded and analyzed.
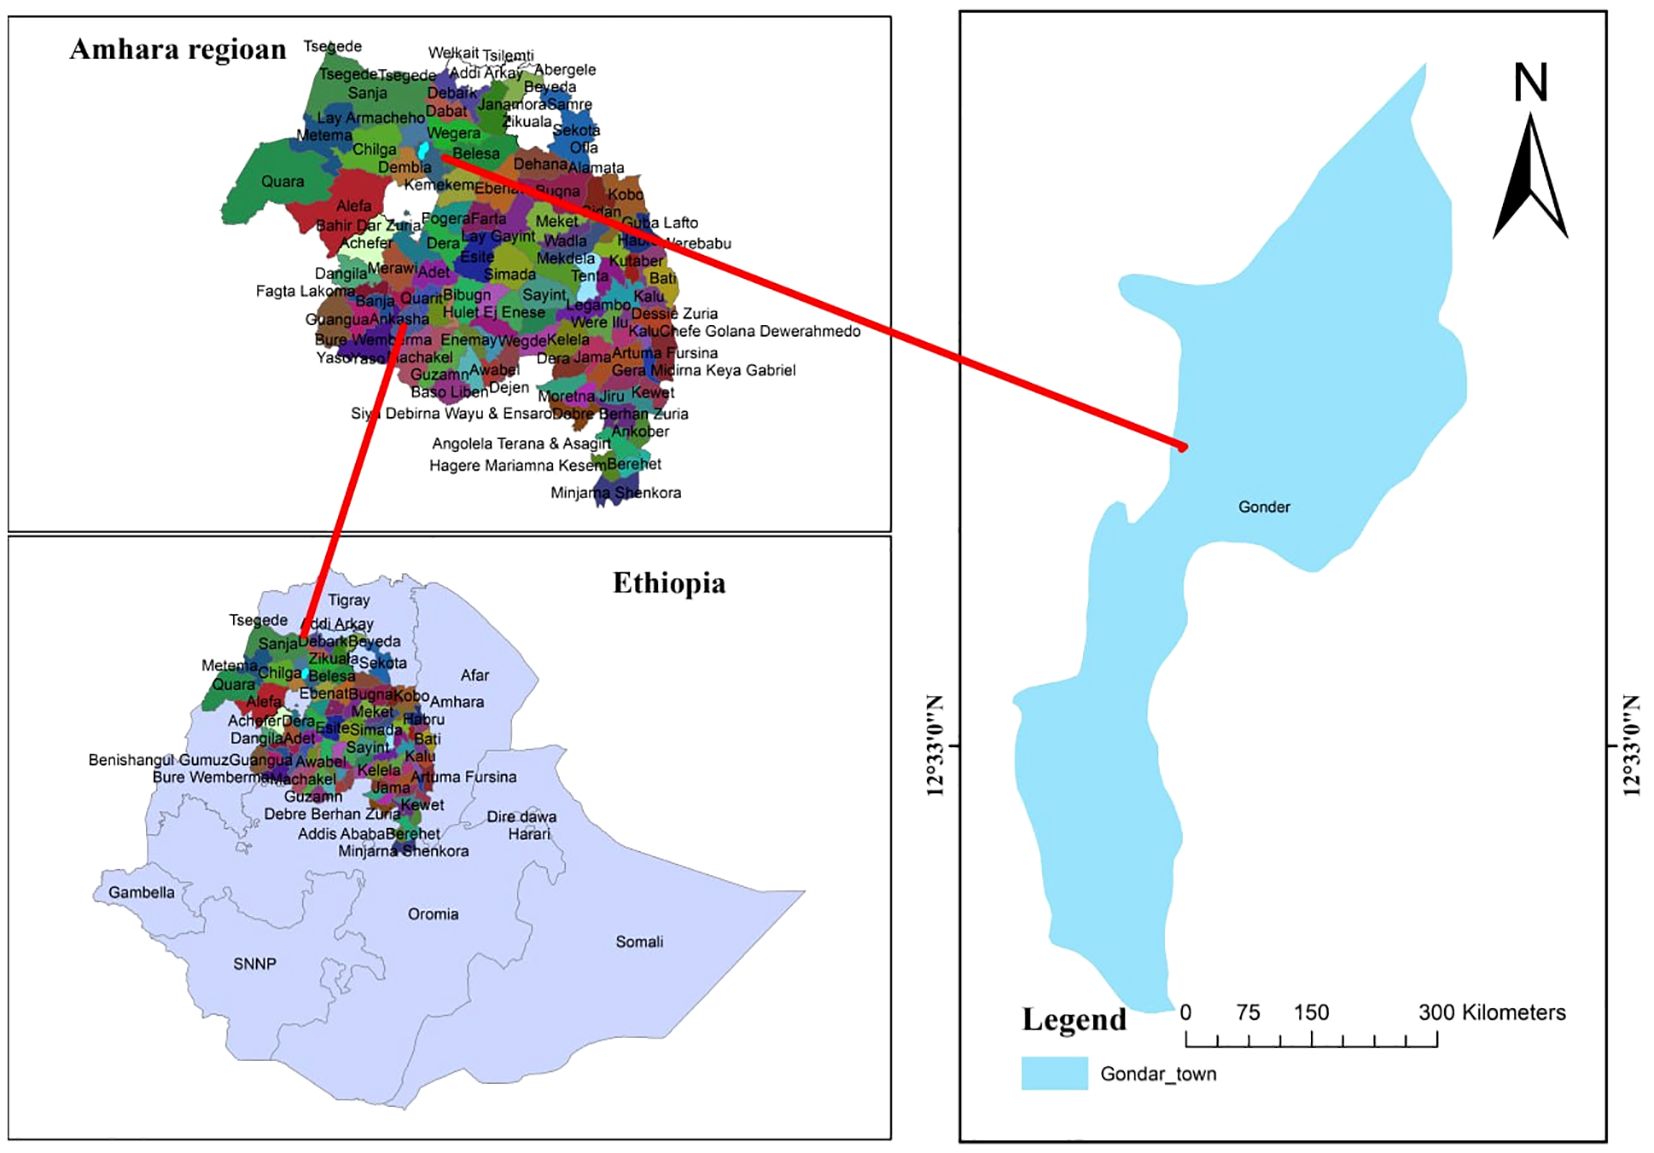
Figure 1. Map of the study area in North Gondar, Amhara region, Ethiopia. The blue figure represents the geographical area where the study was conducted. Sample size determination was conducted and sampling techniques were used. Source: Maps created using shape files from GADM. Licensed under https://gadm.org/license.html.
Population
Source and study population
All malaria-suspected patient blood films diagnosed at the Maraki Health Center from 27 June 2022 to 30 September 2022 were collected.
Eligibility criteria
Inclusion criteria
The study included all registered malaria blood films (details such as year of examination, age, gender, microscopic result, and Plasmodium species were recorded include for analysis from 27 June 2022 to 30 September 2022.
Exclusion criteria
Excluded from the study were those with incomplete data or illegible records.
Study variables
Dependent variable
This included the trend of malaria prevalence.
Independent variables
These included the age, gender, month, year, season, and meteorological data.
Data collection, quality control, management, and analysis
Data regarding malaria (10-year period from 2012 to 2021) were compiled from the Maraki Health Center laboratory logbook from 27 June 2022 to 30 September 2022. Both microscopically confirmed positive and negative findings were collected by laboratory personnel. Data on the patient’s year of examination, age, sex, month, microscopic results, and Plasmodium species were gathered by the first author and trained laboratory staff using a data extraction sheet specifically designed for this study. This sheet captured various details, including blood film results (positive or negative), patient demographics (gender and age), the date of diagnosis (month, season, and year), and for positive cases, the identified species (P. falciparum, P. vivax, or mixed species). The completeness and consistency of the data were verified before analysis. To ensure the reliability and validity of the study, the generated data were rechecked by all investigators.
The extracted data were entered into IBM SPSS Statistics (Version 23.0), checked for completeness, and analyzed accordingly. Descriptive statistics (frequency, percentage, mean, and range) were used to present the data and to evaluate malaria trends over the years and months. A chi-square test was used to describe the association of malaria cases with sex, age, month, and year. A statistically significant association was declared at a P-value of <0.05 with 95% confidence interval.
Ethics approval and consent to participate
Ethical clearance for this study was obtained from the Ethical Review Committee of the School of Biomedical and Laboratory Science (SBMLS) with protocol numbers (SBMLS/358/2022). Prior to data collection, a permission letter was obtained from the head of the Maraki Health Center to access the secondary data. The need for informed consent was waived by the SBMLS Ethical Review Committee. This study adhered to the Helsinki Declaration. Additionally, all data and samples collected were handled with strict confidentiality, securely stored, and used solely for the purposes specified in the study protocol, thereby safeguarding the privacy and anonymity of the participants.
Results
Demographic characteristics and malaria prevalence
In the 10-year period from 2012 to 2021, 15,978 individuals were requested for malaria diagnosis at the Maraki Health Center. There were 9,193 male patients (57.5%), and 10,865 (68.0%) fell under the age group of 15–45 years old. Of the total diagnosed cases, malaria was reported in 25.2% (n = 4,019; 95% CI: 23.83–26.59). During the 10-year study period, P. falciparum was the predominant malaria parasite identified, with an estimated overall prevalence of 13.4%, followed by P. vivax (10.6%). The remaining 1.2% of malaria cases were mixed infections. Their relative proportions were 53.4% (n = 2,145), 42.0% (n = 1,688), and 4.6% (n = 186), respectively (Table 1).
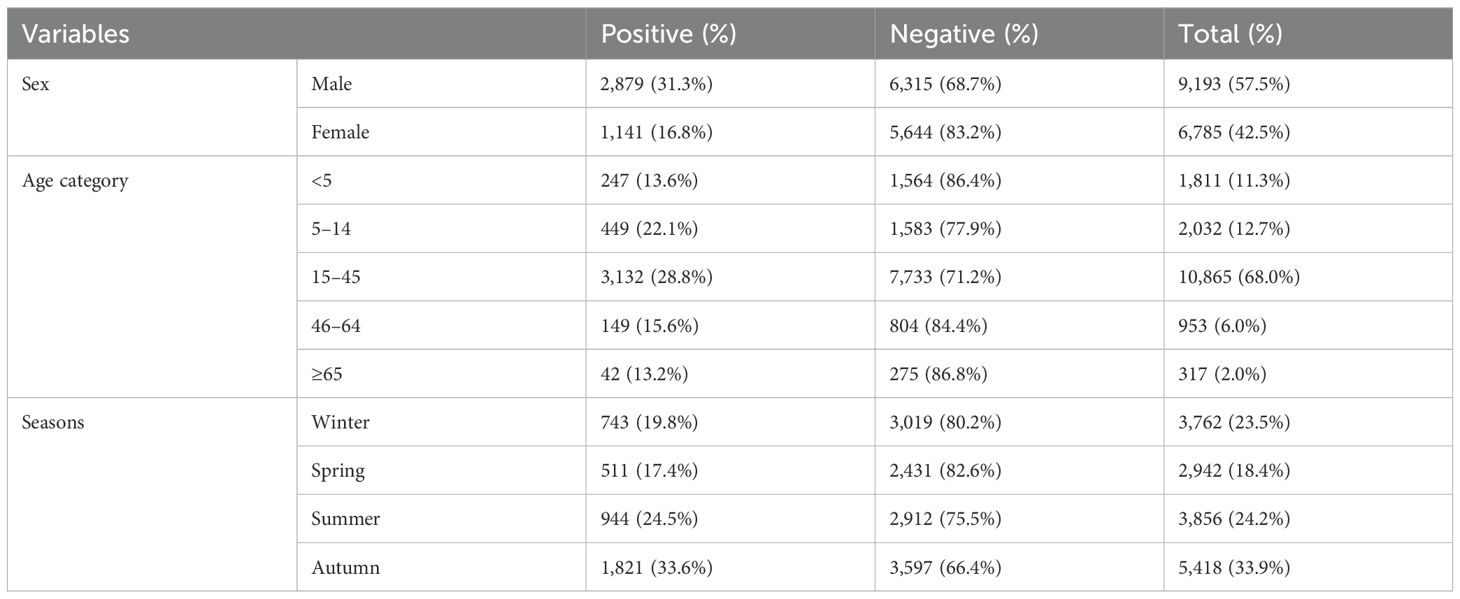
Table 1. Sex, age, and seasonal variations in malaria prevalence among patients who requested malaria examinations at the Maraki Health Center from 2012 to 2021, Gondar Town, northwest Ethiopia (n = 15,978).
Overall seasonal variation prevalence and annual trends of malaria
Malaria cases were observed throughout the year, despite variation over the 10-year period. The prevalence ranged from 11.2% in 2016 (152 cases) to 66.4% in 2012 (952 cases), and there was a statistically significant year variation (P < 0.001). The prevalence of P. falciparum ranged from 6.9% in 2016 to 29.6% in 2012, and that of P. vivax ranged from 4.3% in 2016 and 2018 to 32.4% in 2012. On average, 401.9 (range: 152–952) microscopically confirmed malaria cases were recorded annually. The highest peak of total malaria cases was observed in 2012, and the lowest peak was observed in 2016. Similarly, the highest and lowest peaks of P. falciparum cases followed the same pattern. The highest and lowest peaks of P. vivax were observed in 2012 and 2018, respectively. Based on our findings, it was observed that there was a trend of declining malaria prevalence until 2016 and 2017, followed by a gradual rise from 2018 (Figure 2).
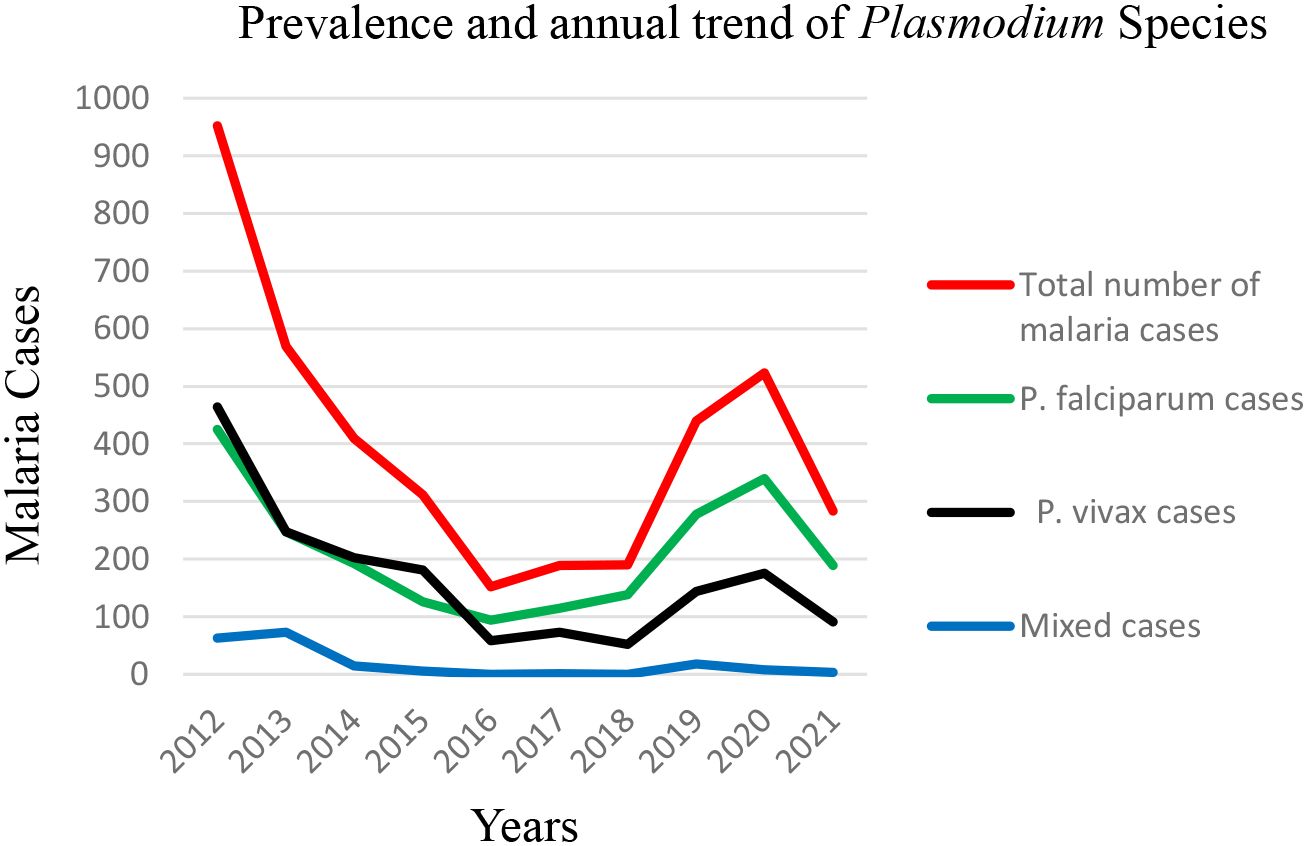
Figure 2. Prevalence and annual trend of Plasmodium species at the Maraki Health Center from 2012 to 2021, Gondar Town, northwest Ethiopia (n = 15,978).
Seasonal and monthly variations in malaria positivity rates
Malaria prevalence in the region appeared to peak during the autumn after a rainy month (September and October), with the lowest prevalence during the coldest winter and spring months (February and May), respectively. The highest prevalence of malaria occurred in autumn (33.6%), followed by summer (24.5%). Winter (19.8%) and spring (17.4%) showed lower malaria prevalence (Table 1). This suggests that malaria transmission is higher during the warmer months, likely due to favorable conditions for the mosquito vectors (temperature and rainfall). Throughout the 12-month period, P. falciparum was the most predominant species. The highest prevalence of P. falciparum and P. vivax was observed in June (23.5% and 11.6% respectively), while the lowest was in April and February (4.3% and 2.0%, respectively). Mixed infections showed monthly fluctuations, with the highest value in September (2.6%) and the lowest in March (0.0%) (Figure 3).
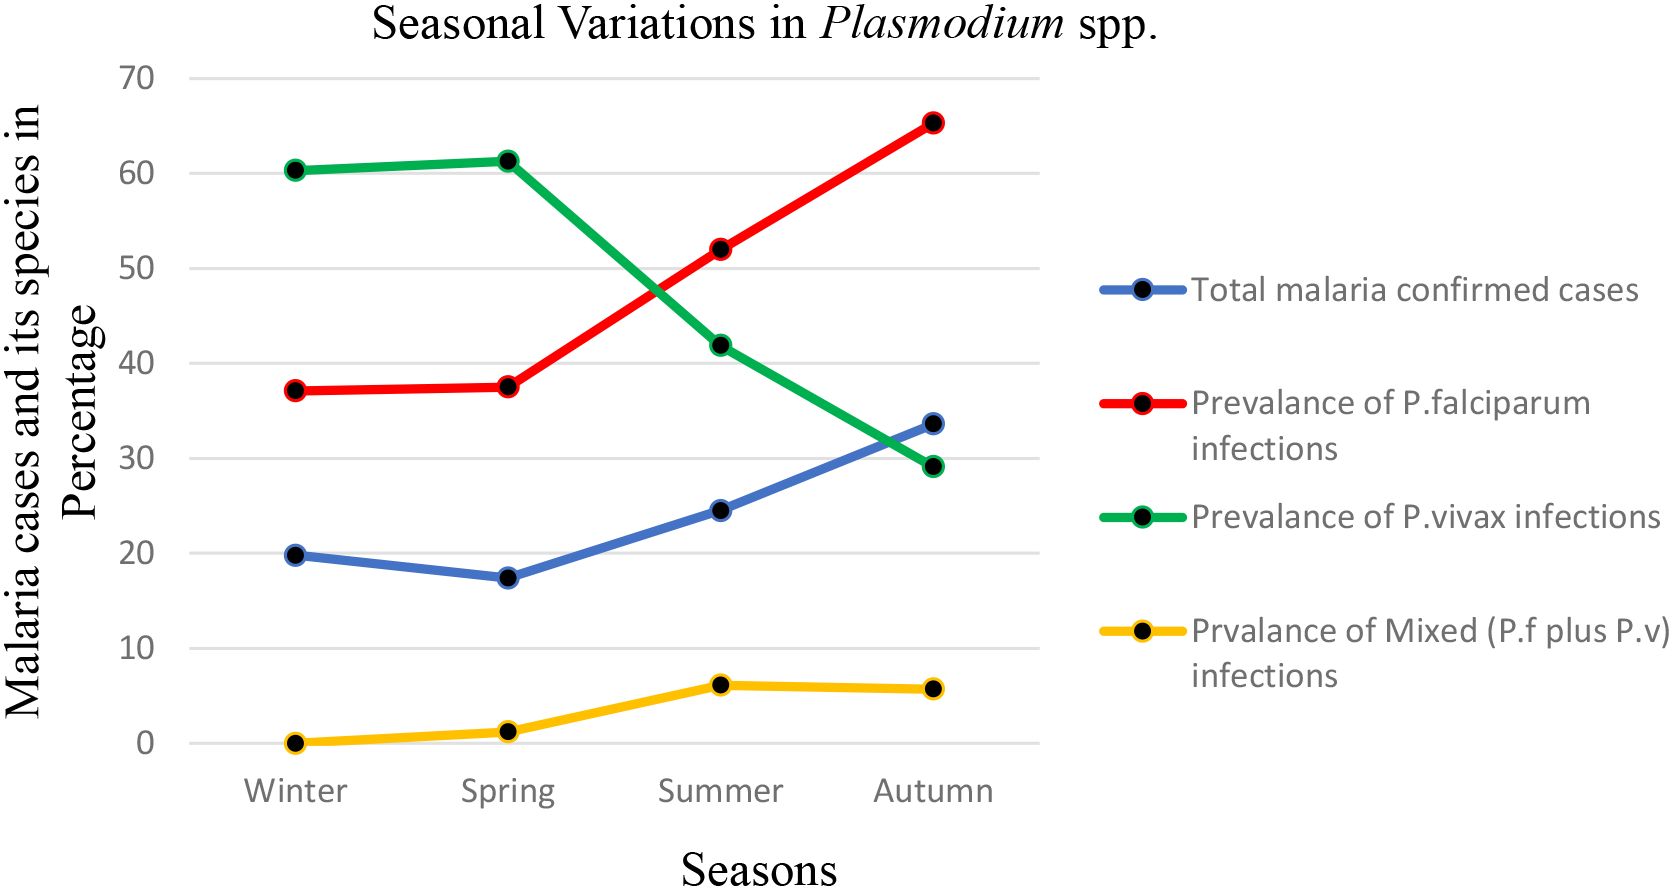
Figure 3. Seasonal variations in malaria prevalence and the proportion of Plasmodium species identified through blood smear microscopy at the Maraki Health Center from 2012 to 2021, Gondar Town, northwest Ethiopia (n = 15,978).
Please note that the seasons in Ethiopia are defined as follows: winter encompasses December, January, and February; spring includes March, April, and May; summer consists of June, July, and August; and autumn covers September, October, and November.
Monthly variation of total malaria cases and Plasmodium species
Malaria cases were observed throughout the 12 months, despite monthly fluctuations over a 10-year period in the study area. The total number of malaria cases varied among the 12 months, ranging from 118 (13.24% positivity rate) to 734 (39.15% positivity rate), and there was a statistically significant monthly variation of malaria cases (P < 0.001). The highest peak of total malaria cases was observed during October, and the lowest peak was observed during April. The highest peaks of P. falciparum cases were observed during the month of October, and the lowest peaks were noticed in the months of February and April. On the other hand, the highest peaks of P. vivax cases were observed during the months of August, October, November, and December, and the lowest peaks were observed in the months of February, April, and July. The highest peak for mixed infection was observed in September, and the lowest peak was noticed in March (zero record of mixed cases) (Figure 4).
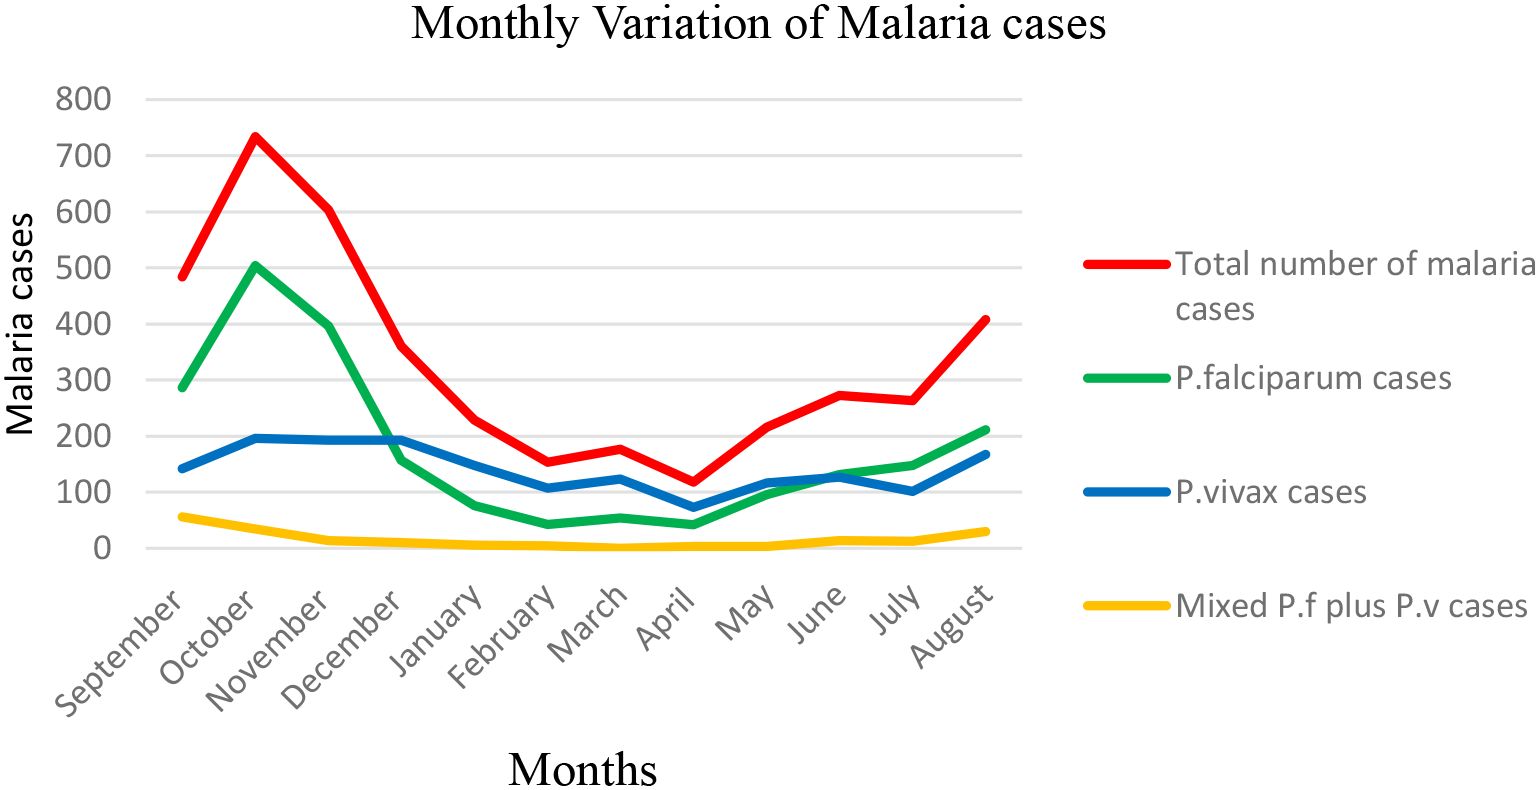
Figure 4. Monthly variation of total malaria cases and Plasmodium species.
Trends in annual variations of temperature, rainfall, and humidity
Malaria cases were recorded consistently over the 12 months, despite some monthly fluctuations during the 10-year study period in the area. The data indicated that the annual mean temperature in the town varied from a low of 20.71°C in 2014 to a high of 21.91°C in 2015, with a slight fluctuation in temperature observed from 2012 to 2021. The data also showed a high fluctuating trend of rainfall reported through the years 2012 to 2021 with a maximum mean monthly rainfall observed in 2021 (100.76 mm) and a minimum mean monthly rainfall observed in 2012 (34.53 mm). In the last 10 years, a fluctuating trend of relative humidity was observed: a mean monthly humidity at 2 m (g/kg), with a maximum mean monthly humidity in 2014 and 2019 (10.54 g/kg) and a minimum mean monthly humidity in 2012 (9.62 g/kg) (Figures 5a, b) (Hegyi et al., 2024).
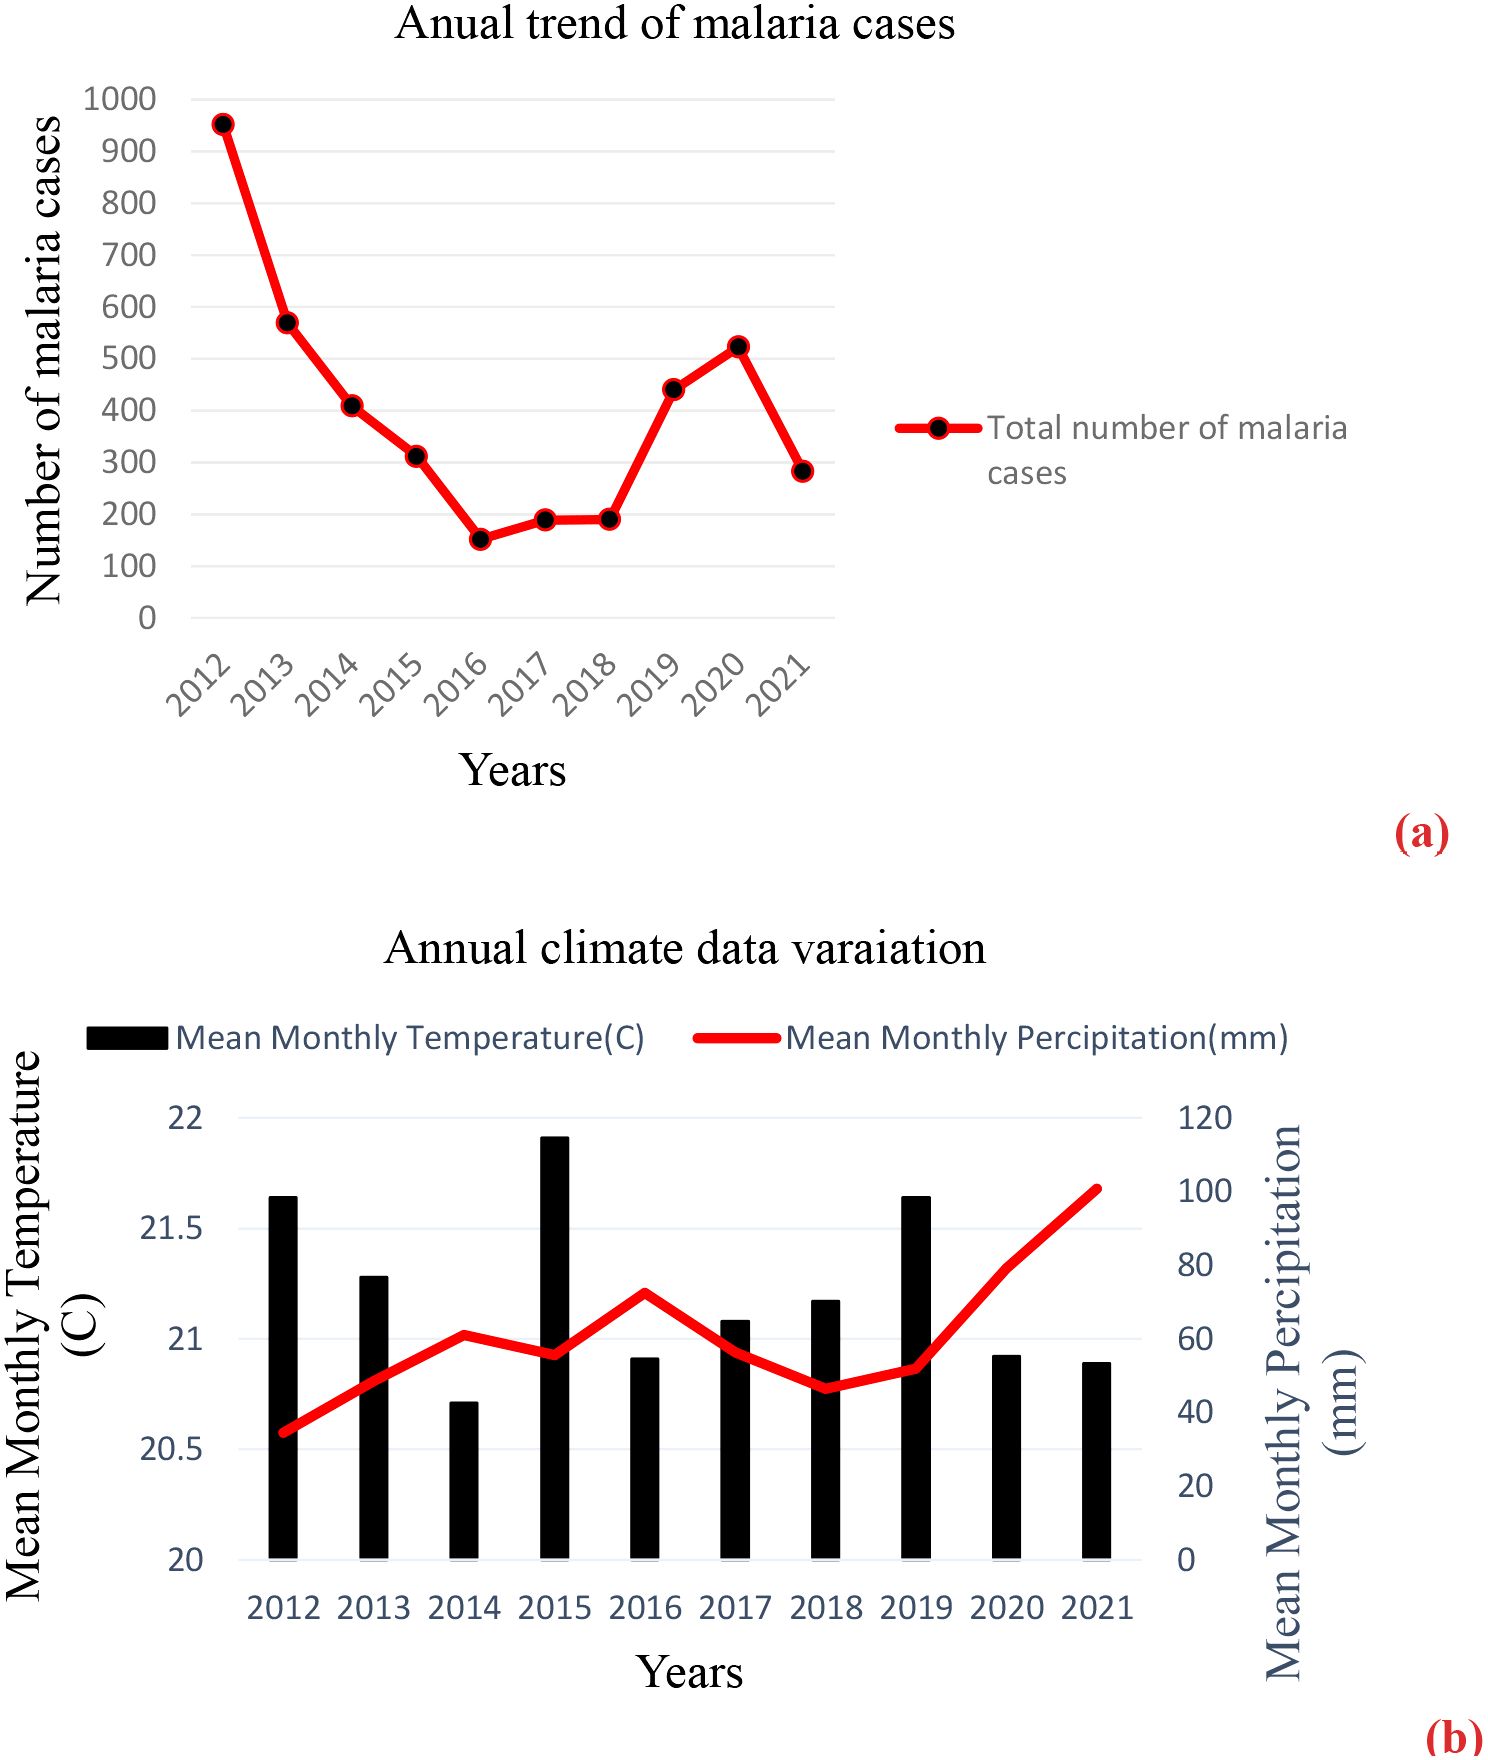
Figure 5. (a, b) The annual number of malaria cases and climate data variation in Gondar Town, 2012–2021.
Distribution of malaria cases by sex and age group
According to the 10-year record in the study area, malaria was reported in both sexes and all age groups. Individuals within the age group of 15–45 years old had the highest malaria cases (3,132 out of the total 4,019 malaria cases), whereas individuals within the age group of >65 had the least number of malaria cases (42 out of the total 4,019 malaria cases). Men (71.6%) were more affected than women (28.4%) in all age groups; malaria cases ranged from 27 to 2340 in men and 15 to 792 in women. There was a statistically significant difference in malaria cases among sex and age groups (P < 0.001) (Table 2).
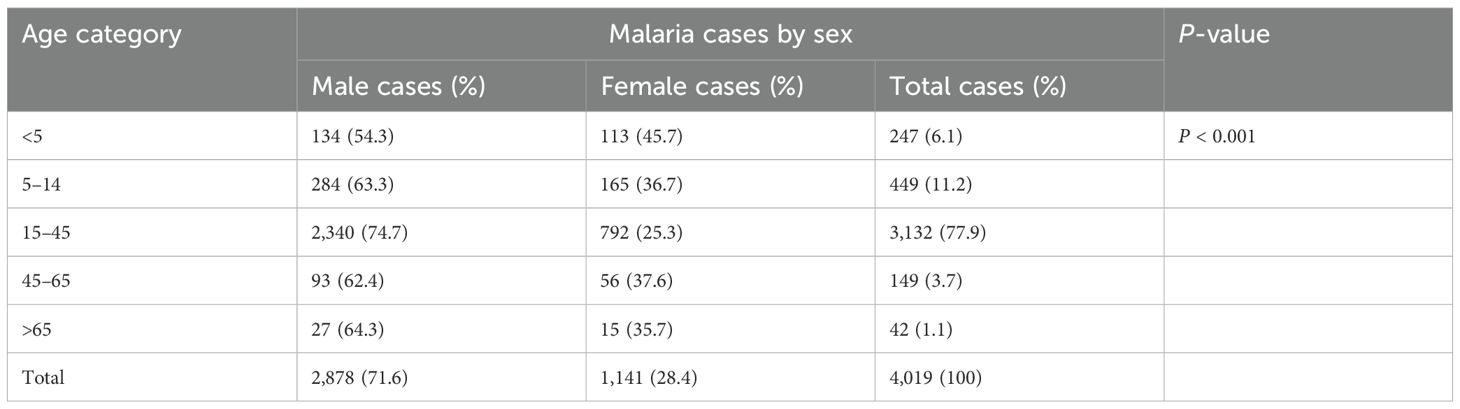
Table 2. Malaria cases by sex and age in the Maraki Health Center from 2012 to 2021, Gondar Town, northwest Ethiopia.
Distribution of Plasmodium species by age group
The distribution of Plasmodium species by age groups revealed that P. falciparum was the predominant species in all age groups except the age group <5 years (P. vivax was dominant). Mixed (P. falciparum and P. vivax) cases were the least prevalent in all age groups compared to mono-infection cases. The highest and lowest P. falciparum cases were recorded in the age groups 15–45 and >65 years old, respectively. The highest and lowest P. vivax and mixed cases were recorded in the age groups 15–45 and >65 years old, respectively (Figure 6).
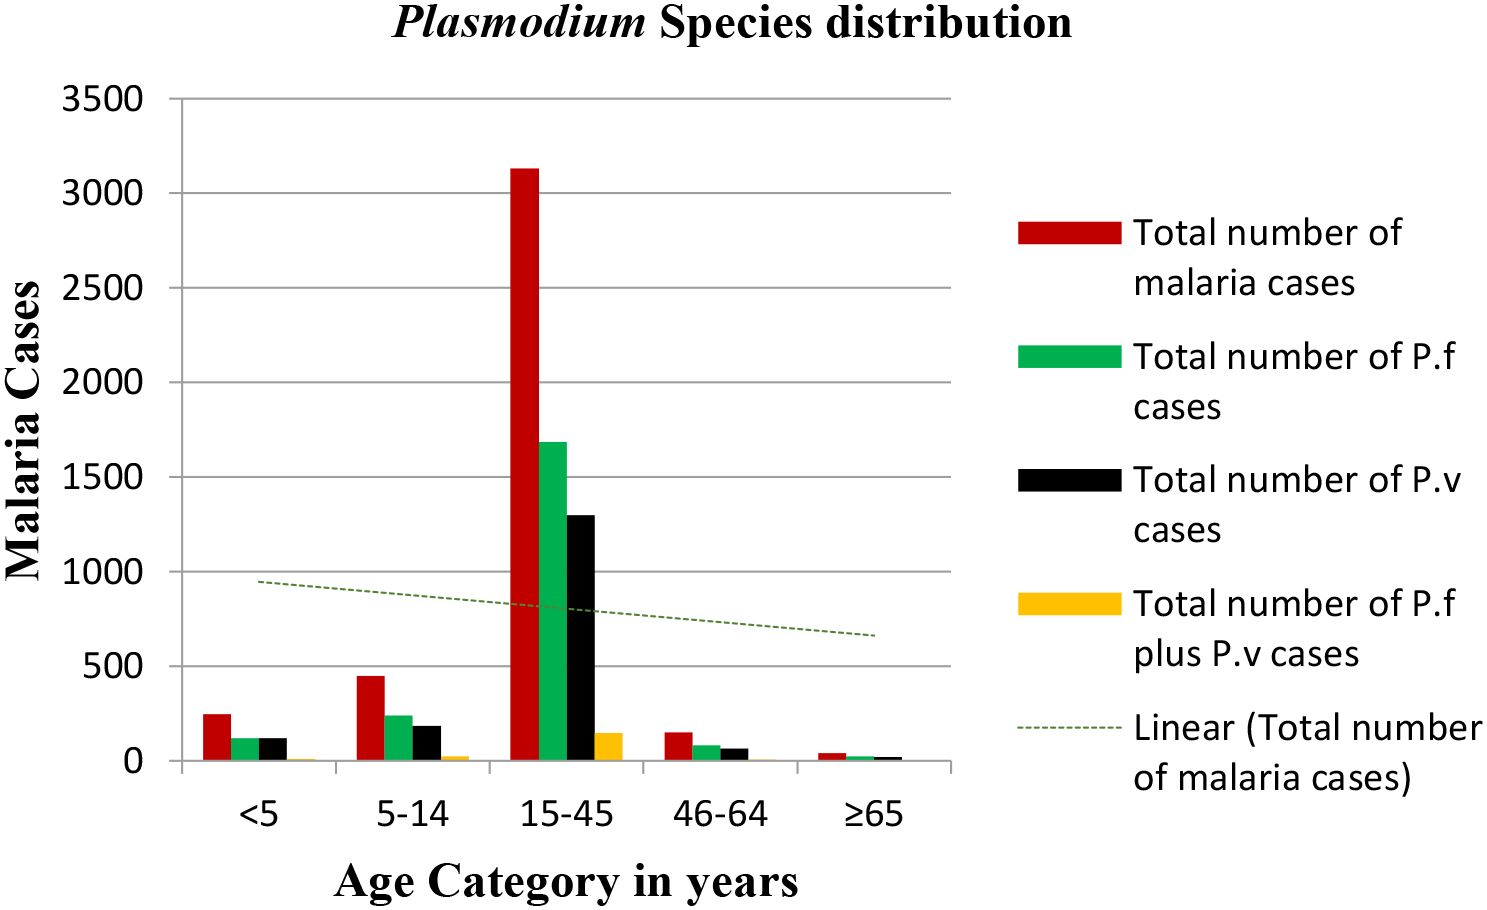
Figure 6. Plasmodium species distribution versus age groups in the Maraki health center from 2012 to 2021, Gondar Town, Ethiopia.
Discussion
Despite Ethiopia’s dedicated efforts to eliminate malaria by 2030, the disease remains a significant public health and socioeconomic challenge, as zero malaria deaths in endemic areas and complete elimination in hypo-endemic regions have not been achieved, even with the implementation of WHO-recommended interventions for mosquito control, rapid case detection, and treatment. In this study, 15,978 blood film (BF) results over a 10-year period from 2012 to 2021 were collected for malaria diagnosis and Plasmodium parasite confirmation. Of the total BF examinations, 4,019 (25.2%) (95% CI: 23.83–26.59) individuals were found to be positive for malaria. This is lower than a study conducted in Adi-Arkay Health Center (Tesfa et al., 2018) and Ziquala District (Minwuyelet and Aschale, 2021) and higher than a study conducted in Bichena Primary Hospital, University of Gondar (Mulugeta et al., 2022) and Mojo Town (Shiferawu and Desta, 2021). This variation might be due to differences in community awareness about malaria transmission and prevention, study time frame, malaria endemicity of the study areas, and skill of laboratory professionals in correctly detecting and identifying Plasmodium species.
The present study also demonstrated malaria case detection in terms of species distributions in Maraki Sub-city and the surrounding population. Thus, the overall prevalence rates of P. falciparum, P. vivax, and mixed infections were 13.4%, 10.6%, and 1.2%, respectively. Plasmodium falciparum was the predominant species, comprising 53.37% of the total reported malaria cases, although there was a species fluctuation from year-to-year and month-to-month. Plasmodium vivax and mixed infections had prevalence rates of 42.0% and 4.63%, respectively. A retrospective study conducted in Bichena Primary Hospital reported a species composition of 51.18%, 41.78%, and 7.04% for P. falciparum, P. vivax, and mixed infections, respectively (Mulugeta et al., 2022). A study conducted in Ziquala District reported 59.7%, 37.0%, and 3.3%% for P. falciparum, P. vivax, and mixed infections, respectively (Debash et al., 2023). In contrast, studies conducted in the towns of Shewa Robit and Mojo (Shiferawu and Desta, 2021) and at the University of Gondar (Mulugeta et al., 2022) showed the dominance of P. vivax over P. falciparum despite a year-to-year species fluctuation. The present finding is also not consistent with the national Plasmodium species distribution (P. falciparum, 60%; P. vivax, 40%), even if it indicates the mean distribution in all parts of Ethiopia. Failure to correctly identify Plasmodium species and the possibility of relapse might explain the reason for the dominance of P. vivax over P. falciparum in the abovementioned areas.
In the current study, malaria cases were observed all over the years, with a significant year-to-year fluctuation (P < 0.001). The highest peaks of total malaria cases were observed in 2012, and the lowest peaks were observed in 2016. On the other hand, there was a decreasing trend of malaria prevalence from 66.4% in 2012 to 11.2% in 2016, although a significant rise was observed in 2017, which continued up to 2020 and then dropped in 2021. Malaria cases dropped from 2012 to 2016 by 15.97% (952 cases in 2012 to 152 cases in 2016). The highest and lowest peaks of P. falciparum cases followed the same pattern. The highest and lowest peaks of P.vivax were observed in 2012 and 2018, respectively. Based on our findings, it was observed that there was a trend of declining malaria prevalence until 2016 and 2017, followed by a gradual rise from 2018. This fluctuation can largely be attributed to the implementation of various malaria control interventions over the past decade, including the widespread distribution of insecticide-treated nets (ITNs), indoor residual spraying (IRS) programs, improved access to rapid diagnostic tests and treatments, increased community health education, and enhanced funding from governmental and international organizations. The rise in malaria cases post-2017 may be due to funding shortfalls, insecticide resistance, and behavioral changes. This previous decline reflects the ongoing efforts and strong commitment of stakeholders to reduce malaria-related deaths and illnesses to a level with minimal public health impact. The highest case of malaria in 2020 might be the effect of disruptions from health crises like the COVID-19 pandemic on malaria prevention measures, since less attention was given to malaria and HIV prevention during the COVID-19 pandemic seasons. This fluctuating trend of malaria cases in our study is similar to other studies that were conducted at the University of Gondar (Mulugeta et al., 2022), Ziquala District (Debash et al., 2023), and Bichena Primary Hospital (Minwuyelet and Aschale, 2021). In contrast, a 5-year (2016–2020) declining trend in malaria prevalence was reported from a central Ethiopia study report (Shiferawu and Desta, 2021). Typically, our study findings show that malaria cases were observed in all months with some variations. The prevalence varied among different months from 13.24% to 39.15%, and there was a statistically significant monthly variation (P < 0.001). The highest peaks of total malaria cases were observed during September to October, and the least peaks were observed during February to April. Particularly, P. falciparum cases followed the same pattern. The highest peak for P. vivax cases was observed during the months of October, November, and December. Meanwhile, the highest levels of mixed infection were recorded in September, and the lowest occurred in March. This is consistent with the studies conducted in Ziquala District (Minwuyelet and Aschale, 2021), Guba District (Ayele et al., 2012), and Bichena Primary Hospital (Minwuyelet and Aschale, 2021). A fluctuating monthly trend of malaria cases was also reported from studies conducted in Mojo Town (Shiferawu and Desta, 2021) and the University of Gondar Specialized Referral Hospital (Abate et al., 2022) with maximum malaria cases reported from September to November and minimum cases reported from December to February. The possible reason for this type of malaria transmission pattern might be associated with mosquito breeding, feeding condition, rainfall, and temperature. These factors contributed to the formation of favorable mosquito breeding sites and an increased rate of larval development.
The present study also confirmed that malaria cases were reported in both sexes and all age groups, and there was a significant difference in malaria cases among sex and age groups (P < 0.001). There was a higher positivity rate of malaria among men (18.05%) than women (7.15%). The young age group of 15–45 years old accounted for the highest malaria cases across all the years, followed by those in the age group of 5–14 years old. The possible explanation for the dominance of male malaria cases over female cases and the age group 15–45 years old over other age groups is due to the fact that male respondents in the age group 15–45 were usually involved in different outdoor activities and were traveling to malaria hotspot areas for work opportunities, which in turn increased their susceptibility to mosquito bites. Women, on the other hand, were less likely to perform such activities and usually stayed at home, decreasing the risk of mosquito bites and the introduction of the parasite’s infective stage. In contrast, children under 5 years of age and people above the age of 65 showed relatively lower malaria cases because they spend less time outdoors and were less likely to be bitten by mosquitoes. This finding agrees with the studies conducted in Adi-Arkay (Tesfa et al., 2018), Ziquala District (Debash et al., 2023), Bichena Primary Hospital (Minwuyelet and Aschale, 2021), and Mojo Town (Abate et al., 2022).
Strengths and limitations of the study
The effort of collecting and analyzing such huge epidemiological data that allow us to understand the 10-year trend of malaria might be considered a strong side of this study. However, the retrospective nature of the study design and the reliance on parasitological tests for parasite identification, which were not supported by PCR, may be considered limitations of our study.
Conclusions
This study shows a significant fluctuation of malaria over a 10-year period, with P. falciparum found to be the predominant species. Continued sustained effort and commitment are essential to eliminate malaria or at least reduce it to a point where it no longer poses a public health threat.
Data availability statement
The original contributions presented in the study are included in the article/supplementary material, further inquiries can be directed to the corresponding author/s.
Ethics statement
Before starting the study, ethical clearance (Ref. No. SBMLS/358; dated: 21 June 2022) was obtained from the Research and Ethics Committee of the School of Biomedical and Laboratory Sciences, University of Gondar. The studies were conducted in accordance with the local legislation and institutional requirements. Written informed consent for participation was not required from the participants or the participants’ legal guardians/next of kin in accordance with the national legislation and institutional requirements.
Author contributions
AA: Conceptualization, Data curation, Formal Analysis, Funding acquisition, Investigation, Methodology, Project administration, Resources, Software, Supervision, Validation, Visualization, Writing – original draft, Writing – review & editing. SA: Writing – original draft, Writing – review & editing, Data curation, Methodology. BW: Writing – original draft, Writing – review & editing, Conceptualization, Data curation, Methodology. FT: Writing – original draft, Writing – review & editing, Conceptualization, Investigation, Methodology, Supervision. NG: Writing – original draft, Writing – review & editing, Conceptualization, Data curation, Investigation, Methodology, Software. TT: Writing – original draft, Writing – review & editing, Conceptualization, Data curation, Investigation, Methodology. GA: Writing – original draft, Writing – review & editing, Conceptualization, Formal Analysis, Validation, Visualization. BT: Conceptualization, Formal Analysis, Methodology, Writing – original draft, Writing – review & editing. MM: Conceptualization, Data curation, Formal Analysis, Investigation, Methodology, Project administration, Software, Supervision, Validation, Writing – original draft, Writing – review & editing. YA: Conceptualization, Data curation, Formal Analysis, Investigation, Methodology, Software, Supervision, Validation, Writing – original draft, Writing – review & editing. AT: Methodology, Writing – original draft, Writing – review & editing, Conceptualization, Software. MT: Writing – original draft, Writing – review & editing, Conceptualization, Data curation, Investigation, Methodology, Software. FM: Writing – original draft, Writing – review & editing, Conceptualization, Data curation, Formal Analysis, Funding acquisition, Investigation, Methodology, Project administration, Resources, Software, Supervision, Validation, Visualization. TE: Writing – original draft, Writing – review & editing, Conceptualization, Data curation, Formal Analysis, Investigation, Methodology, Project administration, Software, Supervision, Validation. AD: Conceptualization, Data curation, Formal Analysis, Funding acquisition, Investigation, Methodology, Project administration, Resources, Software, Supervision, Validation, Visualization, Writing – original draft, Writing – review & editing.
Funding
The author(s) declare that no financial support was received for the research and/or publication of this article.
Acknowledgments
We would like to thank the Maraki Health Center for allowing us to conduct this research. We are also grateful to all the data collectors.
Conflict of interest
The authors declare that the research was conducted in the absence of any commercial or financial relationships that could be construed as a potential conflict of interest.
Publisher’s note
All claims expressed in this article are solely those of the authors and do not necessarily represent those of their affiliated organizations, or those of the publisher, the editors and the reviewers. Any product that may be evaluated in this article, or claim that may be made by its manufacturer, is not guaranteed or endorsed by the publisher.
References
Abate A., Assefa M., and Golassa L. (2022). Five-year trend of malaria prevalence in Mojo town, Central Ethiopia: shifting burden of the disease and its implication for malaria elimination: a retrospective study. Infection Drug Resistance 1, 455–464. doi: 10.2147/IDR.S348203
Alelign A., Tekeste Z., and Petros B. (2018). Prevalence of malaria in Woreta town, Amhara region, Northwest Ethiopia over eight years. BMC Public Health 18, 1–6. doi: 10.1186/s12889-018-5913-8
Alkadir S., Gelana T., and Gebresilassie A. (2020). A five year trend analysis of malaria prevalence in Guba district, Benishangul-Gumuz regional state, western Ethiopia: a retrospective study. Trop. Diseases Travel Med. Vaccines 6, 1–7. doi: 10.1186/s40794-020-00112-4
Alonso P. L. (2021). Malaria: a problem to be solved and a time to be bold. Nat. Med. 27, 1506–1509. doi: 10.1038/s41591-021-01492-6
Anstey N. M., Grigg M. J., Rajahram G. S., Cooper D. J., William T., Kho S., et al. (2021). Knowlesi malaria: Human risk factors, clinical spectrum, and pathophysiology. Adv. parasitology 113, 1–43. doi: 10.1016/bs.apar.2021.08.001
Ayele D. G., Zewotir T. T., and Mwambi H. G. (2012). Prevalence and risk factors of malaria in Ethiopia. Malaria J. 11, 1–9. doi: 10.1186/1475-2875-11-195
Craig M. H., Snow R., and le Sueur D. (1999). A climate-based distribution model of malaria transmission in sub-Saharan Africa. Parasitol. Today 15, 105–111. doi: 10.1016/S0169-4758(99)01396-4
Debash H., Bisetegn H., Ebrahim H., Tilahun M., Dejazmach Z., Getu N., et al. (2023). Burden and seasonal distribution of malaria in Ziquala district, Northeast Ethiopia: a 5-year multi-centre retrospective study. BMJ Open 13, e067103. doi: 10.1136/bmjopen-2022-067103
Deribew A., Dejene T., Kebede B., Tessema G. A., Melaku Y. A., Misganaw A., et al. (2017). Incidence, prevalence and mortality rates of malaria in Ethiopia from 1990 to 2015: analysis of the global burden of diseases 2015. Malaria J. 16, 1–7. doi: 10.1186/s12936-017-1919-4
Haque U., Ahmed S. M., Hossain S., Huda M., Hossain A., Alam M. S., et al. (2009). Malaria prevalence in endemic districts of Bangladesh. PloS One 4, e6737. doi: 10.1371/annotation/546e7848-4fcb-49d3-8c63-4010445f21da
Hegyi B., Stackhouse P. W., Taylor P., and Patadia F. (2024). NASA POWER: providing present and future climate services based on NASA data for the energy, agricultural, and sustainable buildings communities. 104th Am. Meteorological Soc. (AMS) Annu. Meeting.
Kendie F. A., Hailegebriel W/kiros T., Nibret Semegn E., and Ferede M. W. (2021). Prevalence of malaria among adults in Ethiopia: A systematic review and meta-analysis. J. Trop. Med. 2021, 8863002. doi: 10.1155/2021/8863002
Mandefro A., Tadele G., Mekonen B., and Golassa L. (2024). Analysing the six-year malaria trends at Metehara Health Centre in Central Ethiopia: the impact of resurgence on the 2030 elimination goals. Malaria J. 23, 32. doi: 10.1186/s12936-024-04854-w
Mengist Y., Tadesse D., and Birara A. (2019). Assessment of prevalence, incidence and severity of red pepper disease in Capsicum frutescens L. at Cent. Gondar Ethiopia J. Academia Ind. Res. 8, 45.
Minwuyelet A. and Aschale Y. (2021). Analysis of five-year trend of malaria at bichena primary hospital, Amhara Region, Ethiopia. J. Parasitol. Res. 2021, 6699373. doi: 10.1155/2021/6699373
Monroe A., Williams N. A., Ogoma S., Karema C., and Okumu F. (2022). Reflections on the 2021 World Malaria Report and the future of malaria control. Malaria J. 21, 154. doi: 10.1186/s12936-022-04178-7
Mulugeta A., Assefa A., Eshetie A., Asmare B., Birhanie M., and Gelaw Y. (2022). Six-year trend analysis of malaria prevalence at University of Gondar Specialized Referral Hospital, Northwest Ethiopia, from 2014 to 2019. Sci. Rep. 12, 1411. doi: 10.1038/s41598-022-05530-2
Nateghpour M., Hosseininasab A., Farrokhnia M., Dastouri F., Alidoosti K., Sadequi D., et al. (2017). Species-dependent clinical findings of malaria caused by various plasmodia in an endemic area of Kerman Province, Southeastern Iran. Iranian J. Public Health 46, 525.
Saravu K., Rishikesh K., Kamath A., and Shastry A. B. (2014). Severity in Plasmodium vivax malaria claiming global vigilance and exploration–a tertiary care centre-based cohort study. Malaria J. 13, 1–10. doi: 10.1186/1475-2875-13-304
Shiferawu T. T. and Desta A. T. (2021). Five-year trend analysis of malaria prevalence in Shewarobit, Amhara regional state, North-central Ethiopia. Pan Afr. Med. J. 40. doi: 10.11604/pamj.2021.40.237.30614
Teka H., Golassa L., Medhin G., Balkew M., Sisay C., Gadisa E., et al. (2023). Trend analysis of malaria in urban settings in Ethiopia from 2014 to 2019. Malaria J. 22, 235. doi: 10.1186/s12936-023-04656-6
Tesfa H., Bayih A. G., and Zeleke A. J. (2018). A 17-year trend analysis of malaria at Adi Arkay, north Gondar zone, Northwest Ethiopia. Malaria J. 17, 1–6. doi: 10.1186/s12936-018-2310-9
Tesfaye S. and Yesuf A. (2024). Trend analysis of malaria surveillance data in West Wallaga, West Oromia, Ethiopia: a framework for planning and elimination. Malaria J. 23, 52. doi: 10.1186/s12936-024-04874-6
Workineh L., Mekuria S., Kiros T., Hailemichael W., and Eyayu T. (2021). A retrospective study of malaria trend in libokemkem district over the last five years: North West Ethiopia. Inf. Drug Resistance 9, 3683–3691. doi: 10.2147/IDR.S329708
Keywords: malaria, trend, transmission, Maraki, northwest Ethiopia
Citation: Abere A, Ayalew S, Wondale B, Tigabu F, Gizachew N, Tesfaye T, Ayalew G, Tegegne B, Melaku MY, Aschale Y, Tilahun A, Tamir M, Megabiaw F, Eshetu T and Derso A (2025) Dynamic shift of malaria cases in northwest Ethiopia: a 10-year retrospective cohort data analysis from 2012 to 2021. Front. Malar. 3:1460491. doi: 10.3389/fmala.2025.1460491
Received: 06 July 2024; Accepted: 09 July 2025;
Published: 25 July 2025.
Edited by:
José Pedro Gil, Karolinska Institutet (KI), SwedenCopyright © 2025 Abere, Ayalew, Wondale, Tigabu, Gizachew, Tesfaye, Ayalew, Tegegne, Melaku, Aschale, Tilahun, Tamir, Megabiaw, Eshetu and Derso. This is an open-access article distributed under the terms of the Creative Commons Attribution License (CC BY). The use, distribution or reproduction in other forums is permitted, provided the original author(s) and the copyright owner(s) are credited and that the original publication in this journal is cited, in accordance with accepted academic practice. No use, distribution or reproduction is permitted which does not comply with these terms.
*Correspondence: Aberham Abere, YWJlcmhhbWFiZXIyMUBnbWFpbC5jb20=