Abstract
Objectives:
To evaluate the accuracy of heart rate and respiratory rate acquired by commercially-available device cameras and software.
Methods:
One-hundred and eleven subjects were enrolled at an urban academic teaching hospital in Texas. Heart rate (HR) and respiratory rate (RR) measurements were obtained using three commercially-available cameras and processed using software from Presage Technologies. These values were compared to manual counts of a three-lead ECG and end-tidal CO2 from a patient monitor.
Results:
The cameras were able to capture HR in 83% of the measurements and RR in 94% of the RR measurements. Camera-acquired HR showed an extremely high correlation with R∼0.99 and a root-mean-square error (RMSE) of 1.62. Respiratory rate showed a high correlation with R∼0.91 and an RMSE of 1.71.
Conclusions:
Heart rate and respiratory rate can be accurately acquired using commercially-available camera devices and software for signal processing.
Introduction
Vital signs are critically important to modern emergency medical care. These metrics [heart rate (HR), respiratory rate (RR), blood pressure, temperature, and pulse oximetry] have been shown to predict a patient's morbidity (1), mortality (2), need for ICU-level admission (3), and suitability for discharge (4). As such, vital signs are used at multiple points of emergency department (ED) care, from triage through treatment through disposition.
Unfortunately, the acquisition of vital signs can be a time-intensive process. Time-and-motion studies have shown the measurement and recording of vital signs may take over five minutes per patient and longer with interruptions (5). Increased crowding, lack of available staff, and length-of-stay have all been shown to delay or decrease the frequency of vital sign measurements (6, 7). Some studies have shown a majority of both children and adults may be missing vital signs during their ED stays (8, 9). Other studies have shown repeat vital signs to be taken less frequently than every two hours (10). With increasing boarding and crowding in ED settings, the frequency of vital sign acquisition may be significantly worse than this reported data.
Many emergency departments have sought to improve vital sign acquisition through various quality improvement initiatives. Some researchers have also evaluated alternative means of vital sign acquisition. Telemedical providers, for instance, have evaluated the accuracy of patients’ self-reported vital signs (11). Device studies have also looked at non-contact vital signs via radar (12) and thermal imaging (13). More recently, studies have evaluated the feasibility of acquiring vital signs using cameras (14).
These studies of camera-acquired vital signs have shown promise, though they are limited by small sample sizes (15, 16). Here, we present the clinical validation of camera-acquired vital signs obtained from commercially available products over a larger sample size.
Methods
Patients were recruited on a volunteer basis at the Ben Taub Hospital emergency department in Houston, TX. Subjects were required to be between 18 and 75 years of age. Subjects were excluded if they required immediate medical care, had facial scarring, or if they self-reported pregnancy.
One hundred and eleven subjects participated in the study. These included hospital employees and friends and family members of patients in the ED. Thirty-eight were male, seventy-three were female, with ages ranging from 18 to 70 years old. Subjects were predominantly Black and Hispanic. The demography of the study population is shown in Table 1.
Table 1
| Demographic information | (Total n = 111) |
|---|---|
| Gender | |
| Male | 38 |
| Female | 73 |
| Age (years) | |
| Mean | 38.8 |
| Range | 18–70 |
| Height (inches) | |
| Mean | 66.5 |
| Range | 61–75 |
| Weight (lbs) | |
| Mean | 165.3 |
| Range | 108–350 |
| Race | |
| White/Caucasian | 3 |
| Black/African American | 70 |
| Hispanic | 24 |
| Asian/Pacific Islander | 9 |
| American Indian/Alaskan | 5 |
| Skin Tone (Fitzpatrick Scale) | |
| 1 | 10 |
| 2 | 14 |
| 3 | 18 |
| 4 | 14 |
| 5 | 29 |
| 6 | 25 |
| Heart rate range | 54–106 |
| Respiratory rate range | 6–26 |
Patient demographics.
Subjects were taken to a dedicated room used for the research project. They were seated in a chair and placed on continuous monitoring with a 3-lead ECG and continuous end-tidal capnometry. Subjects were instructed to face the study cameras while keeping their face still within the camera frame. The experimental setup is shown in Figure 1.
Figure 1

Experimental setup with subject facing three recording cameras.
Camera data was captured simultaneously with three devices: a Samsung Galaxy S24 Android phone, an iPhone 16 Pro, and a Logitech c920e webcam. The smartphone data was captured over thirty seconds. The webcam data was captured over sixty seconds (thirty seconds overlapping with the smartphones followed by an additional thirty seconds).
The camera data was processed using software from Presage Technologies (Herndon, VA). Signal analysis of pulse plethysmography and chest wall movements were used to calculate heart rate and respiratory rate, respectively. Data processing occurred on the smartphones and a laptop connected to the webcam. Readouts were provided within about thirty seconds. These values are subsequently referred to as Android HR/RR, iPhone HR/RR, and Webcam HR/RR respectively. These measurements were also aggregated into a Pooled HR/RR.
The control data was acquired by a manual count of the waveforms from a Phillips Intellivue MX450 patient monitor over the same time intervals. The presence of a QRS upstroke on the ECG monitor was considered a heartbeat. The downslope of an inhalation on end-tidal capnometry was considered a breath. These values are subsequently referred as control HR/RR. Ten patients were selected at random for review by a second researcher to confirm accuracy of the control measurements.
Statistical analysis was performed using Microsoft Excel and the JASP statistical software. Linear regressions were performed to calculate Pearson correlation coefficients and root-mean-square errors (RMSEs) for the camera-acquired vital signs.
Results
Capture rates
278 of 333 possible HR measurements were captured by the software, roughly 83%. 314 of 333 possible RR measurements were captured by the software, roughly 94%. These values were similar across the three devices. The capture rate data is shown in Table 2.
Table 2
| Device | HR capture rate (%) | RR capture rate (%) |
|---|---|---|
| Webcam | 90/111 (81.1%) | 106/111 (95.5%) |
| Android | 96/111 (86.5%) | 103/111 (92.8%) |
| iPhone | 92/111 (82.8%) | 105/111 (94.6%) |
| Pooled | 278/333 (83.5%) | 314/333 (94.3%) |
Camera HR/RR capture rates.
Correlation and error
Linear regression of the pooled captured HR measurements yielded a correlation coefficient of 0.990 and an RMSE of 1.62. The mean difference was 0.52 beats/minute with an interquartile range (IQR) of 0–1.
Linear regression of the pooled captured RR measurements yielded a correlation coefficient of 0.906 and an RMSE of 1.71. The mean difference was −0.18 breaths/minute with an IQR of −1 to 1.
These values are shown in Table 3. Regression and Bland-Altman plots for the HR vs. control are shown in Figures 2, 3. Regression and Bland-Altman plots for the RR vs. control are shown in Figures 4, 5. The random scatter on the Bland-Altman plots for HR and RR suggest that there is good agreement between the methods with no systematic bias or trends.
Table 3
| Device | HR Correlation | HR RMSE | RR Correlation | RR RMSE |
|---|---|---|---|---|
| Webcam | .992 | 1.32 | .924 | 1.75 |
| Android | .991 | 1.73 | .915 | 1.62 |
| iPhone | .989 | 1.77 | .903 | 1.74 |
| Pooled | .990 | 1.62 | .906 | 1.71 |
Correlation and RMSE of camera-acquired vital signs vs. Control.
Figure 2
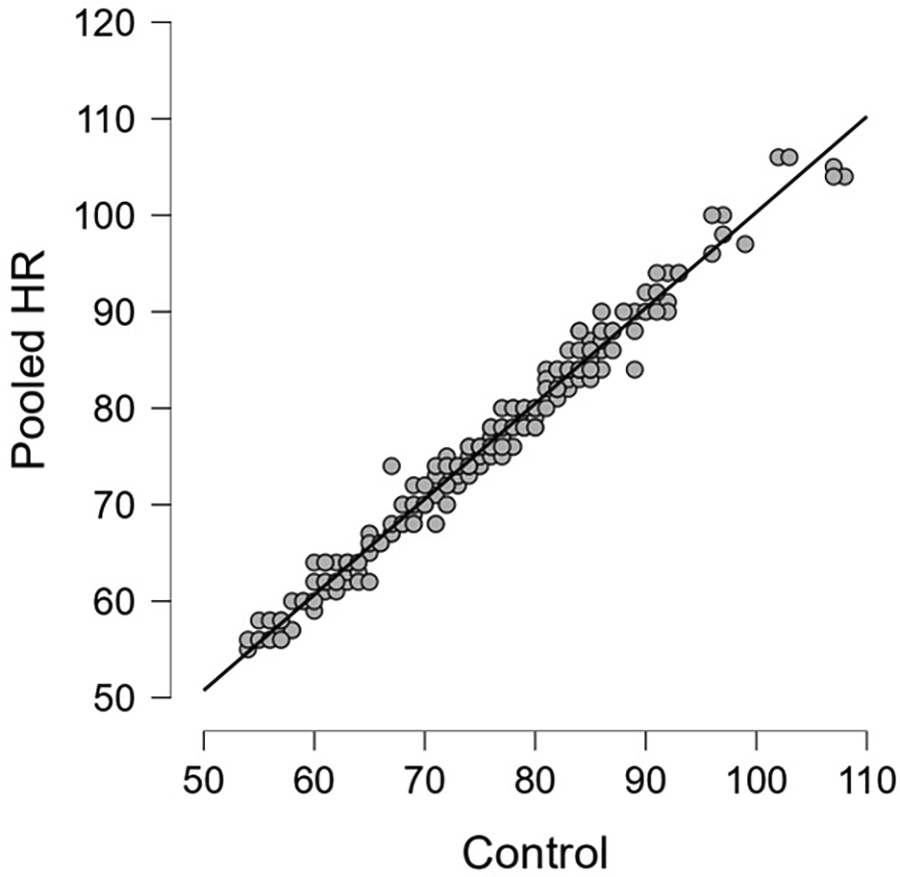
Pooled HR vs. control; R = 0.990.
Figure 3

Bland-Altman plot of pooled HR vs. Control [mean difference 0.52, IQR (0, 1)]; dashed lines: +/- 1.96 σ.
Figure 4

Pooled RR vs. control; R = 0.906.
Figure 5
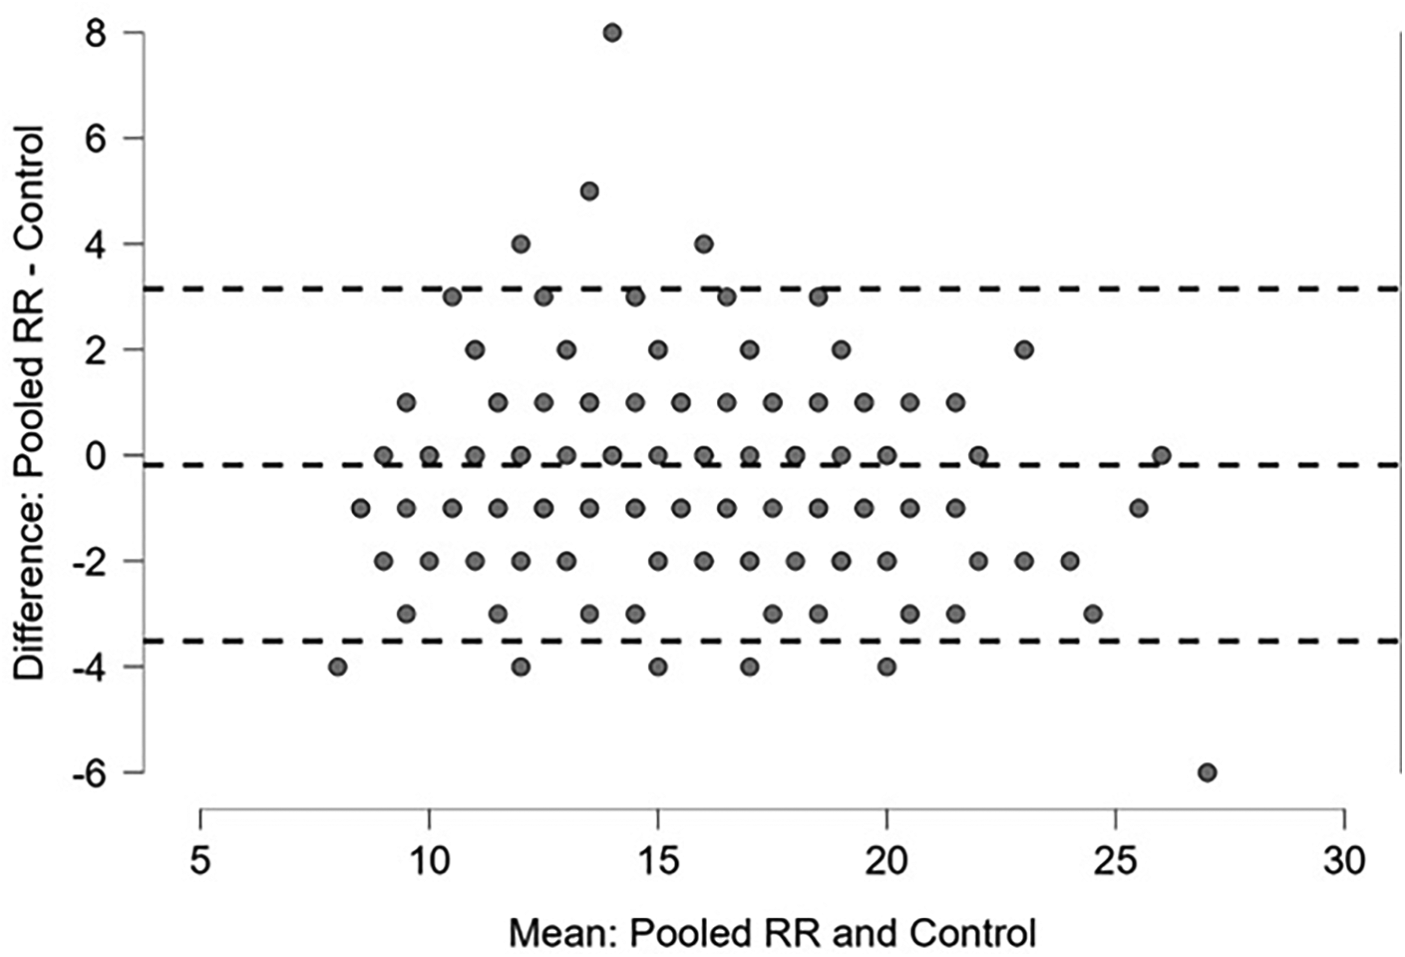
Bland-Altman plot of pooled RR vs. Control [mean −0.18, IQR (−1, 1)]; dashed lines: +/- 1.96 σ.
Proportion meeting FDA recommendations
The FDA standard for heart rate measurement in medical devices is accuracy to within 3 beats per minute. 266 of 278 or about 96% of captured measurements would meet this standard. The RMSE of 1.62 would also meet this standard.
The FDA standard for respiratory rate measurement in medical devices is accuracy to within 2 breaths per minute. 280 of 314 or about 89% of captured RR measurements would meet this standard. The RMSE of 1.71 would also meet this standard.
Interrater reliability
The ten randomly sampled control group measurements were reliably reproduced between the two staff counts. All HR controls were within 1. Nine of ten RR controls were within 1, with the last value being different by 2.
Discussion
These data show that commercially available cameras can be used to accurately acquire both HR and RR. Camera-acquired HR showed a near-perfect correlation of 0.99. Camera-acquired RR showed a high correlation of 0.91.
These high correlations could improve provider confidence in vital sign accuracy. Respiratory rate, in particular, is known to be measured inconsistently and inaccurately (17). Studies of manual measurement of RR have shown variability in measurement, value bias indicative of estimation, and even outright recording omissions (18). Studies using RR measurements taken from video recordings show only a moderate intraclass correlation coefficients (ICCs) of 0.64–0.662 (19, 20). Latten et al. estimated these inaccurate measurements of RR could then lead to inaccurate scoring in 8%–37% of clinical decision rules (20). The ICC of RR taken from actual patients is likely lower than the ICC of RR taken from video recordings. This would be further complicated by delayed or absent data. The downstream effect on clinical decision making would likely be even more pronounced. Having more consistent and reliable measurements could improve provider confidence in and utilization of RR in emergency department patient management.
This study is subject to several limitations. We first note that this study was performed on generally healthy volunteers. Participants were specifically excluded if they required medical attention. Heart rates ranged from 54 to 106 and respiratory rates ranged from 6 to 26. Additional testing will be needed to evaluate subjects with more abnormal rates. Further, all patients appeared to be in sinus rhythm on the monitor. Additional testing will be needed to evaluate subjects with irregular heart rhythms.
Additionally, this study was performed with fixed cameras and lighting. A prior study of this technology showed lower correlation for both heart rate (R ∼ 0.95) and respiratory rate (R ∼ 0.65) when the technology was used in a less controlled environment (21). (Of note, the prior study used an earlier software version and also used pulse oximetry as a HR control and visual count as an RR control.)
Further, this study provided only HR and RR. Complete vital signs typically include temperature, blood pressure, and pulse oximetry in addition to those provided here.
Future studies could also be expanded in multiple other directions. Subjects could potentially activate the device themselves, allowing for vital sign acquisition without a staff member present. With advances in target recognition and selection, a single mounted camera could be eventually be used to obtain vital sign information regarding multiple subjects in a single room. The available data could be used to trend blood pressure or other physiologic parameters such as compensatory reserve.
Overall, this technology could show benefit in multiple settings. First, it could improve frequency of vital sign acquisition in settings with crowding or low staffing. This could not only improve single-patient care, but also throughput. Second, this technology could improve care in austere and telemedical settings in which no provider would be available to take vital signs at all. Third, this technology could allow for safe vital sign acquisition from a distance in situations where patients or their immediate environments could be unsafe. Improving the software to return parameters beyond heart rate and respiratory rate would increase the potential benefits and use cases further.
Conclusions
This study shows that heart rate and respiratory can be accurately acquired using commercially available camera devices. Use of this type of non-contact measurement could improve the frequency of vital sign measurements in the ED and clinician trust in vital signs measured in the ED, potentially leading to improved patient care and throughput. This type of study helps lay the foundation for inclusion of camera-based vital signs into clinical workflows in an ER. Additional work is required to document effectiveness in busy clinical settings and the effects on workflow and timing.
Statements
Data availability statement
The raw data supporting the conclusions of this article will be made available by the authors, without undue reservation.
Ethics statement
The studies involving humans were approved by Baylor Institutional Review Board, protocol H-54364. The studies were conducted in accordance with the local legislation and institutional requirements. The participants provided their written informed consent to participate in this study.
Author contributions
AP: Conceptualization, Data curation, Formal analysis, Funding acquisition, Investigation, Methodology, Resources, Supervision, Validation, Visualization, Writing – original draft, Writing – review & editing. AZ: Data curation, Investigation, Methodology, Writing – review & editing. KK: Data curation, Investigation, Methodology, Supervision, Writing – review & editing. CC: Investigation, Methodology, Writing – review & editing. DL: Conceptualization, Formal analysis, Funding acquisition, Visualization, Writing – review & editing. EA: Conceptualization, Formal analysis, Funding acquisition, Visualization, Writing – review & editing.
Funding
The author(s) declared that financial support was received for this work and/or its publication. Grant funding from Department of Defense Award HQ08452390071 via Presage Technologies. Presage Technologies was not involved in the design of this study, data collection, or preparation of this manuscript.
Conflict of interest
AP, AZ, KK report grant money to the Baylor College of Medicine to conduct research conceived and sponsored by Presage Technologies.
The remaining author(s) declared that this work was conducted in the absence of any commercial or financial relationships that could be construed as a potential conflict of interest.
Generative AI statement
The author(s) declared that generative AI was not used in the creation of this manuscript.
Any alternative text (alt text) provided alongside figures in this article has been generated by Frontiers with the support of artificial intelligence and reasonable efforts have been made to ensure accuracy, including review by the authors wherever possible. If you identify any issues, please contact us.
Publisher’s note
All claims expressed in this article are solely those of the authors and do not necessarily represent those of their affiliated organizations, or those of the publisher, the editors and the reviewers. Any product that may be evaluated in this article, or claim that may be made by its manufacturer, is not guaranteed or endorsed by the publisher.
References
1.
Quinten VM van Meurs M Olgers TJ Vonk JM Ligtenberg JJ Maaten T et al Repeated vital sign measurements in the emergency department predict patient deterioration within 72 h: a prospective observational study. Scand J Trauma Resusc Emerg Med. (2018) 26:1–12. 10.1186/s13049-018-0525-y
2.
Candel BG Duijzer R Gaakeer MI Ter Avest E Sir Ö Lameijer H et al The association between vital signs and clinical outcomes in emergency department patients of different age categories. Emerg Med J. (2022) 39(12):903–11. 10.1136/emermed-2020-210628
3.
Barfod C Lauritzen MM Danker JK Sölétormos G Forberg JL Berlac PA et al Abnormal vital signs are strong predictors for intensive care unit admission and in-hospital mortality in adults triaged in the emergency department-a prospective cohort study. Scand J Trauma Resusc Emerg Med. (2012) 20:1–10. 10.1186/1757-7241-20-28
4.
Nguyen OK Makam AN Clark C Zhang S Xie B Velasco F et al Vital signs are still vital: instability on discharge and the risk of post-discharge adverse outcomes. J Gen Intern Med. (2017) 32:42–8. 10.1007/s11606-016-3826-8
5.
Dall’Ora C Griffiths P Hope J Briggs J Jeremy J Gerry S et al How long do nursing staff take to measure and record patients’ vital signs observations in hospital? A time-and-motion study. Int J Nurs Stud. (2021) 118:103921. 10.1016/j.ijnurstu.2021.103921
6.
Johnson KD Winkelman C Burant CJ Dolansky M Totten V . The factors that affect the frequency of vital sign monitoring in the emergency department. J Emerg Nurs. (2014) 40(1):27–35. 10.1016/j.jen.2012.07.023
7.
Hope J Dall'Ora C Redfern O Darbyshire JL Griffiths P . Why vital signs observations are delayed and interrupted on acute hospital wards: a multisite observational study. Int J Nurs Stud. (2025) 164:105018. 10.1016/j.ijnurstu.2025.105018
8.
Gravel J Opatrny L Gouin S . High rate of missing vital signs data at triage in a paediatric emergency department. Paediatr Child Health. (2006) 11(4):211–5. 10.1093/pch/11.4.211
9.
Gerdtz MF Waite R Vassiliou T Garbutt B Prematunga R Virtue E . Evaluation of a multifaceted intervention on documentation of vital signs at triage: a before-and-after study. Emerg Med Australas. (2013) 25(6):580–7. 10.1111/1742-6723.12153
10.
Miltner RS Johnson KD Deierhoi R . Exploring the frequency of blood pressure documentation in emergency departments. J Nurs Scholarsh. (2014) 46(2):98–105. 10.1111/jnu.12060
11.
Kagiyama N Hiki M Matsue Y Dohi T Matsuzawa W Daida H et al Validation of telemedicine-based self-assessment of vital signs for patients with COVID-19: a pilot study. J Telemed Telecare. (2023) 29(8):600–6. 10.1177/1357633X211011825
12.
Wu Q Mei Z Lai Z Li D Zhao D . A non-contact vital signs detection in a multi-channel 77 GHz LFMCW radar system. IEEE Access. (2021) 9:49614–28. 10.1109/ACCESS.2021.3068480
13.
Negishi T Abe S Matsui T Liu H Kurosawa M Kirimoto T et al Contactless vital signs measurement system using RGB-thermal image sensors and its clinical screening test on patients with seasonal influenza. Sensors. (2020) 20(8):2171. 10.3390/s20082171
14.
McDuff D . Camera measurement of physiological vital signs. ACM Comput Surv. (2023) 55(9):1–40. 10.1145/3558518
15.
Khanam F-T-Z Al-Naji A Perera AG Gibson K Chahl J . Non-contact automatic vital signs monitoring of neonates in NICU using video camera imaging. Comput Methods Biomech Biomed Eng Imaging Vis. (2023) 11(2):278–85. 10.1080/21681163.2022.2069598
16.
Caroppo A Manni A Rescio G Siciliano P Leone A . Vital signs estimation in elderly using camera-based photoplethysmography. Multimed Tools Appl. (2024) 83(24):65363–86. 10.1007/s11042-023-18053-3
17.
Loughlin PC Sebat F Kellett JG . Respiratory rate: the forgotten vital sign—make it count!. Jt Comm J Qual Patient Saf. (2018) 44(8):494–9. 10.1016/j.jcjq.2018.04.014
18.
Kallioinen N Hill A Christofidis MJ Horswill MS Watson MO . Quantitative systematic review: sources of inaccuracy in manually measured adult respiratory rate data. J Adv Nurs. (2021) 77(1):98–124. 10.1111/jan.14584
19.
Brabrand M Hallas P Folkestad L Lautrup-Larsen CH Brodersen JB . Measurement of respiratory rate by multiple raters in a clinical setting is unreliable: a cross-sectional simulation study. J Crit Care. (2018) 44:404–6. 10.1016/j.jcrc.2017.12.020
20.
Latten GH Spek M Muris JW Cals JW Stassen PM . Accuracy and interobserver-agreement of respiratory rate measurements by healthcare professionals, and its effect on the outcomes of clinical prediction/diagnostic rules. PLoS One. (2019) 14(10):e0223155. 10.1371/journal.pone.0223155
21.
Canepa CA Levin DR Padaki AS . Comparison of camera-acquired vital signs to conventional vital signs in a space-analog environment. Wilderness Environ Med. (2024) 36(1_suppl):10806032241291994. 10.1177/10806032241291994
Summary
Keywords
camera-acquired, emergency department, non-contact, validation, vital signs (MeSH)
Citation
Padaki AS, Zarzour AL, Keene KR, Canepa CA, Levin DR and Antonsen EL (2026) Clinical validation of non-contact vital signs in an emergency department setting. Front. Med. Technol. 7:1728913. doi: 10.3389/fmedt.2025.1728913
Received
20 October 2025
Revised
07 December 2025
Accepted
15 December 2025
Published
20 January 2026
Volume
7 - 2025
Edited by
Jeeun Kang, Johns Hopkins University, United States
Reviewed by
Edward S. Chen, Johns Hopkins Medicine, United States
Rajesh Mishra, Independent Researcher, Sterling Hospitals Ahmedabad, India
Updates
Copyright
© 2026 Padaki, Zarzour, Keene, Canepa, Levin and Antonsen.
This is an open-access article distributed under the terms of the Creative Commons Attribution License (CC BY). The use, distribution or reproduction in other forums is permitted, provided the original author(s) and the copyright owner(s) are credited and that the original publication in this journal is cited, in accordance with accepted academic practice. No use, distribution or reproduction is permitted which does not comply with these terms.
* Correspondence: Amit S. Padaki amit.padaki@bcm.edu
Disclaimer
All claims expressed in this article are solely those of the authors and do not necessarily represent those of their affiliated organizations, or those of the publisher, the editors and the reviewers. Any product that may be evaluated in this article or claim that may be made by its manufacturer is not guaranteed or endorsed by the publisher.