 Jun-Peng Pei
 Chun-Dong Zhang
 Xiang Fu1
 Dong-Qiu Dai
- 1Department of Gastrointestinal Surgery, The Fourth Affiliated Hospital of China Medical University, Shenyang, China
- 2Department of Gastrointestinal Surgery, Graduate School of Medicine, University of Tokyo, Tokyo, Japan
- 3Cancer Center, The Fourth Affiliated Hospital of China Medical University, Shenyang, China
Background: The tumor-node-metastasis classification of the American Joint Committee on Cancer classified tumor deposits (TDs) in patients with colorectal cancer (CRC) without lymph node (LN) metastasis as N1c, but the classification of TDs in patients with LN metastases remains controversial. This study investigated the probability of regarding TDs as positive LNs (pLNs) in pN stage and estimated its prognostic ability in CRC.
Methods: We used the Surveillance, Epidemiology, and End Results program to analyze CRC patients who underwent surgical therapy (14,906 training cohort, 6,384 validation cohort). A modified pN stage (mpN) was identified using the number of pLNs plus TDs. Overall survival (OS) was analyzed using the Kaplan–Meier survival curves, and significant prognostic factors were identified by univariate and multivariate analyses. Prognostic ability was estimated using the area under the curve (AUC), calibration curve, and the Akaike's information criterion (AIC). Clinical benefit was measured by the decision curve analyses (DCA). The results were validated using the validation cohort.
Results: Both the pN and mpN stages were independent prognostic factors in CRC according to univariate and multivariate analyses. The AUC analysis showed that the mpN stage had better prognostic discrimination for OS than the pN stage (0.612 vs. 0.605, P < 0.001). The AIC demonstrated that the mpN stage also showed superior model-fitting compared with the pN stage (49,756 vs. 49,841). The DCA further revealed that the mpN stage had better clinical benefits than the pN stage. The validation cohort showed similar findings.
Conclusions: We concluded that counting TDs as pLNs may be superior to the pN stage when assessing the prognosis of CRC patients.
Introduction
Colorectal cancer (CRC) is a common malignant tumor with high mortality (1). The American Joint Committee on Cancer (AJCC) tumor-node-metastasis (TNM) classification is one of the most important standards for risk assessment (2) and has been revised several times, particularly in relation to the pN stage (3–6). The TNM classification is the most basic and common classification for evaluating post-operative patient prognosis.
Tumor deposits (TDs) are defined as focal aggregates of cancer cells in the mesentery, subserosa, or pericolic tissues (7). Recent studies identified TDs as an important prognostic factor for overall survival (OS) in patients with CRC (8–11), with patients with TDs having a poorer prognosis than those without TDs. TDs were first included in the 7th AJCC TNM classification, and the pN1c stage was proposed, and pN0 CRCs with TD involvement have been reclassified into pN1c as a novel substage (5). The latest AJCC 8th TNM classification remains unchanged in this regard (6). However, although the 8th AJCC TNM classification of CRC suggests that the number of TDs should be recorded, there is no recommendation on how to categorize pN+ patients with TDs, which might influence the accuracy of CRC staging.
The possibility of counting TDs as the number of positive lymph nodes (pLNs) in the CRC has recently been investigated, and the results indicated that counting TDs as pLNs improved the predictive ability for assessing prognosis and survival in patients with CRC (12, 13). However, previous studies only included a limited number of Asian patients, with no validation cohorts from western countries. The demographic and pathological characteristics of CRC patients in Asian countries may be different from those in Western countries; therefore, it is necessary to further investigate it by Western populations. On the other hand, in the latest AJCC 8th TNM classification of gastric cancer, pathologic evaluation of LNs requires their removal and histologic examination to assess the total numbers of LNs and TDs without evidence of remnant LN tissue that were counted as pLNs (6). The current study therefore investigated the use of counting TDs as pLNs in the TNM classification, and confirmed the prognostic value of this approach in patients with CRC.
Materials and Methods
Patients
Using the Surveillance, Epidemiology, and End Results (SEER) program, 992,325 CRC patients were screened between 1975 and 2016 (14). The inclusion criteria were as follows: (1) CRCs; (2) informative variables; (3) aged between 18 and 75 years; (4) primary and single tumor; (5) no distant metastasis (M0); (6) patients with LN metastasis (pN+); (7) received surgical treatment; (8) no pre-operative therapy; and (9) longer than 1-month survival. Exclusion criteria were as follows: (1) lacking available information; (2) aged <18 or >75 years; (3) multiple cancers; (4) with distant metastasis (M1); (5) patients who were categorized as pN1c or had no pLNs; (6) no surgical treatment; (7) with pre-operative therapy; and (8) less than 1-month post-operative survival. Finally, a total of 21,290 stage III CRCs were included and randomized into a training (n = 14,906) and validation cohorts (n = 6,384), with a randomized ratio of 7:3.
Categorization
The patient selection process is shown in Figure 1. All patients were categorized according to the AJCC 8th TNM classification. We counted TDs as pLNs in the modified pN stage. The modified pN classification and modified TNM classifications were recorded as mpN stage and mTNM classification, respectively.
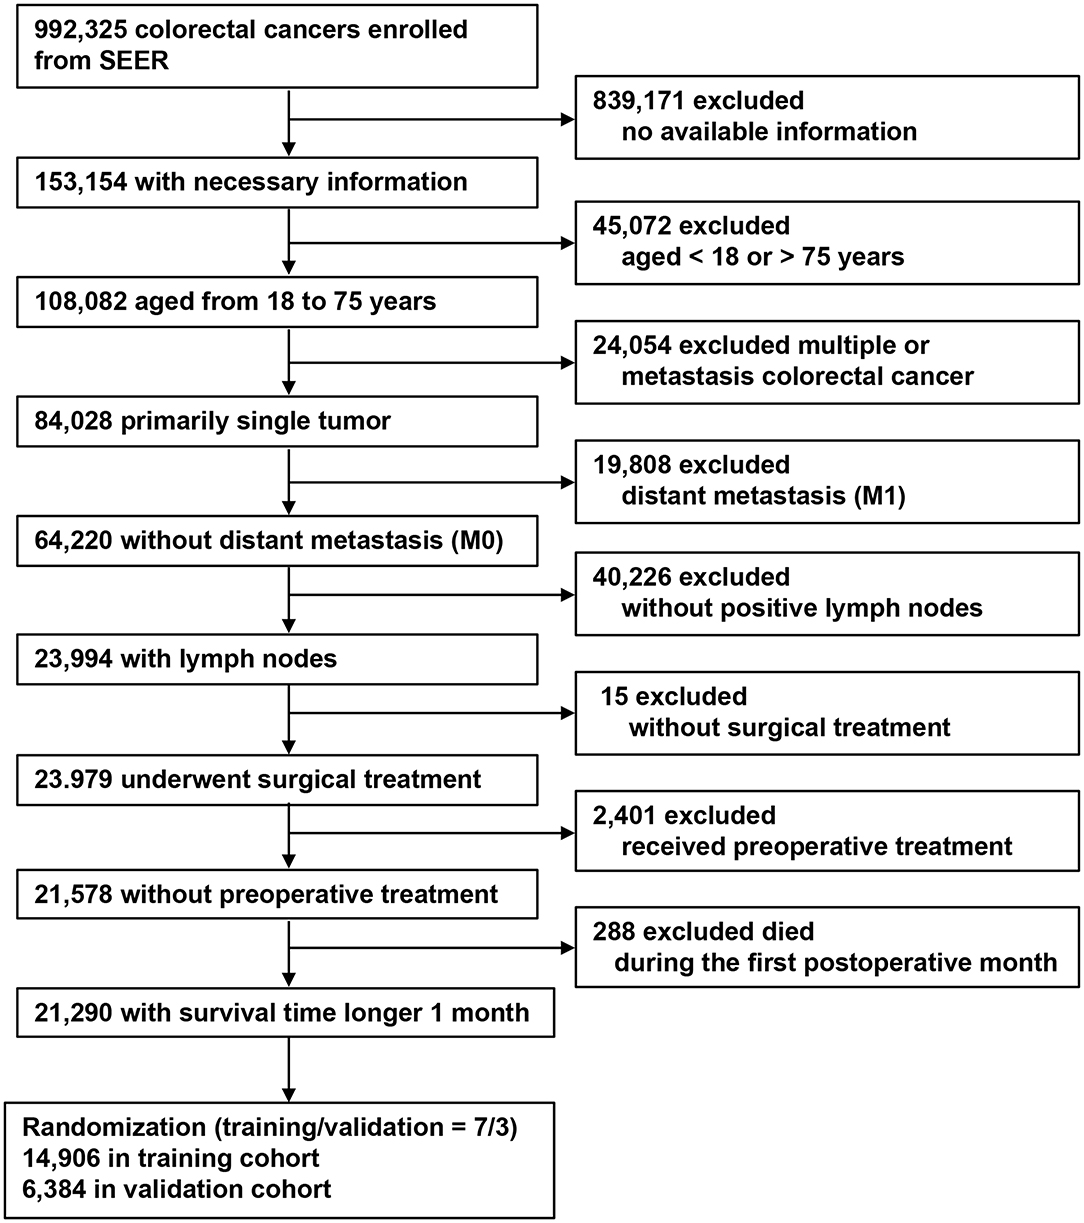
Figure 1. Flow chart for patient selection and study development.
pN stage is defined as the regional lymph nodes involvement. The details of pN stage are as follows: pN1a: 1 pLN; pN1b: 2–3 pLNs; pN2a: 4–6 pLNs; pN2b: ≥7 pLNs. The TNM staging system of stage III CRC is as follows: stages IIIA (T1N1, T2N1, and T1N2a), IIIB (T3N1, T4aN1, T2N2a, T3N2a, T1N2b, T2N2b), IIIC (T4aN2a, T3N2b, T4aN2b, T4bN1, and T4bN2) (6).
The details of mpN stage were as follows: mpN1a, 1 pLN, or TD; mpN1b, 2–3 pLNs plus TDs; mpN2a: 4–6 pLNs plus TDs; and mpN2b: ≥7 pLNs plus TDs. The mTNM staging system of stage III CRC was accordingly as follows: stages IIIA (T1mpN1, T2mpN1, and T1mpN2a), IIIB (T3mpN1, T4ampN1, T2mpN2a, T3mpN2a, T1mpN2b, and T2mpN2b), and IIIC (T4ampN2a, T3mpN2b, T4ampN2b, T4bmpN1, and T4bmpN2).
Statistical Analyses
Continuous variables were presented as medians or means with standard deviation. Survival curves were created using Kaplan–Meier methods with log-rank tests. Multivariate analyses were conducted using a Cox proportional hazards model. The predictive discrimination abilities of the models were assessed using the area under the receiver-operating characteristic curves (AUCs), and the AUCs were compared using the Hanley and McNeil tests. Model-fitting performances were assessed using the Akaike's information criterion (AIC) (15). Higher AUC values demonstrated superior predictive discrimination, and lower AIC values demonstrated better model-fitting performances. Clinical benefits were estimated by decision curve analyses (DCAs) (16, 17).
All data were analyzed using SPSS 22.0 statistical package (SPSS Inc., Chicago, IL, USA), MedCalc (Version 15.2, Ostend, Belgium), and R version 3.5.6 (http://www.r-project.org/). All tests were two-sided, and P-values less than 0.05 were considered statistically significant. A data use agreement with SEER has been obtained. The approval of the institutional review board was not required as the SEER database holds publicly available de-identified data.
Results
Patient Characteristics
The baseline characteristics of stage III CRC patients are shown in Table 1. The training cohort included 1,949 (13.1%) patients with TDs and 12,957 (86.9%) patients without TDs. Among these, 12,128 (81.4%) patients had colon cancers and 2,778 (18.6%) had rectal cancers. There were no significant differences in the distributions of baseline characteristics between the training and validation cohorts.
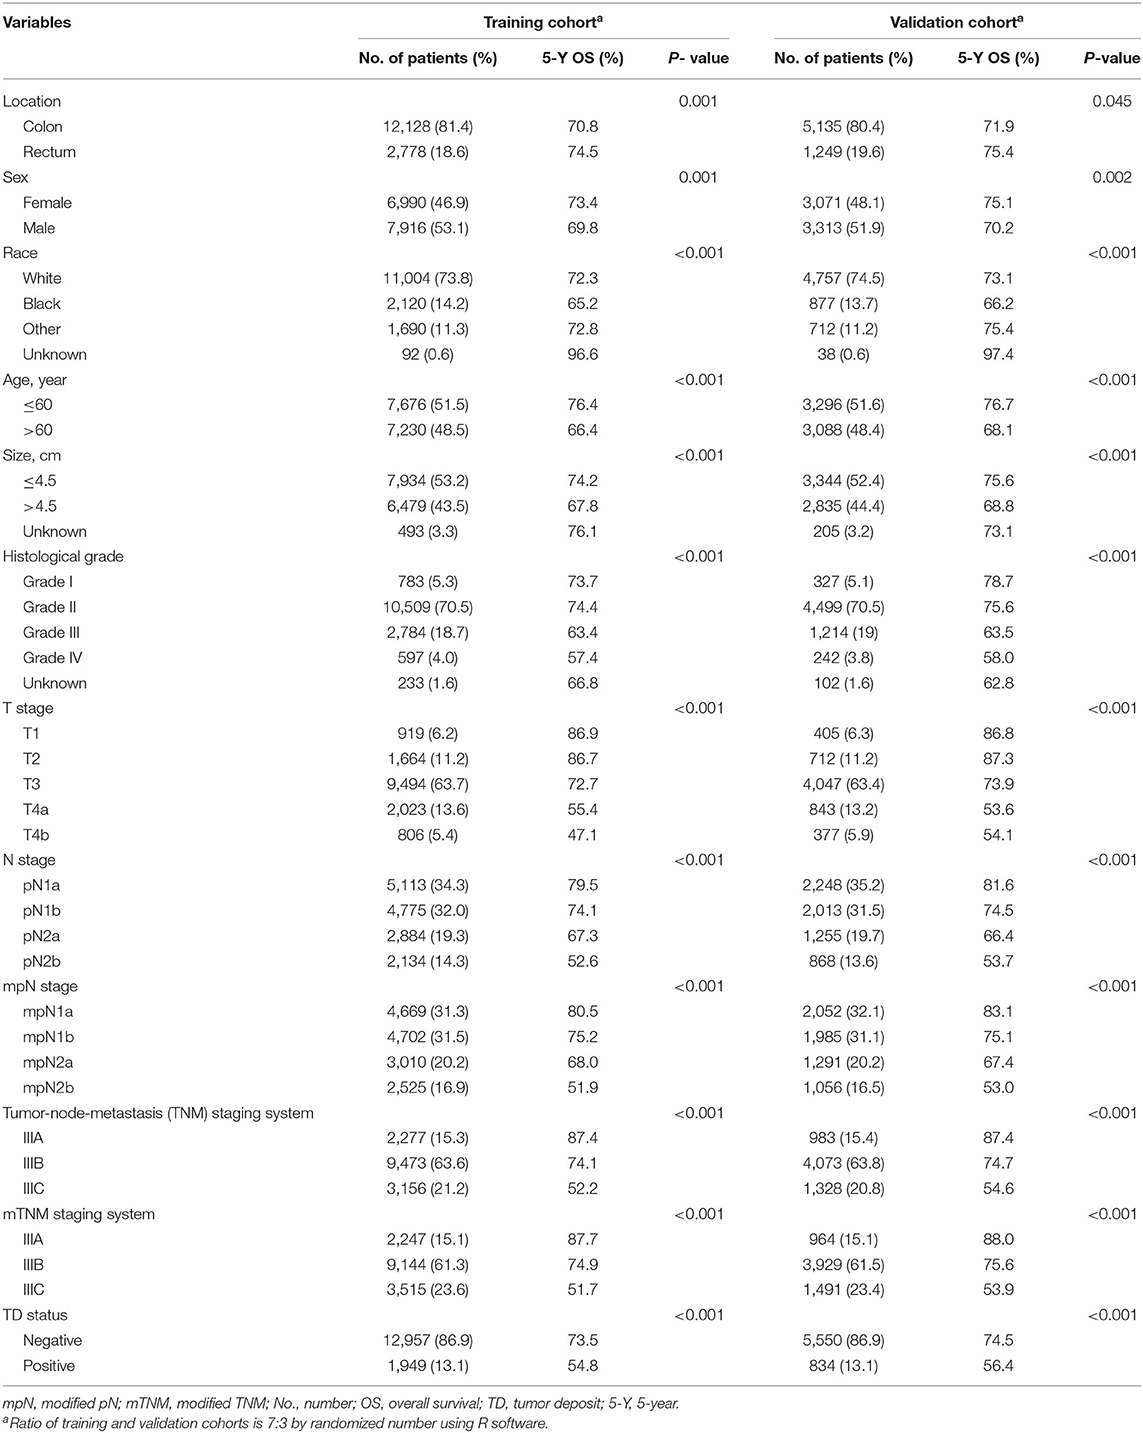
Table 1. Baseline characteristics and univariate analysis of training and validation cohorts.
Univariate and Multivariate Analyses
Univariate analysis identified tumor location, sex, race, age, size, histologic grade, pT stage, pN stage, mpN stage, and TDs as significantly correlated with OS (log-rank tests, all P < 0.05). However, because mpN stage can be regarded as an adjusted categorization of pN stage, these stages were highly correlated, and subsequent multivariate analyses were performed including either pN or mpN stage. Both the pN and mpN stage were identified as independent prognostic factors for OS by multivariate analyses (all P < 0.001) (Tables 2, 3). Similar
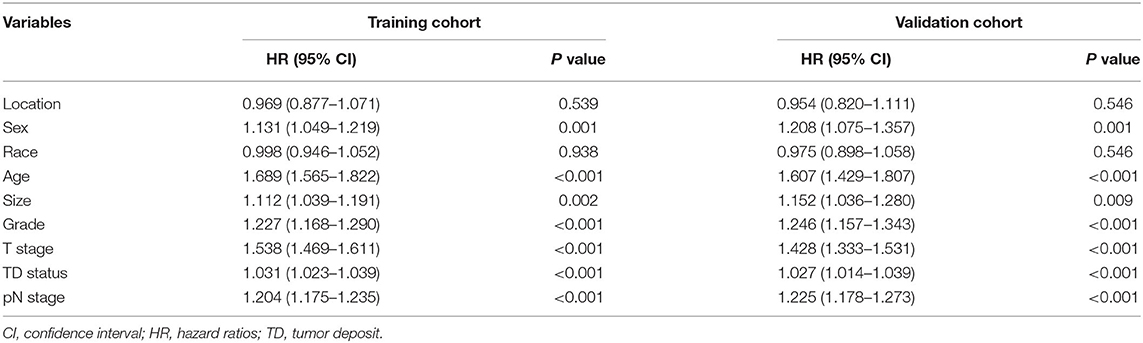
Table 2. Multivariate analysis of overall survival in colorectal cancer patients with pN stage.
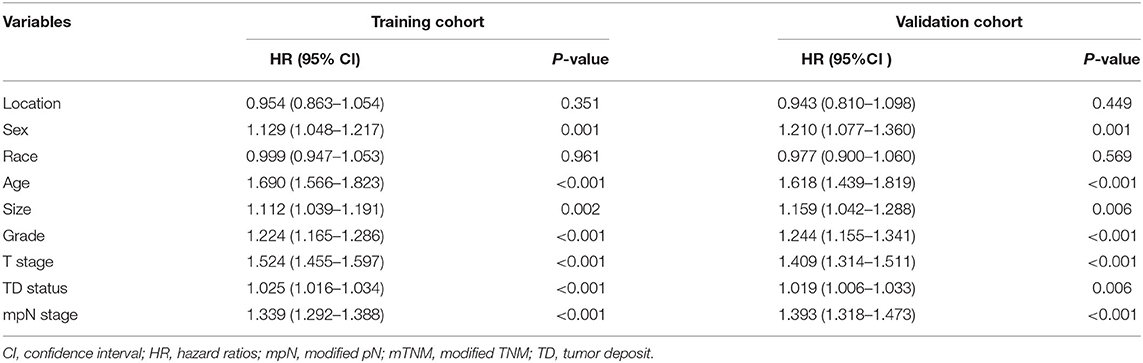
Table 3. Multivariate analysis of overall survival in colorectal cancer patients with mpN stage.
findings were observed in the validation cohort (Tables 2, 3).
Upstaging After Applying TDs as pLNs
The current study demonstrated that some patients experienced upstaging after applying TDs as number of pLNs. In the training cohort, 7.7% of patients experienced upstaging in the pN stage (Figure 2A), including 8.7% of patients in pN1a, 8.8% in pN1b, and 10.0% in pN2a stages.
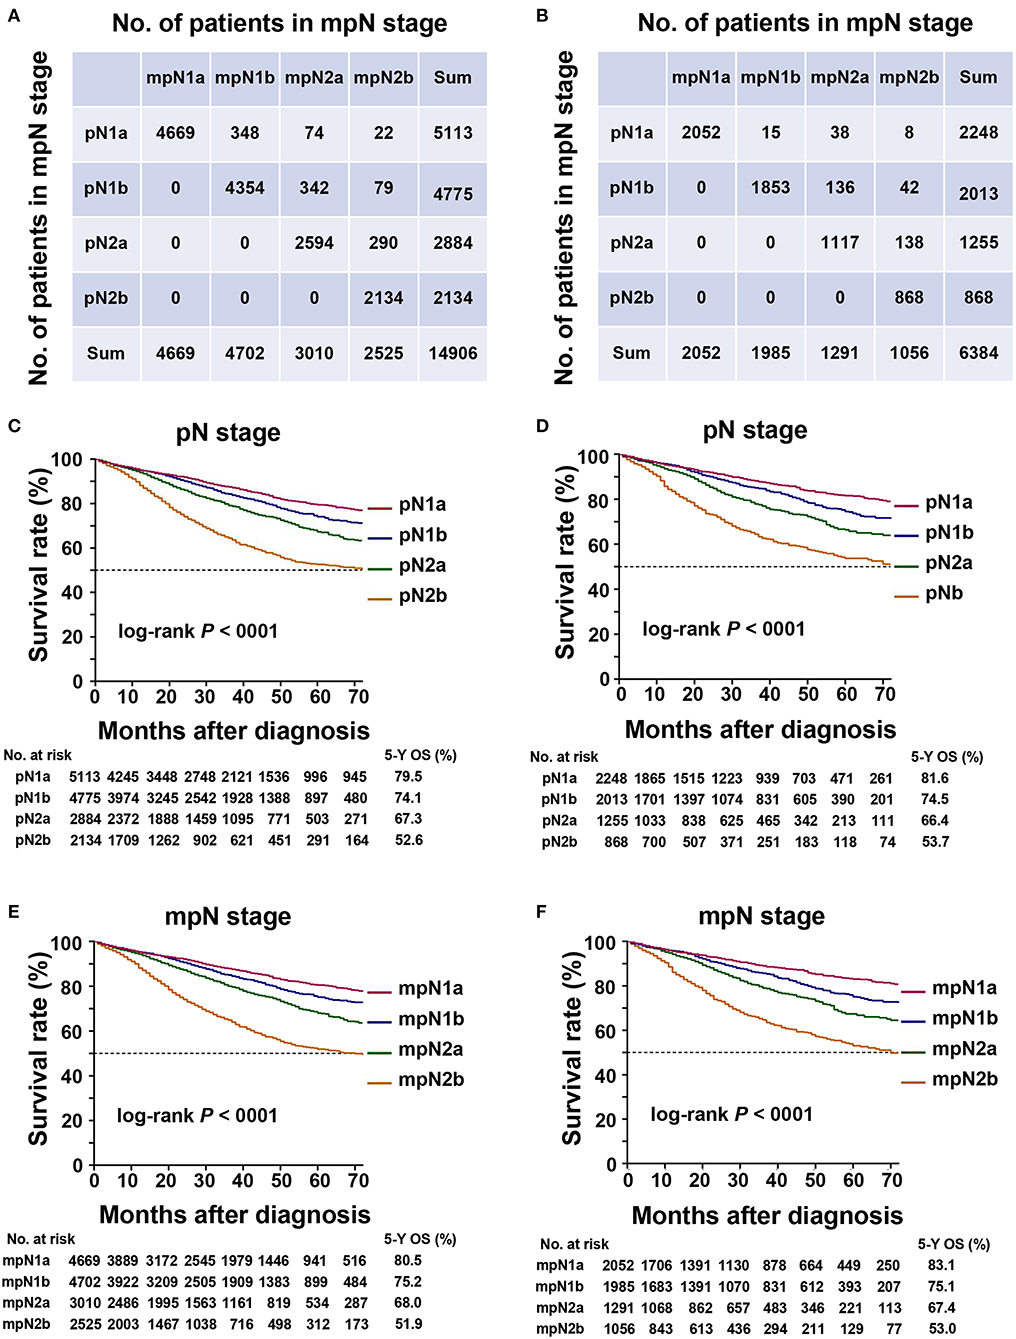
Figure 2. Staging migration and survival curves based on the pN stage and mpN stage. (A) staging migration between the tumor-node-metastases (TNM) and mTNM classification in the training cohort; (B) staging migration between the TNM and mTNM classification in the validation cohort; (C) survival curve for pN stage in the training cohort; (D) survival curve for mpN stage in the training cohort; (E) survival curve for pN staging in the validation cohort; (F) survival curve for mpN stage in the validation cohort.
In the validation cohort, 5.9% of the patients in the pN stage experienced upstaging (Figure 2B), including 2.7% of the patients in the pN1a, 8.8% in the pN1b, and 11.3% in the pN2a stages.
OS According to pN and mpN Stages
In the training cohort, the 5-year OS of patients with stages pN1a, pN1b, pN2a, and pN2b were 79.5, 74.1, 67.3, and 52.6%, respectively (Table 4, Figure 2C) (log-rank test, overall P < 0.001). The 5-year OS rates of patients with stages mpN1a, mpN1b, mpN2a, and mpN2b were 80.5, 75.2, 68.0, and 51.9%, respectively (Table 4, Figure 2E) (log-rank test, overall P < 0.001). Similar findings were observed in the validation cohort (Table 4, Figures 2D,F) (log-rank P < 0.001).
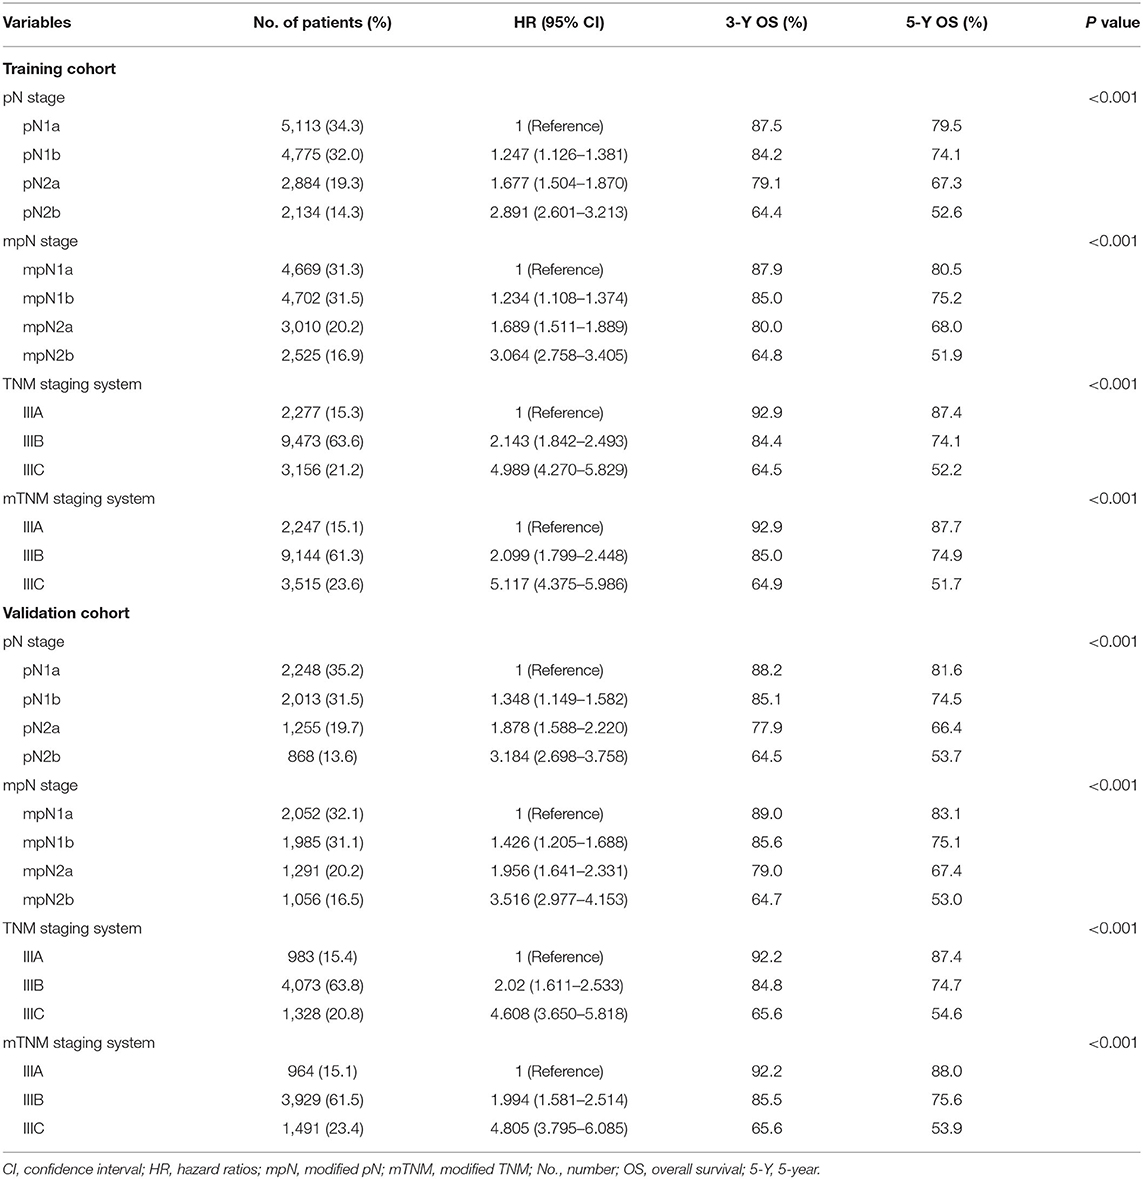
Table 4. Three- and five-year OS and 95% CI for pN stage, mpN stage, TNM staging system, and mTNM staging system in training and validation cohorts.
OS According to AJCC TNM and mTNM Classifications
In the training cohort, the 5-year OS in patients with AJCC TNM classification stages IIIA, IIIB, and IIIC were 87.4, 74.1, and 52.2%, respectively. According to the mTNM classification, the equivalent 5-year OS rates for stages IIIA, IIIB, and IIIC were 87.7, 74.9, and 51.7%, respectively. The differences between the AJCC TNM and mTNM classifications were significant (log-rank test, overall P < 0.001) (Table 4, Figures 3A,B). Similar findings were observed in the validation cohort (log-rank test, overall P < 0.001) (Table 4, Figures 3C,D).
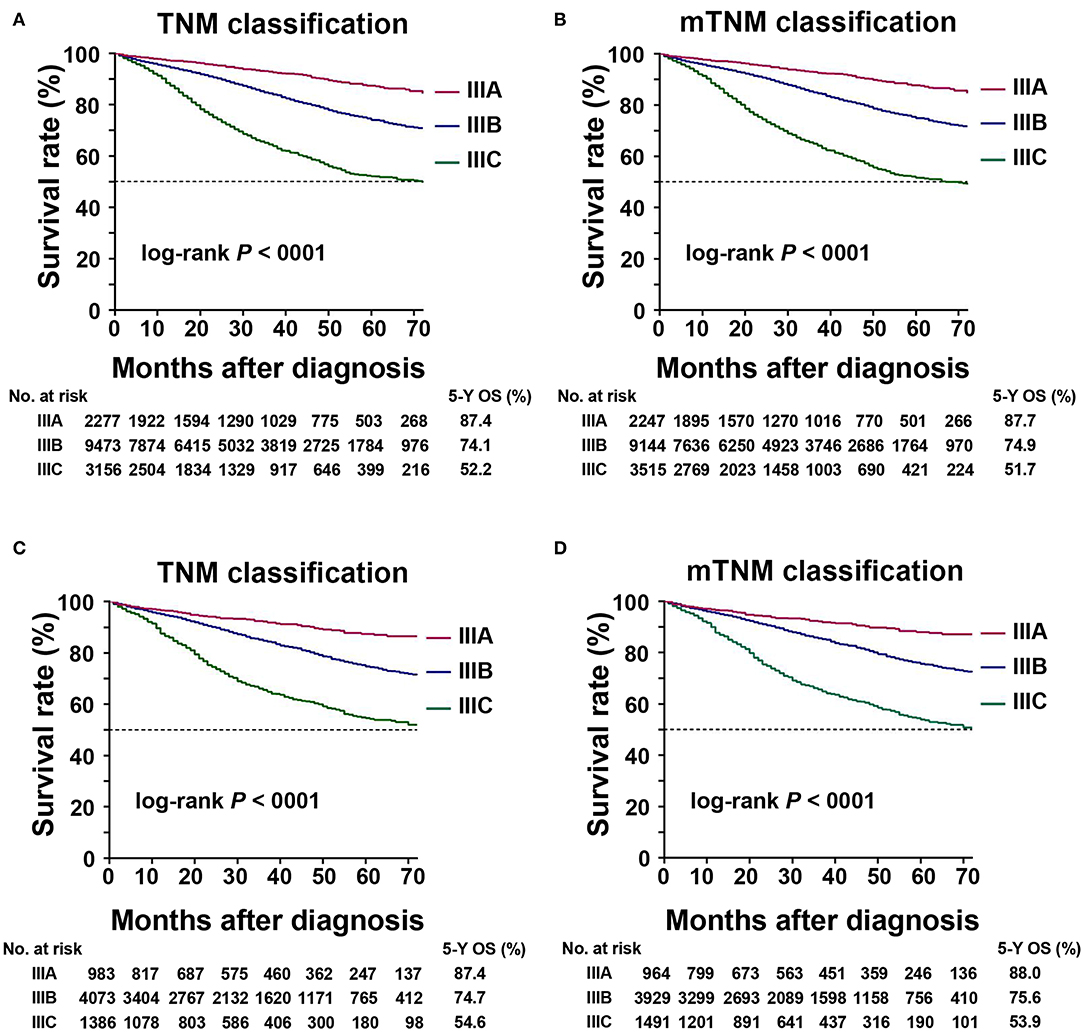
Figure 3. Kaplan–Meier survival curve for 5-year overall survival (OS) based on the TNM and mTNM classifications. (A) Kaplan–Meier survival curves based on TNM classification in training cohort; (B) Kaplan–Meier survival curves based on the mTNM classification in the training cohort; (C) Kaplan–Meier survival curves based on the TNM classification in the validation cohort; (D) Kaplan–Meier survival curves based on the mTNM classification in the validation cohort.
Weights of TDs and pLNs in Predicting OS
To determine if TDs and pLNs had similar weights for predicting patient prognosis, we compared the OS of patients with pure pLNs and those with pLNs plus TDs (Figure 4). There was no prognostic heterogeneity, indicating that TDs had the same weight as pLNs (log-rank test, all P > 0.05).
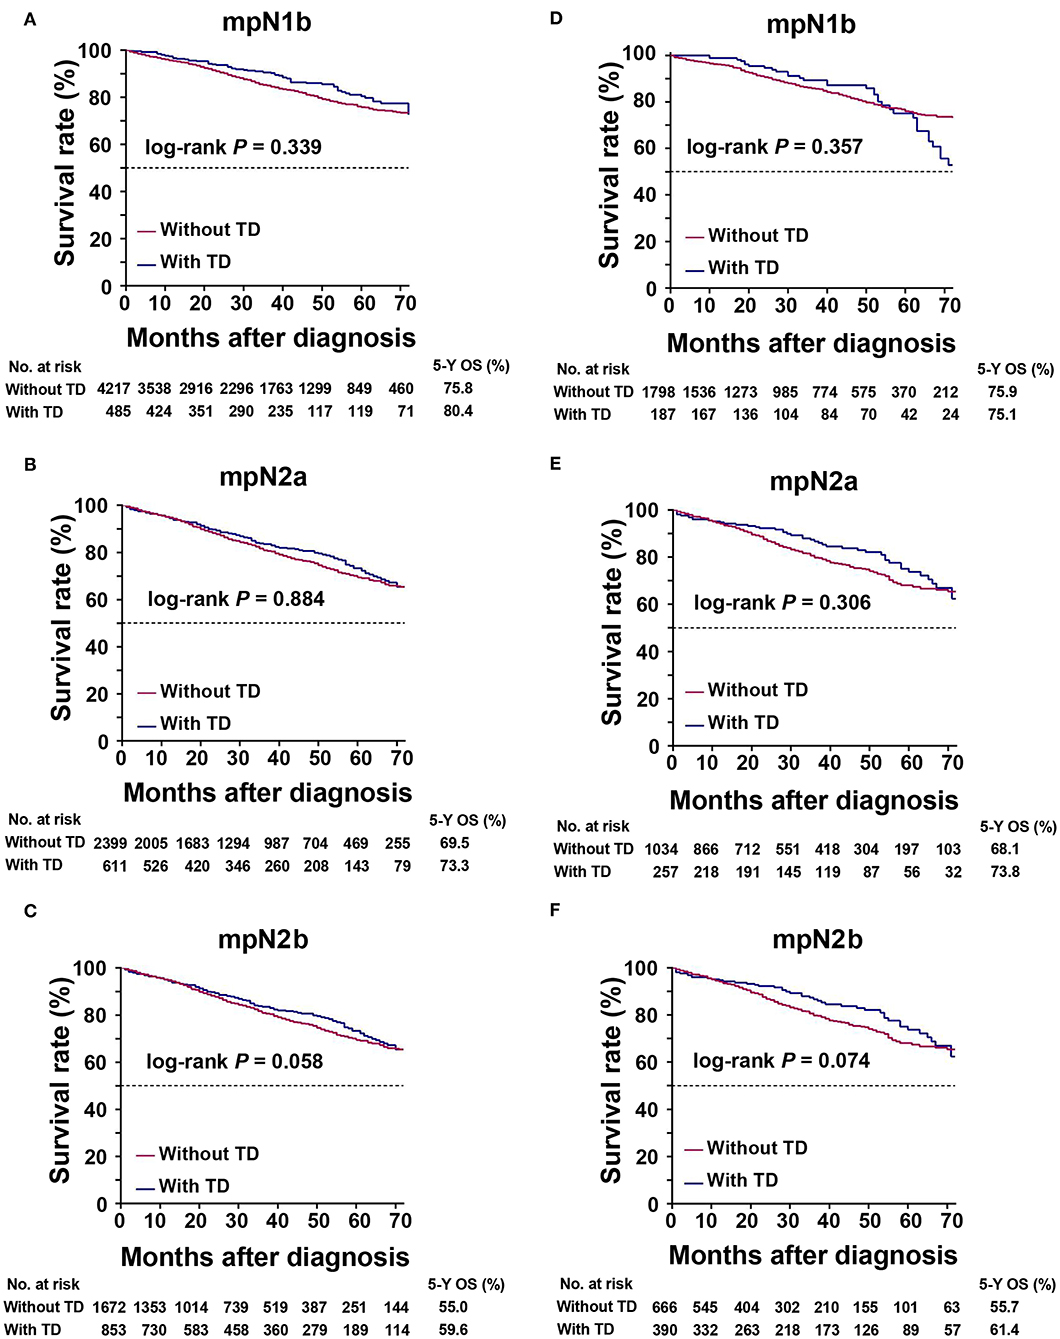
Figure 4. Kaplan–Meier survival curves for patients with or without tumor deposits (TDs) in the same mpN stages. (A) mpN1b in the training cohort; (B) mpN2a in the training cohort; (C) mpN2b in the training cohort; (D) mpN1b in the validation cohort; (E) mpN2a in the validation cohort; (F) mpN2b in the validation cohort.
Comparison of Prognostic Performance Between pN and mpN Stages
In the training cohort, the mpN stage showed superior prognostic discrimination [AUC 0.612, 95% confidence interval (CI), 0.604–0.620] compared with the pN stage (AUC 0.605, 95% CI, 0.597–0.612) (Hanley and McNeil test, P < 0.001, Figure 5A), and the mpN stage also showed better model fitting than the pN stage (AIC, 49,756 vs. 49,841). The calibration curves for probability of survival in the mpN stage at 3 and 5 years also showed better consistency between the predicted and observed survival than the pN stage (Figures 5C,D). Similar results were found in the validation cohort (Table 5, Figures 5B,E,F).
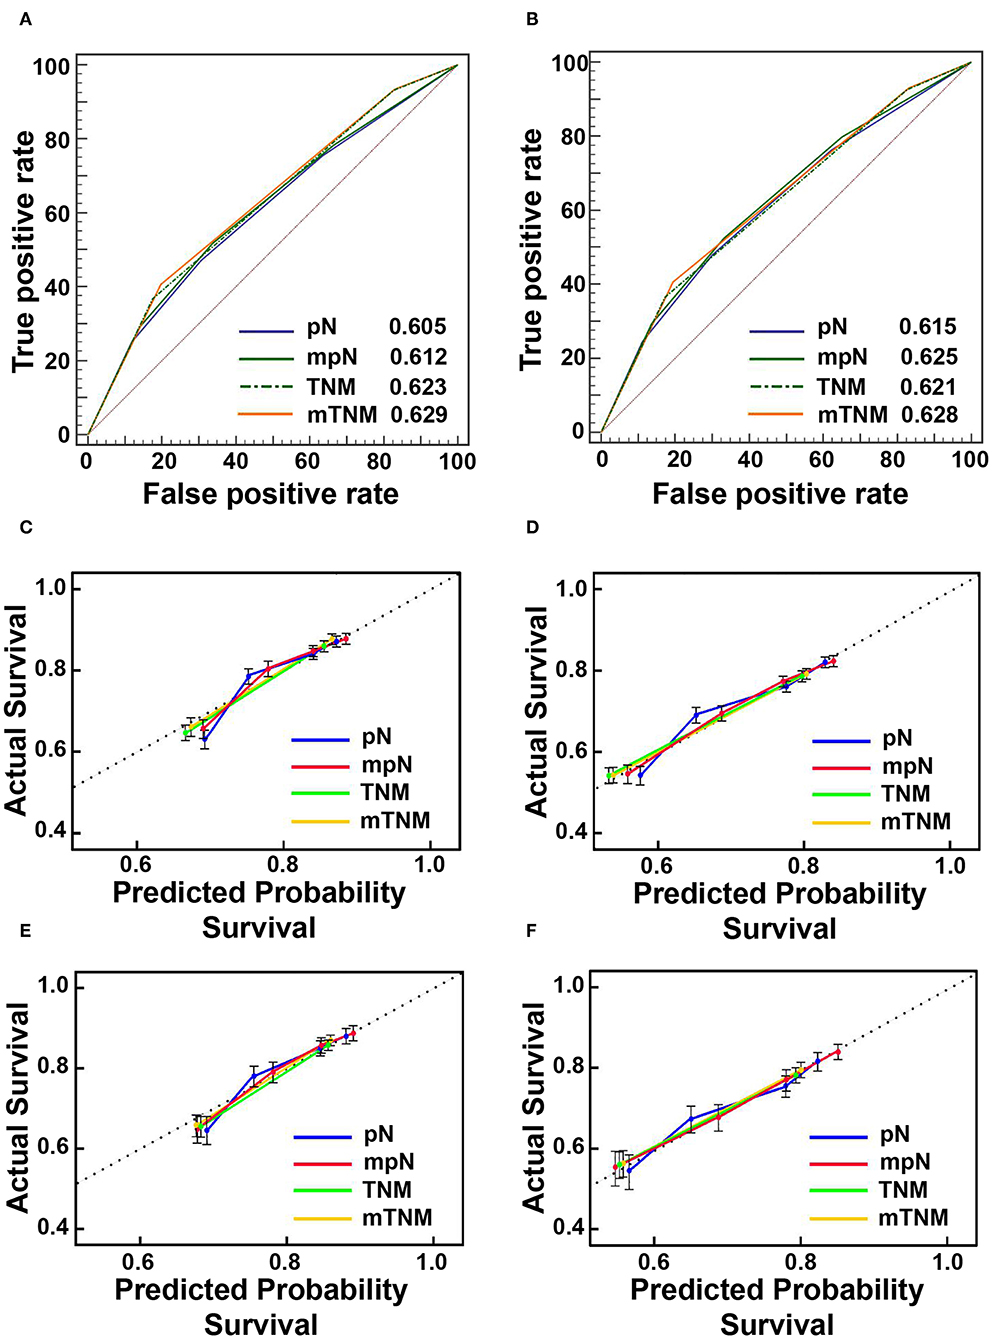
Figure 5. The areas under the curves (AUCs) and calibration curves for predicting patient survival. (A) AUCs in the training cohort; (B) AUCs in the validation cohort; (C) calibration curves of 3-year overall survival (OS) in the training cohort; (D) Calibration curves of 5-year OS in the training cohort; (E) Calibration curves of 3-year OS in the validation cohort; (F) calibration curves of 5-year OS in the validation cohort.
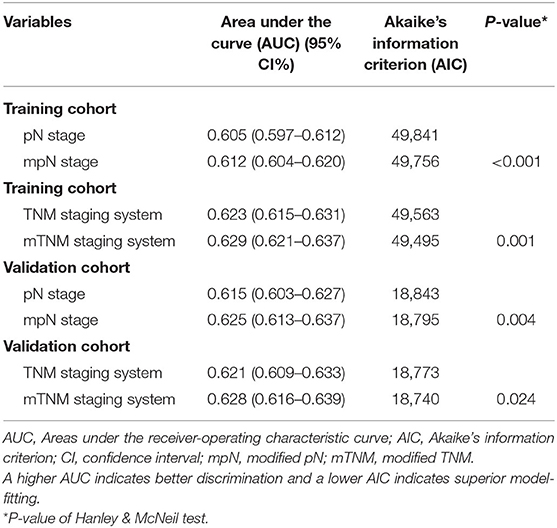
Table 5. Prognostic performances of pN stage, mpN stage, TNM staging system, and mTNM staging system in training and validation cohorts.
Comparison of Prognostic Performance Between TNM and mTNM Classifications
In the training cohort, the mTNM classification showed superior prognostic discrimination (AUC 0.629, 95% CI, 0.621–0.637) compared with the TNM stage (AUC 0.623, 95% CI, 0.615–0.631) (Hanley and McNeil test, P = 0.001, Figure 5A), and the mTNM stage showed better model fitting than the TNM stage (AIC, 49,495 vs. 49,563). The calibration curves for probability of survival in the mTNM classification at 3 and 5 years also showed better consistency between the predicted and observed survival than the AJCC TNM classification (Figures 5C,D). Similar results were found in the validation cohort (Table 5, Figures 5B,E,F).
Clinical Use
We used DCAs to evaluate the clinical usefulness of the pN stage, the mpN stage, the TNM classification, and the mTNM classification in the training and validation cohorts. In the training and validation cohorts, the mpN stage showed higher net benefit than the pN stage between threshold probabilities of about 15–25% in predicting 3-year OS, and between threshold probabilities of about 20–45% in predicting 5-year OS (Figure 6). In the training and validation cohorts, the mTNM classification showed higher net benefit than the AJCC TNM classification between threshold probabilities of about 15–30% in predicting 3-year OS, and between threshold probabilities of about 25–50% in predicting 5-year OS (Figure 6).
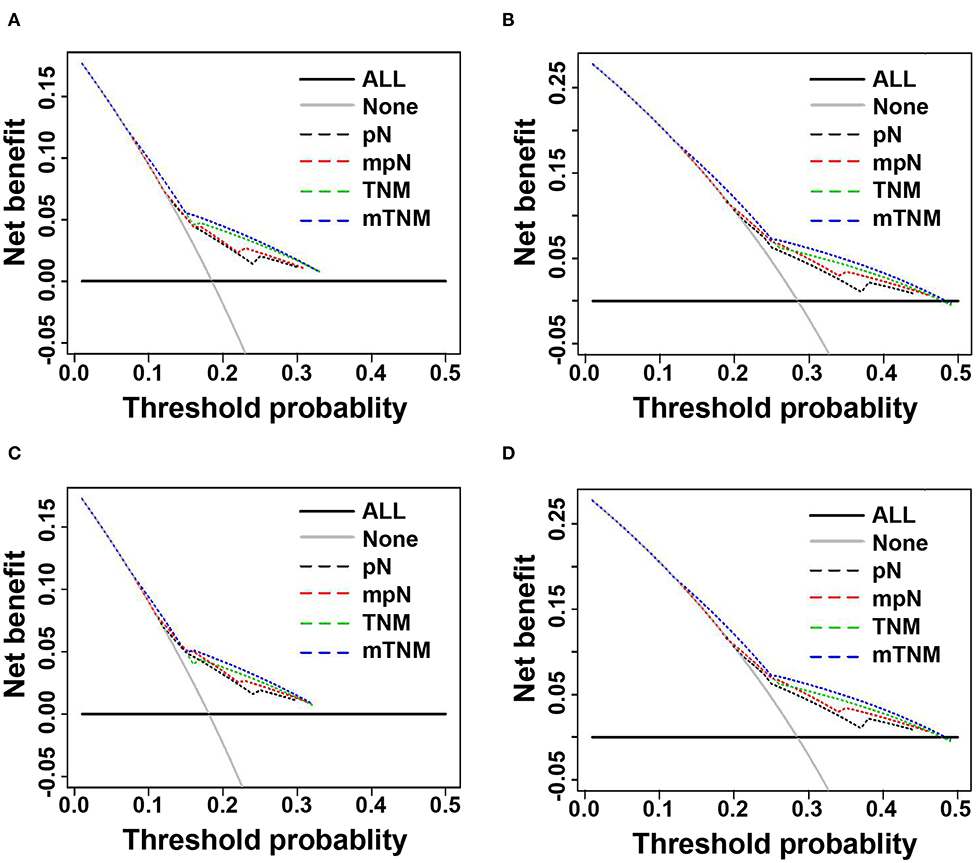
Figure 6. Decision curve analysis (DCA) of 3- and 5-years overall survival (OS) of pN phase, mpN stages, TNM classification, and mTNM classification. (A) DCAs of 3-year OS in the training cohort; (B) DCAs of 5-year OS in the training cohort; (C) DCAs of 3-year OS in the validation cohort; (D) DCAs of 5-year OS in the validation cohort.
Discussion
The prognosis of patients with CRC has gradually improved in recent decades, however, many issues remain to be resolved. Changes in the definition of TDs have caused considerable confusion among researchers and have had a significant impact on the choices of post-operative treatment and on precise prognosis (13). Gabriel et al. depicted TDs as a result of vascular tumor dissemination in 1935, however, given that TDs were located in the pericolic or perirectal fattiness not continuous with the primary tumor and unassociated with nodes, it was difficult to distinguish between TDs and LNs (18). The AJCC 5th TNM classification of CRC, therefore, proposed a 3-mm rule for positive TDs: TDs >3 mm were categorized as pLNs, and TDs ≤ 3 mm were categorized as discontinuous stage T3 tumor (3). However, the AJCC 6th TNM classification redefined TDs based on contour: the shape and glossy contour of TDs with histological proof of LNs were categorized as pLNs, while irregular TDs were categorized as pT classification and venous invasion (4). However, this contour-based rule remained unconvincing (19).
Currently, the AJCC 7th TNM classification suggests that T1 and T2 lesions without pLNs, but with TDs, are categorized as N1c, though this is not consistent because pN1c is also an option for pT3 or pT4a tumors in CRC staging (5). The AJCC 8th TNM for CRC kept the N1c stage unchanged (6) and did not provide a definition of TDs, with an impact on repeatability as a result of individual judgments by different pathologists. However, despite several changes in the TNM classification, it is still regarded as the most formidable and dependable predictor of prognosis for CRC patients worldwide (12). One study showed that the 7th TNM classification was a good predictor of prognosis in CRC patients without LN metastasis and with TDs (20). However, the latest TNM classification failed to provide further staging recommendations for patients with both TDs and pLNs, with implications for the accurate categorization of these patients.
The AJCC 8th TNM classification of gastric cancer regarded TDs as pLNs, and the number of TDs was included for pathological staging (6). Furthermore, TDs were regarded as pLNs in the Japanese categorization of CRC (21). Based on the above studies, we therefore regarded TDs as pLNs and re-identified the pN stage. Univariate analysis showed that the pN and mpN stages were both significantly related to prognosis among patients with CRC, while multivariate analysis identified both the pN and mpN stages as independent risk factors for the prognosis of these patients. The 5-year OS of patients with and without TDs were 54.8 and 73.5%, respectively (log-rank test, P < 0.001), indicating that patients with TDs had a poorer prognosis than those without TDs. Similar findings were obtained in the validation cohort and in previous studies (19, 22–24). Some patients experienced upstaging due to changes in the definition of the mpN stage. There was a clear tendency for CRC patients with TDs in the pN subgroups to be upstaged to higher stages in the mTNM classification. We determined if the mpN stage and mTNM classification were better than the pN stage and TNM classification in terms of predictive power by AUC and AIC analysis, which showed that the mpN stage and mTNM classification were more powerful than the pN stage and TNM classification in terms of prediction ability. The mpN stage and mTNM classification had a lower AIC and higher AUC (Hanley and McNeil test, all P < 0.001), indicating that in terms of predictive ability, they were more powerful than the other two models. We also analyzed the clinical benefits of the TNM and mTNM classifications by DCA, and showed that the mTNM classification had better clinical benefits than the TNM classification. In addition, there was no significant difference in the prognosis between CRC patients with and without TDs in the same mpN stage (log-rank test, all P > 0.05). The results further showed that TDs were of equal importance to pLNs in predicting the prognosis of patients with CRC. We therefore recommend regarding TDs as pLNs in the TNM classification, with the mpN stage having a stronger ability to predict the prognosis of CRC than the pN stage.
Opinions on the origin of TDs differ. One study suggested that TDs originated from carcinomas growing inside or along lymphatic or vascular structures or nerves (19), while another study indicated that TDs were potential pLNs, which were no more knew because they were replaced by tumor cells (7). Irrespective of their size, TDs were shown to have a significant impact on disease-free survival in patients with CRC, suggesting that TDs of all sizes should be regarded similarly (25). The current results showed that the mpN category and mTNM classification were superior to the pN category and TNM classification in assessing the prognosis and survival of CRC patients. In light of these results, TDs appear to have a negative effect on prognosis and similar effects on survival as pLNs.
Using the SEER database (14) makes it possible to draw reasonable conclusions consistent with general clinical practice based on a large sample of CRC patients, which would be impossible to realize in a single institutional study. However, this study had some limitations. First, even though the SEER database was regularly checked for differences, the possibility of coding or data errors remains. Second, although this study was based on a large database, it had limitations associated with its retrospective nature. In addition, the results may not be applicable in Asian populations because it was based on the SEER database of Western population, and there was no exact information of the exact number of Asian patients. Therefore, the current findings still require further validations in the Asian population. Besides, the demographic and pathological characteristics of CRC patients in Asian and Western countries are different; therefore, the current findings need to be cautious before applying it in clinical practice, particularly in Asian populations. Finally, although the difference between the two CRC classifications is statistically significant, the absolute values of AUCs are small. Therefore, the results of this study should be cautious before applying it in clinical practice and require further verification.
Conclusions
In conclusion, the current findings suggest that TDs should be regarded as pLNs when assessing the prognosis of patients with CRC. The proposed mpN stage and mTNM classification may be superior to the AJCC 8th pN stage and TNM classification for evaluating the prognosis and survival of patients with CRC.
Data Availability Statement
The raw data supporting the conclusions of this article will be made available by the authors, without undue reservation.
Ethics Statement
A data use agreement with SEER has been obtained. The approval of institutional review board was not required as the SEER database holds publicly available de-identified data. Written informed consent for participation was not required for this study in accordance with the national legislation and the institutional requirements.
Author Contributions
J-PP and C-DZ wrote the main text and performed data analysis. J-PP, C-DZ, and D-QD designed the study. J-PP, C-DZ, XF, YB, SY, and Z-MZ collected the data. All authors reviewed the manuscript.
Funding
This research was funded in part by the China Scholarship Council, grant number 201908050148.
Conflict of Interest
The authors declare that the research was conducted in the absence of any commercial or financial relationships that could be construed as a potential conflict of interest.
Acknowledgments
We acknowledge the efforts of the Surveillance, Epidemiology, and End Results (SEER) Program tumor registries for creating the SEER database (https://seer.cancer.gov/).
References
1. Siegel RL, Miller KD, Jemal A. Cancer statistics, 2019. CA Cancer J Clin. (2019) 69:7–34. doi: 10.3322/caac.21551
2. Greene FL. Current TNM staging of colorectal cancer. Lancet Oncol. (2007) 8:572–3. doi: 10.1016/S1470-2045(07)70185-7
3. Sobin L, Wittekind C. TNM Classification of Malignant Tumors. 5th ed. New York, NY: John Wiley & Sons (1997).
4. Sobin L, Wittekind C. TNM: Classification of Malignant Tumours. 6th ed. New York, NY: Wiley (2002).
5. Edge SB, Byrd DR, Carducci MA, Compton CC, Fritz A, Greene F. AJCC Cancer Staging Manual. New York, NY: Springer (2010).
6. Amin MB, Edge S, Greene F, Byrd DR, Brookland RK, Washington MK, et al. AJCC Cancer Staging Manual. 8th ed. New York, NY: Springer (2016).
7. Belt ET, van Stijn M, Bril H, de Lange-de Klerk E, Meijer G, Meijer S, et al. Lymph node negative colorectal cancers with isolated tumor deposits should be classified and treated as stage III. Ann Surg Oncol. (2010) 17:3203–11. doi: 10.1245/s10434-010-1152-7
8. Liu F, Zhao J, Li C, Wu Y, Song W, Guo T, et al. The unique prognostic characteristics of tumor deposits in colorectal cancer patients. Ann Transl Med. (2019) 7:769. doi: 10.21037/atm.2019.11.69
9. Pricolo VE, Steingrimsson J, McDuffie TJ, McHale JM, McMillen B, Shparber M. Tumor deposits in stage III colon cancer: correlation with other histopathologic variables, prognostic value, and risk stratification—time to consider “N2c”. Am J Clin Oncol. (2020) 43:133. doi: 10.1097/COC.0000000000000645
10. Basnet S, Lou Q-f, Liu N, Rana R, Shah A, Khadka M, et al. Tumor deposit is an independent prognostic indicator in patients who underwent radical resection for colorectal cancer. J Cancer. (2018) 9:3979. doi: 10.7150/jca.27475
11. Mayo E, Llanos AA, Yi X, Duan SZ, Zhang L. Prognostic value of tumour deposit and perineural invasion status in colorectal cancer patients: a SEER-based population study. Histopathology. (2016) 69:230–8. doi: 10.1111/his.12936
12. Song YX, Gao P, Wang ZN, Liang JW, Sun Z, Wang MX, et al. Can the tumor deposits be counted as metastatic lymph nodes in the UICC TNM staging system for colorectal cancer? PLoS ONE. (2012) 7:e34087. doi: 10.1371/journal.pone.0034087
13. Li J, Yang S, Hu J, Liu H, Du F, Yin J, et al. Tumor deposits counted as positive lymph nodes in TNM staging for advanced colorectal cancer: a retrospective multicenter study. Oncotarget. (2016) 7:18269. doi: 10.18632/oncotarget.7756
14. Surveillance Epidemiology End Results (SEER) Program (.seer.cancer.gov">www.seer.cancer.gov) SEER*Stat Database: Incidence - SEER 18 Regs Custom Data (With Additional Treatment Fields). Nov 2017 Sub (1973–2015 varying) - Linked To County Attributes - Total U.S., 1969–2016 Counties. National Cancer Institute, DCCPS, Surveillance Research Program (2018).
15. Akaike H. A new look at the statistical model identification. IEEE Transact Automat Control. (1974) 19:716–23. doi: 10.1109/TAC.1974.1100705
16. Vickers AJ, Elkin EB. Decision curve analysis: a novel method for evaluating prediction models. Med Decis Mak. (2006) 26:565–74. doi: 10.1177/0272989X06295361
17. Fitzgerald M, Saville BR, Lewis RJ. Decision curve analysis. Jama. (2015) 313:409–10. doi: 10.1001/jama.2015.37
18. Gabriel W, Dukes C, Bussey H. Lymphatic spread in cancer of the rectum. Br J Surg. (1935) 23:395–413. doi: 10.1002/bjs.1800239017
19. Nagtegaal I, Quirke P. Colorectal tumour deposits in the mesorectum and pericolon; a critical review. Histopathology. (2007) 51:141–9. doi: 10.1111/j.1365-2559.2007.02720.x
20. Tong L-l, Gao P, Wang Z-n, Song Y-x, Xu Y-y, Sun Z, et al. Is the seventh edition of the UICC/AJCC TNM staging system reasonable for patients with tumor deposits in colorectal cancer? Ann Surg. (2012) 255:208–13. doi: 10.1097/SLA.0b013e31821ad8a2
21. Sugihara K. Japanese Society for Cancer of the Colon and Rectum: Japanese Classification of Colorectal Carcinoma. 2nd ed. Tokyo: Kanehara (2009). p. 27–8.
22. Nagtegaal ID, Tot T, Jayne DG, McShane P, Nihlberg A, Marshall HC, et al. Lymph nodes, tumor deposits, and TNM: are we getting better? J Clin Oncol. (2011) 29:2487–92. doi: 10.1200/JCO.2011.34.6429
23. Ueno H, Hashiguchi Y, Shimazaki H, Shinto E, Kajiwara Y, Nakanishi K, et al. Peritumoral deposits as an adverse prognostic indicator of colorectal cancer. Am J Surg. (2014) 207:70–7. doi: 10.1016/j.amjsurg.2013.04.009
24. Jin M, Roth R, Rock JB, Washington MK, Lehman A, Frankel WL. The impact of tumor deposits on colonic adenocarcinoma AJCC TNM staging and outcome. Am J Surg Pathol. (2015) 39:109. doi: 10.1097/PAS.0000000000000320
25. Goldstein NS, Turner JR. Pericolonic tumor deposits in patients with T3N+ MO colon adenocarcinomas: markers of reduced disease intra-abdominal metastases and their implications for TNM classification. Cancer. (2000) 88:2228–38. doi: 10.1002/(SICI)1097-0142(20000515)88:10<2228::AID-CNCR5>3.0.CO;2-1
Keywords: colorectal cancer, tumor deposit, prognosis, lymph node, overall survival
Citation: Pei J-P, Zhang C-D, Fu X, Ba Y, Yue S, Zhao Z-M and Dai D-Q (2020) A Modified Tumor-Node-Metastasis Classification for Stage III Colorectal Cancers Based on Treating Tumor Deposits as Positive Lymph Nodes. Front. Med. 7:571154. doi: 10.3389/fmed.2020.571154
Received: 10 June 2020; Accepted: 14 September 2020;
Published: 15 October 2020.
Edited by:
Angel Lanas, University of Zaragoza, SpainReviewed by:
Yin Wen Zhen, Peking University, ChinaAlejandro Piscoya, Universidad San Ignacio de Loyola, Peru
Yanwen Qin, Capital Medical University, China
Copyright © 2020 Pei, Zhang, Fu, Ba, Yue, Zhao and Dai. This is an open-access article distributed under the terms of the Creative Commons Attribution License (CC BY). The use, distribution or reproduction in other forums is permitted, provided the original author(s) and the copyright owner(s) are credited and that the original publication in this journal is cited, in accordance with accepted academic practice. No use, distribution or reproduction is permitted which does not comply with these terms.
*Correspondence: Dong-Qiu Dai, Y211ZGFpZHFAMTI2LmNvbQ==; ZGFpZHE2M0AxNjMuY29t
†These authors have contributed equally to this work and share first authorship