 Baoguo Pang1†Haijun Li2†Qin Liu3†Penghui Wu4†Tingting Xia3Xiaoxian Zhang4Wenjun Le5Jianyu Li3
 Lihua Lai3
 Changxing Ou4
 Jianjuan Ma6
 Shuai Liu7
 Fuling Zhou8Xinlu Wang9
 Jiaxing Xie10
 Qingling Zhang4*
 Min Jiang11*Yumei Liu12*
 Qingsi Zeng3*
- 1Department of Radiology, Huangpi District Hospital of Traditional Chinese Medicine, Wuhan, China
- 2Department of Radiology, Han Kou Hospital of Wuhan, Wuhan, China
- 3Department of Radiology, The First Affiliated Hospital of Guangzhou Medical University, Guangzhou, China
- 4Pulmonary and Critical Care Medicine, National Clinical Research Center for Respiratory Disease, National Center for Respiratory Medicine, State Key Laboratory of Respiratory Diseases, Guangzhou Institute of Respiratory Health, The First Affiliated Hospital of Guangzhou Medical University, Guangzhou, China
- 5Department of Respiratory, First Affiliated Hospital of Guangxi University of Science and Technology, Liuzhou, China
- 6Department of Pediatric Hematology, Affiliated Hospital of Guizhou Medical University, Guiyang, China
- 7Department of Hematology, Dawu County People's Hospital, Wuhan, China
- 8Department of Hematology, Zhongnan Hospital of Wuhan University, Wuhan, China
- 9Department of Nuclear Medicine, The First Affiliated Hospital of Guangzhou Medical University, Guangzhou, China
- 10National Clinical Research Center for Respiratory Disease, State Key Laboratory of Respiratory Diseases, Department of Allergy and Clinical Immunology, Guangzhou Institute of Respiratory Health, The First Affiliated Hospital of Guangzhou Medical University, Guangzhou, China
- 11Department of Pediatrics, The First Affiliated Hospital of Guangxi Medical University, Nanning, China
- 12Department of Respiratory, Hankou Hospital of Wuhan, Wuhan, China
Objective: Early identification of coronavirus disease 2019 (COVID-19) patients with worse outcomes may benefit clinical management of patients. We aimed to quantify pneumonia findings on CT at admission to predict progression to critical illness in COVID-19 patients.
Methods: This retrospective study included laboratory-confirmed adult patients with COVID-19. All patients underwent a thin-section chest computed tomography (CT) scans showing evidence of pneumonia. CT images with severe moving artifacts were excluded from analysis. Patients' clinical and laboratory data were collected from medical records. Three quantitative CT features of pneumonia lesions were automatically calculated using a care.ai Intelligent Multi-disciplinary Imaging Diagnosis Platform Intelligent Evaluation System of Chest CT for COVID-19, denoting the percentage of pneumonia volume (PPV), ground-glass opacity volume (PGV), and consolidation volume (PCV). According to Chinese COVID-19 guidelines (trial version 7), patients were divided into noncritical and critical groups. Critical illness was defined as a composite of admission to the intensive care unit, respiratory failure requiring mechanical ventilation, shock, or death. The performance of PPV, PGV, and PCV in discrimination of critical illness was assessed. The correlations between PPV and laboratory variables were assessed by Pearson correlation analysis.
Results: A total of 140 patients were included, with mean age of 58.6 years, and 85 (60.7%) were male. Thirty-two (22.9%) patients were critical. Using a cutoff value of 22.6%, the PPV had the highest performance in predicting critical illness, with an area under the curve of 0.868, sensitivity of 81.3%, and specificity of 80.6%. The PPV had moderately positive correlation with neutrophil (%) (r = 0.535, p < 0.001), erythrocyte sedimentation rate (r = 0.567, p < 0.001), D-Dimer (r = 0.444, p < 0.001), high-sensitivity C-reactive protein (r = 0.495, p < 0.001), aspartate aminotransferase (r = 0.410, p < 0.001), lactate dehydrogenase (r = 0.644, p < 0.001), and urea nitrogen (r = 0.439, p < 0.001), whereas the PPV had moderately negative correlation with lymphocyte (%) (r = −0.535, p < 0.001).
Conclusions: Pneumonia volume quantified on initial CT can non-invasively predict the progression to critical illness in advance, which serve as a prognostic marker of COVID-19.
Introduction
The rapid spread of coronavirus disease 2019 (COVID-19) has been a global pandemic and a major and urgent threat to the health care system worldwide (1). More than 100 million cases have been reported globally (2). Most COVID-19 patients had mild symptoms of respiratory infection, such as fever and dry cough, but some patients could rapidly develop fatal complications, including respiratory failure requiring mechanical ventilation, septic shock, or even death (3). Until now, no specific treatment strategies have been used in dealing with COVID-19 (4); thus, it is of great importance to predict COVID-19 with worse outcomes, which would enable the introduction of timely treatment and reduce the mortality of patients.
Chest computed tomography (CT) can play a valuable role in screening, diagnosis, and follow-up of COVID-19 patients (5). However, chest CT images are usually interpreted by radiologists, which is subjective with large interobserver and intraobserver variability and thus unable to accurately and quantitatively evaluate the disease severity and is also time-consuming and inefficient (6). Recently, radiomics use a variety of mathematical methods to convert chest CT images into a huge number of minable high-dimensional handcrafted features for predicting prognosis or outcome of COVID-19 patients (7–17). Radiomic features can be used as surrogate biomarkers for biological disease traits such as morphology and heterogeneity. The combination of clinical characteristics and radiomic features from CT could achieve better accuracy in prediction (18, 19). Some studies also apply deep learning to automatically learn features from CT images or in combination with clinical data and radiomics for risk assessment of COVID-19 (20–34). Deep learning and radiomics can be a more objective, quantitative, and stable system for the assessment of the COVID-19 disease course.
The interpretation of quantitative CT features is of great importance for understanding their potential biological meaning. Several biomarkers identified from laboratory features have been used to assess the probability of progressing to severe state in COVID-19 patients (35–38). Therefore, we aimed to investigate the prognostic value of quantitative CT features in predicting the occurrence of critical illness in patients with COVID-19 and the correlation with laboratory features.
Materials and Methods
Patient Cohort
This retrospective study was approved by the ethics committee of our hospitals, and the requirement for informed consent was waived. We included COVID-19 patients who admitted to three designated hospitals from December 31, 2019, to March 31, 2020.
The inclusion criteria were as follows: (1) adult patients; (2) positive real-time reverse transcription polymerase chain reaction testing for COVID-19 on throat swabs; (3) a thin-section chest CT scan showing any evidence of pneumonia; and (4) patients admitted for antiviral treatment. Patients with mechanical ventilation in the course were excluded because of the severe moving artifacts in chest CT images. Figure 1 shows the pathway of patient inclusion. After admission, clinical data including demographics, comorbidities, and symptoms of patients and laboratory tests were collected. The data in source documents were confirmed independently by at least two researchers.
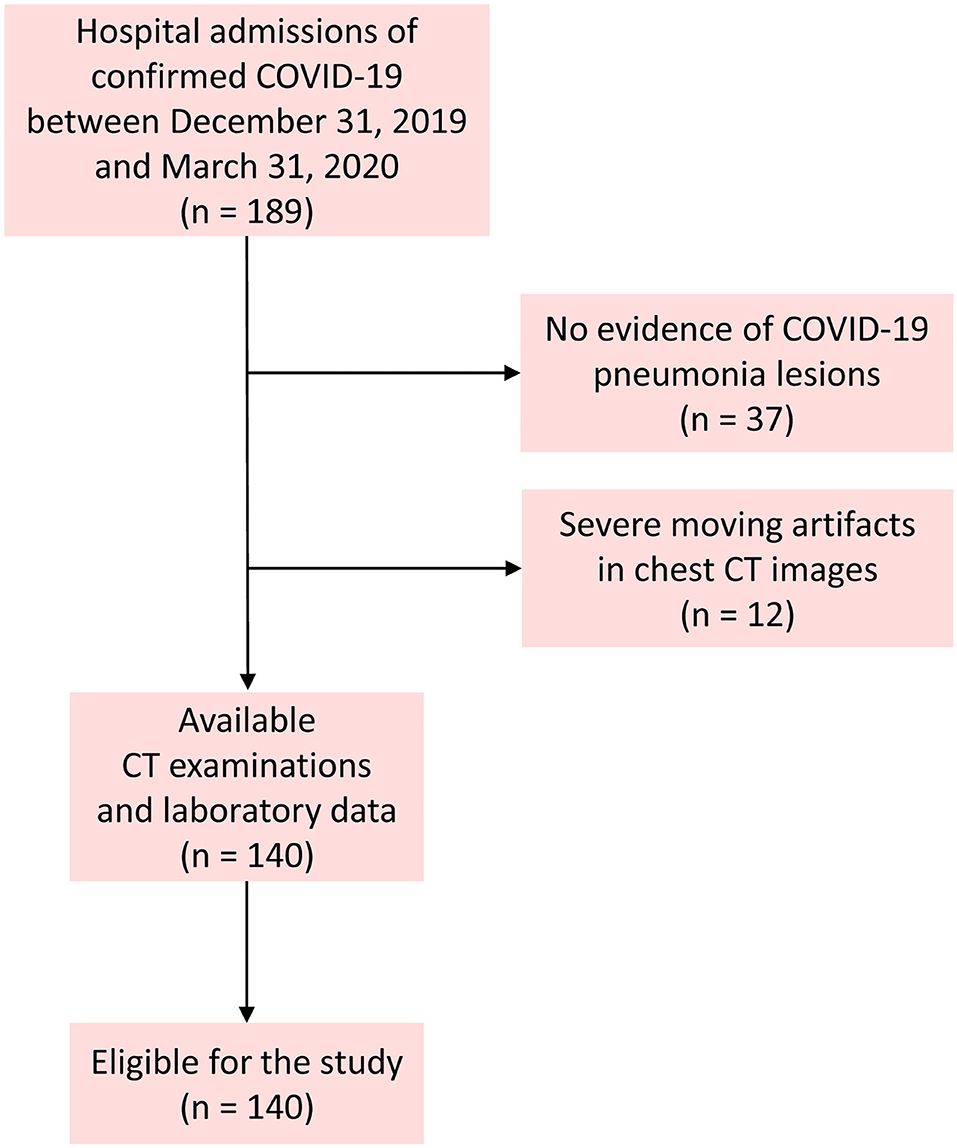
Figure 1. Flowchart of the patient inclusion.
CT Image Acquisition
Subjects were referred to the radiology department based on the algorithm suggested by evidence presented by the World Health Organization (39). All patients underwent chest CT scans by a 64-slice CT scanner (Siemens Definition AS + 128, Forchheim, Germany). All patients were scanned in the supine position from the lung apex to the diaphragm during end-inspiration. To reduce breathing artifacts, patients were instructed on breath-holding. No contrast agent was administered. CT acquisition was executed as follows: tube voltage, 120 kV; tube current, auto mAs; pitch, 1.2; rotation time, 0.5 s; field of view, 330 × 330 mm. Lung images were reconstructed at a slice thickness of 1.0 or 1.25 mm using I50 medium sharp algorithm. Lung window level and window width were set as −530 to 430 Hounsfield units (HU) and 1,400–1,600 HU, respectively.
Quantitative CT Analysis
The quantification analysis of CT images was performed by a care.ai Intelligent Multi-disciplinary Imaging Diagnosis Platform Intelligent Evaluation System of Chest CT for COVID-19 (YT-CT-Lung, YITU Healthcare Technology Co., Ltd., China). This system was constructed using a combination of U-net and fully convolutional networks (40, 41), which consists of three different network components: (1) 12 convolutional segments, which included convolutional layer (Conv2d), batch normalization layer, and an activation layer; (2) three max-pooling layers for down-sampling; and (3) three transpose convolutional layer for up-sampling (Figure 2). The development of the COVID-Lesion Net has been described in a previous study (42).
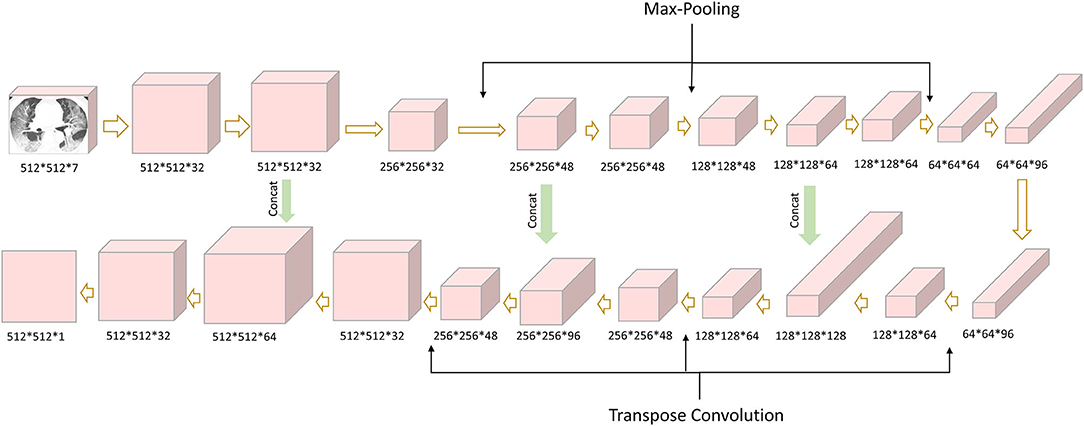
Figure 2. COVID-Lesion Net structure for pneumonia detection and segmentation.
Subsequently, by thresholding on CT values in the pneumonia lesions using two-dimensional neural network for classification, two quantitative features were generated, that is, ground-glass opacities (GGOs) with value ranges of −600 to −500 HU and consolidation with density ranges of −250 to 60 HU (43). A quantitative analysis of pneumonia lesions, GGO, and consolidation was performed based on the segmentation results, including the percentage of pneumonia volume (PPV), GGO volume (PGV), and consolidation volume (PCV) in both lungs, left lung, right lung, and five lobes (Figure 3). It took about 10 s to calculate the various CT parameters. All the image segmentations were reviewed independently and assessed by two radiologists (with 10 and 20 years of experience in thoracic imaging), and discrepancies were resolved by consensus.
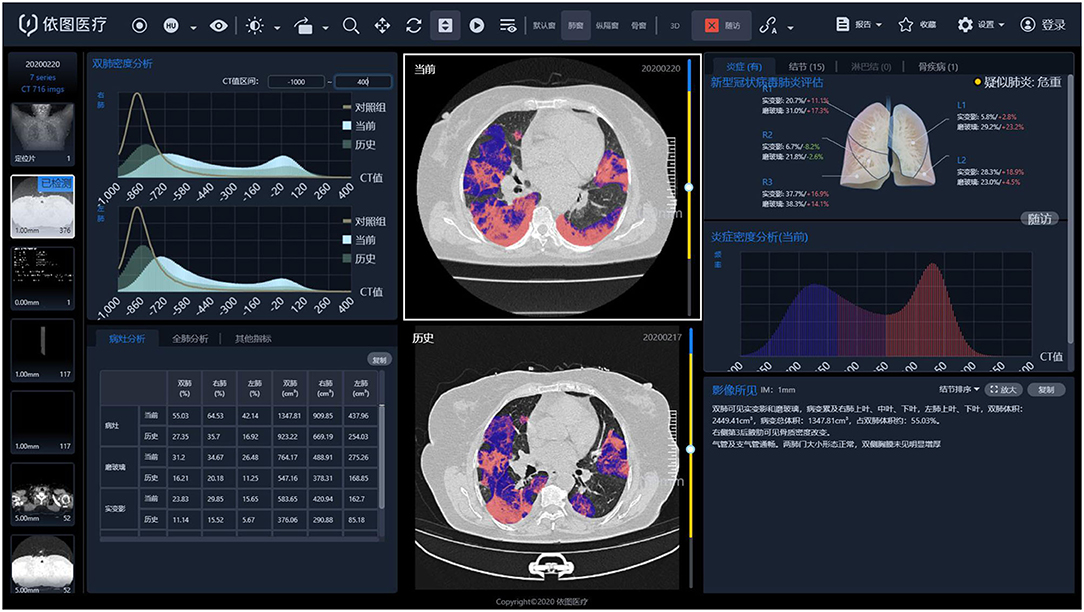
Figure 3. CT image quantization and analysis with artificial intelligence system.
Definition of Endpoint
We defined the severity of COVID-19 according to the newest COVID-19 guidelines released by the National Health Commission of China (44). We defined critical illness as a composite of admission to intensive care unit, respiratory failure requiring mechanical ventilation, shock, or death.
Statistical Analysis
Categorical variables were expressed as counts and percentages, whereas continuous variables are shown as median and interquartile range. Continuous variables were compared using t-test or Mann–Whitney U-test, and categorical variables were compared using χ2-test or Fisher exact test. CT features were compared using t-test or Mann–Whitney U-test. The optimal cutoff value for discriminating critical and non-critical COVID-19 patients was determined by using receiver operating characteristic analysis and maximizing the Youden index. The correlations between total pneumonia volume and laboratory variables were assessed by Pearson correlation analysis. P < 0.05 was considered significant. All statistical analyses were conducted by IBM SPSS version 22.0 (Chicago, IL, USA).
Results
Clinical Characteristics of Patients
This study finally included 140 patients, excluding 37 patients without evidence of COVID-19 lesions, and 12 had severe moving artifacts in chest CT images. Table 1 demonstrates the clinical characteristics of patients. Among the 140 patients with COVID-19, 68 (48.6%) were moderate, 40 (28.6%) were severe, and 32 (22.9%) were critical (including 12 deaths). The mean age of all patients was 58.6 ± 13.8 years (range, 25–86 years), and 85 patients (60.7%) were male. Fever (81.4%) was the most common symptom, followed by dry cough (76.4%), shortness of breath (55.0%), and fatigue (47.1%). Sixty-one patients (43.6%) had at least one comorbidity, with hypertension (30.0%) being the most common, followed by diabetes (16.4%) and cardiovascular disease (11.4%).
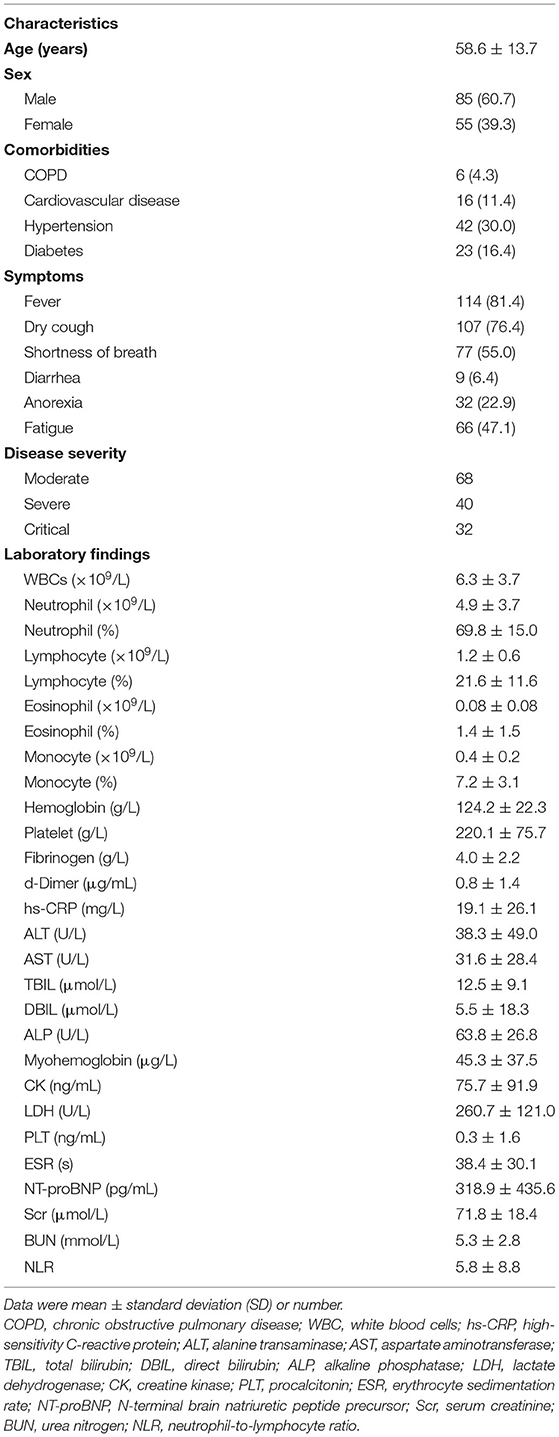
Table 1. Clinical characteristics of patients.
CT Features and Laboratory Variables in the Critical and Non-Critical Groups
Table 2 shows the difference of clinical and laboratory variables between the non-critical and critical groups. There were a total of 28 laboratory variables for the two groups. The median time from symptom onset to CT examination among the moderately, severely, and critically ill groups was 11, 10, and 10 days, respectively (p = 0.250). Comparison of quantitative CT features between the non-critical and critical groups is depicted in Table 3. There were 24 CT features for the two groups. The PPV, PGV, and PCV in the left lung, right lung, both lungs, and five lobes were significantly higher in the critical group than the non-critical group (all p < 0.001). Figure 4 shows temporal changes in lung lesions in two representative cases with COVID-19 pneumonia.
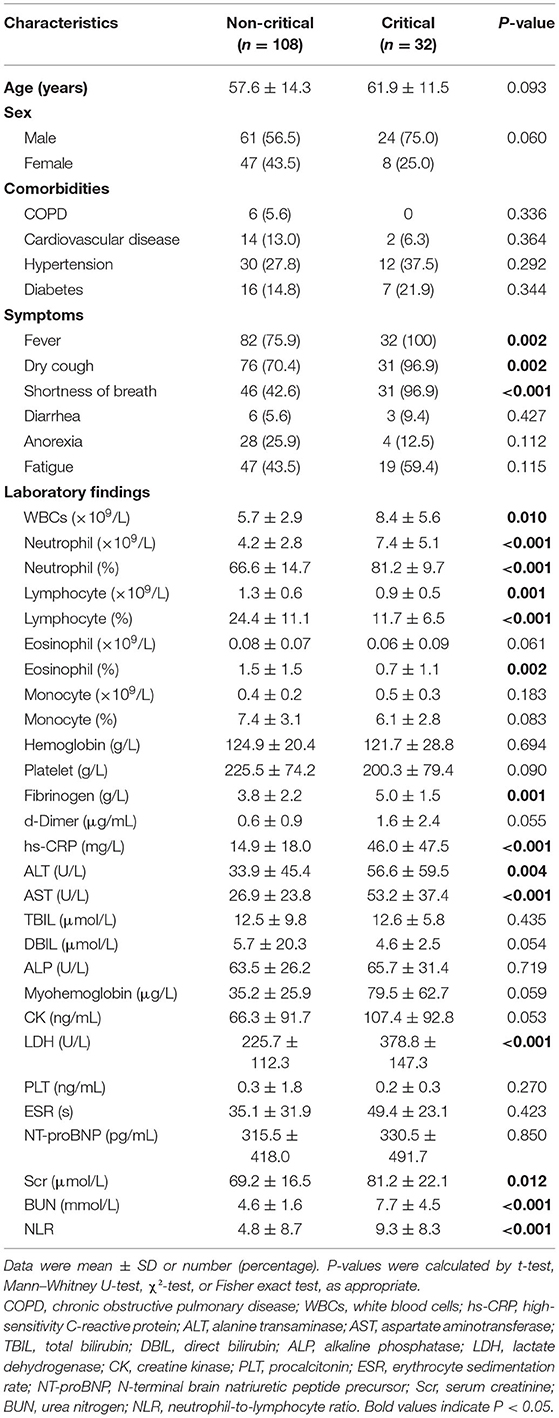
Table 2. Comparison of clinical and laboratory variables between the non-critical and critical groups.
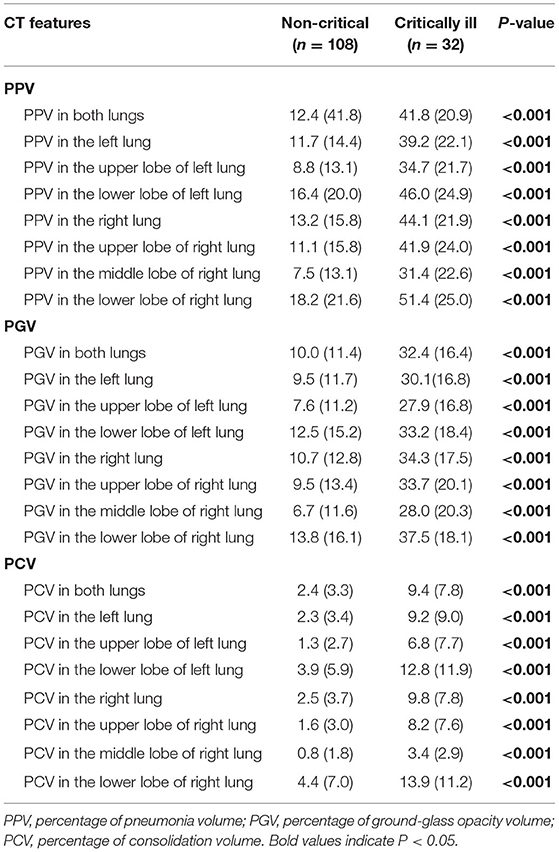
Table 3. Comparison of quantitative CT features between non-critical and critically ill groups.
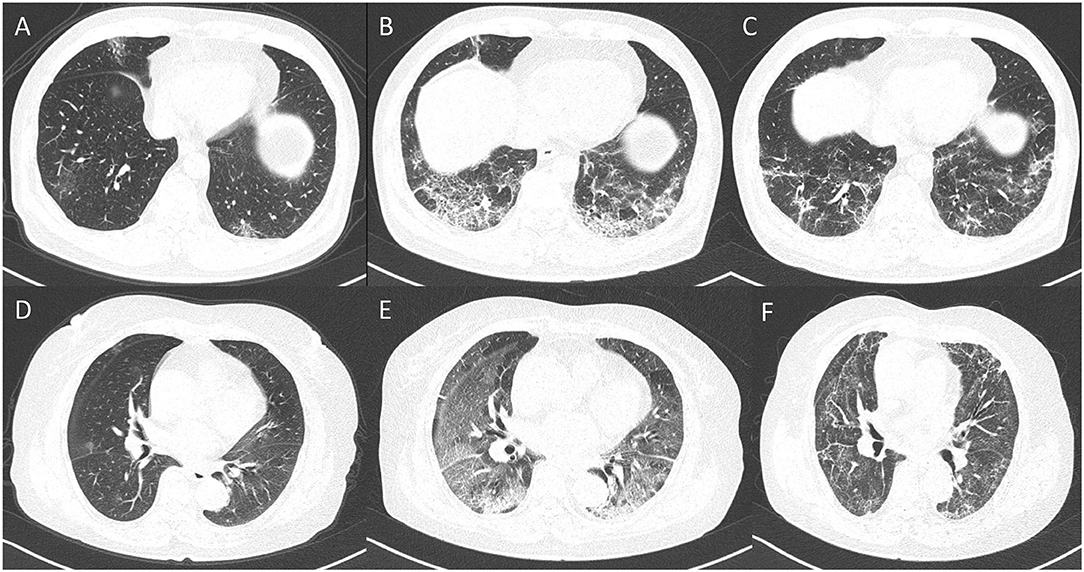
Figure 4. Dynamic changes in lung lesions in two representative cases with COVID-19 pneumonia. A 65-year-old man: (A) scan obtained on day 2; multiple patchy GGOs were shown in the middle lobe and both lower lobes; the PPV, PGV, and PCV were 1.14, 1.07, and 0.07%, respectively. (B) Scan obtained on day 7 showed extensive GGOs with consolidation and crazy-paving pattern in the both lower lobes; the PPV, PGV, and PCV increased to 14.24, 11.38, and 2.86%, respectively. (C) Scan obtained on day 21 showed obvious absorption of abnormalities with fibrotic-like appearances; the PPV, PGV, and PCV were 7.73, 7.12, and 0.61%, respectively. A 67-year-old woman: (D) Scan obtained on day 2, small nodule of GGO was shown in the right lung; the PPV, PGV, and PCV were 0.19, 0.16, and 0.03%, respectively. (E) Scan obtained on day 10 showed extensive GGOs in both lungs with consolidation in the lower lobes; the PPV, PGV, and PCV increased to 48.67, 38.23, and 10.44, respectively. (F) Scan obtained on day 56 showed obvious absorption of GGOs and consolidation with fibrotic-like appearances; the PPV, PGV, and PCV were 39.47, 33.77, and 5.70%, respectively.
Associations of CT Features With Critical Illness
The optimal cutoff value of PPV in both lungs was 22.6%, yielding an area under the curve (AUC) of 0.868 [95% confidence interval (CI) = 0.791–0.946], sensitivity of 81.3% (95% CI = 63.6–92.8%), and specificity of 80.6% (95% CI = 71.8–87.5%) in predicting the occurrence of critical illness of COVID-19 patients (Figure 5A). The optimal cutoff value of PGV in both lungs was 21.3%, obtaining an AUC of 0.858 (95% CI = 0.778–0.938), sensitivity of 78.1% (95% CI = 60.0–90.7%), and specificity of 85.2% (95% CI = 77.1–91.3%) in predicting the occurrence of critical illness of COVID-19 patients (Figure 5B). The optimal cutoff value of PCV in both lungs was 1.8%, achieving an AUC of 0.838 (95% CI = 0.764–0.912), sensitivity of 90.6% (95% CI = 75.0–98.0%), and specificity of 63.9% (95% CI = 54.1–72.9%) in predicting the occurrence of critical illness of COVID-19 patients (Figure 5C).
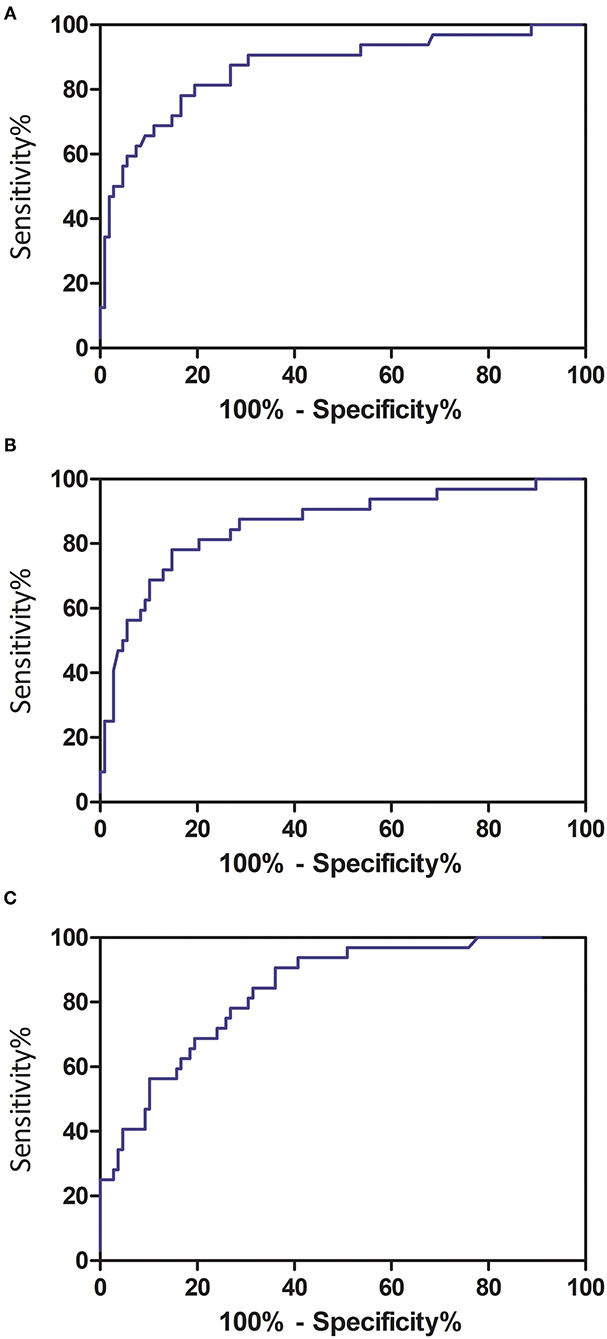
Figure 5. Receiver operating characteristic curve analyses of quantitative CT features in predicting critical illness among COVID-19 patients. (A) Total pneumonia volume in both lungs; (B) ground-glass opacity volume in both lungs; and (C) consolidation volume in both lungs.
Correlations Between Total Pneumonia Volume and Laboratory Variables
The PPV was positively correlated with white blood cell (WBC) count (r = 0.379, p < 0.001), neutrophil percentage (r = 0.535, p < 0.001), monocyte count (r = 0.244, p = 0.010), neutrophil-to-lymphocyte ratio (NLR) (r = 0.318, p < 0.001), erythrocyte sedimentation rate (ESR) (r = 0.567, p < 0.001), fibrinogen (r = 0.324, p = 0.003), D-Dimer (r = 0.444, p < 0.001), high-sensitivity C-reactive protein (hs-CRP) (r = 0.495, p < 0.001), alanine transaminase (r = 0.231, p = 0.012), aspartate aminotransferase (r = 0.410, p < 0.001), lactic dehydrogenase (LDH) (r = 0.644, p < 0.001), and blood urea nitrogen (r = 0.439, p < 0.001), whereas the PPV was negatively correlated with lymphocyte count (r = −0.323, p < 0.001), lymphocyte percentage (r = −0.523, p < 0.001), and eosinophil percentage (r = −0.285, p = 0.001) (Figure 6).
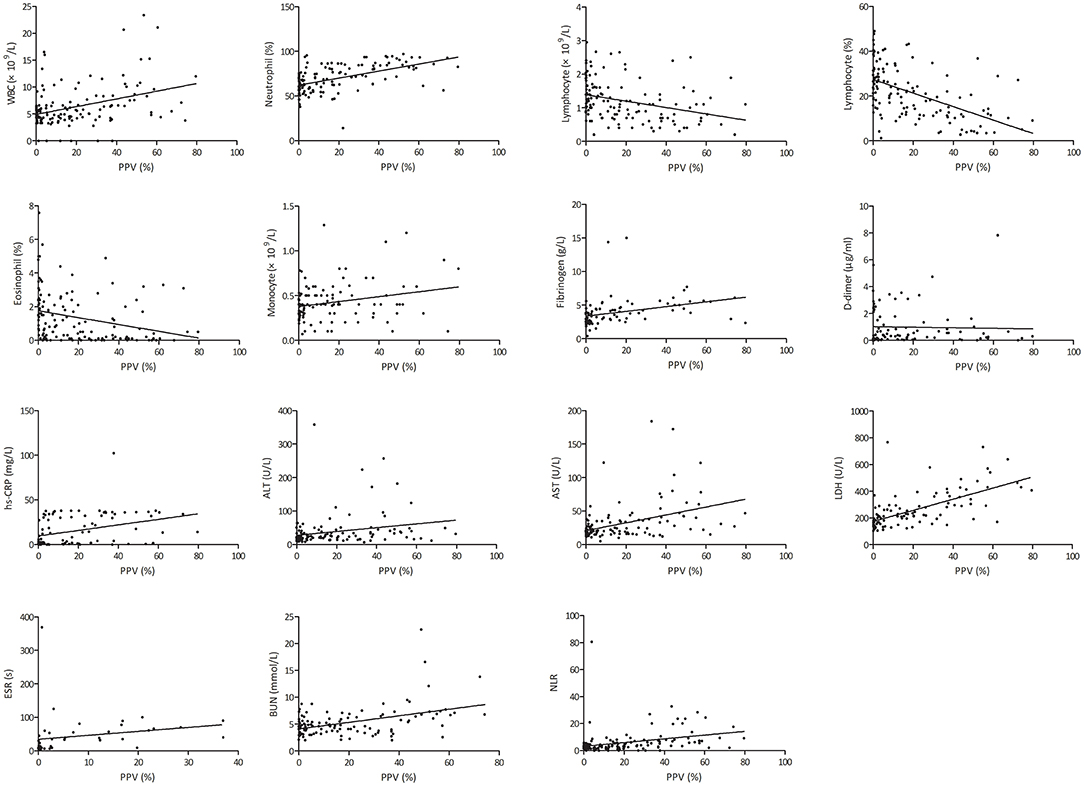
Figure 6. Correlation of total pneumonia volume with different clinical parameters. hs-CRP, high-sensitivity C-reactive protein; ALT, alanine transaminase; AST, aspartate aminotransferase; LDH, lactic dehydrogenase; NLR, neutrophil-to-lymphocyte ratio; PPV, percentage of pneumonia volume.
Discussion
This current study showed that artificial intelligence (AI)–derived quantitative CT features could predict the deterioration to critical illness in patients with COVID-19, in particular, the pneumonia volume percentage. Also, these CT features were correlated with laboratory variables reflecting systemic inflammation, immune state, and multiple organ functions.
Lung CT can provide useful additional information in the detection, diagnosis, and follow-up of COVID-19 pneumonia (5). However, CT images are usually visually interpreted by radiologists with diverse levels of experience, which is subjective with large variability that is unable to quantitatively assess the disease severity and is also time-consuming and labor-intensive. Previous studies have shown that quantitative CT is comparable or superior to visual CT score in assessment of the severity of COVID-19 (28, 45, 46). Recently, several studies have used quantitative CT to predict clinical outcomes via AI software in patients with COVID-19 (43, 47, 48). Liu et al. found that quantitative CT features on days 0 and 4 as well as changes from days 0 to 4 could predict the progression to severe illness in COVID-19 patients, which outperformed the acute physiology and chronic health evaluation II score, NLR, and D-Dimer (43). Homayounieh et al. found that despite a high frequency of motion artifacts, quantitative features of pulmonary opacities from chest CT can help stratify patients with favorable and adverse outcomes (47). Salvatore et al. demonstrated that quantification of the consolidation, emphysema, and residual healthy lung parenchyma on chest CT images were independent predictors of outcome in patients with COVID-19 pneumonia (48). Our study demonstrated that quantitative CT measurements at admission could accurately predict adverse outcomes in COVID-19 patients. The total lesion volume had the best performance of assessing the severity of COVID-19, which was in agreement with a previous study (49). With the advance of image data-mining tools, radiomics and deep learning play a crucial role in the prediction of severity, prognosis, or outcome of patients with COVID-19 (7–34). The COVID-19 lesion images contained high-level features that can effectively represent morphological appearances and heterogeneous information. The handcrafted and learning features derived from CT images can be integrated into clinical and laboratory variables to form a combined model with more favorable performance. These models provided physicians with an important tool for improving the clinical care of patients with the worse disease outcomes.
The extent of GGO and consolidation can evaluate the disease severity of COVID-19 (50). As viruses spread via the respiratory mucosa and also infect other cells, they induce a cytokine storm and a series of immune responses that cause changes in peripheral blood and immune cells (51). Coronaviruses invade the lungs, as well as the blood system, digestive system, and circulatory system (52). Therefore, the disease severity assessed by chest CT may correlate with laboratory inflammatory and immune biomarkers (53). The severity of lymphopenia and infection correlated with the severity of COVID-19 (54). Zhang et al. found that CT score had positive associations with inflammatory mediators, including WBC count, neutrophil count, prothrombin time, D-Dimer, CRP, ESR, procalcitonin, serum ferritin, IL-6, and IL-10, but a negative association with lymphocyte count (51). Another study revealed dynamic correlation between CT score and laboratory parameters, which showed that CT score at an early stage was correlated with neutrophil count, whereas CT score at progressive stage was correlated with neutrophil count, WBC count, hs-CRP, procalcitonin, and LDH (55). The correlation between laboratory, clinical data, and CT quantitative features has also been shown in several studies (49, 56). Kang et al. observed that histogram features were significantly correlated with National Early Warning Score, neutrophil percentage, procalcitonin, acute respiratory distress syndrome, and extracorporeal membrane oxygenation and negatively correlated with lymphocyte percentage and lymphocyte count (56). Sun et al. demonstrated that CT quantitative parameters were significantly correlated with inflammatory markers, including neutrophil percentage, lymphocyte count, lymphocyte percentage, hs-CRP, and procalcitonin (49). These findings may prove the reliability of quantitative CT in assessment of disease severity at the level of biology.
This study has some limitations. First is the retrospective nature of this study with small sample size. Therefore, a large cohort is needed to validate the role of AI-derived CT features in assessment of prognosis of COVID-19 patients. Second, the effect of anti–COVID-19 treatment on prognosis was not considered because no specific strategies have been used in the treatment of COVID-19 except for supportive care until now. Third, CT-based radiomics or deep learning and follow-up CT scan may provide more prognostic information.
Our study illustrated that AI-derived CT features were correlated with laboratory variables reflecting systemic inflammation, immune state, and multiple organ functions (e.g., coagulation, liver, and renal functions). Thus, CT quantitative analysis might be an effective and important method for assessing the severity of COVID-19 and may provide additional guidance for planning clinical treatment strategies. This technique can be used in routine practice. Large-scale prospective studies in the future are warranted to confirm the CT features in predicting the occurrence of critical illness in COVID-19 patients.
Data Availability Statement
The original contributions presented in the study are included in the article/supplementary material, further inquiries can be directed to the corresponding author/s.
Ethics Statement
The studies involving human participants were reviewed and approved by First Affiliated Hospital of Guangzhou Medical University. The ethics committee waived the requirement of written informed consent for participation.
Author Contributions
BP, HL, QL, and PW: literature search. BP, HL, QL, XZ, PW, and TX: study design. BP, HL, QL, and XZ: data collection. TX, PW, WL, JL, LL, CO, JM, and SL: data analysis. FZ, XW, and JX: data interpretation. BP, HL, QL, PW, and XZ: writing. All authors manuscript review and approval.
Conflict of Interest
The authors declare that the research was conducted in the absence of any commercial or financial relationships that could be construed as a potential conflict of interest.
References
1. Pan A, Liu L, Wang C, Guo H, Hao X, Wang Q, et al. Association of public health interventions with the epidemiology of the COVID-19 outbreak in Wuhan, China. JAMA. (2020) 2020:6130. doi: 10.1001/jama.2020.6130
2. World Health Organization. Coronavirus Disease 2019 (COVID-19) Situation Report. Available online at: https://www.who.int/emergencies/diseases/novel-coronavirus-2019/situation-reports (accessed March 1, 2021).
3. Wu Z, McGoogan JM. Characteristics of and important lessons from the coronavirus disease 2019 (COVID-19) outbreak in China: summary of a report of 72,314 cases from the Chinese Center for Disease Control and Prevention. JAMA. (2020) 2020:2648. doi: 10.1001/jama.2020.2648
4. Chen N, Zhou M, Dong X, Qu J, Gong F, Han Y, et al. Epidemiological and clinical characteristics of 99 cases of 2019 novel coronavirus pneumonia in Wuhan, China: a descriptive study. Lancet. (2020) 395:507–13. doi: 10.1016/S0140-6736(20)30211-7
5. Liu J, Yu H, Zhang S. The indispensable role of chest CT in the detection of coronavirus disease 2019 (COVID-19). Eur J Nucl Med Mol Imaging. (2020) 47:1638–9. doi: 10.1007/s00259-020-04795-x
6. Zhang HT, Zhang JS, Zhang HH, Nan YD, Zhao Y, Fu EQ, et al. Automated detection and quantification of COVID-19 pneumonia: CT imaging analysis by a deep learning-based software. Eur J Nucl Med Mol Imaging. (2020) 20:4953. doi: 10.1007/s00259-020-04953-1
7. Wang S, Dong D, Li L, Li H, Bai Y, Hu Y, et al. A deep learning radiomics model to identify poor outcome in COVID-19 patients with underlying health conditions: a multicenter study. IEEE J Biomed Health Inform. (2021) 2021:3076086. doi: 10.1109/JBHI.2021.3076086
8. Zhang B, Ni-Jia-Ti MY, Yan R, An N, Chen L, Liu S, et al. CT-based radiomics for predicting the rapid progression of coronavirus disease 2019 (COVID-19) pneumonia lesions. Br J Radiol. (2021) 2021:bjr.20201007. doi: 10.1259/bjr.20201007
9. Xiao F, Sun R, Sun W, Xu D, Lan L, Li H, et al. Radiomics analysis of chest CT to predict the overall survival for the severe patients of COVID-19 pneumonia. Phys Med Biol. (2021) 6560:abf717. doi: 10.1088/1361-6560/abf717
10. Li L, Wang L, Zeng F, Peng G, Ke Z, Liu H, et al. Development and multicenter validation of a CT-based radiomics signature for predicting severe COVID-19 pneumonia. Eur Radiol. (2021) 21:7727. doi: 10.1007/s00330-021-07727-x
11. Shiri I, Sorouri M, Geramifar P, Nazari M, Abdollahi M, Salimi Y, et al. Machine learning-based prognostic modeling using clinical data and quantitative radiomic features from chest CT images in COVID-19 patients. Comput Biol Med. (2021) 132:104304. doi: 10.1016/j.compbiomed.2021.104304
12. Ke Z, Li L, Wang L, Liu H, Lu X, Zeng F, et al. Radiomics analysis enables fatal outcome prediction for hospitalized patients with coronavirus disease 2019 (COVID-19). Acta Radiol. (2021). doi: 10.1177/0284185121994695. [Epub ahead of print].
13. Chen H, Zeng M, Wang X, Su L, Xia Y, Yang Q, et al. A CT-based radiomics nomogram for predicting prognosis of coronavirus disease 2019 (COVID-19) radiomics nomogram predicting COVID-19. Br J Radiol. (2021) 94:20200634. doi: 10.1259/bjr.20200634
14. Li C, Dong D, Li L, Gong W, Li X, Bai Y, et al. Classification of severe and critical covid-19 using deep learning and radiomics. IEEE J Biomed Health Inform. (2020) 24:3585–94. doi: 10.1109/JBHI.2020.3036722
15. Tang Z, Zhao W, Xie X, Zhong Z, Shi F, Ma T, et al. Severity assessment of COVID-19 using CT image features and laboratory indices. Phys Med Biol. (2021) 66:035015. doi: 10.1088/1361-6560/abbf9e
16. Homayounieh F, Babaei R, Karimi Mobin H, Arru CD, Sharifian M, Mohseni I, et al. Computed tomography radiomics can predict disease severity and outcome in coronavirus disease 2019 pneumonia. J Comput Assist Tomogr. (2020) 44:640–6. doi: 10.1097/RCT.0000000000001094
17. Wu Q, Wang S, Li L, Wu Q, Qian W, Hu Y, et al. Radiomics analysis of computed tomography helps predict poor prognostic outcome in COVID-19. Theranostics. (2020) 10:7231–44. doi: 10.7150/thno.46428
18. Homayounieh F, Ebrahimian S, Babaei R, Mobin HK, Zhang E, Bizzo BC, et al. CT radiomics, radiologists, and clinical information in predicting outcome of patients with COVID-19 pneumonia. Radiol Cardiothorac Imaging. (2020) 2:e200322. doi: 10.1148/ryct.2020200322
19. Feng Z, Shen H, Gao K, Su J, Yao S, Liu Q, et al. Machine learning based on clinical characteristics and chest CT quantitative measurements for prediction of adverse clinical outcomes in hospitalized patients with COVID-19. Eur Radiol. (2021) 21:7957. doi: 10.1007/s00330-021-07957-z
20. Gong K, Wu D, Arru CD, Homayounieh F, Neumark N, Guan J, et al. A multi-center study of COVID-19 patient prognosis using deep learning-based CT image analysis and electronic health records. Eur J Radiol. (2021) 2021:109583. doi: 10.1016/j.ejrad.2021.109583
21. He L, Zhang Q, Li Z, Shen L, Zhang J, Wang P, et al. Incorporation of urinary neutrophil gelatinase-associated lipocalin and computed tomography quantification to predict acute kidney injury and in-hospital death in COVID-19 patients. Kidney Dis. (2021) 7:120–30. doi: 10.1159/000511403
22. Kohli A, Jha T, Pazhayattil AB. The value of AI based CT severity scoring system in triage of patients with Covid-19 pneumonia as regards oxygen requirement and place of admission. Indian J Radiol Imaging. (2021) 31:S61–9. doi: 10.4103/ijri.IJRI_965_20
23. Chatzitofis A, Cancian P, Gkitsas V, Carlucci A, Stalidis P, Albanis G, et al. Volume-of-interest aware deep neural networks for rapid chest CT-based COVID-19 patient risk assessment. Int J Environ Res Public Health. (2021) 8:2842. doi: 10.3390/ijerph18062842
24. Purkayastha S, Xiao Y, Jiao Z, Thepumnoeysuk R, Halsey K, Wu J, et al. Machine learning-based prediction of COVID-19 severity and progression to critical illness using CT imaging and clinical data. Korean J Radiol. (2021) 2020:1104. doi: 10.3348/kjr.2020.1104
25. Shi W, Peng X, Liu T, Cheng Z, Lu H, ang S, et al. A deep learning-based quantitative computed tomography model for predicting the severity of COVID-19: a retrospective study of 196 patients. Ann Transl Med. (2021) 9:216. doi: 10.21037/atm-20-2464
26. Lee EH, Zheng J, Colak E, Mohammadzadeh M, Houshmand G, Bevins N, et al. Deep COVID DeteCT: an international experience on COVID-19 lung detection and prognosis using chest CT. NPJ Digit Med. (2021) 4:11. doi: 10.1038/s41746-020-00369-1
27. Lassau N, Ammari S, Chouzenoux E, Gortais H, Herent P, Devilder M, et al. Integrating deep learning CT-scan model, biological and clinical variables to predict severity of COVID-19 patients. Nat Commun. (2021) 12:634. doi: 10.1038/s41467-020-20657-4
28. Fang X, Kruger U, Homayounieh F, Chao H, Zhang J, Digumarthy SR, et al. Association of AI quantified COVID-19 chest CT and patient outcome. Int J Comput Assist Radiol Surg. (2021) 16:435–45. doi: 10.1007/s11548-020-02299-5
29. Ho TT, Park J, Kim T, Park B, Lee J, Kim JY, et al. Deep learning models for predicting severe progression in COVID-19-infected patients: retrospective study. JMIR Med Inform. (2021) 9:e24973. doi: 10.2196/24973
30. Shan F, Gao Y, Wang J, Shi W, Shi N, Han M, et al. Abnormal lung quantification in chest CT images of COVID-19 patients with deep learning and its application to severity prediction. Med Phys. (2021) 48:1633–45. doi: 10.1002/mp.14609
31. Xiao LS, Li P, Sun F, Zhang Y, Xu C, Zhu H, et al. Development and validation of a deep learning-based model using computed tomography imaging for predicting disease severity of coronavirus disease 2019. Front Bioeng Biotechnol. (2020) 8:898. doi: 10.3389/fbioe.2020.00898
32. Pu J, Leader JK, Bandos A, Ke S, Wang J, Shi J, et al. Automated quantification of COVID-19 severity and progression using chest CT images. Eur Radiol. (2021) 31:436–46. doi: 10.1007/s00330-020-07156-2
33. Yu Z, Li X, Sun H, Wang J, Zhao T, Chen H, et al. Rapid identification of COVID-19 severity in CT scans through classification of deep features. Biomed Eng Online. (2020) 19:63. doi: 10.1186/s12938-020-00807-x
34. Zhang K, Liu X, Shen J, Li Z, Sang Y, Wu X, et al. Clinically applicable ai system for accurate diagnosis, quantitative measurements, and prognosis of COVID-19 pneumonia using computed tomography. Cell. (2020) 181:1423–33.e11. doi: 10.1016/j.cell.2020.04.045
35. Liang W, Liang H, Ou L, Chen B, Chen A, Li C, et al. Development and validation of a clinical risk score to predict the occurrence of critical illness in hospitalized patients with COVID-19. JAMA Intern Med. (2020) 2020:2033. doi: 10.1001/jamainternmed.2020.2033
36. Yang X, Yu Y, Xu J, Shu H, Xia J, Liu H, et al. Clinical course and outcomes of critically ill patients with SARS-CoV-2 pneumonia in Wuhan, China: a single-centered, retrospective, observational study. Lancet Respir Med. (2020) 8:475–81. doi: 10.1016/S2213-2600(20)30079-5
37. Petrilli CM, Jones SA, Yang J, Rajagopalan H, O'Donnell L, Chernyak Y, et al. Factors associated with hospital admission and critical illness among 5,279 people with coronavirus disease 2019 in New York City: prospective cohort study. BMJ. (2020) 369:m1966. doi: 10.1136/bmj.m1966
38. Xu L, Mao Y, Chen G. Risk factors for 2019 novel coronavirus disease (COVID-19) patients progressing to critical illness: a systematic review and meta-analysis. Aging. (2020) 12:12410–21. doi: 10.18632/aging.103383
39. World Health Organization. Clinical Management of Severe Acute Respiratory Infection When Novel Coronavirus (nCoV) Infection Is Suspected: Interim Guidance, 25 January 2020. Iris. (2020). Available online at: https://apps.who.int/iris/handle/10665/330854 (accessed March 1, 2021).
40. Ronneberger O, Fischer P, Brox T. U-net: convolutional networks for biomedical image segmentation. In: International Conference on Medical Image Computing and Computer-Assisted Intervention. Shanghai: Springer. (2015). p. 234-41.
41. Wang S, Zhou M, Liu Z, Liu Z, Gu D, Zang Y, et al. Central focused convolutional neural networks: developing a data-driven model for lung nodule segmentation. Med Image Anal. (2017) 40:172–83. doi: 10.1016/j.media.2017.06.014
42. Pan F, Li L, Liu B, Ye T, Li L, Liu D, et al. A novel deep learning-based quantification of serial chest computed tomography in Coronavirus Disease 2019 (COVID-19). Sci Rep. (2021) 11:417. doi: 10.1038/s41598-020-80261-w
43. Liu F, Zhang Q, Huang C, Shi C, Wang L, Shi N, et al. CT quantification of pneumonia lesions in early days predicts progression to severe illness in a cohort of COVID-19 patients. Theranostics. (2020) 10:5613–22. doi: 10.7150/thno.45985
44. National Health Commission of the People's Republic of China. Guidelines for the Diagnosis and Treatment of Novel Coronavirus (2019-nCoV) Infection (Trial Version 7) (in Chinese). Shanghai: National Health Commission of the People's Republic of China. (2020).
45. Yin X, Min X, Nan Y, Feng Z, Li B, Cai W, et al. Assessment of the severity of coronavirus disease: quantitative computed tomography parameters versus semiquantitative visual score. Korean J Radiol. (2020) 2020:423. doi: 10.3348/kjr.2020.0423
46. Shen C, Yu N, Cai S, Zhou J, Sheng J, Liu K, et al. Quantitative computed tomography analysis for stratifying the severity of Coronavirus Disease 2019. J Pharm Anal. (2020) 10:123–9. doi: 10.1016/j.jpha.2020.03.004
47. Homayounieh F, Bezerra Cavalcanti Rockenbach MA, Ebrahimian S, Doda Khera R, Bizzo BC, Buch V, et al. Multicenter assessment of CT pneumonia analysis prototype for predicting disease severity and patient outcome. J Digit Imaging. (2021) 430:9. doi: 10.1007/s10278-021-00430-9
48. Salvatore C, Roberta F, Angela L, Cesare P, Alfredo C, Giuliano G, et al. Clinical and laboratory data, radiological structured report findings and quantitative evaluation of lung involvement on baseline chest CT in COVID-19 patients to predict prognosis. Radiol Med. (2021) 126:29–39. doi: 10.1007/s11547-020-01293-w
49. Sun D, Li X, Guo D, Wu L, Chen T, Fang Z, et al. CT quantitative analysis and its relationship with clinical features for assessing the severity of patients with COVID-19. Korean J Radiol. (2020) 21:859–68. doi: 10.3348/kjr.2020.0293
50. Wu D, Gong K, Arru CD, Homayounieh F, Bizzo B, Buch V, et al. Severity and consolidation quantification of COVID-19 from CT images using deep learning based on hybrid weak labels. IEEE J Biomed Health Inform. (2020) 24:3529–38. doi: 10.1109/JBHI.2020.3030224
51. Zhang J, Meng G, Li W, Shi B, Dong H, Su Z, et al. Relationship of chest CT score with clinical characteristics of 108 patients hospitalized with COVID-19 in Wuhan, China. Respir Res. (2020) 21:180. doi: 10.1186/s12931-020-01440-x
52. Synowiec A, Szczepański A, Barreto-Duran E, Lie LK, Pyrc K. Severe acute respiratory syndrome coronavirus 2 (SARS-CoV-2): a systemic infection. Clin Microbiol Rev. (2021) 133:20. doi: 10.1128/CMR.00133-20
53. Yilmaz A, Sabirli R, Seyit M, Ozen M, Oskay A, Cakmak V, et al. Association between laboratory parameters and CT severity in patients infected with Covid-19: a retrospective, observational study. Am J Emerg Med. (2021) 42:110–4. doi: 10.1016/j.ajem.2021.01.040
54. Gallo Marin B, Aghagoli G, Lavine K, Yang L, Siff EJ, Chiang SS, et al. Predictors of COVID-19 severity: a literature review. Rev Med Virol. (2021) 31:1–10. doi: 10.1002/rmv.2146
55. Zhang B, Zhang J, Chen H, Chen L, Chen Q, Li M, et al. Novel coronavirus disease 2019 (COVID-19): relationship between chest CT scores and laboratory parameters. Eur J Nucl Med Mol Imaging. (2020) 47:2083–9. doi: 10.1007/s00259-020-04854-3
Keywords: COVID-19, pneumonia, critical illness, chest CT, quantification
Citation: Pang B, Li H, Liu Q, Wu P, Xia T, Zhang X, Le W, Li J, Lai L, Ou C, Ma J, Liu S, Zhou F, Wang X, Xie J, Zhang Q, Jiang M, Liu Y and Zeng Q (2021) CT Quantification of COVID-19 Pneumonia at Admission Can Predict Progression to Critical Illness: A Retrospective Multicenter Cohort Study. Front. Med. 8:689568. doi: 10.3389/fmed.2021.689568
Received: 01 April 2021; Accepted: 10 May 2021;
Published: 17 June 2021.
Edited by:
Reza Lashgari, Institute for Research in Fundamental Sciences, IranReviewed by:
Gisella Guido, Sapienza University of Rome, ItalyMichaela Cellina, ASST Fatebenefratelli Sacco, Italy
Copyright © 2021 Pang, Li, Liu, Wu, Xia, Zhang, Le, Li, Lai, Ou, Ma, Liu, Zhou, Wang, Xie, Zhang, Jiang, Liu and Zeng. This is an open-access article distributed under the terms of the Creative Commons Attribution License (CC BY). The use, distribution or reproduction in other forums is permitted, provided the original author(s) and the copyright owner(s) are credited and that the original publication in this journal is cited, in accordance with accepted academic practice. No use, distribution or reproduction is permitted which does not comply with these terms.
*Correspondence: Qingsi Zeng, emVuZ3FpbmdzaUBnemhtdS5lZHUuY24=; Yumei Liu, bHltaGFua291eXlAMTYzLmNvbQ==; Min Jiang, amlhbmcwNDUxMUAxNjMuY29t; Qingling Zhang, cWluZ2xpbmdAZ2lyZC5jbg==
†These authors have contributed equally to this work