- Department of Nephrology, The First Affiliated Hospital of China Medical University, Shenyang, China
Background: Membranous nephropathy (MN) is a common pathological phenotype for adult nephrotic syndrome (NS). The occurrence of MN is increasing across China, but diagnostic methods for MN still rely on kidney biopsy and PLA2R and THSD7A detection in plasma and kidney tissue, and there has been no new biomarker for MN discovered since 2014. Immune infiltration status in MN patients suffers from the dearth of associated studies. In the present study, we aimed to find new bio-markers for MN and evaluate the role of immune cells infiltration in MN pathology.
Methods: We downloaded MN expression profile from the Gene Expression Omnibus database and used R-project to screen differentially expressed genes (DEGs) and performed functional correlation analysis. Least absolute shrinkage and selection operator (LASSO) logistic regression and Radom Forest algorithms were used to screen and verify the bio-markers of MN. Finally, CIBERSORT was used to evaluate the infiltration of immune cells in MN tissues.
Results: A total of 463 DEGs were screened from the MN tissue in this study. ETS2 was identified as bio-marker for MN. The CIBERSORT results showed that there were statistical differences in monocytes, plasma cells, regulatory T cells, and memory B cells. In addition, ETS2 was positively related to monocytes, M1 phase macrophages, and neutrophils and negatively correlated to plasma cells, CD4+ T memory cells, M2 macrophages, CD8+ T cells, memory B cells, and resting mast cells.
Conclusion: (1) Machine learning algorithms reveals Ets2 as a novel target for membranous nephropathy patients. (2) Immune infiltration plays an important part in membranous nephropathy. (3) Ets2 expression is related to immune cells infiltration.
Introduction
Membranous nephropathy (MN) is one of the common causes of nephrotic syndrome (NS) in the adult population (1). Recent studies confirmed the occurrence of MN in primary glomerulopathy (2). The typical pathological changes for MN include diffuse thickening of the glomerular capillary basement membrane and diffuse granular deposits of IgG with or without C3 (3). Currently, the diagnosis of MN relies on kidney biopsy and detection of PLA2R (4) and THSD7A (5) in plasma and kidney biopsy tissue: there has been no new biomarker for MN discovered since 2014 (6). Finding new biomarkers for MN diagnosis and treatment target is important.
Based on previous studies on human MN patient kidney biopsy and animal models, MN pathophysiological changes involved B cell activation (7) and immune infiltration caused by B cell activation including macrophages (8) and T cells (9). Recently, Rituximab, a monoclonal antibody against CD20, which can cause B cell degeneration, had been approved as a first-line treatment for MN patients (10), indicating that immune infiltration, especially B cell action, plays an important role in MN activation. However, there has been no large-scale immune infiltration study on human MN patients based on RNA sequencing and the CIBERSORT algorithm.
Machine learning algorithms such as least absolute shrinkage and selection operator logistic regression (LASSO) and random forest algorithms were widely used in clinical practice. These machine learning algorithms provided new insight in COVID-19 mortality (11), progressive of idiopathic pulmonary fibrosis (12) and cancer outcomes (13). Based on these studies, we could use machine learning algorithms to find novel targets for MN patients.
In the present study, a microarray dataset of MN downloaded from the Gene Expression Omnibus (GEO) database was used. We performed differential expression gene analysis and used machine learning algorithms to screen and identify suitable targets for MN treatment and diagnosis. CIBERSORT (14) was then used to ascertain the difference in immune infiltration between normal tissue and MN tissue. In addition, MN treatment target and its relationship with immune infiltration in 22 immune cells were determined.
Materials and Methods
Data Download
The “GEOquery” package in R (Version 4.10) was used to download the MN expression profile datasets GSE99340 and GSE108113 from the GEO database.
Data Processing and Deg Screening
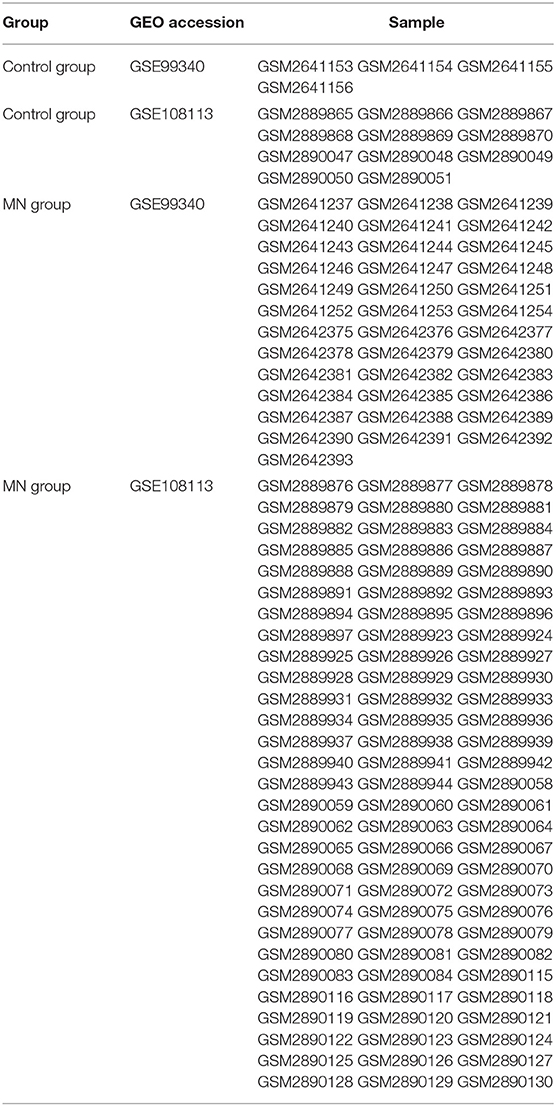
The expression matrices of GSE99340 and GSE108113 were downloaded and combined. The control group and MN group samples were selected according to patient data (Table 1). Inter-batch differences were removed using the “sva” package. Two PCA cluster plots were used to demonstrate the effect of inter-sample correction. DEGs were scanned using the “limma” package and “ggplot2” software was used to show differential expression of DEGs.
Functional Analysis
The “clusterProfiler” package was used to perform Gene Ontology (GO) and Disease Ontology (DO) enrichment analyses on DEGs, respectively. KEGG pathway enrichment analyses were also conducted on the gene expression matrix through the “clusterProfiler” package. A false discovery rate (FDR) < 0.25 and p < 0.05 were considered to represent significant enrichment.
Screening and Verification of Treatment Target
We used least absolute shrinkage and selection operator logistic regression (LASSO) and random forest algorithms to perform feature selection to screen treatment target for MN. The LASSO algorithm was applied using the “glmnet” package, and the random forest algorithm was established using the “randomForest” package the further to evaluate treatment targets. The GSE108113 matrix was used as a test matrix to examine random forest algorithm results. Then, we combined genes from the results from running the LASSO and random forest algorithms.
Evaluation of Immune Cell Infiltration
CIBERSORT R-packages and the LM22 document were used to run the algorithm locally (14); we filtered out those samples with p < 0.05 and obtained the immune cell infiltration matrix. The “corrplot” package was used to draw a correlation heatmap to visualize the correlation between infiltrated immune cells; the “ggplot2” package was employed to plot diagrams allowing visualization of the correlations in immune cell infiltration.
Correlation Analysis of Treatment Target and Immune Cell Infiltration
Spearman correlation analysis was applied to the markers and infiltrating immune cells and the “ggplur” package was used to visualize the results.
Results
Data Processing and DEGs Screening
First, we merged expression profile datasets GSE99340 and GSE108113. The “sva” package was then used to remove inter-batch differences between different expression matrices. The merged expression matrix was normalized and processed: two PCA cluster diagrams (before and after normalization, Figures 1A,B) were used, indicating that the sample source was reliable. After data normalization, R-project was used to extract a total of 463 DEGs from the gene expression matrix, as shown in volcano map (Figure 1C). The heatmap of the top-50 DEGs demonstrated that DEGs were expressed differently in normal and MN samples (Figure 2A).
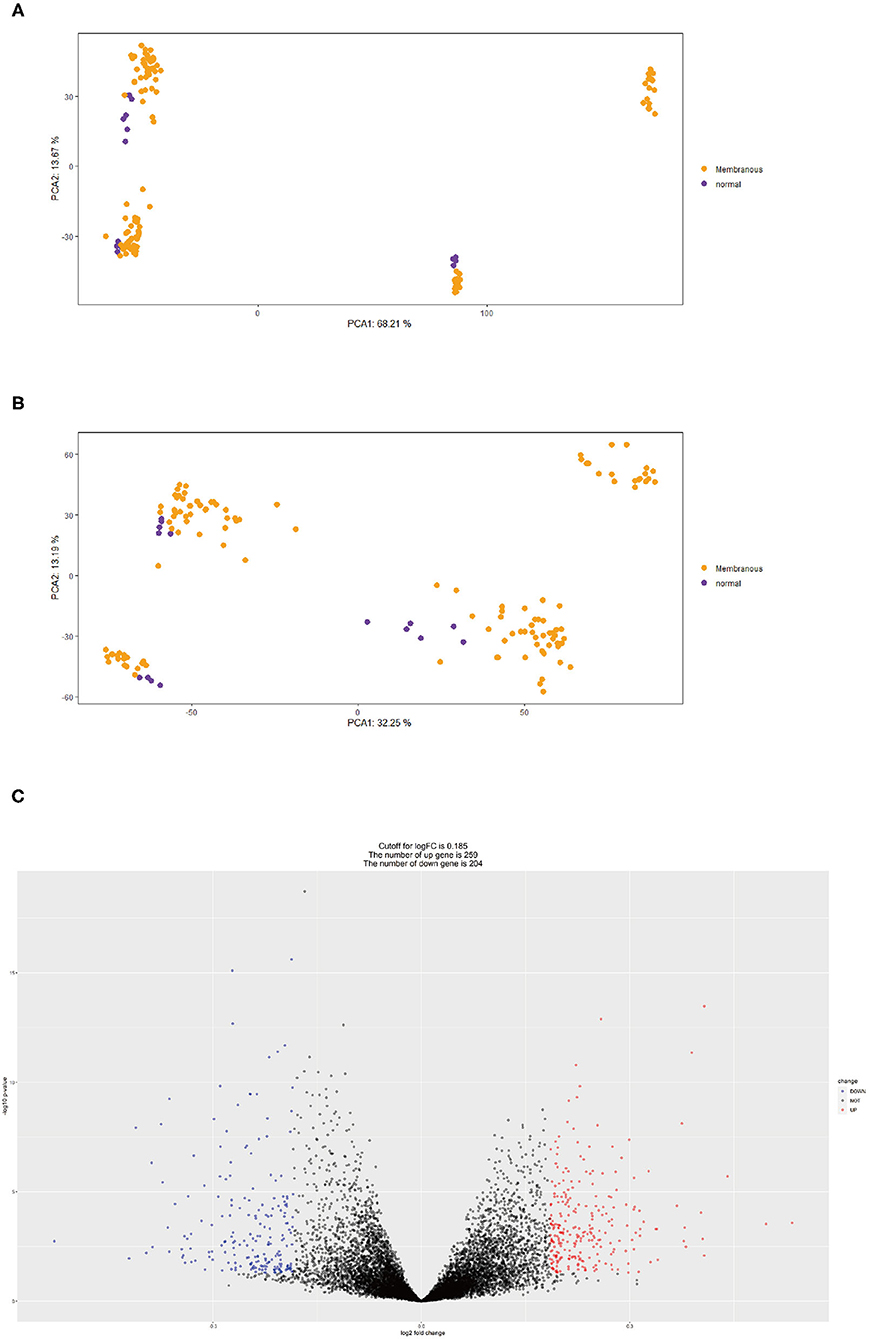
Figure 1. (A) PCA clustering results of expression dataset before removing inter-batch difference: yellow dots represent MN samples and purple dots represent normal samples. (B) PCA clustering results of expression dataset after removing inter-batch difference, yellow dots represent MN samples and purple dots denote normal samples. (C) Volcano map for 463 DEGs, red represents up-regulated DEGs, blue represents down-regulated DEGs.
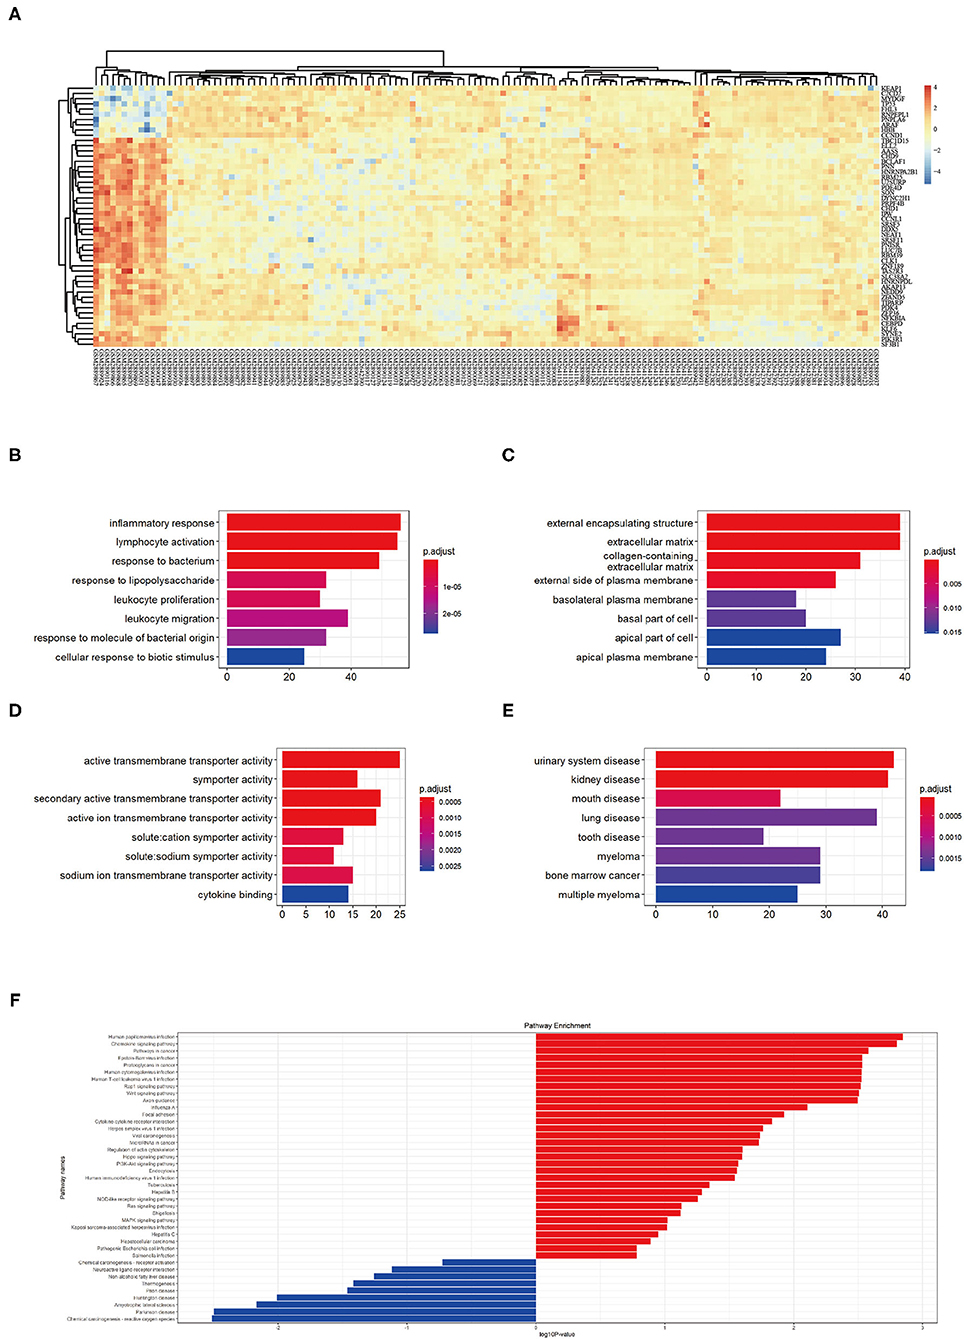
Figure 2. (A) Top 50 DEG expressions in each sample, red represents a high level of expression and blue represents a low level of expression. (B–D) GO enrichment in biological process (BP), cellular component (CC), and molecular function (MF): color represents the P-value, red represents a low P-value and blue represents a high P-value. (E) DO enrichment: color represents the P-value, red represents a low P-value and blue represents a high P-value. (F) KEGG pathway enrichment results, red represents up-regulated pathways and blue represents down-regulated pathways.
Functional Correlation Analysis
GO analysis showed that DEGs were mainly related to biological process (BP) including inflammatory response, lymphocyte activation, response to bacterium, response to lipopolysaccharide, leukocyte proliferation, leukocyte migration, response to molecules of bacterial origin, and cellular response to biotic stimulus (Figure 2B). The cellular component (CC) aspect of the results of GO analysis of DEGs included external encapsulating, extracellular matrix, collagen containing, external side of plasma membrane, basolateral plasma membrane, basal part of cells, and apical plasma membrane (Figure 2C). The molecular function (MF) aspect of the GO analysis results included active transmembrane transporter activity, symporter activity, secondary active transmembrane transporter activity, active ion transmembrane transporter activity, solute cation symporter activity, solute sodium symporter activity, sodium ion transmembrane transporter activity, and cytokine binding (Figure 2D).
GO analysis showed that DEGs were mainly related to urinary system disease, kidney disease, mouth disease, lung disease, tooth disease, myeloma, bone marrow cancer, and multiple myeloma (Figure 2E). KEGG pathway enrichment showed that human papilloma virus infection pathway, chemokine signaling pathway, pathways in cancer, Epstein-Barr virus infection pathway, proteoglycans in cancer pathway, human cytomegalovirus infection pathway, human T-cell leukemia virus 1 infection pathway, Rap 1 signaling pathway, Wnt signaling pathway, and axon guidance pathway as the top-10 most up-regulated pathways (Figure 2F). These results indicating MN pathophysiological changes involved immune responses.
Screening of Biomarkers for MN
The LASSO logistic regression algorithm was employed to identify 23 genes from DEGs as biomarkers for MN combined results from two λ values (Figure 3A). The protein-protein interaction (PPI) was analyzed (Figure 3B); 30 genes were obtained through use of the random forest algorithm as MN biomarkers (Figure 3C) and PPI analysis (Figure 3D); the learning status of the random forest algorithm showed that the predictive results were useful when scanning MN patients (Figure 3E). The gene markers from two algorithms were overlapped and one related gene (ETS2) was obtained (Figure 3F).
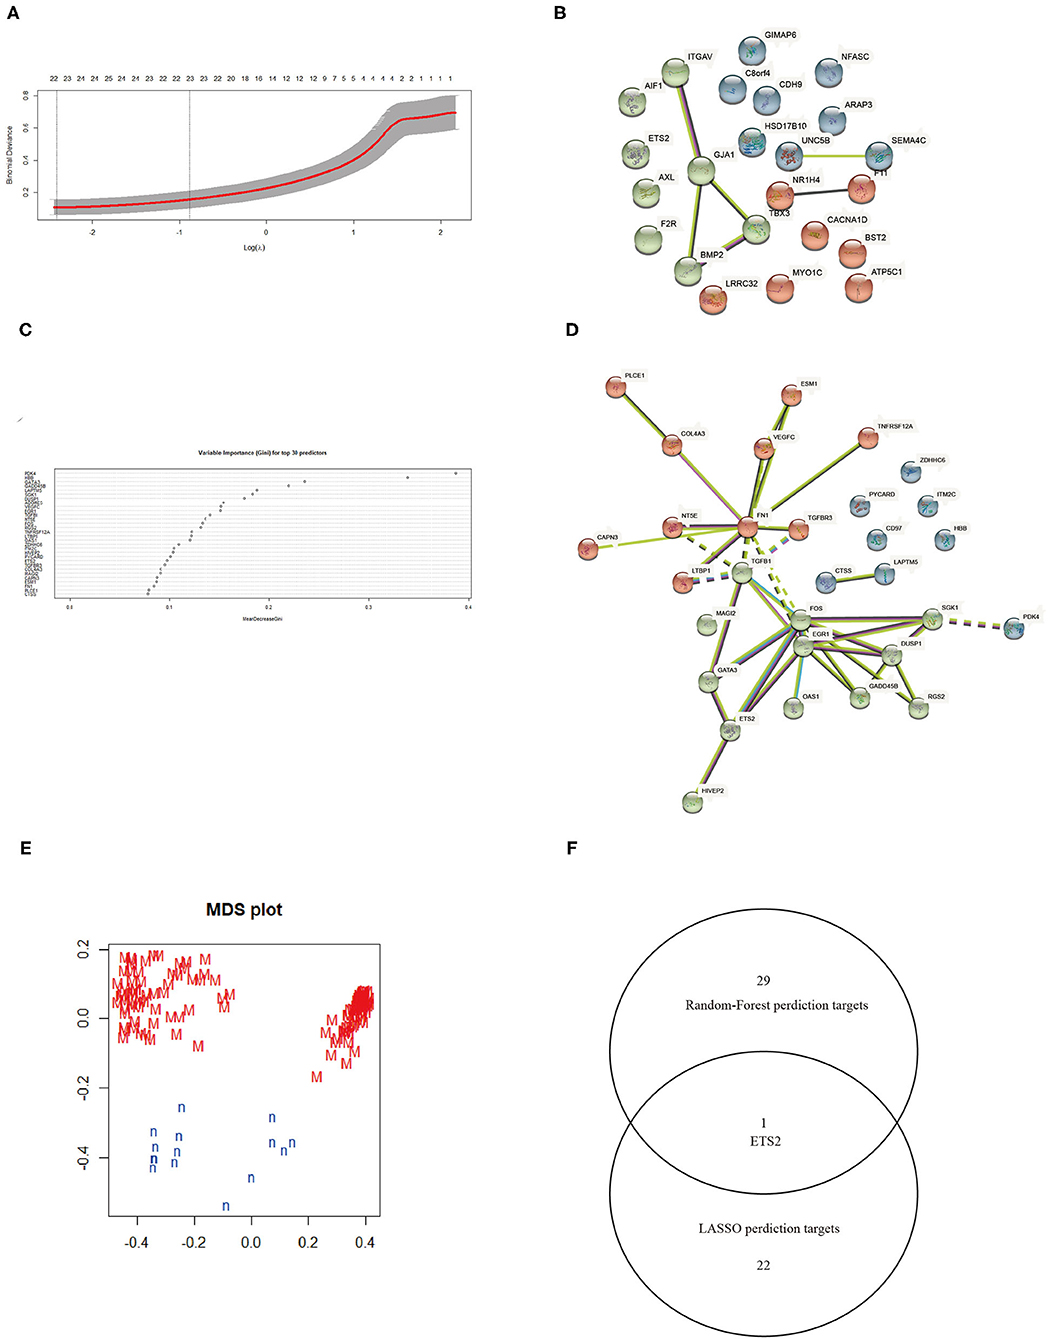
Figure 3. (A) Selection of λ in the LASSO algorithm. (B) PPI network between LASSO algorithm results. (C) Top 30 results from the random forest algorithm. (D) PPI network between random forest algorithm results. (E) Random Forest algorithm learning status. (F) Venn map combining results from the LASSO and random forest algorithms.
Immune Cell Infiltration Results and Correlation Analysis Between Ets2 and Immune Cells
The CIBERSORT tool was used to identify the estimated proportion of immune cells in MN and normal tissues. The estimated proportion of immune cells for each sample is shown in Figure 4A. The immune cell composition in both MN and normal groups was calculated; results showed that there were statistical differences in monocytes, plasma cells, regulatory T cells, and memory B cells (Figure 4B). The correlation between infiltrated immune cells is shown in Figure 4C. The correlation between ETS2 and infiltered immune cells was also determined. ETS2 was positively related to monocytes (cor = 0.63795852, p = 3.007799 × 10⁻¹⁷), M1 phase macrophages (cor = 0.66141468, p = 7.823412 × 10⁻¹⁹), and neutrophils (cor = 0.66695409, p = 3.149015 × 10⁻¹⁹) and negatively correlated to plasma cells (cor = −0.69775865, p = 1.369595 × 10⁻²¹), CD4+ T memory cells (cor = −0.50377651, p = 1.119549 × 10⁻⁷), M2 macrophages (cor = −0.37665222, p = 5.751199 × 10⁻⁶), CD8+ T cells (cor = −0.37258185, p = 6.280381 × 10⁻⁶), memory B cells (cor = −0.35864338, p = 1.455759 × 10⁻⁵), and resting mast cells (cor = −0.28208991, p = 7.672348 × 10⁻⁴) (Figure 4D).
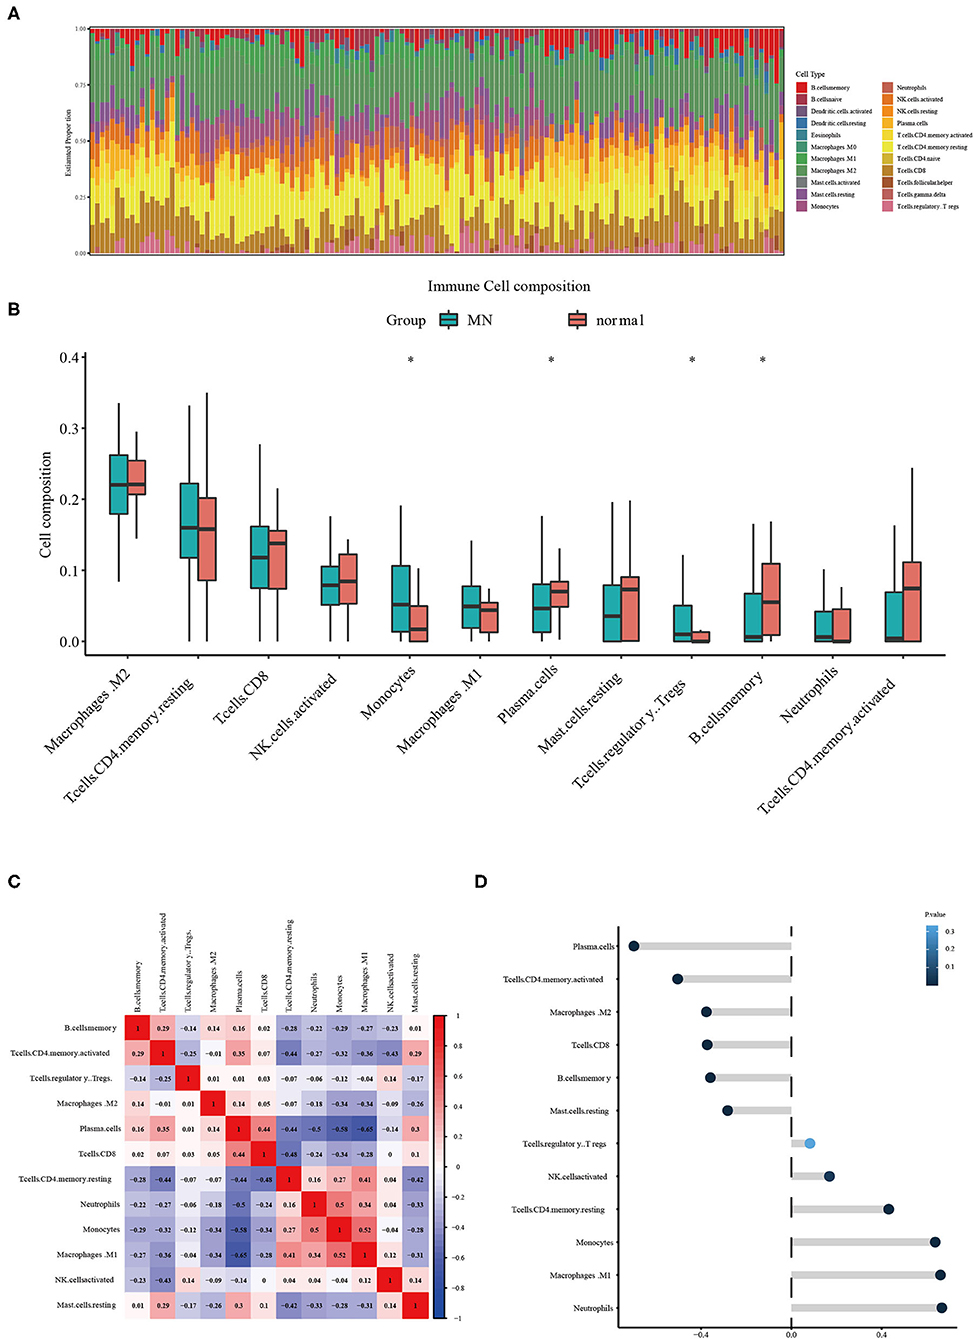
Figure 4. (A) Estimated proportion of immune cells in each sample. (B) Different immune cell infiltration between MN and normal samples. The symbol * represents a P-value < 0.05. (C) Correlation between different infiltrated immune cells. (D) ETS2 Correlation upon different immune cell infiltrations.
Discussion
MN is one of the most common pathological phenotypes for adult NS (3). Treatment for MN includes Rituximab, immunosuppressants, and glucocorticoids (10). Although, some patients can self-heal, many suffer from a protracted course of MN and some would eventually progress to end-stage-kidney-disease and require a kidney transplant.
Immune infiltration plays an important role in MN development (15). B cell activation leads to deposition of immune complex causing classic pathological changes of MN. Immune complex and B cell activation also leads to immune cell infiltration by macrophages. Macrophage phenotypes also play a critical role in the progress of MN; MN patients had a higher ratio of M1 macrophages to M2 phenotype, which led to increased inflammation and caused more damage (8).
We downloaded the expression profile dataset from the GEO database and identified a total of 463 DEGs. GO enrichment analysis showed that DEGs were mainly related to inflammatory response, lymphocyte activation, response to bacterium, response to lipopolysaccharide, leukocyte proliferation, leukocyte migration, response to molecules of bacterial origin, and cellular response to biotic stimulus. These results show that immune activity plays an important role in MN processes. KEGG enrichment analysis showed that up-regulated DEGs mainly belonged to the human papilloma virus infection pathway, chemokine signaling pathway, pathways in cancer, and Epstein-Barr virus infection pathway. These results showed that immune infiltration and immunomodulatory genes were changed during MN pathology changes. Also, targeting immune infiltration and virus-related innate immune could be next generation treatments (15) and diagnostic methods for MN (16).
CIBERSORT analysis result of 22 immune cell infiltration showed the statistical differences in monocytes, plasma cells, regulatory T cells, and memory B cells and indicated that pathways involved in immune cell activation and infiltration could be critical in MN progression. Moreover, these results demonstrated that these immune cells could be viable targets for MN immune suppression treatment.
The expression data were analyzed by using machine learning algorithms to screen possible targets for MN treatment. LASSO and random forest algorithms were used during the scan for treatment targets. We then combined the results from the LASSO algorithm and the random forest algorithm, showing that ETS2 was a suitable target for MN treatment. ETS2 was found to be positively related to monocytes, M1 phase macrophages, and neutrophils and negatively correlated to plasma cells, CD4+ T memory cells, M2 macrophages, CD8+ T cells, memory B cells, and resting mast cells. These results indicated that ETS2 participated in MN pathophysiological immune infiltration. According to previous studies, ETS2 participated in various activities: EST2 can control cytokine production and innate immune activation, which leads to IL-6 suppression and decreased amounts of macrophages (17). These functions of ETS2 could be related to its suppression of MAPK/NF-KB pathways (18). Also, deletion of ETS2 in pancreas leads to fibroblast continuous activation (17), however, studies in kidney showed that ETS2 could promote epithelial-to-mesenchymal transition and cause the progression of renal fibrosis. The study also indicated that these results could be caused by direct levels of regulation between ETS2 and JUNB transcription (19). Moreover, some studies showed that ETS2 interacts with the TGF-β/Smad pathway (20)—a pathway related to renal fibrosis—but studies of ETS2 function in MN are needed.
These results demonstrated that ETS2 was a crucial component for MN activation and immune infiltration, but direct intervention with ETS2 transcription function is not a wise way in which to treat MN. Further studies should be aimed at understanding of ETS2 function in MN and interaction with ETS2 promoting JUNB transaction. Inhibiting ETS2 and JUNB promotor binding could be the next-generation treatment used to cure MN. However, there are some limitations of this study, such as lack of the validations of Ets2 in MN patients at the protein level and Ets2 expression level's relation with patients' clinical outcomes. Further studies in this area are needed.
Data Availability Statement
Publicly available datasets were analyzed in this study. This data can be found here: GEO Database; GSE99340; GSE108113.
Author Contributions
P-ZW: carried out the basic analysis of the study. T-HX and B-YT: provided clinical study of this work. G-YG: took part in statistical analysis. X-LL and LY: took part in study design. All authors contributed to the article and approved the submitted version.
Funding
This work was supported by National Natural Science Foundation of China (Project number: 82070763), Key R&D Program of Liaoning Province (Project number: 2020JH 2/10300045 and 2019JH810300016), Population and Health Special Project of Shenyang Science and Technology Plan (Project number: 19-112-4-031), and Servier Kidney Disease Research and Development Project (Project number: 20010040796).
Conflict of Interest
The authors declare that the research was conducted in the absence of any commercial or financial relationships that could be construed as a potential conflict of interest.
Publisher's Note
All claims expressed in this article are solely those of the authors and do not necessarily represent those of their affiliated organizations, or those of the publisher, the editors and the reviewers. Any product that may be evaluated in this article, or claim that may be made by its manufacturer, is not guaranteed or endorsed by the publisher.
Acknowledgments
The authors thank Dr. Jianming Zeng (University of Macau), and all the members of his bioinformatics team, biotrainee, for generously sharing their experience and codes.
References
1. Couser WG. Primary membranous nephropathy. Clin J Am Soc Nephrol. (2017) 12:983–97. doi: 10.2215/CJN.11761116
2. Alsharhan L, Beck LH Jr. Membranous nephropathy: core curriculum 2021. Am J Kidney Dis. (2021) 77:440–53. doi: 10.1053/j.ajkd.2020.10.009
3. Ronco P, Debiec H. Molecular pathogenesis of membranous nephropathy. Annu Rev Pathol. (2020) 15:287–313. doi: 10.1146/annurev-pathol-020117-043811
4. Burbelo PD, Joshi M, Chaturvedi A, Little DJ, Thurlow JS, Waldman M, et al. Detection of PLA2R autoantibodies before the diagnosis of membranous nephropathy. J Am Soc Nephrol. (2020) 31:208–17. doi: 10.1681/ASN.2019050538
5. Tomas NM, Beck LH Jr, Meyer-Schwesinger C, Seitz-Polski B, Ma H, Zahner G, et al. Thrombospondin type-1 domain-containing 7A in idiopathic membranous nephropathy. N Engl J Med. (2014) 371:2277–87. doi: 10.1056/NEJMoa1409354
6. Sethi S. New ‘Antigens' in membranous nephropathy. J Am Soc Nephrol. (2021) 32:268–78. doi: 10.1681/ASN.2020071082
7. Su Z, Jin Y, Zhang Y, Guan Z, Li H, Chen X, et al. The Diagnostic and prognostic potential of the B-cell repertoire in membranous nephropathy. Front Immunol. (2021) 12:635326. doi: 10.3389/fimmu.2021.635326
8. Hu W, Li G, Lin J, Dong W, Yu F, Liu W, et al. M2 macrophage subpopulations in glomeruli are associated with the deposition of IgG subclasses and complements in primary membranous nephropathy. Front Med. (2021) 8:657232. doi: 10.3389/fmed.2021.657232
9. Rosenzwajg M, Languille E, Debiec H, Hygino J, Dahan K, Simon T, et al. B- and T-cell subpopulations in patients with severe idiopathic membranous nephropathy may predict an early response to rituximab. Kidney Int. (2017) 92:227–37. doi: 10.1016/j.kint.2017.01.012
10. Fervenza FC, Appel GB, Barbour SJ, Rovin BH, Lafayette RA, Aslam N, et al. Rituximab or cyclosporine in the treatment of membranous nephropathy. N Engl J Med. (2019) 381:36–46. doi: 10.1056/NEJMoa1814427
11. Snider JM, You JK, Wang X, Snider AJ, Hallmark B, Zec MM, et al. Group IIA secreted phospholipase A2 is associated with the pathobiology leading to COVID-19 mortality. J Clin Invest. (2021) 131:e149236. doi: 10.1172/JCI149236
12. Clynick B, Corte TJ, Jo HE, Stewart I, Glaspole IN, Grainge C, et al. Biomarker signatures for progressive idiopathic pulmonary fibrosis. Eur Respir J. (2021). doi: 10.1183/13993003.01181-2021. [Epub ahead of print].
13. Barnes BM, Nelson L, Tighe A, Burghel GJ, Lin IH, Desai S, et al. Distinct transcriptional programs stratify ovarian cancer cell lines into the five major histological subtypes. Genome Med. (2021) 13:140. doi: 10.1186/s13073-021-00952-5
14. Newman AM, Steen CB, Liu CL, Gentles AJ, Chaudhuri AA, Scherer F, et al. Determining cell type abundance and expression from bulk tissues with digital cytometry. Nat Biotechnol. (2019) 37:773–82. doi: 10.1038/s41587-019-0114-2
15. Motavalli R, Etemadi J, Kahroba H, Mehdizadeh A, Yousefi M. Immune system-mediated cellular and molecular mechanisms in idiopathic membranous nephropathy pathogenesis and possible therapeutic targets. Life Sci. (2019) 238:116923. doi: 10.1016/j.lfs.2019.116923
16. Mertowski S, Lipa P, Morawska I, Niedzwiedzka-Rystwej P, Bebnowska D, Hrynkiewicz R, et al. Toll-like receptor as a potential biomarker in renal diseases. Int J Mol Sci. (2020) 21:6712. doi: 10.3390/ijms21186712
17. Pitarresi JR, Liu X, Sharma SM, Cuitiño MC, Kladney RD, Mace TA, et al. Stromal ETS2 regulates chemokine production and immune cell recruitment during acinar-to-ductal metaplasia. Neoplasia (New York, NY). (2016) 18:541–52. doi: 10.1016/j.neo.2016.07.006
18. Ma X, Jiang Z, Li N, Jiang W, Gao P, Yang M, et al. Ets2 suppresses inflammatory cytokines through MAPK/NF-κB signaling and directly binds to the IL-6 promoter in macrophages. Aging. (2019) 11:10610–25. doi: 10.18632/aging.102480
19. Yao F, Wang X, Cui ZK, Lan H, Ai X, Song Q, et al. ETS2 promotes epithelial-to-mesenchymal transition in renal fibrosis by targeting JUNB transcription. Lab Invest. (2020) 100:438–53. doi: 10.1038/s41374-019-0331-9
Keywords: membranous nephropathy, machine learning, immune infiltration, Ets2, chronic kidney disease
Citation: Wan P-Z, Xu T-H, Tian B-Y, Guo G-Y, Li X-L and Yao L (2022) Machine Learning Reveals Ets2 as a Novel Target for Membranous Nephropathy Treatment and Its Role in Immune Infiltration. Front. Med. 9:813329. doi: 10.3389/fmed.2022.813329
Received: 11 November 2021; Accepted: 08 February 2022;
Published: 18 March 2022.
Edited by:
Jingyuan Xie, Shanghai Jiao Tong University, ChinaReviewed by:
Huang Biao, Zhejiang Sci-Tech University, ChinaMarc Hilhorst, Academic Medical Center, Netherlands
Copyright © 2022 Wan, Xu, Tian, Guo, Li and Yao. This is an open-access article distributed under the terms of the Creative Commons Attribution License (CC BY). The use, distribution or reproduction in other forums is permitted, provided the original author(s) and the copyright owner(s) are credited and that the original publication in this journal is cited, in accordance with accepted academic practice. No use, distribution or reproduction is permitted which does not comply with these terms.
*Correspondence: Xiao-Li Li, Zm94ZmluZGVyOTlAc29odS5jb20=; Li Yao, bGl5YW9fY211QDE2My5jb20=
 Peng-Zhi Wan
 Tian-Hua Xu
 Li Yao