 Siyu Liang
 Lize Sun
 Yuelun Zhang
 Qi Zhang4
 Nan Jiang
 Huijuan Zhu
 Shi Chen
 Hui Pan
- 1Department of Endocrinology, Key Laboratory of Endocrinology of National Health Commission, Translation Medicine Center, Peking Union Medical College Hospital, Peking Union Medical College, Chinese Academy of Medical Sciences, Beijing, China
- 2Eight-year Program of Clinical Medicine, Peking Union Medical College Hospital, Peking Union Medical College, Chinese Academy of Medical Sciences, Beijing, China
- 3Central Research Laboratory, Peking Union Medical College Hospital, Peking Union Medical College, Chinese Academy of Medical Sciences, Beijing, China
- 4Department of Clinical Laboratory, Peking Union Medical College Hospital, Peking Union Medical College, Chinese Academy of Medical Sciences, Beijing, China
- 54+4 Medical Doctor Program, Peking Union Medical College Hospital, Peking Union Medical College, Chinese Academy of Medical Sciences, Beijing, China
Background: Dysnatremia is the most common electrolyte disorder in hospitalized patients. Sodium fluctuation level may be a better parameter in dysnatremia management. We aimed to examine the association between sodium fluctuation level during hospitalization and mortality and to evaluate its value in predicting poor prognosis among general hospitalized patients.
Methods: Data were collected from patients admitted to Peking Union Medical College Hospital. The generalized estimated equation (GEE) was used to examine the relationship between sodium fluctuation level and mortality. Receiver-operating characteristic (ROC) curve analysis was performed to calculate the optimal cutoff value and the area under the ROC curve (AUC).
Results: Sodium fluctuation level showed a dose-dependent association with increased mortality in general hospitalized patients. After adjusting age, sex, length of hospital stay, and Charlson comorbidity index, the ORs of group G2 to G6 were 5.92 (95% CI 5.16–6.79), 26.45 (95% CI 22.68–30.86), 50.71 (95% CI 41.78–61.55), 104.38 (95% CI 81.57–133.58), and 157.64 (95% CI 112.83–220.24), respectively, p trend <0.001. Both normonatremia and dysnatremia patients on admission had the dose-dependent associations similar to general hospitalized patients. The AUC of sodium fluctuation level was 0.868 (95% CI 0.859–0.877) in general hospitalized patients, with an optimal cutoff point of 7.5 mmol/L, a sensitivity of 76.5% and a specificity of 84.2%.
Conclusion: We determined that sodium fluctuation level had a dose-dependent association with increased mortality in general hospitalized patients. Sodium fluctuation level could be used to develop a single parameter system in predicting mortality in general hospitalized patients with acceptable accuracy, sensitivity, and specificity.
1 Introduction
Dysnatremia is the most common electrolyte disorder in hospitalized patients. Dysnatremia is classified into hyponatremia and hypernatremia. Hyponatremia is defined as a serum sodium level below 135 mmol/L and is observed in 14–22% hospitalized patients (1, 2). Hypernatremia is regarded as a serum sodium level above 145 mmol/L and is found in 21–26% hospitalized patients (3, 4). Previous studies have shown that both hyponatremia and hypernatremia were independently associated with poor prognosis (3, 5). Severe hyponatremia may cause cerebral edema (6). While hypernatremia contributes to cerebral dehydration, resulting in epileptic seizures, coma, or respiratory arrest (7). Therefore, accurate identification of high-risk dysnatremia patients is crucial for precise management.
In recent years, several studies noted that hyponatremia and hypernatremia frequently occurred in the same patient within a short period; this condition was defined as mixed dysnatremia (8). Patients with mixed dysnatremia were associated with an increased risk of mortality (9), suggesting that sodium fluctuation level during hospitalization could be more accurate in reflecting disease severity than serum sodium level. In addition, patients with serum sodium levels between reference ranges (135 mmol/L-145 mmol/L) are regarded as low-risk patients. However, recent studies suggested that sodium fluctuations were associated with mortality even within sodium reference ranges (10). Therefore, considering the clinical significance of mixed dysnatremia and sodium fluctuations within the normal range, sodium fluctuation level during hospitalization may be a better parameter in dysnatremia management.
The poor prognostic impact of sodium fluctuation during hospitalization has been evaluated in patients with normonatremia on admission (11–13). However, these studies ignored patients with dysnatremia on admission. Patients admitted with dysnatremia frequently combined with chronic hyponatremia or hypernatremia. Thus, when these patients experience additional sodium fluctuations during hospitalization, the management of dysnatremia will be more difficult, leading to an increased risk of mortality. We hypothesized that sodium fluctuation during hospitalization was also associated with poor prognosis in patients with dysnatremia on admission. Therefore, this study included patients with normonatremia and dysnatremia on admission to evaluate the value of sodium fluctuation level during hospitalization in predicting mortality in general hospitalized patients.
The aim of our study is (i) to determine the association between sodium fluctuation level during hospitalization and the risk of mortality; (ii) to evaluate the value of sodium fluctuation level in predicting prognosis among general hospitalized patients.
2 Materials and methods
2.1 Study design
The single-center retrospective cohort study was conducted at Peking Union Medical College Hospital (Beijing, China). Patients admitted between 1 January 2015 and 9 August 2020 were included in this study. Both data collection and follow-up were from the Electronic Medical Record (EMR), and the data collection stopped after the patients were discharged.
The study was approved by the Ethics Committee of Peking Union Medical College Hospital, Chinese Academy of Medical Sciences (approval number: S-k1272, approval date: 9 October 2020). This study was reported according to The Strengthening the Reporting of Observational Studies in Epidemiology (STROBE) (14).
2.2 Participants
Participants were from Peking Union Medical College Hospital, Chinese Academy of Medical Sciences. Patients were included if they (i) were over 18 years of age; (ii) had at least two serum sodium measurements during hospitalization. Patients were excluded if they (i) had incomplete diagnostic codes; (ii) were without serum sodium measurement within 24 h after admission; or (iii) had conflict serum sodium levels in the same laboratory test. The inclusion and exclusion of participants were based on the records of EMR.
2.3 Study variables
All variables were collected through EMR, including age, sex, diagnosis codes, laboratory tests, and intensive care unit (ICU) transfer. General hospitalized patients were classified into 2 groups according to their serum sodium level on admission: (i) normonatremia on admission (serum sodium level between 135 mmol/L and 145 mmol/L on admission); (ii) dysnatremia on admission (serum sodium level below 135 mmol/L or above 145 mmol/L on admission). The minimum serum sodium level was defined as the lowest record of serum sodium measurements during a single hospitalization. The maximum serum sodium level was defined as the highest record of serum sodium measurements during a single hospitalization. Sodium fluctuation level was defined as difference between the maximum and minimum serum sodium levels during a single hospitalization.
According to previous studies, sodium fluctuation level below 6.0 mmol/L was treated as normal and was associated with a relatively low risk of death (10). Therefore, we divided patients into 6 groups to examine the dose-dependent relationship between sodium fluctuation level and mortality: G1 group (sodium fluctuation level < 6.0 mmol/L), G2 group (sodium fluctuation level between 6.0 mmol/L and 12.0 mmol/L), G3 group (sodium fluctuation level between 12.0 mmol/L and 18.0 mmol/L), G4 group (sodium fluctuation level between 18.0 mmol/L and 24.0 mmol/L), G5 group (sodium fluctuation level between 24.0 mmol/L and 30.0 mmol/L), and G6 group (sodium fluctuation level > 30.0 mmol/L).
We further categorized the primary diagnoses according to the International Classification of Diseases, 10th Revision, and calculated the Charlson comorbidity index (CCI) to measure comorbidity (15). The diagnostic codes were shown in Supplementary Table S1.
2.4 Outcomes
Our primary outcome was mortality, which was extracted from EMR. Several patients discharged against medical advice (AMA) had poor prognoses. However, they chose to leave the hospital due to various reasons (16). Considering the high mortality rate in AMA discharged patients in this study center, we defined mortality as in-hospital mortality and AMA discharged.
2.5 Statistical analysis
Categorical variables were reported as count (%), and continuous variables were reported as mean with standard deviation (SD). The Cochran-Armitage test was used to assess trends between categorical variables.
The primary analysis was the GEE. We chose GEE because our study comprised 20,164 re-hospitalized patients. In our analysis, the sodium fluctuation level was defined as the difference between the maximum and minimum serum sodium levels observed during a single hospitalization. Consequently, the readmitted patients had multiple measurements of sodium fluctuation levels. Prior studies have also utilized GEE to analyze repeated measurements (17, 18). Hence, we opted for GEE to model the relationship between sodium fluctuations, the number of hospitalizations, and mortality, and to test the main effect of sodium fluctuation on mortality. The GEE approach identified the repeated measurements by patient ID, and an exchangeable matrix was used as the working matrix. The odds ratio (OR) with 95% confidence interval (CI) were calculated to examine (i) the association and overall trends between sodium fluctuation level and mortality; and (ii) the association between sodium fluctuation level during hospitalization, minimum serum sodium level, maximum serum sodium level and mortality. The variance inflation factor test was performed to avoid the collinearity of the variables included in the models. Sensitivity analysis was further used to adjust the impact of AMA discharge on patients’ outcomes.
We used receiver-operating characteristic (ROC) curve analysis to investigate the ability of a single laboratory value, such as sodium fluctuation level during hospitalization, minimum serum sodium level, or maximum serum sodium level to predict mortality. The patient-specific predicted survival values and optimal cutoff value were derived from the ROC curve analysis. AUC was calculated based on original value of sodium fluctuation level during hospitalization, minimum serum sodium level, or maximum serum sodium level. The Delong test was used to compare the difference between AUCs of sodium fluctuation level during hospitalization, minimum serum sodium level, and maximum serum sodium level. The Brier score and calibration metrics were derived from logistic regression model.
All analyses were conducted with R (version 4.0.2, R Foundation for Statistical Computing, Vienna, Austria, 20201).
3 Results
3.1 Demographic and characters
A total of 390,116 patients admitted to Peking Union Medical College Hospital between 1 January 2015 and 9 August 2020 were screened for inclusion. After excluding non-eligible cases, 135,482 patients were included in this study, as shown in Figure 1. The baseline characters of patients were summarized in Table 1. Patients had a mean age of 54.15 years (SD 15.95), with a mean CCI of 2.11 (SD 2.52). The cohort had a similar number of men and women, and 70,037 (51.7%) of 135,482 patients were female. The average of hospital stays was 13.24 days (SD 13.26) in general hospitalized patients, 12.77 days (SD 12.21) in normonatremia patients on admission, and 18.33 days (SD 20.95) in dysnatremia patients on admission. 1912 (1.4%) patients died in hospital or had an AMA discharge.
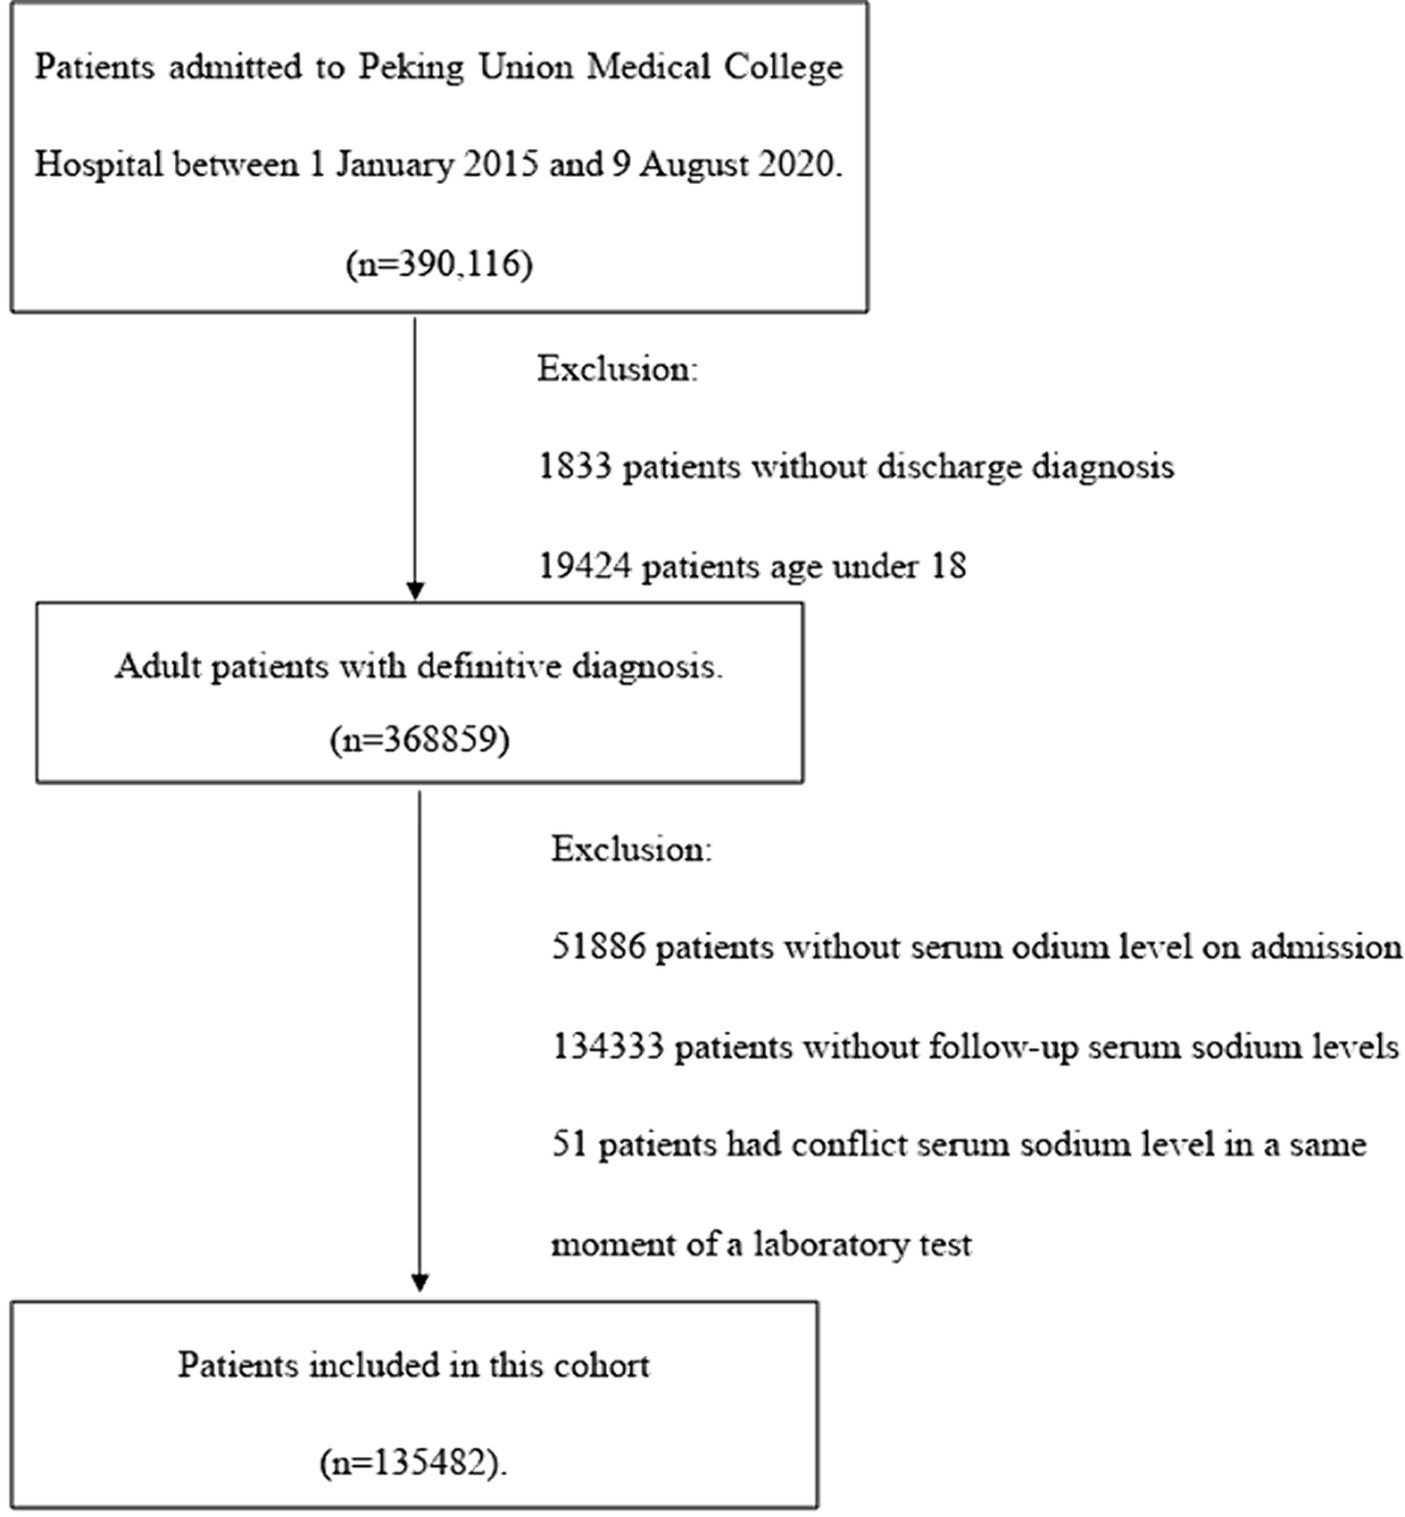
Figure 1. Flow chart of inclusion and exclusion of study cohort.
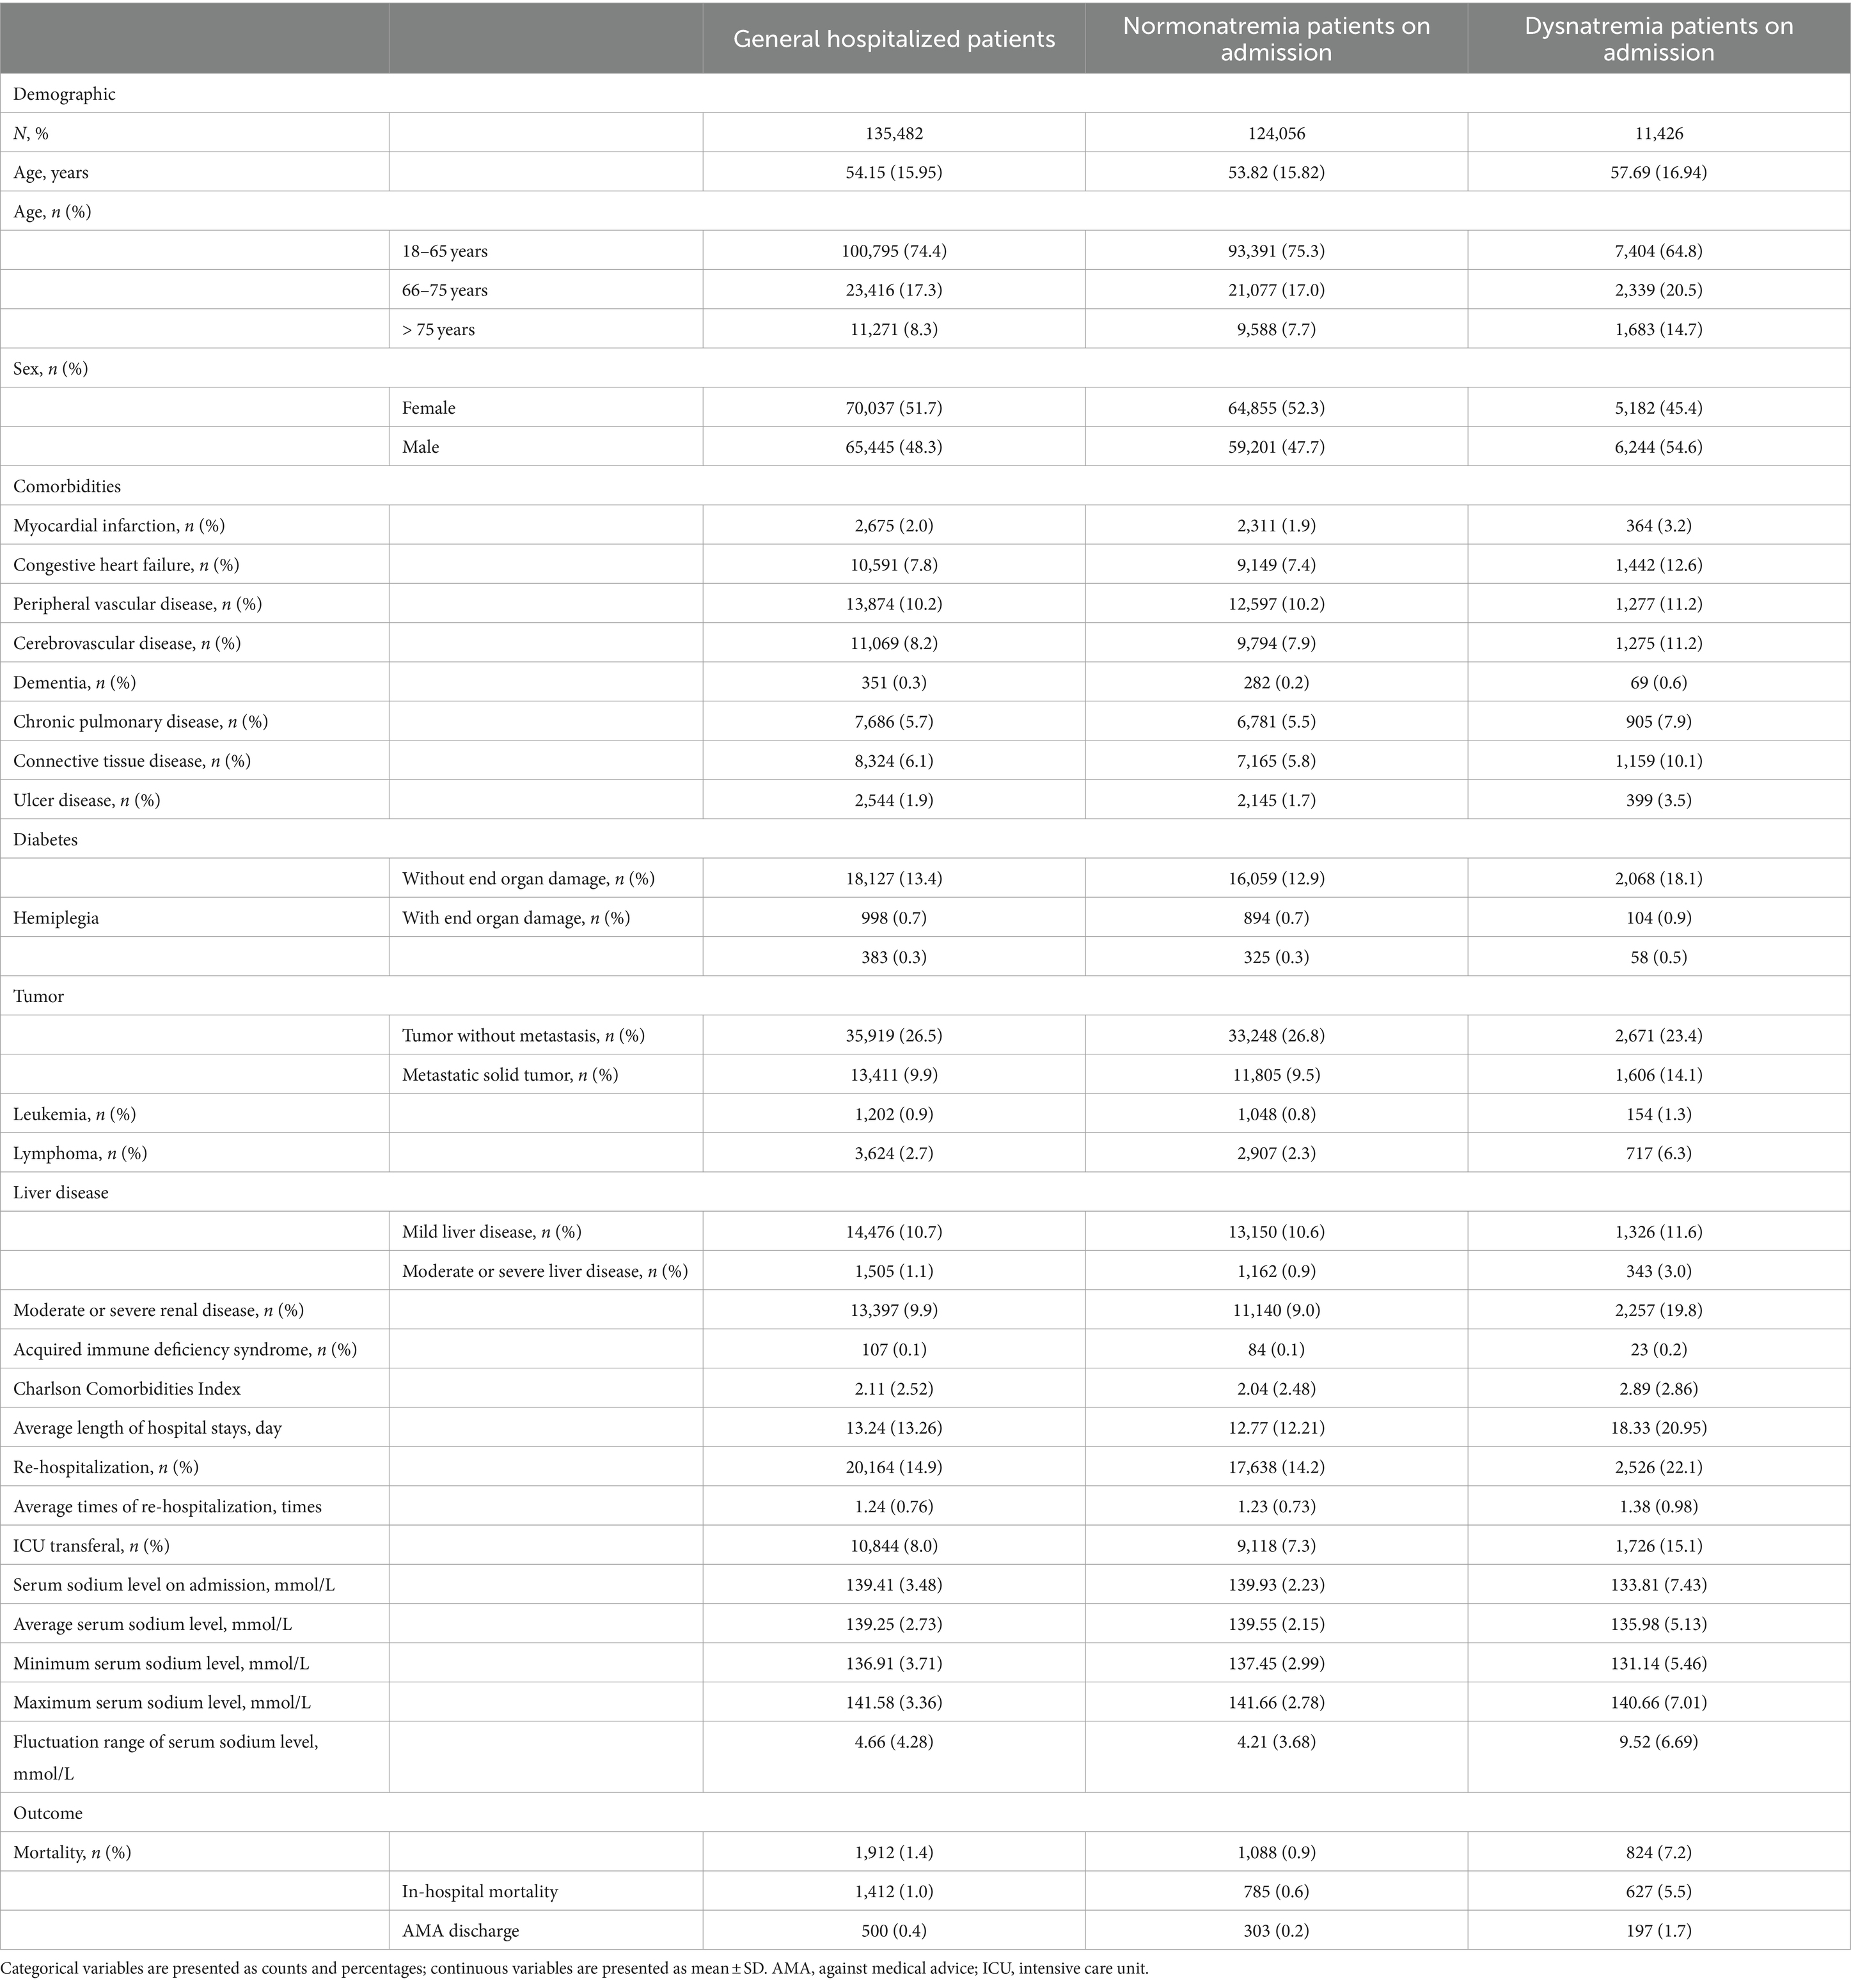
Table 1. Baseline characters and outcomes of normonatremia patients on admission and dysnatremia patients on admission.
Among these mortality cases, 824 (7.2%) patients had dysnatremia on admission, and 1,088 (0.9%) patients were normonatremia on admission.
3.2 Impact of sodium fluctuation level during hospitalization on outcomes
Sodium fluctuation level during hospitalization showed a dose-dependent association with increased mortality in general hospitalized patients. The mortality rate of group G1 to G6 were 372 (0.4%), 554 (2.4%), 475 (10.2%), 274 (17.7%), 159 (29.3%), and 85 (26.6%), respectively, p trend <0.001, as shown in Table 2. As Supplementary Table S2 showed that sodium fluctuation level was moderately correlated with length of hospital stays (r = 0.45, p < 0.001), and was weakly correlated with age (r = 0.09, p < 0.001) and CCI (r = 0.13, p < 0.001). Therefore, we adjusted age, sex, CCI, and length of hospital stays in model 1. The ORs of group G2 to G6 were 5.92 (95% CI 5.16–6.79), 26.45 (95% CI 22.68–30.86), 50.71 (95% CI 41.78–61.55), 104.38 (95% CI 81.57–133.58), and 157.64 (95% CI 112.83–220.24), respectively, p trend <0.001. Moreover, both normonatremia patients and dysnatremia patients on admission showed the dose-dependent associations similar to general hospitalized patients. After adjusting age, sex, CCI, and length of hospital stay, the ORs of group G2 to G6 in normonatremia patients on admission were 6.90 (95% CI 5.48–7.68), 34.26 (95% CI 28.42–41.29), 71.85 (95% CI 56.23–91.81), 121.87 (95% CI 85.26–174.18), and 226.55 (95% CI 136.54–375.90), respectively, p trend <0.001; the ORs of group G2 to G6 in dysnatremia patients on admission were 2.06 (95% CI 1.63–2.60), 5.34 (95% CI 4.15–6.88), 8.66 (95% CI 6.43–11.66), 20.77 (95% CI 14.70–29.34), and 26.02 (95% CI 16.62–40.73), respectively, p trend <0.001.
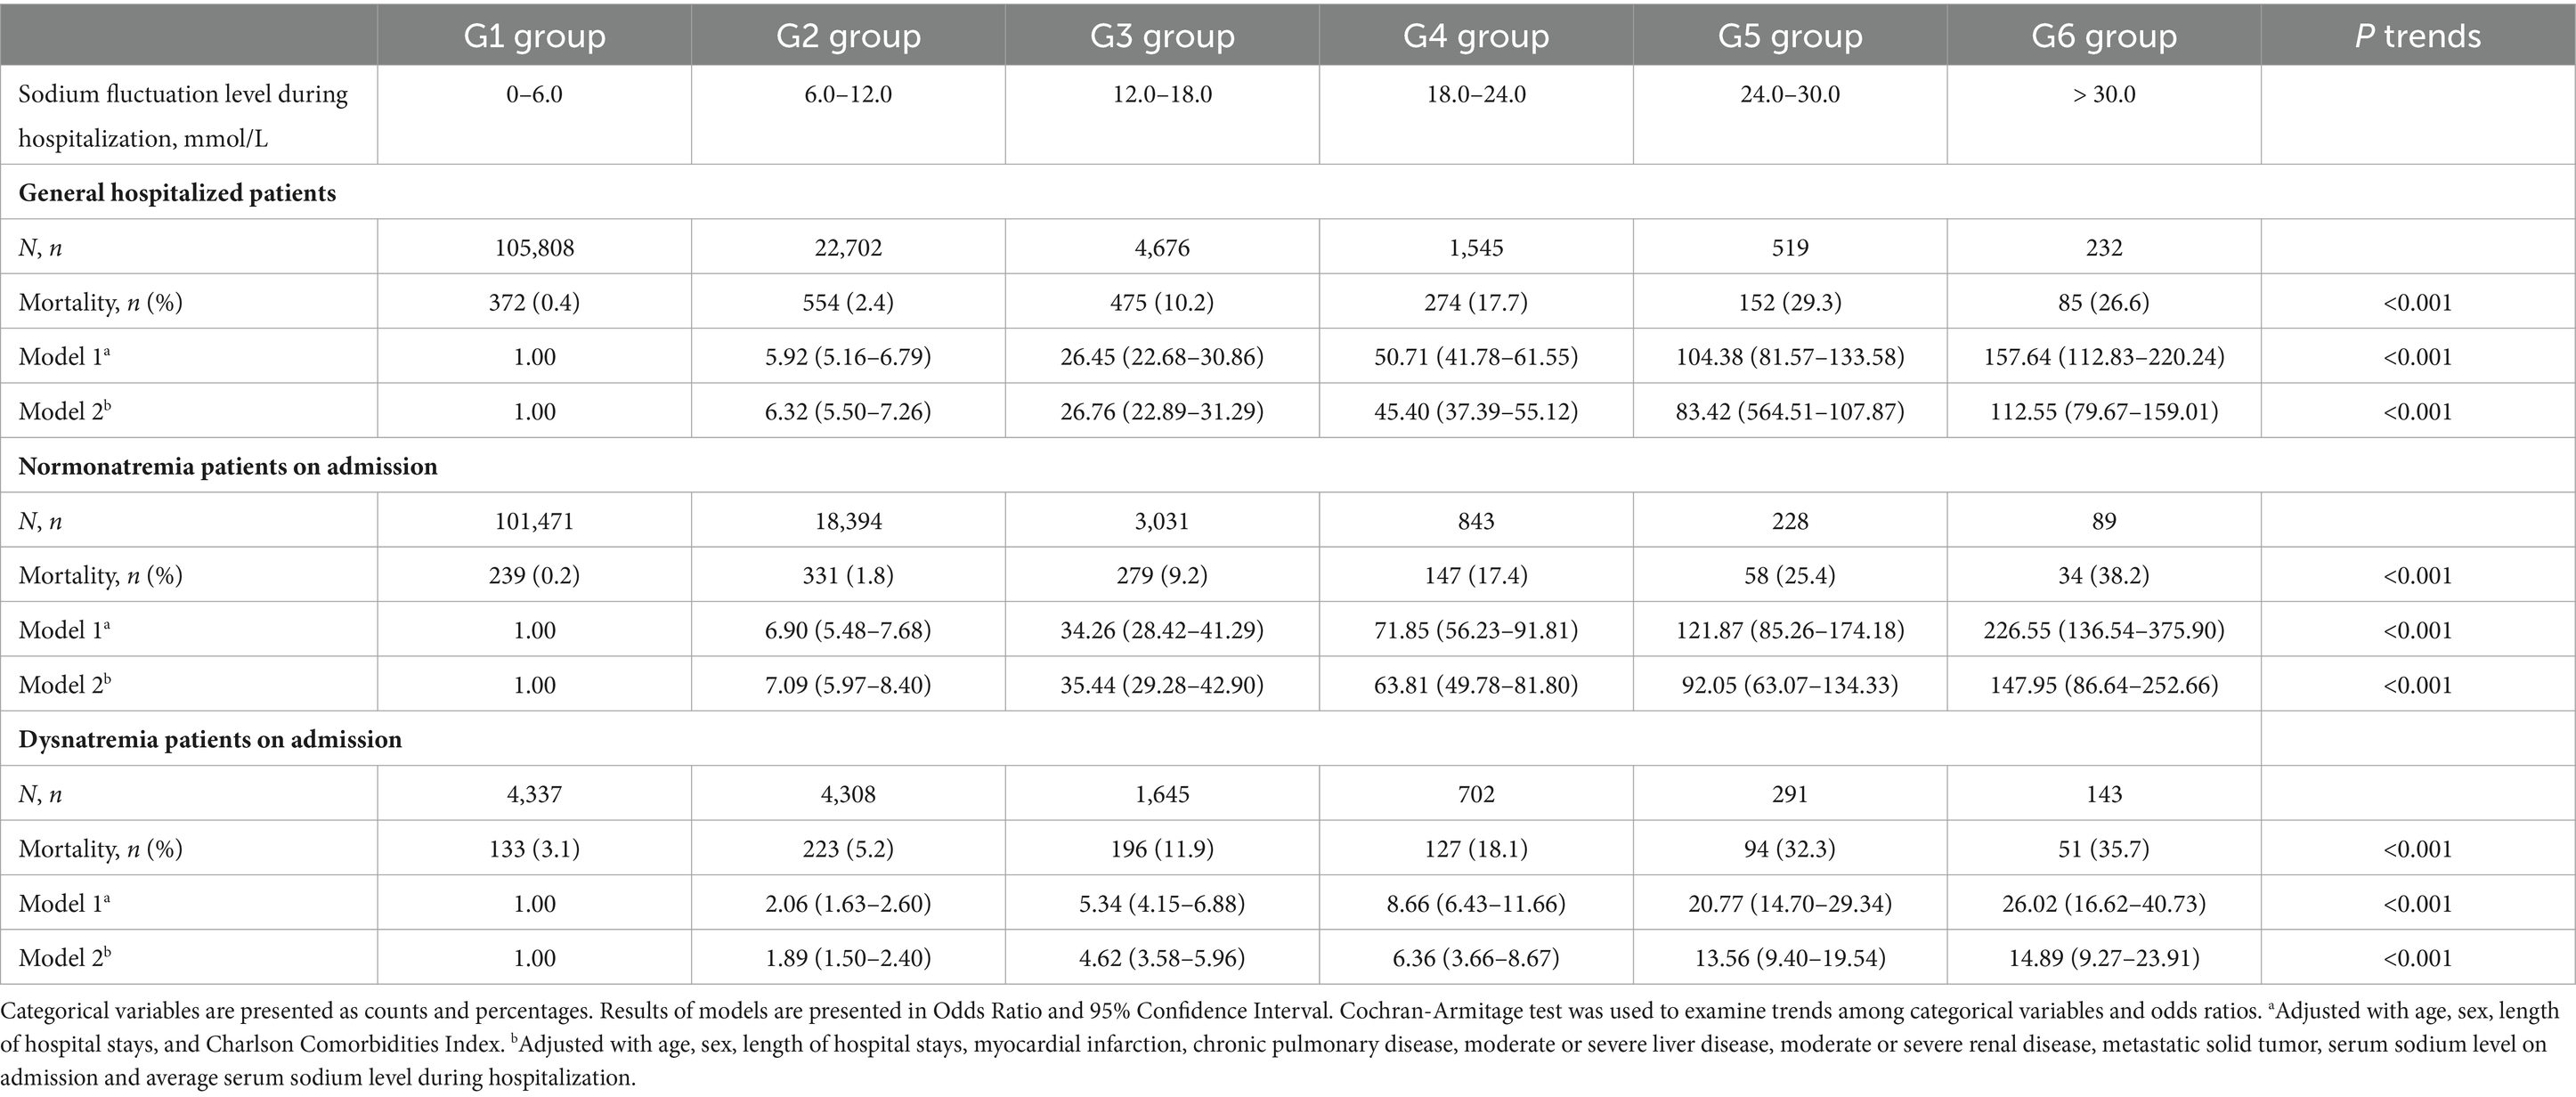
Table 2. The association between sodium fluctuation level during hospitalization and mortality based on generalized estimated equations.
Figure 2 depicts the dose-dependent association between sodium fluctuation level during hospitalization and mortality in general hospitalized patients, normonatremia patients on admission, and dysnatremia patients on admission. The results of the sensitivity analysis were shown in Supplementary Tables S3, S4, which showed no significant difference with Table 2. We further examined the association between sodium fluctuation level divided by cutoffs of 3 and 10 and mortality. The results were consistent with the results of sodium fluctuation divided by cutoffs of 6, which were summarized in Supplementary Tables S5, S6, Supplementary Figures S1, S2.
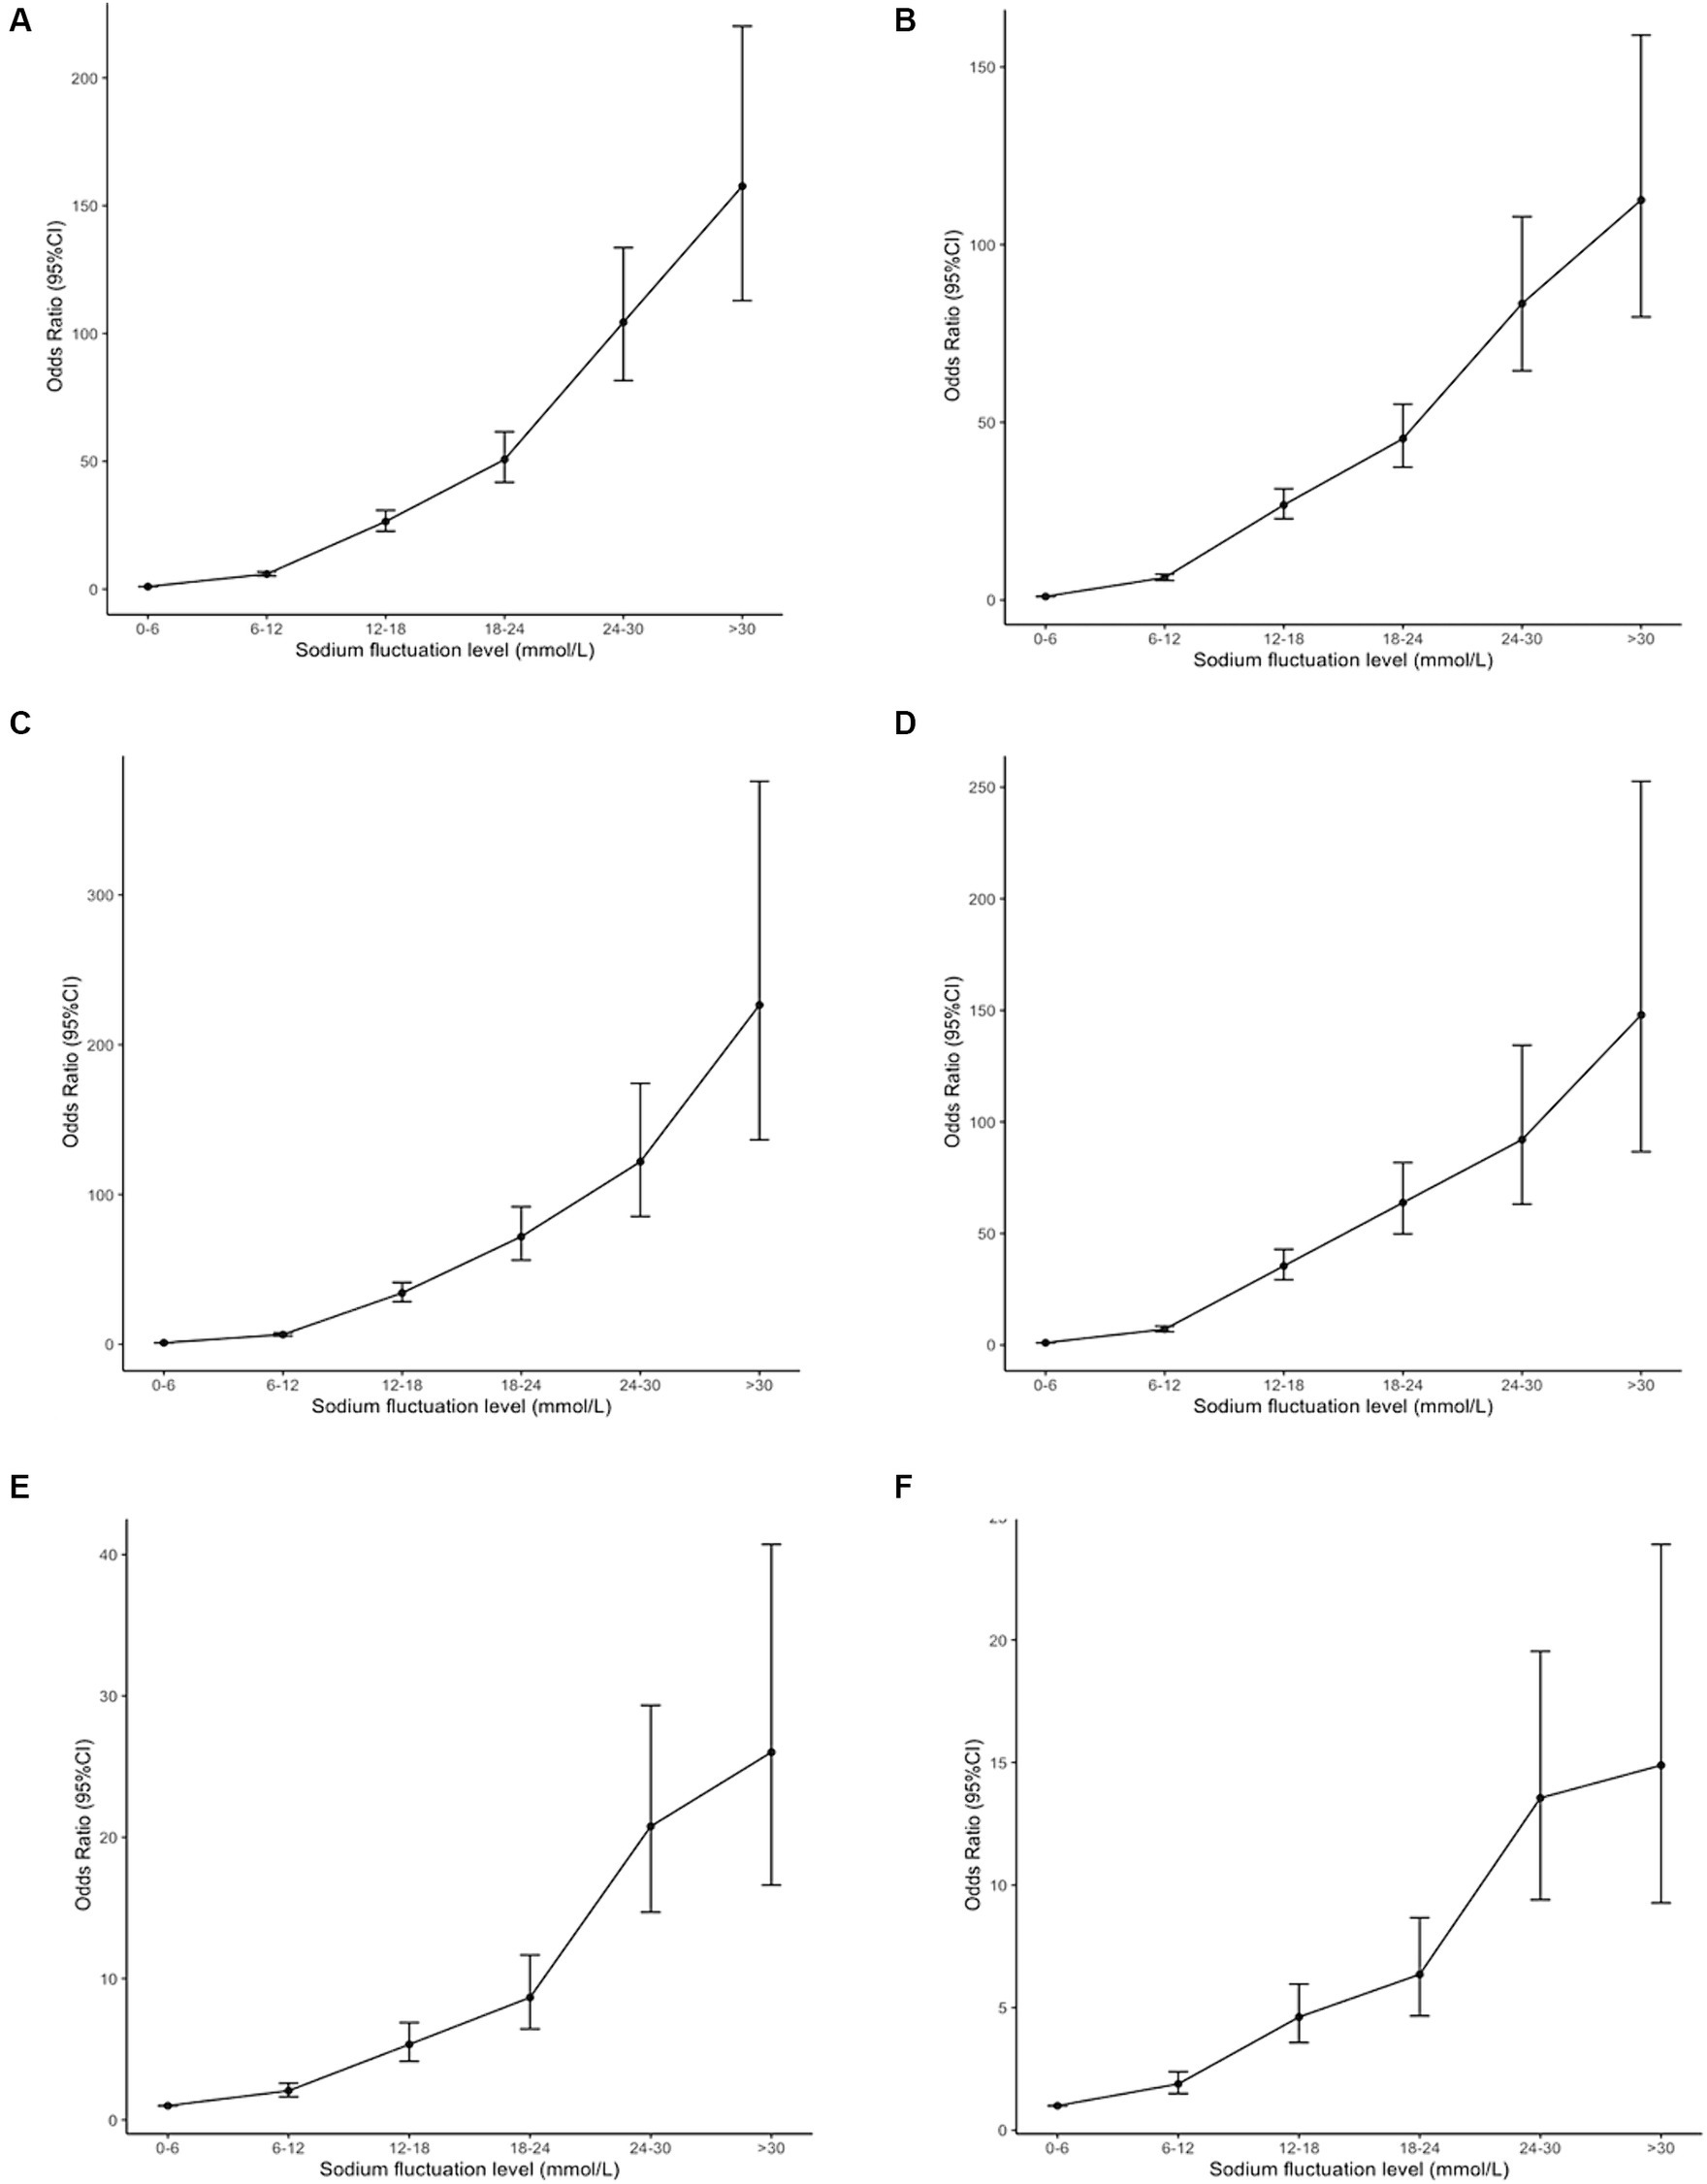
Figure 2. The association between serum sodium fluctuation level during hospitalization (cutoff = 6 mmol/L) and mortality. The Odds Ratios (OR) and 95% Confidence Intervals (CI) were generated based on generalized estimated equations. (A,C,E) Showed the OR and 95% CI of sodium fluctuation level during hospitalization (cutoff = 6 mmol/L) after adjustment of age, sex, length of hospital stays, and Charlson Comorbidities Index in general hospitalized patients, normonatremia patients on admission, and dysnatremia patients on admission. (B,D,F) Showed the OR and 95% CI of sodium fluctuation level during hospitalization (cutoff = 6 mmol/L) after adjustment of age, sex, length of hospital stays, myocardial infarction, chronic lung disease, moderate-to-severe liver failure, moderate-to-severe kidney failure, metastatic solid tumor, serum sodium level on admission and average serum sodium level during hospitalization in general hospitalized patients, normonatremia patients on admission, and dysnatremia patients on admission. CI, confidence interval.
3.3 The association between sodium fluctuation level during hospitalization, minimum serum sodium level, maximum serum sodium level and mortality
Table 3 demonstrated that sodium fluctuation level during hospitalization was associated with mortality in general hospitalized patients, normonatremia patients on admission, and dysnatremia patients on admission. The ORs of sodium fluctuation level increased per 1 mmol/L were 1.21 (95% CI 1.20–1.22), 1.24 (95% CI 1.23–1.26), and 1.12 (95% CI 1.10–1.14), respectively, after adjusting age, sex, length of hospital stays, and CCI. Additionally, an increase in the maximum serum sodium level was associated with increased mortality in general hospitalized patients (OR 1.21, 95% CI 1.20–1.22), normonatremia patients on admission (OR 1.27, 95% CI 1.25–1.29), and dysnatremia patients on admission (OR 1.11, 95% CI 1.10–1.13), after the adjustment of age, sex, length of hospital stays, and CCI. However, minimum serum sodium level was associated with mortality in only general hospitalized patients and normonatremia patients on admission. After the adjustment of age, sex, length of hospital stays, and CCI, the ORs of minimum serum sodium level decreased per 1 mmol/L were 1.39 (95% CI 1.37–1.41) and 1.46 (95% CI 1.43–1.49), respectively. The sensitivity analysis yielded similar results, as shown in Supplementary Tables S7, S8.
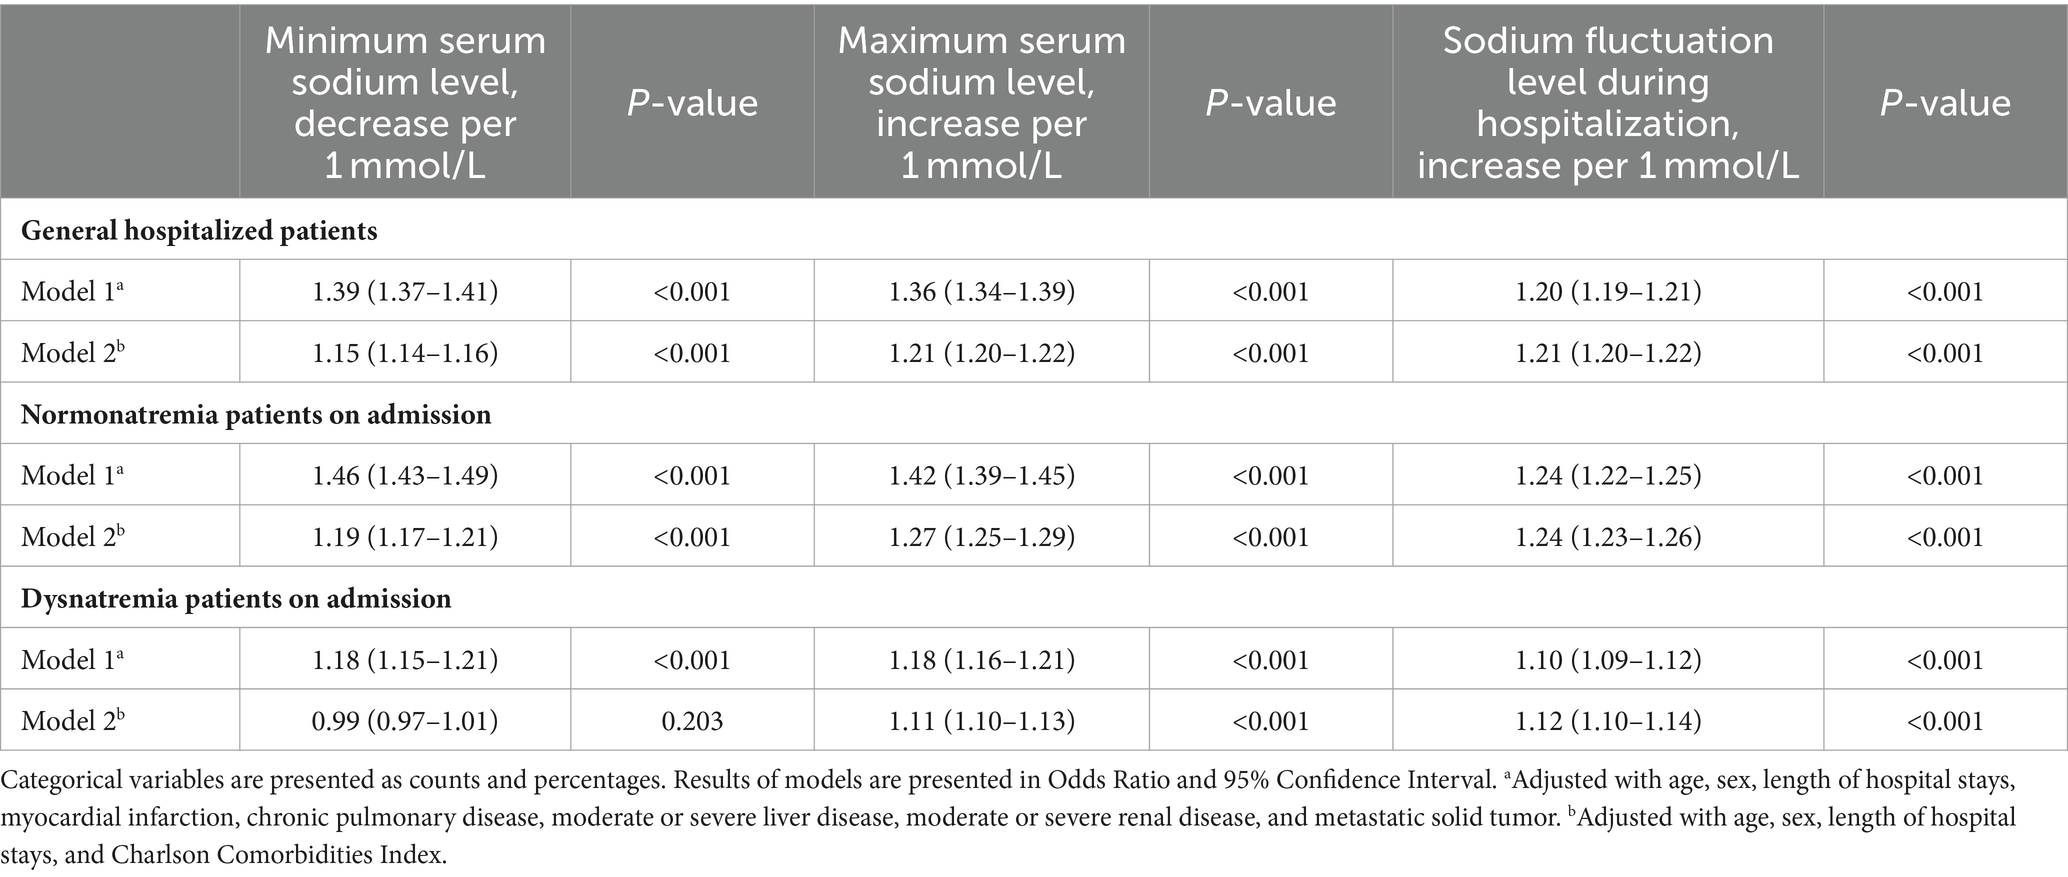
Table 3. The association between sodium fluctuation level during hospitalization, minimum serum sodium level, maximum serum sodium level and mortality based on generalized estimated equations.
3.4 Sodium fluctuation level during hospitalization predict mortality
ROC curve analysis was performed to calculate the optimal cutoff values and the AUCs of minimum serum sodium level, maximum serum sodium level, and sodium fluctuation level during hospitalization in general hospitalized patients, as shown in Figure 3A. The AUC of sodium fluctuation level during hospitalization was 0.868 (95% CI 0.859–0.877), which was significantly higher than minimum serum sodium level (AUC 0.750, 95% CI 0.736–0.764, p < 0.001) and maximum serum sodium level (AUC 0.705, 95% CI 0.688–0.721, p < 0.001). In addition, the AUCs of sodium fluctuation level were 0.868 (95% CI 0.855–0.881) in normonatremia patients on admission and 0.728 (95% CI 0.709–0.747) in dysnatremia patients on admission, which were also significantly higher than the AUCs of minimum and maximum serum sodium level in both normonatremia and dysnatremia patients on admission.

Figure 3. The receiver operating character curve of minimum serum sodium level (blue curve), maximum serum sodium level (green curve), and sodium fluctuation level during hospitalization (red curve) in predicting mortality. The cutoffs of minimum serum sodium level, maximum serum sodium level, and sodium fluctuation level during hospitalization were determined based on the optimal cutoffs in general hospitalized patients. (A–C) Showed the Receiver Operating Character Curves in general hospitalized patients, normonatremia patients on admission, and dysnatremia patients on admission, respectively. AUC, area under curve; CI, confidence internal; Sen, sensitivity; Spe, specificity.
The optimal cutoff point of sodium fluctuation level during hospitalization was 7.5 mmol/L in general hospitalized patients, with a sensitivity of 76.5% and a specificity of 84.2%. The cutoff points of minimum and maximum serum sodium levels were 134.5 mmol/L and 144.5 mmol/L, respectively. These cutoff points were further examined in normonatremia patients and dysnatremia patients on admission, as depicted in Figures 3B,C. The cutoff point of sodium fluctuation level (7.5 mmol/L) had a sensitivity of 73.9%, a specificity of 87.3% in normonatremia patients on admission, and a sensitivity of 48.2%, a specificity of 80.0% in dysnatremia patients on admission. Compared to patients with sodium fluctuation level below 7.5 mmol/L, patients with sodium fluctuation level higher than 7.5 mmol/L had a significantly increased mortality rate in general hospitalized patients (0.4% vs. 6.5%, p < 0.001), normonatremia patients on admission (0.3% vs. 4.9%, p < 0.001), and dysnatremia patients on admission (3.1% vs. 10.7%, p < 0.001), as shown in Table 4.

Table 4. Outcomes of patients divided by cutoffs of sodium fluctuation level during hospitalization recognized by receiver operator characteristic curves in general hospitalized patients.
The sensitivity analysis of ROC curves demonstrated that the AUC of sodium fluctuation was higher than that of minimum and maximum sodium levels in general hospitalized patients, normonatremia patients on admission, and dysnatremia patients on admission. The results of the sensitivity analysis are presented in Supplementary Figures S3, S4, which align with the findings in Figure 3. Furthermore, the sensitivity analysis of the optimal cutoff value showed that, compared to patients with a sodium fluctuation level below 7.5 mmol/L, patients with a sodium fluctuation level higher than 7.5 mmol/L had a significantly increased mortality rate in general hospitalized patients, normonatremia patients on admission, and dysnatremia patients on admission. These results are presented in Supplementary Tables S9, S10, which are consistent with the findings in Table 4. The result of Briers score and its sensitivity analysis were shown in Supplementary Tables S11–S13. The result of calibration metric and its sensitivity analysis were shown in Supplementary Figures S5–S7.
4 Discussion
In this study, we examined the dose-dependent association between sodium fluctuation level during hospitalization and mortality in general hospitalized patients, normonatremia patients on admission, and dysnatremia patients on admission. We evaluated the value of sodium fluctuation level during hospitalization in dysnatremia management, which could be used as a marker to develop a single parameter system for predicting adverse outcomes in general hospitalized patients with acceptable accuracy, sensitivity, and specificity.
The study was conducted in a large retrospective cohort. Dysnatremia is the most common electrolyte disorder and is independently associated with adverse outcomes (3, 5). The serum sodium level is the most commonly used parameter in dysnatremia management. Previous studies suggested that compared to patients with simple hyponatremia or simple hypernatremia, patients with mixed dysnatremia had a higher risk of mortality (9). In addition, patients with serum sodium level between reference ranges (135 mmol/L-145 mmol/L) are regarded as low-risk patients. However, recent studies have suggested that sodium fluctuations were associated with mortality even within sodium reference ranges (10). Therefore, using serum sodium level as a management parameter has several limitations in identifying high-risk patients and providing precise management.
Sodium fluctuation level during hospitalization may be a better parameter in dysnatremia management, considering the clinical significance of mixed dysnatremia and sodium fluctuations within the normal range. Sodium fluctuation level during hospitalization was the difference between the maximum and minimum serum sodium levels (12, 13). Previous studies indicated that sodium fluctuation level below 6.0 mmol/L was treated as safe and was associated with a relatively low risk of death (10). Therefore, we divided patients into 6 groups (group G1-G6) to examine the dose-dependent relationship between sodium fluctuation level during hospitalization and mortality. After multivariable analysis, the ORs of group G2 to G6 in general hospitalized patients were 5.92 (95% CI 5.16–6.79), 26.45 (95% CI 22.68–30.86), 50.71 (95% CI 41.78–61.55), 104.38 (95% CI 81.57–133.58), and 157.64 (95% CI 112.83–220.24), respectively, p trend <0.001. The results were similar in normonatremia patients on admission. Patients admitted with dysnatremia also demonstrated a similar dose-dependent association. However, the ORs of group G2 to G6 were lower in these patients due to the independent association between dysnatremia on admission and poor prognosis. Our results suggested that sodium fluctuation level during hospitalization had a dose-dependent association with increased mortality in general hospitalized patients. Therefore, sodium fluctuation level should be paid more attention in clinical practice for accurate identification of high-risk patients.
We evaluated the impact of sodium fluctuation level during hospitalization, minimum and maximum serum sodium levels on adverse outcomes, and further compared the accuracy of the three parameters in predicting mortality. In general hospitalized patients, minimum serum sodium level (OR 1.39, 95% CI 1.37–1.41), maximum serum sodium level (OR 1.21, 95% CI 1.20–1.22), and sodium fluctuation level during hospitalization (OR 1.21, 95% CI 1.20–1.22) were associated with mortality. The ROC results indicated that the AUC of sodium fluctuation level during hospitalization in predicting mortality was significantly higher than the AUC of minimum and maximum serum sodium levels in generalized hospitalized patients, normonatremia patients on admission, and dysnatremia patients on admission. Our results suggested that sodium fluctuation level may better reflect the disease progression (19), which provides more accurate risk stratification in general hospitalized patients.
Our study suggested that sodium fluctuation was another kind of dysnatremia. Previous studies demonstrated that sodium fluctuation was independently associated with increased mortality in normonatremia patients on admission (12, 13, 20, 21). However, the prognostic impact of sodium fluctuation has not been evaluated in dysnatremia patients on admission. Our results showed that sodium fluctuation level during hospitalization had a dose-dependent relationship with increased mortality in general hospitalized patients, normonatremia patients on admission, and dysnatremia patients on admission. Therefore, we suggested that the management of sodium fluctuation level during hospitalization was necessary for decreasing adverse outcomes among general hospitalized patients. Moreover, our study illustrated that sodium fluctuation level could provide a more thorough evaluation in dysnatremia patients as sodium fluctuation level represents the degree of neurohumoral activation (19, 22), which indicates the severity of underlying diseases.
Sodium fluctuation level during hospitalization could be used as a marker to develop a single parameter system for predicting adverse outcomes in general hospitalized patients with acceptable accuracy, sensitivity, and specificity. An important concern of precise management is to prevent clinical deterioration and adverse events in hospitalized patients (23). The ROC analysis revealed that the AUC of sodium fluctuation level in predicting mortality was 0.868 in generalized hospitalized patients. The optimal cut-off point was 7.5 mmol/L with a sensitivity of 76.5% and a specificity of 84.2%. The single parameter system using sodium fluctuation level as the marker performed better than previously reported single parameter systems and multiple parameter weighting systems (24, 25). Our results suggested that the clinical significance of sodium fluctuation should be emphasized in clinical practice. Sodium fluctuation level during hospitalization is a reliable marker for predicting mortality in patients with normonatremia on admission, which provides the basis for precise management in dysnatremia.
Our study has several limitations. First, the retrospective cohort study collected data from a single medical center. The medical center may differ from other hospitals concerning disease spectrum and treatment routine. Therefore, the validity and generalizability of our results need further validation in external cohorts. Second, as this study is an observational study, iatrogenic factors related to sodium fluctuations such as fluid management were not included. Third, sodium fluctuation level during hospitalization was defined as the difference between the maximum and minimum serum sodium levels. However, due to the lack of data on treatment, we were unable to identify sodium fluctuations caused by the correction of dysnatremia or the deterioration of diseases. The clinical significance of sodium fluctuation level during hospitalization needs further validation in patients with treatment data.
5 Conclusion
In summary, we determined that sodium fluctuation level during hospitalization had a dose-dependent association with an increased mortality rate in general hospitalized patients, normonatremia patients on admission, and dysnatremia patients on admission. Sodium fluctuation level during hospitalization patients could be used as a marker to develop a single parameter system for predicting adverse outcomes in general hospitalized patients with acceptable accuracy, sensitivity, and specificity.
Data availability statement
The datasets used in this study are available from the corresponding author on reasonable request.
Ethics statement
The studies involving humans were approved by Ethics Committee of Peking Union Medical College Hospital, Chinese Academy of Medical Sciences (approval number: S-k1272, approval date: 9 October 2020). The studies were conducted in accordance with the local legislation and institutional requirements. Written informed consent for participation was not required from the participants or the participants’ legal guardians/next of kin in accordance with the national legislation and institutional requirements.
Author contributions
SL: Conceptualization, Data curation, Formal analysis, Methodology, Writing – original draft, Writing – review & editing. LS: Conceptualization, Writing – review & editing, Data curation, Formal analysis, Methodology, Writing – original draft. YZ: Conceptualization, Methodology, Writing – review & editing. QZ: Conceptualization, Data curation, Writing – review & editing. NJ: Conceptualization, Data curation, Writing – review & editing. HZ: Conceptualization, Supervision, Writing – review & editing. SC: Conceptualization, Methodology, Supervision, Writing – original draft, Writing – review & editing. HP: Conceptualization, Supervision, Writing – review & editing.
Funding
The author(s) declare that financial support was received for the research, authorship, and/or publication of this article. This study was supported by Chinese Academy of Medical Sciences Innovation Fund for Medical Sciences (2021-I2M-1-023).
Conflict of interest
The authors declare that the research was conducted in the absence of any commercial or financial relationships that could be construed as a potential conflict of interest.
Publisher’s note
All claims expressed in this article are solely those of the authors and do not necessarily represent those of their affiliated organizations, or those of the publisher, the editors and the reviewers. Any product that may be evaluated in this article, or claim that may be made by its manufacturer, is not guaranteed or endorsed by the publisher.
Supplementary material
The Supplementary material for this article can be found online at: https://www.frontiersin.org/articles/10.3389/fmed.2024.1399638/full#supplementary-material
Footnotes
References
1. Al Mawed, S, Pankratz, VS, Chong, K, Sandoval, M, Roumelioti, ME, and Unruh, M. Low serum sodium levels at hospital admission: outcomes among 2.3 million hospitalized patients. PLoS One. (2018) 13:e0194379. doi: 10.1371/journal.pone.0194379
2. Hao, J, Li, Y, Zhang, X, Pang, C, Wang, Y, Nigwekar, SU, et al. The prevalence and mortality of hyponatremia is seriously underestimated in Chinese general medical patients: an observational retrospective study. BMC Nephrol. (2017) 18, 18:328. doi: 10.1186/s12882-017-0744-x
3. Akirov, A, Diker-Cohen, T, Steinmetz, T, Amitai, O, and Shimon, I. Sodium levels on admission are associated with mortality risk in hospitalized patients. Eur J Intern Med. (2017) 46:25–9. doi: 10.1016/j.ejim.2017.07.017
4. Tsipotis, E, Price, LL, Jaber, BL, and Madias, NE. Hospital-associated hypernatremia Spectrum and clinical outcomes in an unselected cohort. Am J Med. (2018) 131:72–82.e1. doi: 10.1016/j.amjmed.2017.08.011
5. Waikar, SS, Mount, DB, and Curhan, GC. Mortality after hospitalization with mild, moderate, and severe hyponatremia. Am J Med. (2009) 122:857–65. doi: 10.1016/j.amjmed.2009.01.027
6. Sterns, RH. Disorders of plasma sodium — causes, consequences, and correction. N Engl J Med. (2015) 372:55–65. doi: 10.1056/NEJMra1404489
7. Adrogué, HJ, and Madias, NE. Hypernatremia. N Engl J Med. (2000) 342:1493–9. doi: 10.1056/nejm200005183422006
8. Funk, GC, Lindner, G, Druml, W, Metnitz, B, Schwarz, C, Bauer, P, et al. Incidence and prognosis of dysnatremias present on ICU admission. Intensive Care Med. (2010) 36:304–11. doi: 10.1007/s00134-009-1692-0
9. Stelfox, HT, Ahmed, SB, Khandwala, F, Zygun, D, Shahpori, R, and Laupland, K. The epidemiology of intensive care unit-acquired hyponatraemia and hypernatraemia in medical-surgical intensive care units. Crit Care. (2008) 12:R162. doi: 10.1186/cc7162
10. Thongprayoon, C, Cheungpasitporn, W, Yap, JQ, and Qian, Q. Increased mortality risk associated with serum sodium variations and borderline hypo-and hypernatremia in hospitalized adults. Nephrol Dial Transplant. (2020) 35:1746–52. doi: 10.1093/ndt/gfz098
11. Liang, S, Chen, S, Zhang, Y, Zhu, H, and Pan, H. Sodium fluctuation, a novel single parameter to predict hospital mortality. Eur J Intern Med. (2021) 85:124–6. doi: 10.1016/j.ejim.2020.11.013
12. Sakr, Y, Rother, S, Ferreira, AM, Ewald, C, Dünisch, P, Riedemmann, N, et al. Fluctuations in serum sodium level are associated with an increased risk of death in surgical ICU patients. Crit Care Med. (2013) 41:133–42. doi: 10.1097/CCM.0b013e318265f576
13. Topjian, AA, Stuart, A, Pabalan, AA, Clair, A, Kilbaugh, TJ, Abend, NS, et al. Greater fluctuations in serum sodium levels are associated with increased mortality in children with externalized ventriculostomy drains in a PICU. Pediatr Crit Care Med. (2014) 15:846–55. doi: 10.1097/pcc.0000000000000223
14. von Elm, E, Altman, DG, Egger, M, Pocock, SJ, Gøtzsche, PC, and Vandenbroucke, JP. The strengthening the reporting of observational studies in epidemiology (STROBE) statement: guidelines for reporting observational studies. Lancet. (2007) 370:1453–7. doi: 10.1016/s0140-6736(07)61602-x
15. Charlson, ME, Sax, FL, MacKenzie, CR, Fields, SD, Braham, RL, and Douglas, RG Jr. Resuscitation: how do we decide? A prospective study of physicians' preferences and the clinical course of hospitalized patients. JAMA. (1986) 255:1316–22. doi: 10.1001/jama.1986.03370100110027
16. Yong, TY, Fok, JS, Hakendorf, P, Ben-Tovim, D, Thompson, CH, and Li, JY. Characteristics and outcomes of discharges against medical advice among hospitalised patients. Intern Med J. (2013) 43:798–802. doi: 10.1111/imj.12109
17. Guasch-Ferré, M, Hu, FB, Martínez-González, MA, Fitó, M, Bulló, M, Estruch, R, et al. Olive oil intake and risk of cardiovascular disease and mortality in the PREDIMED study. BMC Med. (2014) 12:78. doi: 10.1186/1741-7015-12-78
18. Haltmeier, T, Inaba, K, Durso, J, Khan, M, Siboni, S, Cheng, V, et al. Transthyretin at admission and over time as a marker for clinical outcomes in critically ill trauma patients: a prospective single-center study. World J Surg. (2020) 44:115–23. doi: 10.1007/s00268-019-05140-6
19. Hoorn, EJ, and Zietse, R. Hyponatremia and mortality: moving beyond associations. Am J Kidney Dis. (2013) 62:139–49. doi: 10.1053/j.ajkd.2012.09.019
20. Lombardi, G, Ferraro, PM, Calvaruso, L, Naticchia, A, D'Alonzo, S, and Gambaro, G. Sodium fluctuations and mortality in a general hospitalized population. Kidney Blood Press Res. (2019) 44:604–14. doi: 10.1159/000500916
21. Oliva-Damaso, N, Baamonde-Laborda, E, Oliva-Damaso, E, Payan, J, Marañes, A, Vega-Diaz, N, et al. Fluctuation of pre-hemodialysis serum sodium. Clin Nephrol. (2018) 90:396–403. doi: 10.5414/cn109355
22. Ginès, P, and Guevara, M. Hyponatremia in cirrhosis: pathogenesis, clinical significance, and management. Hepatology. (2008) 48:1002–10. doi: 10.1002/hep.22418
23. National Institute for Health and Care Excellence: Guidelines. Acutely ill patients in hospital: recognition of and response to acute illness in adults in hospital. London: National Institute for Health and Clinical Excellence (NICE) (2007).
24. Peelen, RV, Eddahchouri, Y, Koeneman, M, van de Belt, TH, van Goor, H, and Bredie, SJ. Algorithms for prediction of clinical deterioration on the general wards: a scoping review. J Hosp Med. (2021) 16:612–9. doi: 10.12788/jhm.3630
Keywords: dysnatremia, sodium fluctuation level, prediction, single parameter system, mortality
Citation: Liang S, Sun L, Zhang Y, Zhang Q, Jiang N, Zhu H, Chen S and Pan H (2024) Sodium fluctuation as a parameter in predicting mortality in general hospitalized patients. Front. Med. 11:1399638. doi: 10.3389/fmed.2024.1399638
Edited by:
Marcelo Perim Baldo, State University of Montes Claros, BrazilReviewed by:
Michael L. Moritz, University of Pittsburgh, United StatesDanilo Lofaro, University of Calabria, Italy
Copyright © 2024 Liang, Sun, Zhang, Zhang, Jiang, Zhu, Chen and Pan. This is an open-access article distributed under the terms of the Creative Commons Attribution License (CC BY). The use, distribution or reproduction in other forums is permitted, provided the original author(s) and the copyright owner(s) are credited and that the original publication in this journal is cited, in accordance with accepted academic practice. No use, distribution or reproduction is permitted which does not comply with these terms.
*Correspondence: Hui Pan, cGFuaHVpMjAxMTExMTFAMTYzLmNvbQ==; Shi Chen, Y3NwdW1jaEAxNjMuY29t
†These authors have contributed equally to this work and share first authorship