 Deepak Chandramohan1*
 Hari Naga Garapati2Udit Nangia3
 Prathap K. Simhadri1
 Boney Lapsiwala4
 Nihar K. Jena5Prabhat Singh6
- 1Department of Nephrology, The University of Alabama at Birmingham, Birmingham, AL, United States
- 2Department of Nephrology, Baptist Medical Center South, Montgomery, AL, United States
- 3Department of Medicine, University Hospital Parma Medical Center, Parma, OH, United States
- 4Department of Internal Medicine, Medical City Arlington, Arlington, TX, United States
- 5Department of Cardiology, Trinity Health Oakland Hospital, Pontiac, MI, United States
- 6Department of Nephrology, Christus Spohn Health System, Corpus Christi, TX, United States
Introduction: The prevalence of Renal cell carcinoma (RCC) is increasing among adults. Histopathologic samples obtained after surgical resection or from biopsies of a renal mass require subtype classification for diagnosis, prognosis, and to determine surveillance. Deep learning in artificial intelligence (AI) and pathomics are rapidly advancing, leading to numerous applications such as histopathological diagnosis. In our meta-analysis, we assessed the pooled diagnostic performances of deep neural network (DNN) frameworks in detecting RCC subtypes and to predicting survival.
Methods: A systematic search was done in PubMed, Google Scholar, Embase, and Scopus from inception to November 2023. The random effects model was used to calculate the pooled percentages, mean, and 95% confidence interval. Accuracy was defined as the number of cases identified by AI out of the total number of cases, i.e. (True Positive + True Negative)/(True Positive + True Negative + False Positive + False Negative). The heterogeneity between study-specific estimates was assessed by the I2 statistic. The Preferred Reporting Items for Systematic Reviews and Meta-Analyses (PRISMA) guidelines were used to conduct and report the analysis.
Results: The search retrieved 347 studies; 13 retrospective studies evaluating 5340 patients were included in the final analysis. The pooled performance of the DNN was as follows: accuracy 92.3% (95% CI: 85.8–95.9; I2 = 98.3%), sensitivity 97.5% (95% CI: 83.2–99.7; I2 = 92%), specificity 89.2% (95% CI: 29.9–99.4; I2 = 99.6%) and area under the curve 0.91 (95% CI: 0.85–0.97.3; I2 = 99.6%). Specifically, their accuracy in RCC subtype detection was 93.5% (95% CI: 88.7–96.3; I2 = 92%), and the accuracy in survival analysis prediction was 81% (95% CI: 67.8–89.6; I2 = 94.4%).
Discussion: The DNN showed excellent pooled diagnostic accuracy rates to classify RCC into subtypes and grade them for prognostic purposes. Further studies are required to establish generalizability and validate these findings on a larger scale.
1 Introduction
Renal Cell Carcinoma (RCC) is the most common primary renal neoplasm, affecting nearly 300,000 individuals worldwide annually, and it is responsible for more than 100,000 deaths each year (1). RCC is a heterogeneous group of cancers with distinctive molecular characteristics, histology, clinical outcomes, and therapy response. RCC arises from the renal parenchyma and, according to the World Health Organization (WHO) has three main subtypes: Clear cell (ccRCC), Papillary RCC (pRCC) and Chromophobe. The remaining subtypes are rare, each occurring with a total incidence of ≤1%. Each type has different histologic features, distinctive genetic and molecular alterations, clinical courses, and different responses to therapy (2).
The ccRCC type accounts for 70–90%. It is named due to the presence of clear cells from the lipid and glycogen-rich cytoplasmic content, ccRCC has the worst prognosis among the RCC subtypes with a 5-year survival rate between 50 and 69%. When metastasis occurs, the 5-year survival decreases further to about 10%. The pRCC type has a spindle-shaped pattern of cells with areas of hemorrhage and cysts. Pathologists further classify it into two subtypes based on the lesion’s histological appearance and biological behavior, and it accounts for about 14–17% of the cases. The subtypes, pRCC type 1 (basophilic) and pRCC type 2 (eosinophilic) differ in their prognostic significance, with type 2 having a poorer prognosis. Chromophobe RCC is common in adults over the age of 60 years. Histologically described as a mass formed of large pale cells with reticulated cytoplasm and perinuclear halos, it carries the best prognosis among the RCC types in the absence of sarcomatoid changes. If sarcomatoid transformation occurs, it tends to be more aggressive with worse survival (3).
Due to its relevance and applicability, the Fuhrman nuclear grading method is commonly used for staging to determine prognostic significance. Using nuclear morphology and characteristics, it designates a prognostic indicator grade (4). The histological classification of RCC is of great importance in patient care, as RCC subtypes have significant implications in the prognosis and treatment of renal tumors. The incidence of RCC has increased, likely due to the increased detection of incidental renal masses on abdominal imaging (5). Around 60% of RCCs are detected incidentally (6). The inspection of complex RCC histologic patterns is prolonged and time consuming due to tumor heterogeneity. There is also a moderate amount of inter-observer and intra-observer variability due to the absence of a defined threshold for determining the minimum percentage of an area with high nuclear grade (7).
With the advancement of whole-slide images in digital pathology, automated histopathologic image analysis systems have shown great potential for diagnostic purposes (8–10). Computerized image analysis has the advantage of providing a more efficient, less subjective, and consistent diagnostic methodology to assist pathologists in their medical decision-making processes. In recent years, significant advancement has been made in understanding and applying deep neural network (DNN) frameworks, especially convolutional neural networks (CNNs), to a wide range of biomedical imaging analysis applications. These CNN-based models can process digitized histopathology images and learn to diagnose cellular patterns associated with tumors (11, 12). In our systematic review and meta-analysis, we provide a comprehensive assessment of the existing literature and present the pooled diagnostic performances of DNN frameworks in detecting RCC and predicting outcomes.
2 Materials and methods
2.1 Data sources and search strategy
The literature search was conducted from inception through December 2023 in the following electronic databases, Pubmed, Embase, Web of Science, Cochrane Library, and Google Scholar, using the following terms, “Renal Cell Carcinoma” OR “RCC” OR “Kidney Cancer” AND “Histopathology” OR “Histological Analysis” OR “Tissue Histopathology” AND “Deep Neural Network” OR “DNN” OR “Deep Learning.” Additional pertinent studies were added by searching the bibliographic section of the articles of interest. The search strategy is shown in the Supplementary data section.
2.2 Study selection
The studies retrieved from the search were screened by two authors (D.C and P.S). Abstracts of the studies were initially screened, followed by full-text screening to include studies based on prespecified inclusion and exclusion criteria. Any disagreements between authors were resolved through consensus. The Checklist for critical Appraisal and data extraction for systematic Reviews of prediction Modelling Studies (CHARMS) for prediction modeling studies was followed (13) and The Preferred Reporting Items for Systematic Reviews and Meta-Analyses guidelines was used to select the final articles (14). The CHARMS and PRISMA checklists are shown in the Supplementary data section. The study protocol was registered in PROSPERO, a database of systematic reviews, with registration number CRD42024497980.
The inclusion criteria were as follows: (1) studies reporting the histopathological diagnosis of RCC using DNN; (2) studies reporting detection of RCC using DNN models after validation. The exclusion criteria were as follows: (1) studies lacking sufficient data on reported accuracy, sensitivity, specificity, positive predictive value, negative predictive value or area under the curve of DNN models; (2) review articles, conference abstracts and case reports; (3) studies conducted on animal models; (4) studies not published in English; (5) studies reporting data on DNN models predicting RCC based on imaging; (6) studies reporting only the mathematical development of DNN models without internal or external validation and (7) studies that reported RCC detection using methods other than DNN. Ethics approval was not required for our meta-analysis because the data was accessible to the public.
2.3 Outcomes assessed
The outcomes assessed were accuracy, sensitivity, specificity, and area under the curve (AUC) of the DNN models in subtype detection of RCC and grading them for prognostication.
We defined True positive (TP) as the number of cases correctly identified as RCC by the models. True negative (TN) was the number of cases correctly identified as non-RCC. False positive (FP) was the number of cases incorrectly identified as RCC and False negative (FN) was the number of cases incorrectly identified as non-RCC. Accuracy was defined as the ability to detect the presence or absence of RCC and calculated as TP + TN/TP + TN + FP + FN. Sensitivity was the ability to detect RCC cases correctly, calculated as TP/TP + FN. Specificity was the ability to detect non-RCC cases correctly, calculated as TN/TN + FP. These definitions were derived from the existing literature (15, 16). Outcomes were only recorded if the studies had reported those and were not calculated.
2.4 Data extraction
After removing duplicates, the retrieved articles were checked for duplicates using the EndNote 21 reference manager (17). Data was extracted using the CHARMS spreadsheet (18). All the authors extracted the data. Author information, country, total number of patients, and histopathology slides were extracted. The accuracy, sensitivity, specificity, and AUC of the models on the external dataset were collected. The author, D.C, verified the extracted data.
2.5 Statistical analysis
Mean ± standard deviation was used to express continuous variables, and percentages to express categorical variables. The pooled rates, mean estimates, and 95% confidence intervals (CI) were calculated using the random effects DerSimonian-Laird method (19). We used the random effects model due to the assumption that the studies were selected from a random sample and that they vary in their effect sizes (20).
Two methods evaluated heterogeneity. First, we used the Cochran Q statistic. The Cochran Q statistic tests the null hypothesis that the included studies share the same effect size. A p-value of <0.05 was considered significant. We then utilized the I2 statistic to detect and quantify the heterogeneity. Low, moderate, substantial, and considerable heterogeneity correspond to values <30, 31 to 60%, 61 to 75%, and > 75%, respectively, (21).
Publication bias was initially evaluated by visually examining the funnel plots and later by Egger’s test. A cut-off p-value of <0.05 was considered significant for the Egger’s test (22). When there was an indication of publication bias, we utilized Duval and Tweedie’s ‘Trim and Fill’ method to examine the difference in the effect size after the imputation of studies using computer software (23). The statistical analyses was conducted using the Comprehensive Meta-Analysis software, version 4 (Biostat, Englewood, NJ, USA) (24).
2.6 Quality assessment and risk of bias
The assessment of the individual study’s quality and risk of bias was done using the Prediction model Risk of Bias Assessment Tool (PROBAST). It contains four domains: participants, predictors, outcomes, and analysis to assess the risk of bias and applicability. A total of 20 signaling questions were used to determine if a domain was low or high risk (25). The assessment was done independently by two authors (D.C and P.S).
3 Results
3.1 Search results
We retrieved 347 studies using the search strategy. After the removal of duplicates, 283 studies were screened. Following this, a full text review was done on 57 studies, and finally, 13 studies were selected for the systematic review and meta-analysis (2, 26–37). The study selection process flowchart using the Preferred Reporting methods in Systematic review and Meta-analysis (PRISMA) is shown in Figure 1.
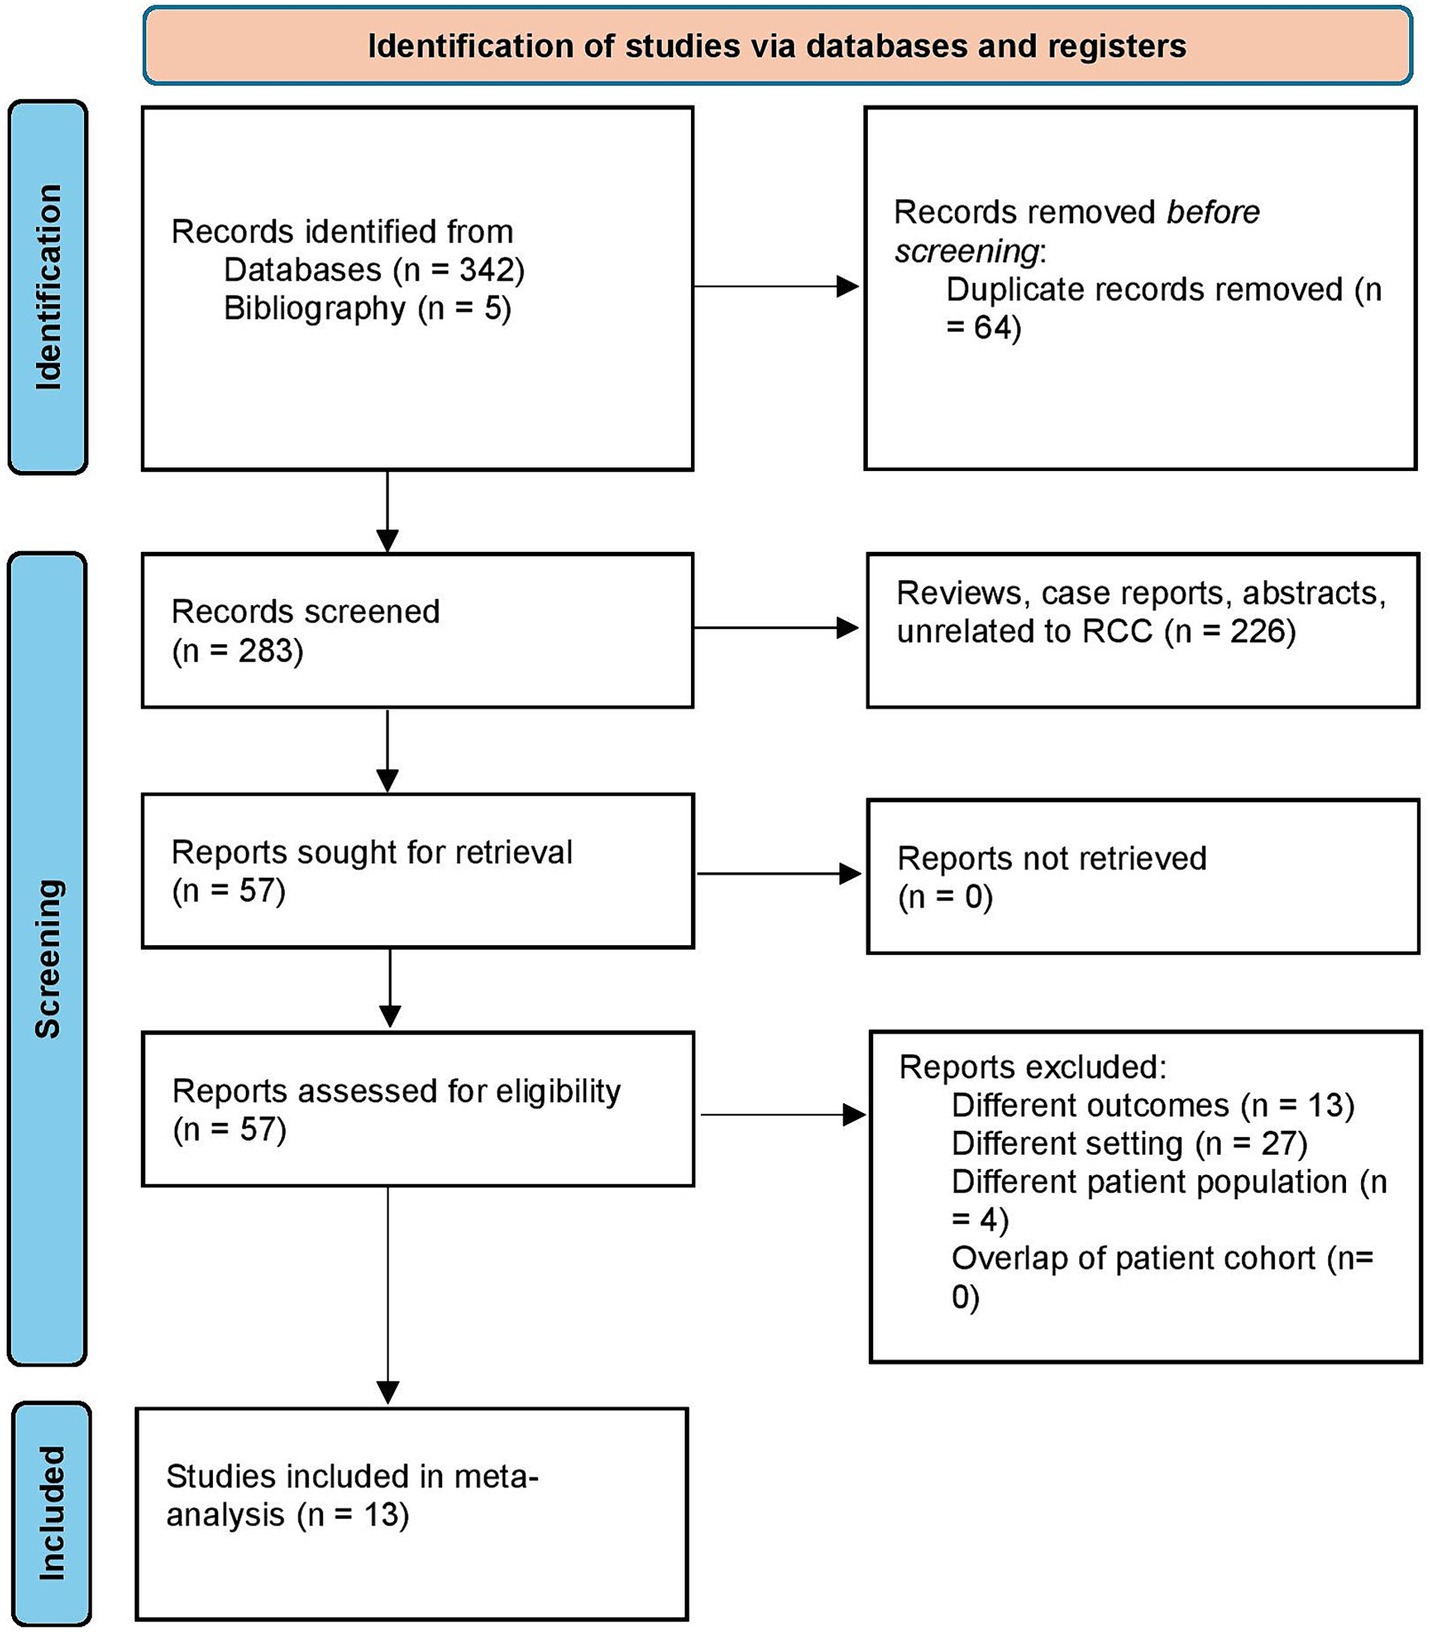
Figure 1. Study selection process according to the preferred reporting items for systematic reviews and meta-analysis statement.
3.2 Study characteristics
A total of 13 studies with 13,958 slides/whole slide images from 5,340 patients were included in our analysis. There were 4 studies from the United States of America (26, 28, 29, 37), 4 from China (27, 30, 35, 36), 2 from Germany (32, 34), 1 study from the United Arab Emirates (2), India (33) and Japan (31). Eleven studies evaluated the performance of CNN models (2, 26–31, 33–35, 37). Schulz et al. (32) assessed the performance of a multimodal deep learning model (MMDLM). Zheng et al. (36) evaluated a deep learning model based on a clustering-constrained-attention multiple-instance learning (CLAM) framework called SSL-CLAM. The DNN models were used to subtype RCC in 8 studies (2, 26–29, 33, 35, 37). Survival prediction and prognosis was assessed by 5 studies (30–32, 34, 36). The Cancer Genome Atlas (TGCA) validated the machine learning model in 12 studies (2, 26, 28–37). Two studies also used the Clinical Proteomic Tumor Analysis Consortium (CPTAC) together with the TGCA dataset to validate their model (29, 36). The study characteristics and the DNN details are summarized in Tables 1, 2.
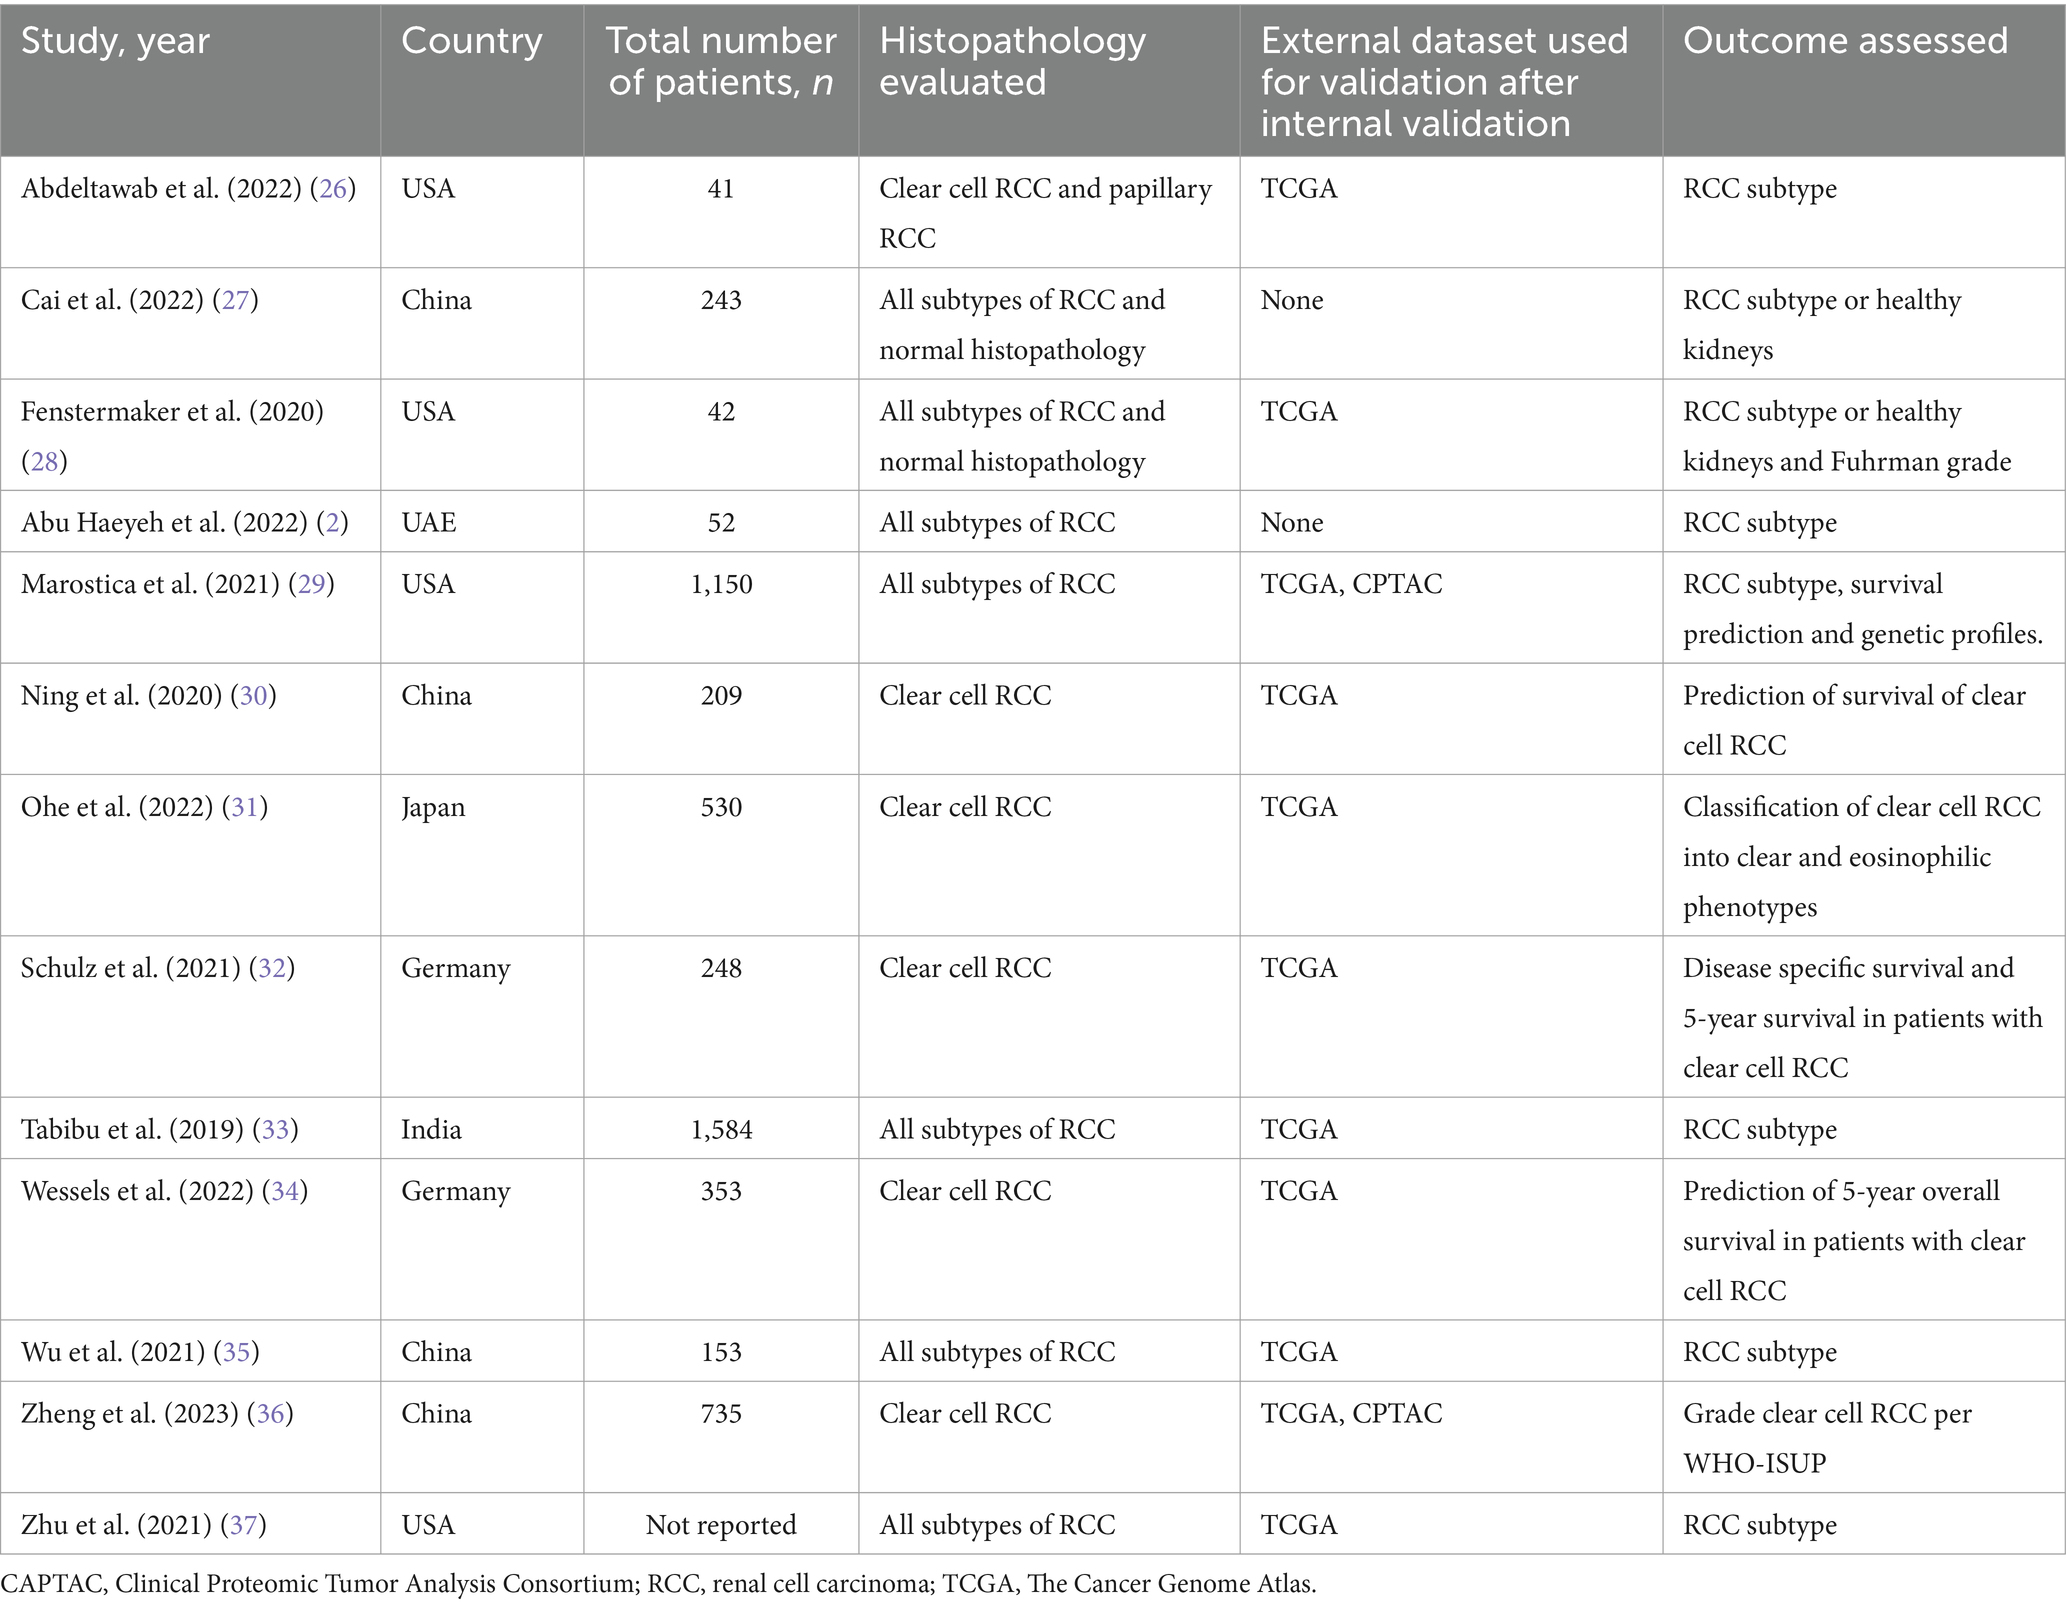
Table 1. Summary of the included studies.
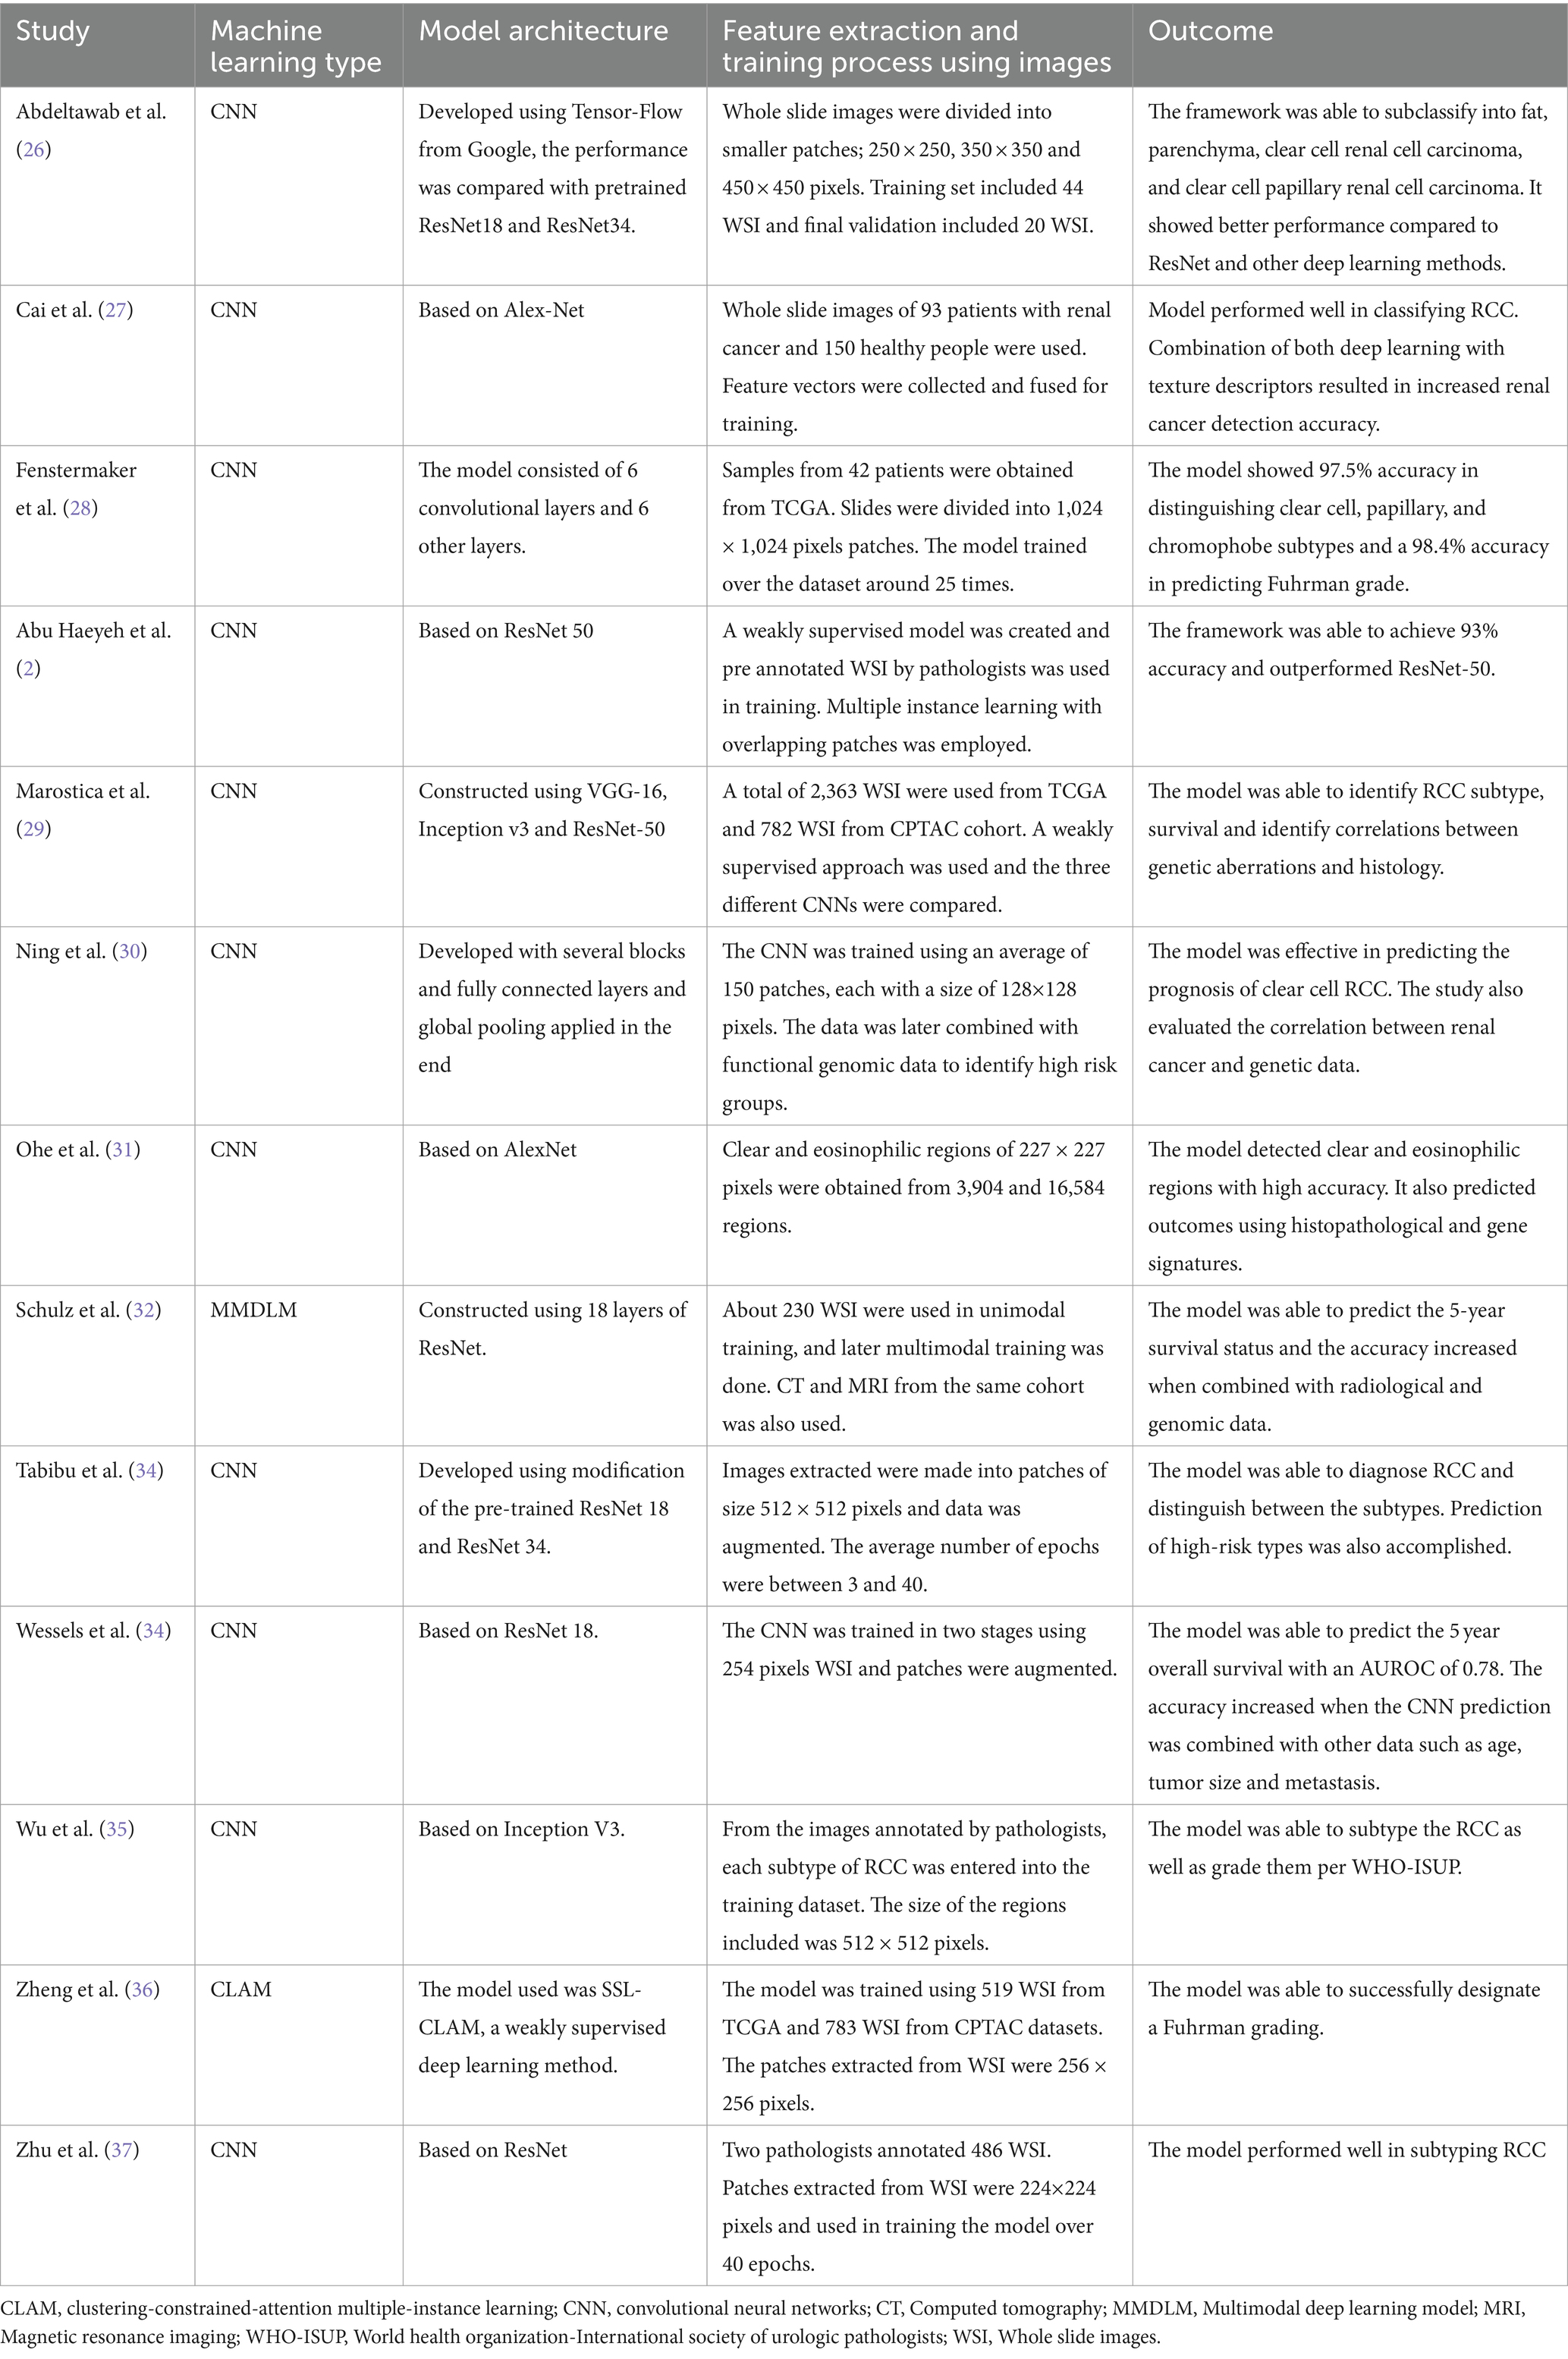
Table 2. Deep neural network model characteristics.
3.3 Outcomes
The pooled accuracy of the DNN in the detection of RCC subtype was 93.5% (95% CI: 88.7–96.3; I2 = 92%). The pooled accuracy in survival analysis was 81% (95% CI: 67.8–89.6; I2 = 94.4%). They had an overall accuracy of 92.3% (95% CI: 85.8–95.9; I2 = 98.3%) when used for RCC detection and survival analysis. The forest plots are shown in Figures 2A–C. The studies pooled together had a sensitivity of 97.5% (95% CI: 83.2–99.7; I2 = 92%), specificity of 89.2% (95% CI: 29.9–99.4; I2 = 99.6%) and area under the curve of 0.91 (95% CI: 0.85–0.97.3; I2 = 99.6%). The forest plots are shown in Figures 3A–C.
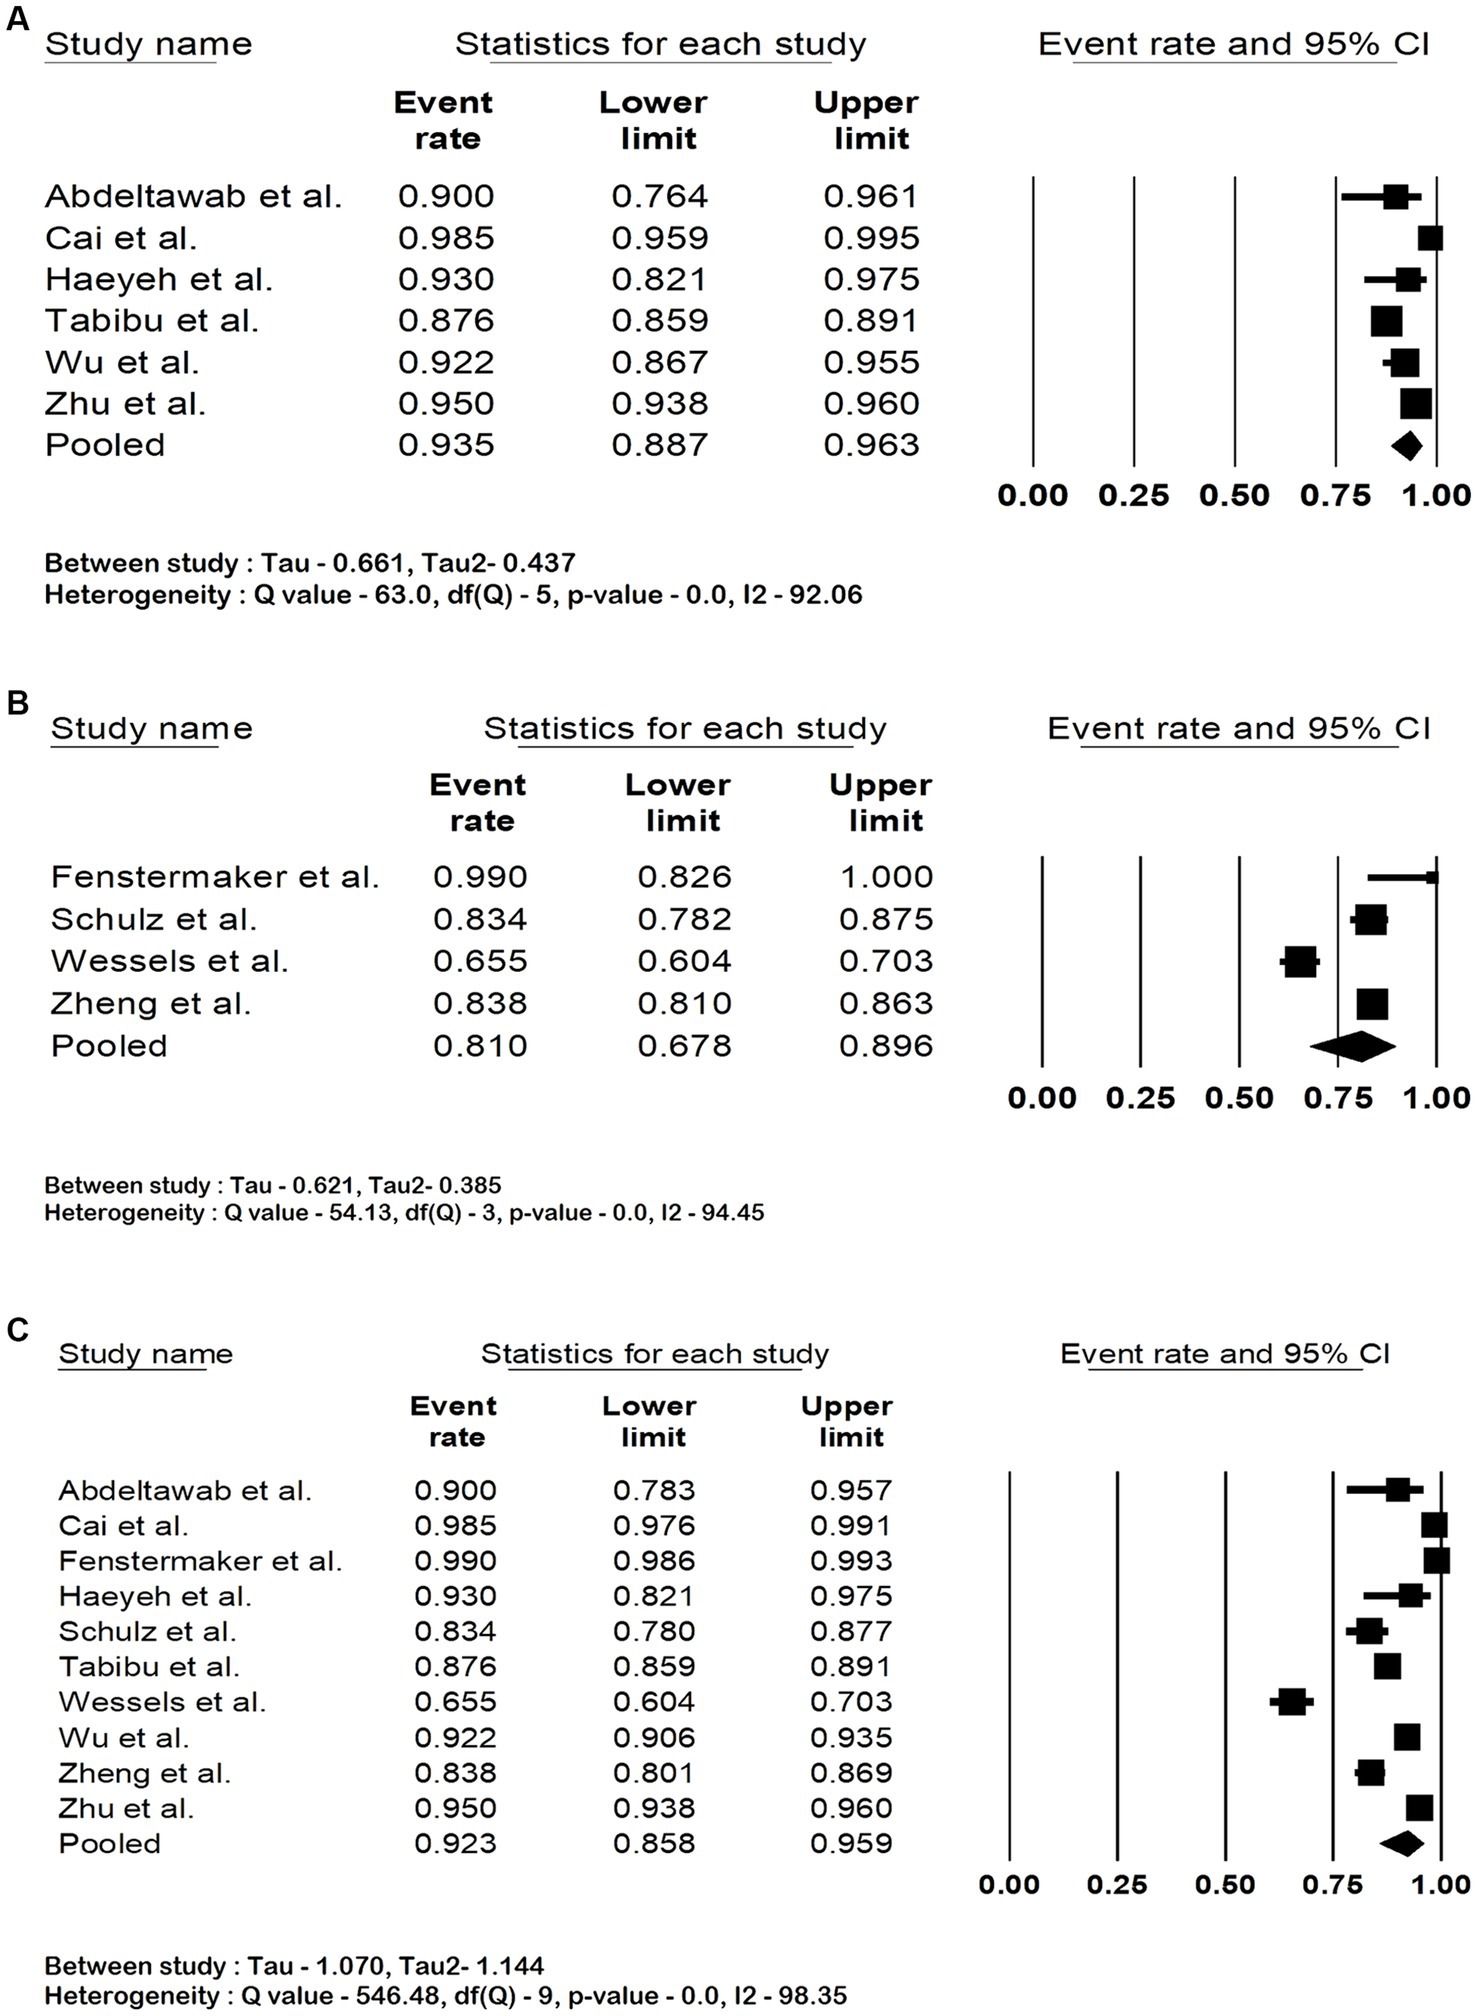
Figure 2. Forest plots showing (A) accuracy in renal cell carcinoma subtype detection, (B) accuracy in renal cell carcinoma survival analysis (C) overall accuracy of deep neural network in detection and prognostication of renal cell carcinoma.
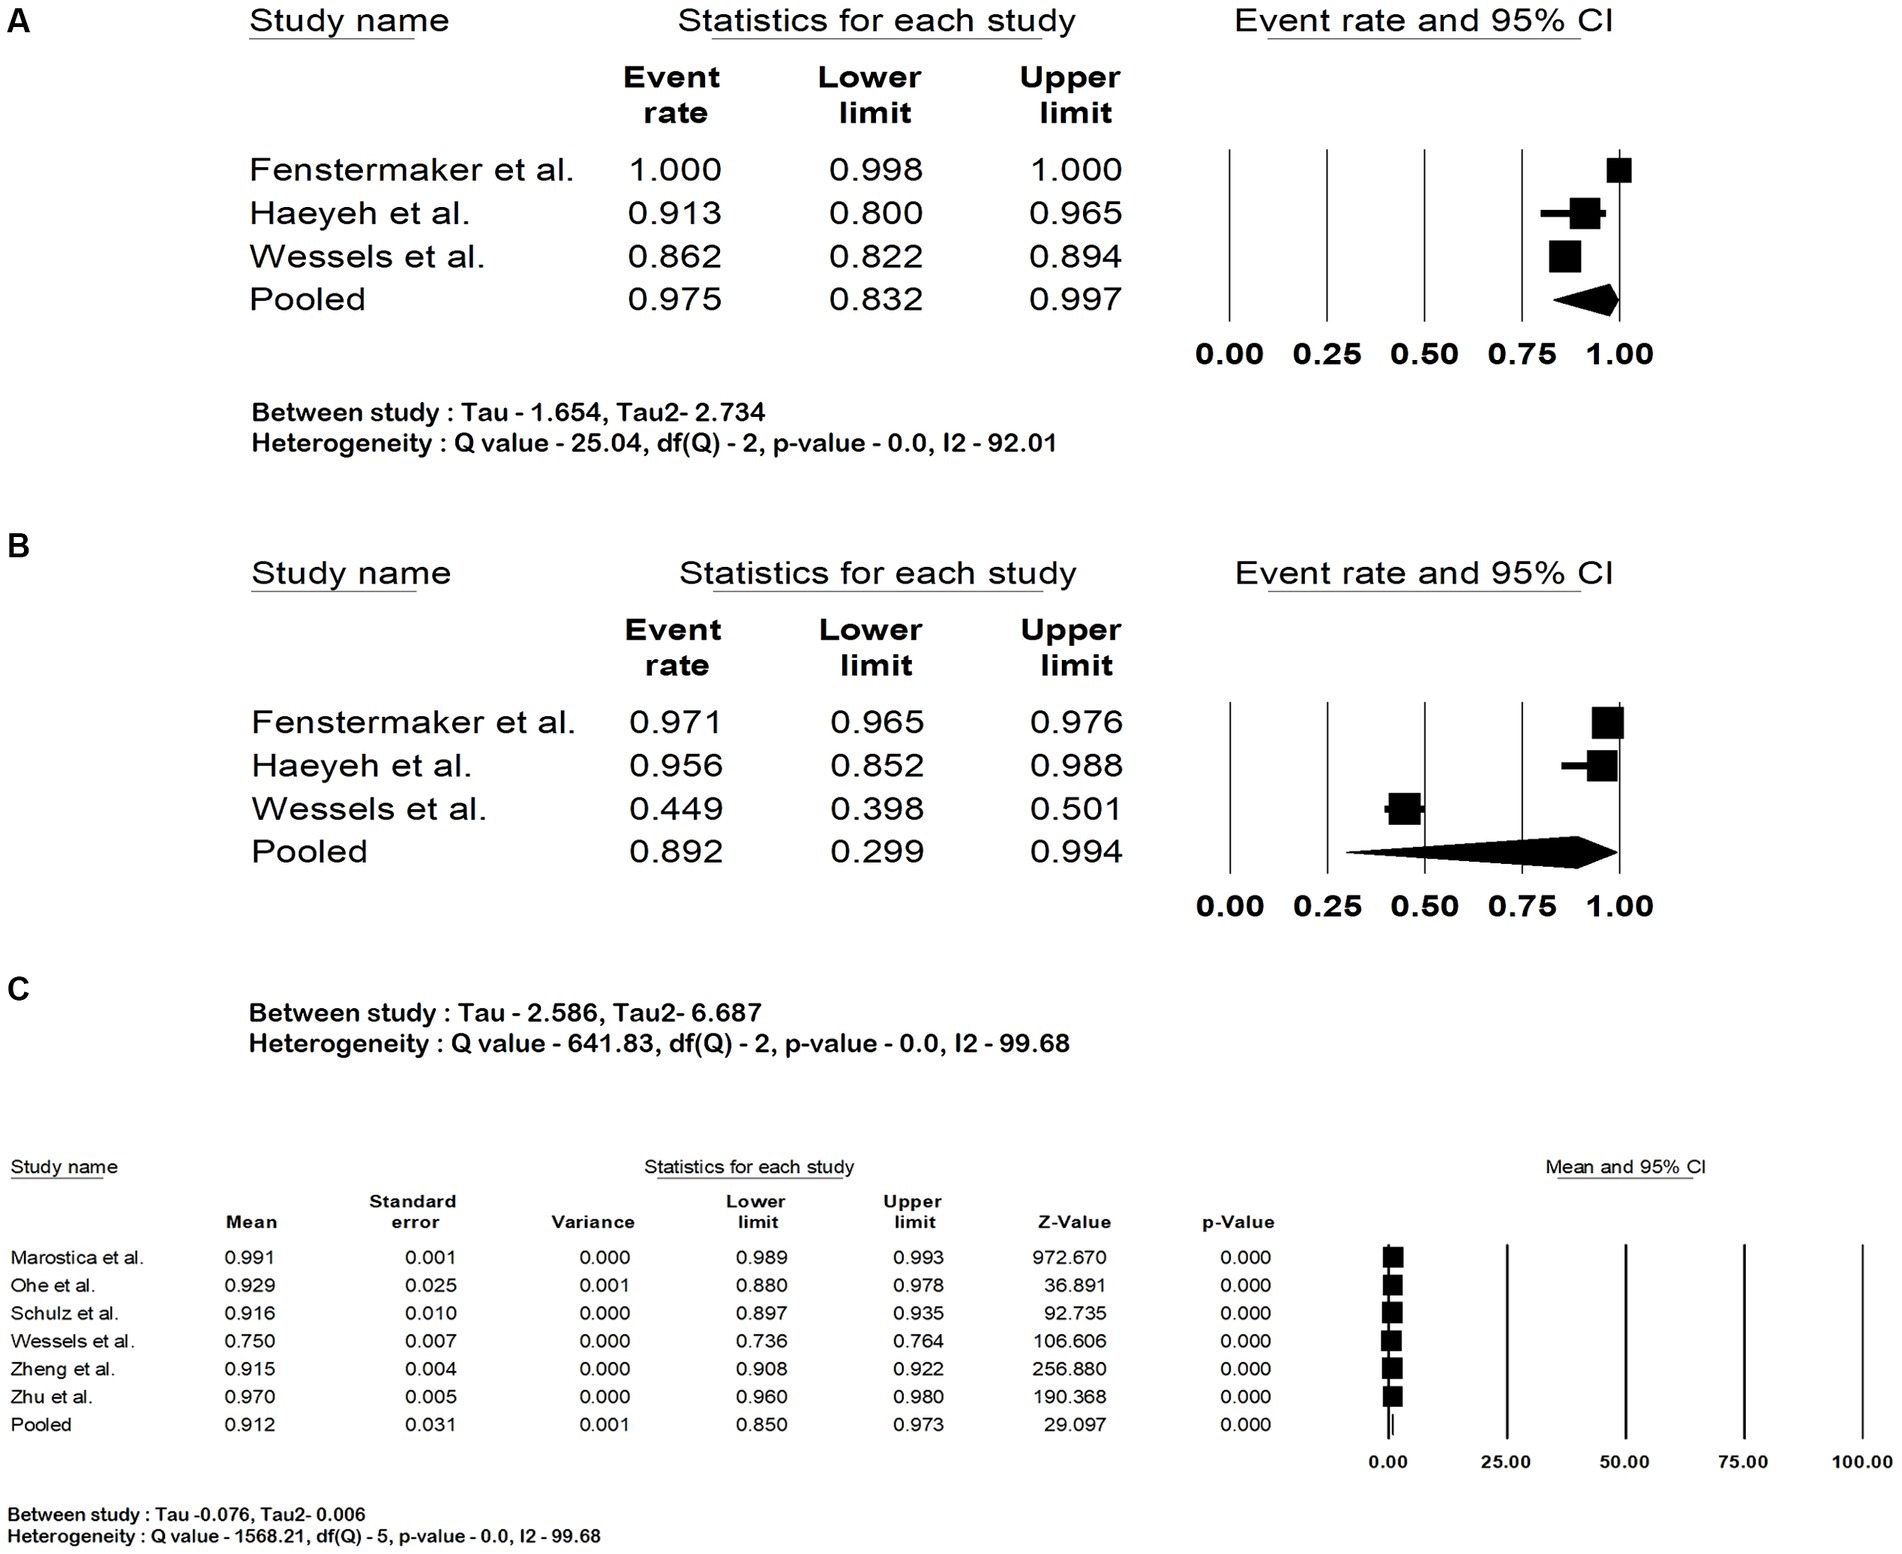
Figure 3. Forest plots showing (A) sensitivity, (B) specificity and (C) area under the curve of deep neural network in detection and prognostication of renal cell carcinoma.
3.4 Quality assessment and risk of bias
Most of the studies showed a high risk of bias in the selection of study participants. Figure 4A shows the results of the PROBAST scoring of individual studies. Figures 4B,C show the summary of the risk of bias and applicability across all studies.
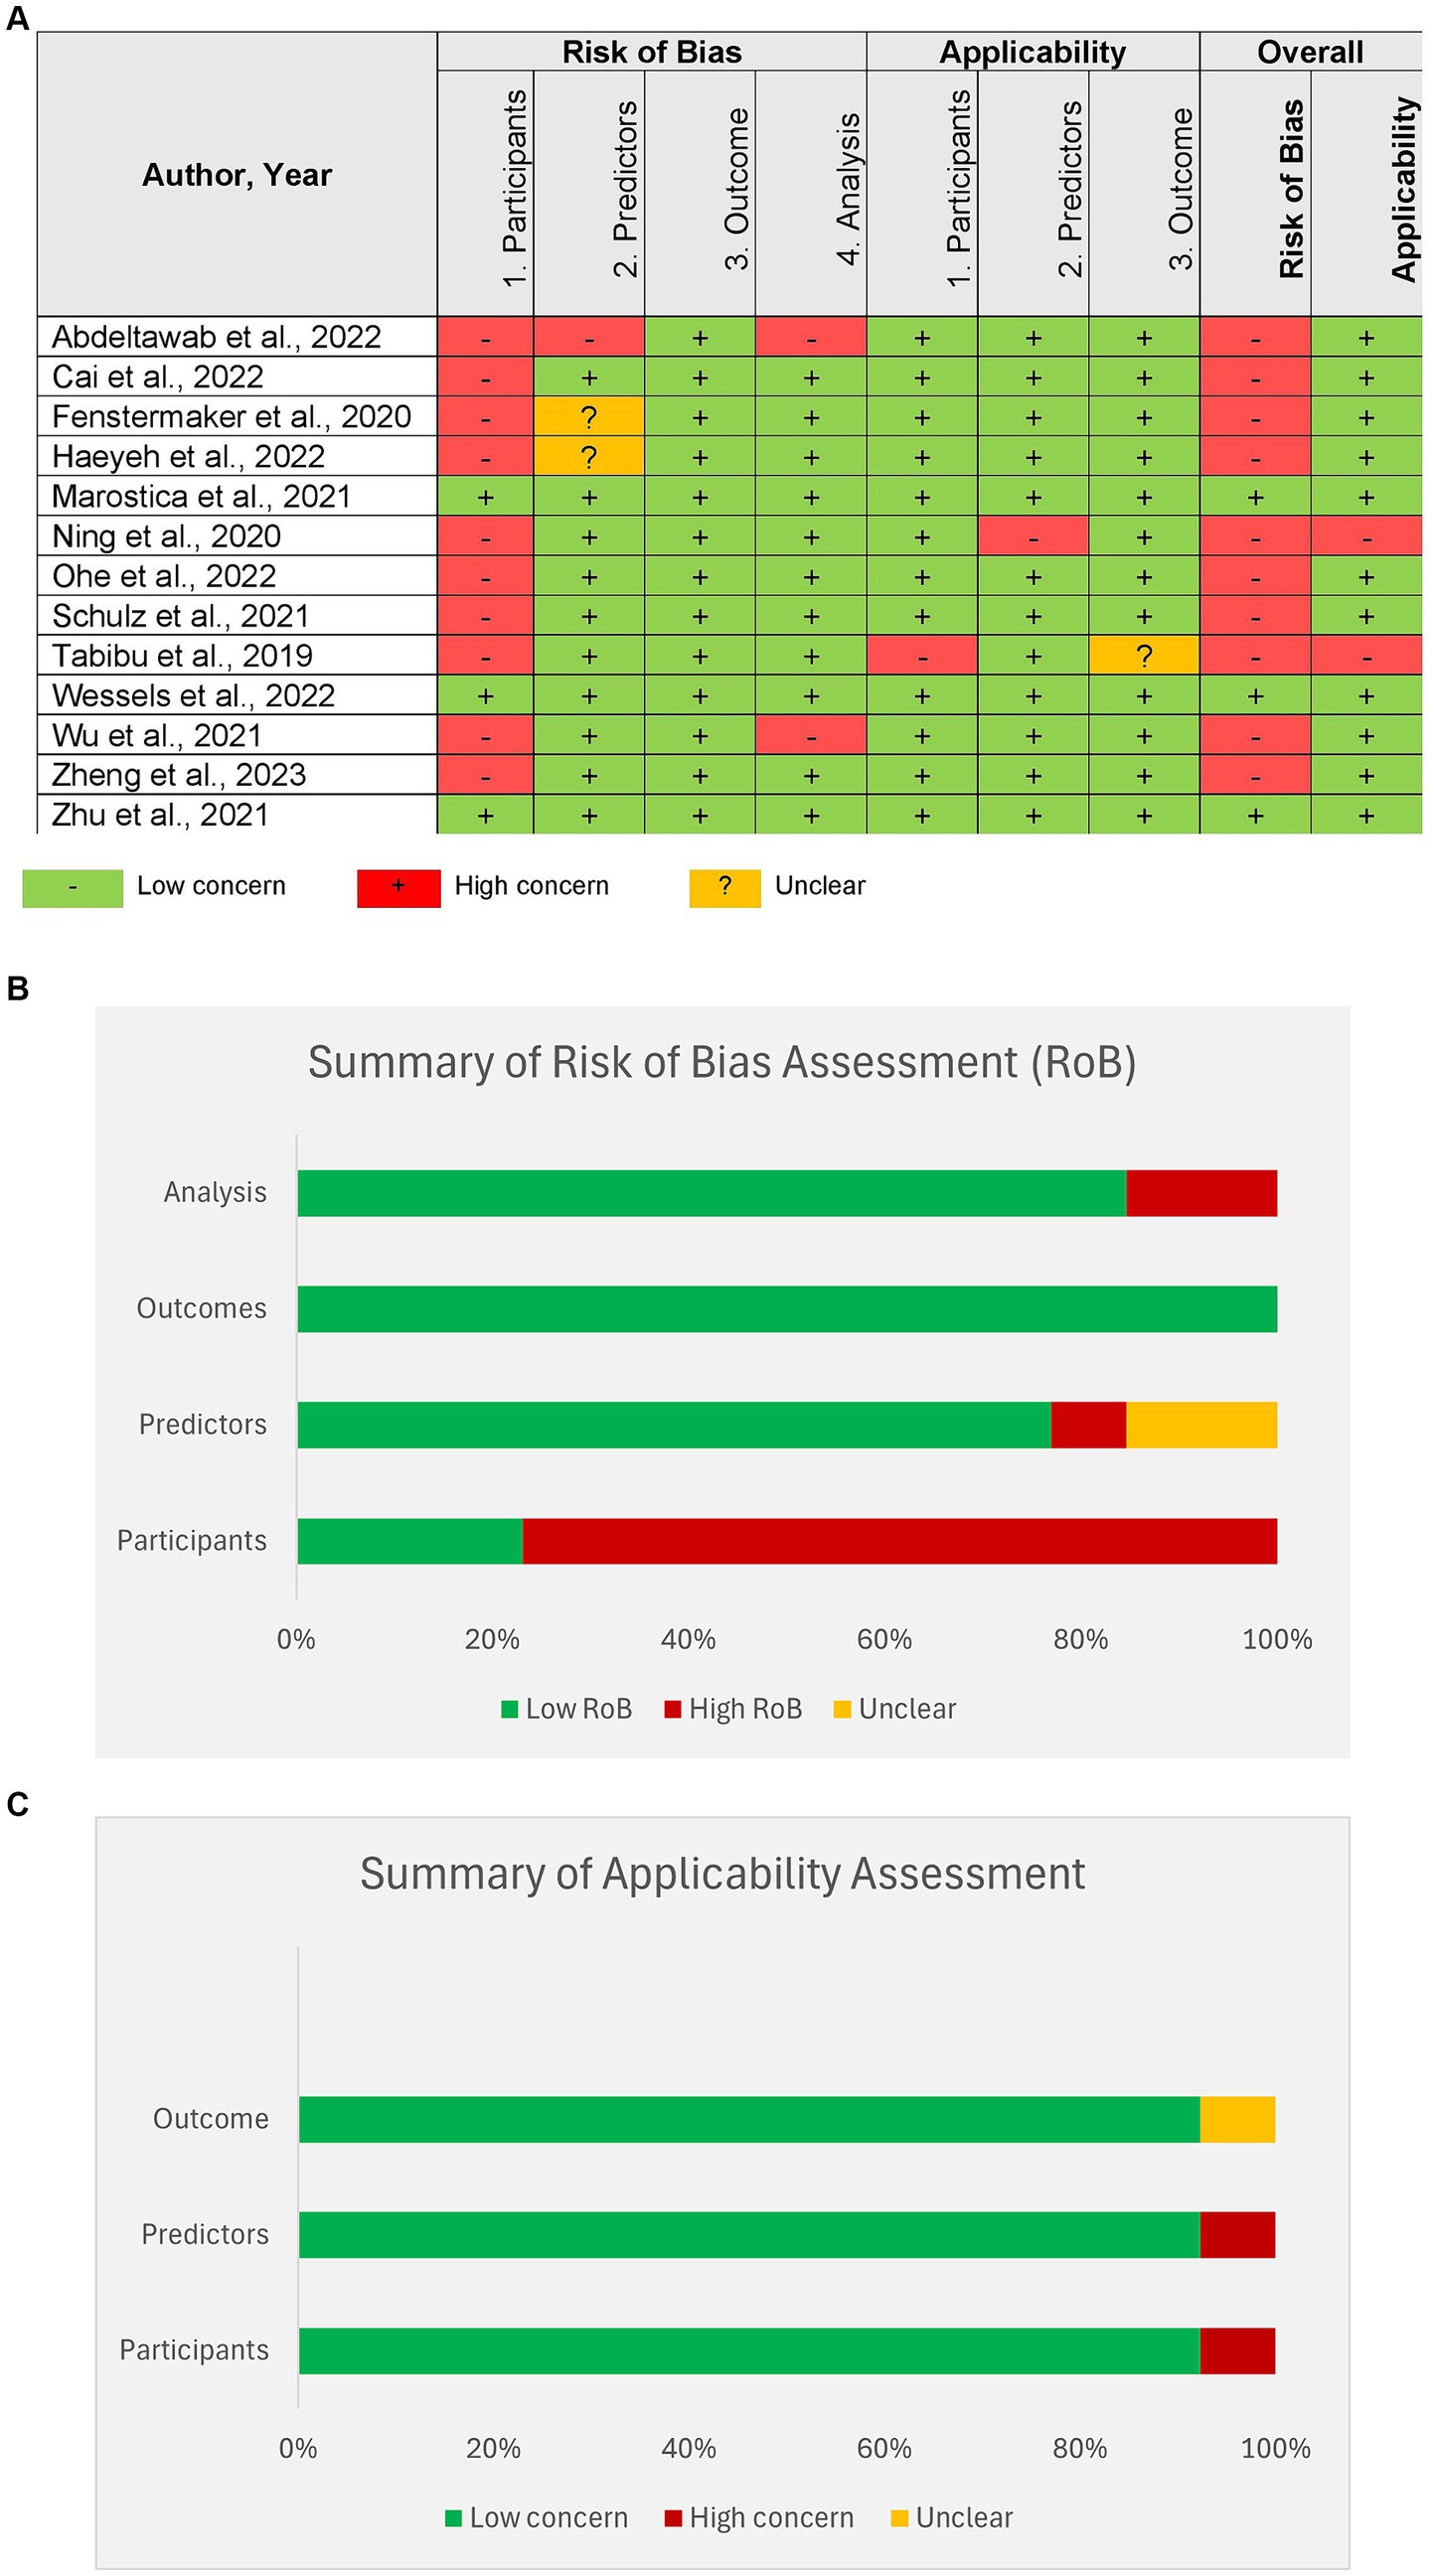
Figure 4. Risk of bias assessment of studies by Prediction model Risk of Bias Assessment Tool (PROBAST). (A) Assessment of individual studies, (B) summary of Risk of bias assessment for all studies, (C) summary of applicability for all studies.
3.5 Heterogeneity
Both the Q statistic and I2 statistics were utilized to assess heterogeneity. Upon quantification of the heterogeneity, we concluded that the degree of heterogeneity was considerable, as they exceeded 75%.
3.6 Sensitivity analysis
Sensitivity analysis was performed by eliminating one study at a time to determine whether there is any difference in the effect sizes. We found no significant differences except in the analysis of pooled specificity. This was due to the reported specificity of 44.9% by Wessels et al., which was lower than other studies. The sensitivity analysis of all the outcomes is shown in the Supplementary material.
3.7 Publication bias
Analysis of Publication Bias was done initially by visual inspection, and it showed a potential publication bias due to the presence of asymmetry. Therefore, an Egger’s test was performed, and the regression intercept gave a 1-tailed p-value of 0.28, indicating the lack of publication bias. The funnel plot with the observed and imputed studies is shown in Figure 5.
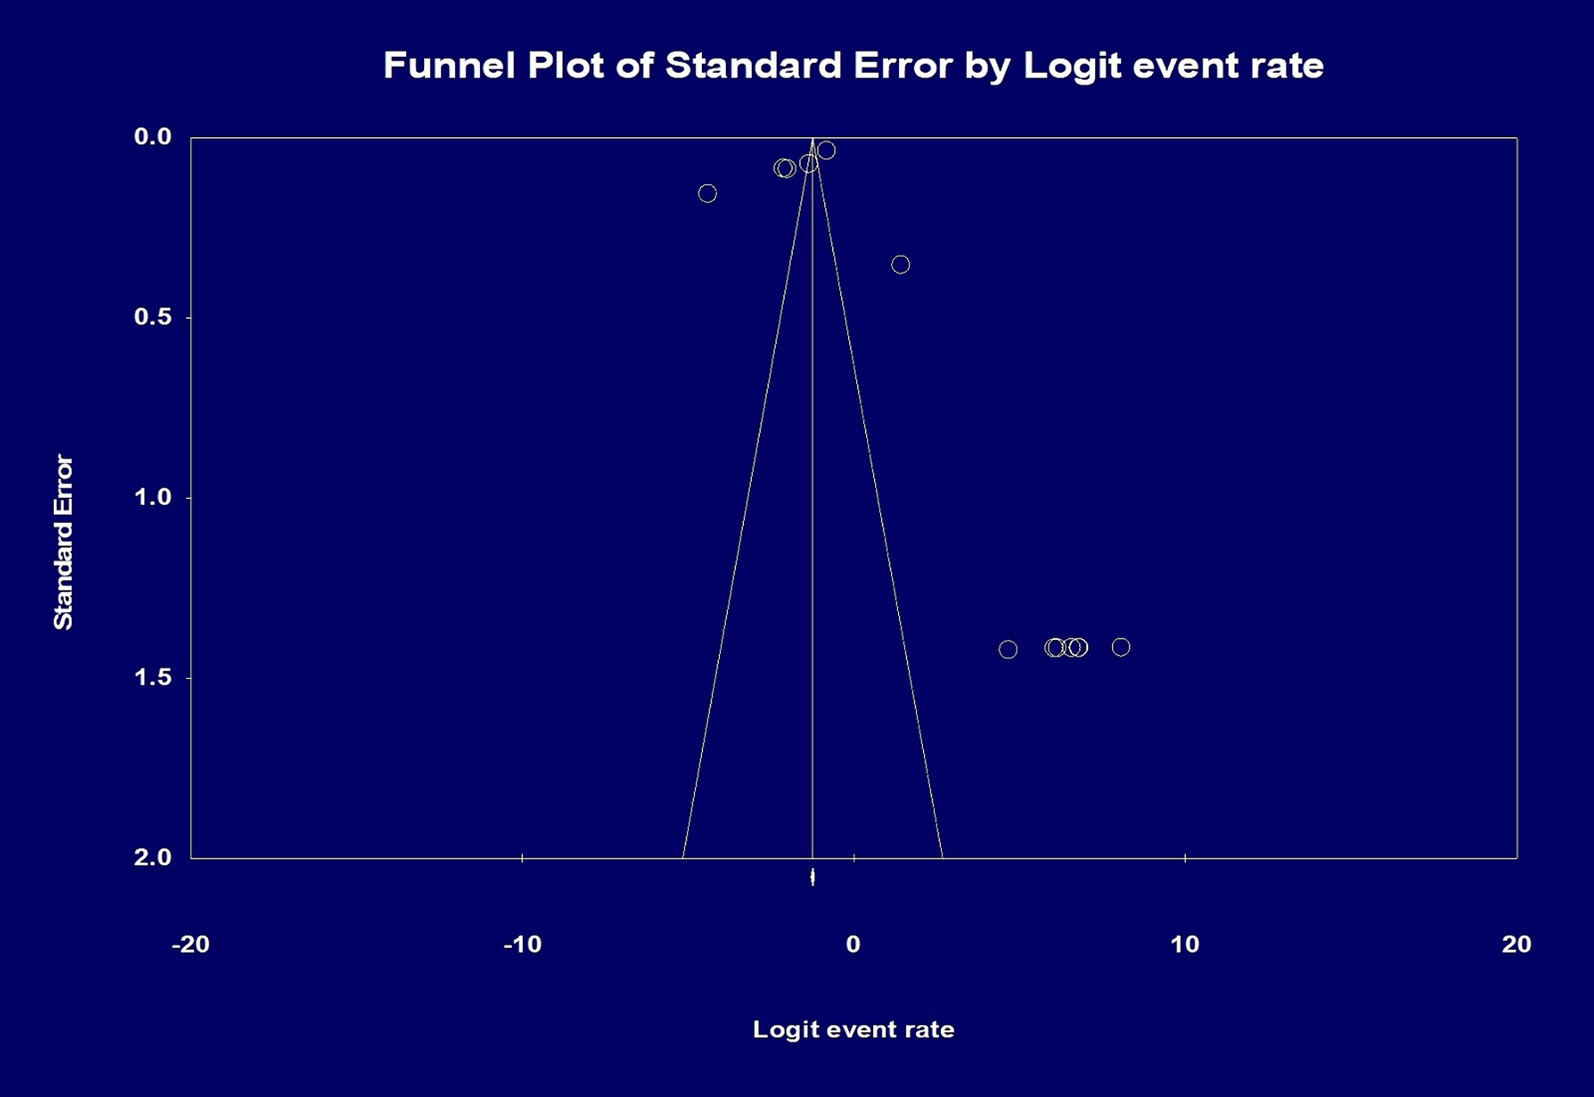
Figure 5. Analysis of publication bias by funnel plot showing the effect size of the total number of patients and the total number of histopathology slides/whole slide images. Egger’s test for a regression intercept gave a 1-tailed p-value of 0.284 indicating no publication bias. The intercept (B0) is 1.942, 95% confidence interval (−5.326 and 9.211), with t = 0.588, df = 11.
4 Discussion
Our systematic review and meta-analysis demonstrate that deep machine learning can be utilized to diagnose renal cell carcinoma, classify subtypes, and grade RCC. Based on our analysis, the DNN models had excellent performance. The pooled accuracy was 92.3%, sensitivity was 97.5%, specificity was 89.2%, and area under the curve 0.91.
Artificial intelligence (AI) in pathology or computational pathology, referred to as pathomics, is a rapidly developing field. Whole-slide imaging (WSI) technology has allowed the capture and storage of histopathologic images into a high-resolution virtual slide, which is used to train deep learning algorithms (38).
At present, deep learning methods are the most successful among other machine learning types in detecting abnormalities in histopathologic images (27). CNNs, by their design, can detect spatial information and compare images (39). These can then be used for deep feature extraction in a weakly supervised or unsupervised learning setting to identify relationships between random variables in a large dataset (36). A supervised approach is where the WSI have annotations showing the irregularity in histopathology, which the machine learning model then uses as a representative to learn from (2). Similarly, the MMDLM uses clinical, radiologic, and histopathological data to train its algorithm and a “fusion” approach to reach a conclusion. Schulz et al. used MMDLM to predict the prognosis and survival among patients with ccRCC (32). Big data is essential to develop and train such deep learning algorithms. In the field of renal malignancies, the TCGA dataset is an excellent resource for genetic, pathologic, molecular, and clinical data that could be used to train and validate these models (1).
Various architecture frameworks have been used to construct a CNN model. These networks comprise several interconnected layers composed of several blocks (30). One of the more commonly used architectures is the ResNet (residual network), which allows more deeper layers to be created and reduces errors (39). ResNet architecture based CNN has been found to have better performance than the Inception-v3 and VGG-16 (visual geometry group) (29).
Typically, in oncology, clinical decision-making involves multiple data points such as biomarkers, gene expression profiling, and radiology imaging. Machine learning algorithms can help in combining various data to improve detection. Eigengenes extraction and radiomics, where CNN can extract genetic and radiology information to augment the prediction accuracy has good outcomes (30). The relationship between copy number alterations (CNAs), a common cause of gene alterations in malignancies, and histopathology can also be elucidated using machine learning. Marostica et al. demonstrated that their model recognized histopathological changes in CNAs involving VHL (von Hippel–Lindau), EGFR (epidermal growth factor), and KRAS (Kristen rat sarcoma virus) genes. Their model also distinguished between low and high-risk RCC and predicted overall survival (29).
Another study by Ning et al. used a combination of features extracted from computed tomography (CT) and histopathology added to eigengenes to create a prognostic model for ccRCC (30).
A high percentage of patients with RCC face recurrence after surgical resection, and current predictive models lack the ability to predict recurrence accurately. DNNs can assist in prognostication and determine survival (30, 32, 40). The model used by Wessels et al. was able to predict the 5-year overall survival (OS) with an AUC of 0.78. The model’s accuracy increased when other data points, such as age, tumor size, and metastasis were added (34). Ohe et al. (31) used their CNN model based on AlexNet to grade ccRCC into clear and eosinophilic types according to the WHO/ISUP system to predict prognosis. When evaluating survival analysis, the concordance index (C-Index) is used to determine the efficacy of matching patients according to their risk. The studies by Ning, Ohe and Sculz et al. reported good performance of their model’s C-index (30–32).
More recently, a study by Chen et al. demonstrated that assessing various cancer types was possible through a self-supervised learning model. The model, called UNI, a Vision Transformer (ViT) based model, could pretrain using more than 100 million images from different datasets and evaluate 34 different histopathologies of varying difficulties. Its performance was superior, particularly while assessing ccRCC and prostate adenocarcinoma histopathologies. The ability to integrate different datasets and perform large quantities of tasks demonstrates that such models could be utilized in the near future to complete large-scale histopathological tasks without compromising diagnostic accuracies (41).
Our study has some limitations. First, all the studies were retrospective, and the data depended on the accuracy of the collection process. Second, there is also a possibility for the introduction of selection bias when datasets were accessed to include patients with RCC or a particular subtype of RCC. Third, although most of the models included in the study were CNN-based, differences exist in the structure and construct of these models. Lastly, heterogeneity was noted in our analyses due to these differences in the models. Therefore, caution must be observed while interpreting these results.
To our knowledge, this is the first meta-analysis to assess the performance of machine learning models in the diagnosis, subtyping and prognostication of RCC using histopathology. Histopathologic classification of renal cell carcinoma into its subtypes and grading is a challenging task. Deep learning can help fill a large void in the early detection of RCC as well as accurate determination of its subtypes. Although it cannot replace the skill and experience of a pathologist or radiologist, it can decrease their workload and improve efficiency.
Data availability statement
The original contributions presented in the study are included in the article/Supplementary material, further inquiries can be directed to the corresponding author.
Ethics statement
Ethical approval was not required for the studies involving humans because data used in the study is available publicly. The studies were conducted in accordance with the local legislation and institutional requirements. Written informed consent for participation was not required from the participants or the participants’ legal guardians/next of kin in accordance with the national legislation and institutional requirements because data used in the study is available publicly.
Author contributions
DC: Conceptualization, Data curation, Formal analysis, Investigation, Methodology, Project administration, Resources, Software, Supervision, Validation, Visualization, Writing – original draft, Writing – review & editing. HG: Data curation, Writing – review & editing. UN: Data curation, Writing – review & editing. PSim: Data curation, Writing – review & editing. BL: Data curation, Writing – review & editing. NJ: Data curation, Writing – review & editing. PSin: Data curation, Writing – review & editing.
Funding
The author(s) declare that no financial support was received for the research, authorship, and/or publication of this article.
Conflict of interest
The authors declare that the research was conducted in the absence of any commercial or financial relationships that could be construed as a potential conflict of interest.
Publisher’s note
All claims expressed in this article are solely those of the authors and do not necessarily represent those of their affiliated organizations, or those of the publisher, the editors and the reviewers. Any product that may be evaluated in this article, or claim that may be made by its manufacturer, is not guaranteed or endorsed by the publisher.
Supplementary material
The Supplementary material for this article can be found online at: https://www.frontiersin.org/articles/10.3389/fmed.2024.1447057/full#supplementary-material
References
1. Ricketts, CJ, De Cubas, AA, Fan, H, Smith, CC, Lang, M, Reznik, E, et al. The Cancer genome atlas comprehensive molecular characterization of renal cell carcinoma. Cell Rep. (2018) 23:313–326.e5. doi: 10.1016/j.celrep.2018.03.075
2. Abu Haeyeh, Y, Ghazal, M, el-Baz, A, and Talaat, IM. Development and evaluation of a novel deep-learning-based framework for the classification of renal histopathology images. Bioengineering. (2022) 9:423. doi: 10.3390/bioengineering9090423
3. Muglia, VF, and Prando, A. Renal cell carcinoma: histological classification and correlation with imaging findings. Radiol Bras. (2015) 48:166–74. doi: 10.1590/0100-3984.2013.1927
4. Medeiros, LJ, Jones, EC, Aizawa, S, Aldape, HC, Cheville, JC, Goldstein, NS, et al. Grading of renal cell carcinoma. Cancer. (1997) 80:990–1. doi: 10.1002/(SICI)1097-0142(19970901)80:5<990::AID-CNCR25>3.0.CO;2-Q
5. DeCastro, GJ, and McKiernan, JM. Epidemiology, clinical staging, and presentation of renal cell carcinoma. Urol Clin N Am. (2008) 35:581–92. doi: 10.1016/j.ucl.2008.07.005
6. Thorstenson, A, Bergman, M, Scherman-Plogell, AH, Hosseinnia, S, Ljungberg, B, Adolfsson, J, et al. Tumour characteristics and surgical treatment of renal cell carcinoma in Sweden 2005–2010: a population-based study from the National Swedish Kidney Cancer Register. Scand J Urol. (2014) 48:231–8. doi: 10.3109/21681805.2013.864698
7. Al-Aynati, M, Chen, V, Salama, S, Shuhaibar, H, Treleaven, D, and Vincic, L. Interobserver and Intraobserver variability using the Fuhrman grading system for renal cell carcinoma. Arch Pathol Lab Med. (2003) 127:593–6. doi: 10.5858/2003-127-0593-IAIVUT
8. Korbar, B, Olofson, AM, Miraflor, AP, Nicka, CM, Suriawinata, MA, Torresani, L, et al. Deep learning for classification of colorectal polyps on whole-slide images. J Pathol Inform. (2017) 8:30. doi: 10.4103/jpi.jpi_34_17
9. Wei, JW, Suriawinata, AA, Vaickus, LJ, Ren, B, Liu, X, Lisovsky, M, et al. Evaluation of a deep neural network for automated classification of colorectal polyps on histopathologic slides. JAMA Netw Open. (2020) 3:e203398. doi: 10.1001/jamanetworkopen.2020.3398
10. Wei, JW, Wei, JW, Jackson, CR, Ren, B, Suriawinata, AA, and Hassanpour, S. Automated detection of celiac disease on duodenal biopsy slides: a deep learning approach. J Pathol Inform. (2019) 10:7. doi: 10.4103/jpi.jpi_87_18
11. Araújo, T, Aresta, G, Castro, E, Rouco, J, Aguiar, P, Eloy, C, et al. Classification of breast cancer histology images using convolutional neural networks. PLoS One. (2017) 12:e0177544. doi: 10.1371/journal.pone.0177544
12. Coudray, N, Ocampo, PS, Sakellaropoulos, T, Narula, N, Snuderl, M, Fenyö, D, et al. Classification and mutation prediction from non–small cell lung cancer histopathology images using deep learning. Nat Med. (2018) 24:1559–67. doi: 10.1038/s41591-018-0177-5
13. Moons, KGM, de Groot, JAH, Bouwmeester, W, Vergouwe, Y, Mallett, S, Altman, DG, et al. Critical appraisal and data extraction for systematic reviews of prediction modelling studies: the CHARMS checklist. PLoS Med. (2014) 11:e1001744. doi: 10.1371/journal.pmed.1001744
14. Page, MJ, McKenzie, JE, Bossuyt, PM, Boutron, I, Hoffmann, TC, Mulrow, CD, et al. The PRISMA 2020 statement: an updated guideline for reporting systematic reviews. Int J Surg. (2021) 88:105906. doi: 10.1016/j.ijsu.2021.105906
15. Altman, DG, and Bland, JM. Statistics notes: diagnostic tests 1: sensitivity and specificity. BMJ. (1994) 308:1552–2. doi: 10.1136/bmj.308.6943.1552
18. Fernandez-Felix, BM, López-Alcalde, J, Roqué, M, Muriel, A, and Zamora, J. CHARMS and PROBAST at your fingertips: a template for data extraction and risk of bias assessment in systematic reviews of predictive models. BMC Med Res Methodol. (2023) 23:44. doi: 10.1186/s12874-023-01849-0
19. DerSimonian, R, and Laird, N. Meta-analysis in clinical trials. Control Clin Trials. (1986) 7:177–88. doi: 10.1016/0197-2456(86)90046-2
20. Borenstein, M, Hedges, LV, Higgins, JP, and Rothstein, HR. A basic introduction to fixed-effect and random-effects models for meta-analysis. Res Synth Methods. (2010) 1:97–111. doi: 10.1002/jrsm.12
21. Higgins, JPT, Thompson, SG, Deeks, JJ, and Altman, DG. Measuring inconsistency in meta-analyses. BMJ. (2003) 327:557–60. doi: 10.1136/bmj.327.7414.557
22. Easterbrook, PJ, Gopalan, R, Berlin, JA, and Matthews, DR. Publication bias in clinical research. Lancet. (1991) 337:867–72. doi: 10.1016/0140-6736(91)90201-Y
23. Duval, S, and Tweedie, R. Trim and fill: a simple funnel-plot–based method of testing and adjusting for publication bias in meta-analysis. Biometrics. (2000) 56:455–63. doi: 10.1111/j.0006-341X.2000.00455.x
24. Borenstein, M. Comprehensive Meta-analysis software In: Systematic reviews in Health Research : Wiley (2022). 535–48.
25. Wolff, RF, Moons, KGM, Riley, RD, Whiting, PF, Westwood, M, Collins, GS, et al. PROBAST: a tool to assess the risk of Bias and applicability of prediction model studies. Ann Intern Med. (2019) 170:51. doi: 10.7326/M18-1376
26. Abdeltawab, HA, Khalifa, FA, Ghazal, MA, Cheng, L, El-Baz, AS, and Gondim, DD. A deep learning framework for automated classification of histopathological kidney whole-slide images. J Pathol Inform. (2022) 13:100093. doi: 10.1016/j.jpi.2022.100093
27. Cai, J, Liu, M, Zhang, Q, Shao, Z, Zhou, J, Guo, Y, et al. Renal Cancer detection: fusing deep and texture features from histopathology images. Biomed Res Int. (2022) 2022:1–17. doi: 10.1155/2022/9821773
28. Fenstermaker, M, Tomlins, SA, Singh, K, Wiens, J, and Morgan, TM. Development and validation of a deep-learning model to assist with renal cell carcinoma histopathologic interpretation. Urology. (2020) 144:152–7. doi: 10.1016/j.urology.2020.05.094
29. Marostica, E, Barber, R, Denize, T, Kohane, IS, Signoretti, S, Golden, JA, et al. Development of a histopathology informatics pipeline for classification and prediction of clinical outcomes in subtypes of renal cell carcinoma. Clin Cancer Res. (2021) 27:2868–78. doi: 10.1158/1078-0432.CCR-20-4119
30. Ning, Z, Ning, Z, Pan, W, Pan, W, Chen, Y, Xiao, Q, et al. Integrative analysis of cross-modal features for the prognosis prediction of clear cell renal cell carcinoma. Bioinformatics. (2020) 36:2888–95.
31. Ohe, C, Yoshida, T, Amin, MB, Uno, R, Atsumi, N, Yasukochi, Y, et al. Deep learning-based predictions of clear and eosinophilic phenotypes in clear cell renal cell carcinoma. Hum Pathol. (2023) 131:68–78. doi: 10.1016/j.humpath.2022.11.004
32. Schulz, S, Woerl, AC, Jungmann, F, Glasner, C, Stenzel, P, Strobl, S, et al. Multimodal deep learning for prognosis prediction in renal Cancer. Front Oncol. (2021) 11:11. doi: 10.3389/fonc.2021.788740
33. Tabibu, S, Vinod, PK, and Jawahar, CV. Pan-renal cell carcinoma classification and survival prediction from histopathology images using deep learning. Sci Rep. (2019) 9:10509. doi: 10.1038/s41598-019-46718-3
34. Wessels, F, Schmitt, M, Krieghoff-Henning, E, Kather, JN, Nientiedt, M, Kriegmair, MC, et al. Deep learning can predict survival directly from histology in clear cell renal cell carcinoma. PLoS One. (2022) 17:e0272656. doi: 10.1371/journal.pone.0272656
35. Wu, J, Zhang, R, Gong, T, Bao, X, Gao, Z, Zhang, H, et al. A precision diagnostic framework of renal cell carcinoma on whole-slide images using deep learning. In: Proceedings - 2021 IEEE international conference on bioinformatics and biomedicine, BIBM 2021. Institute of Electrical and Electronics Engineers Inc.; (2021). p. 2104–2111.
36. Zheng, Q, Yang, R, Xu, H, Fan, J, Jiao, P, Ni, X, et al. A weakly supervised deep learning model and human–machine fusion for accurate grading of renal cell carcinoma from histopathology slides. Cancers. (2023) 15:3198. doi: 10.3390/cancers15123198
37. Zhu, M, Ren, B, Richards, R, Suriawinata, M, Tomita, N, and Hassanpour, S. Development and evaluation of a deep neural network for histologic classification of renal cell carcinoma on biopsy and surgical resection slides. Sci Rep. (2021) 11:7080. doi: 10.1038/s41598-021-86540-4
38. Ma, Y, Cao, F, Xu, X, and Ma, W. Can whole-tumor radiomics-based CT analysis better differentiate fat-poor angiomyolipoma from clear cell renal cell caricinoma: compared with conventional CT analysis? Abdom Radiol. (2020) 45:2500–7. doi: 10.1007/s00261-020-02414-9
39. Ishikawa, C, JAU, Marasigan, and MVC, Caya. Cloud-based signature validation using CNN inception-ResNet architecture. In: 2020 IEEE 12th international conference on humanoid, nanotechnology, information technology, communication and control, environment, and management (HNICEM). IEEE; (2020). p. 1–6.
40. Khene, ZE, Larcher, A, Bernhard, JC, Doumerc, N, Ouzaid, I, Capitanio, U, et al. External validation of the ASSURE model for predicting oncological outcomes after resection of high-risk renal cell carcinoma (RESCUE study: UroCCR 88). Eur Urol Open Sci. (2021) 33:89–93. doi: 10.1016/j.euros.2021.09.004
Keywords: machine learning, deep neural network, pathomics, renal cell carcinma, artificial inteligence-AI
Citation: Chandramohan D, Garapati HN, Nangia U, Simhadri PK, Lapsiwala B, Jena NK and Singh P (2024) Diagnostic accuracy of deep learning in detection and prognostication of renal cell carcinoma: a systematic review and meta-analysis. Front. Med. 11:1447057. doi: 10.3389/fmed.2024.1447057
Edited by:
Sumit Gupta, Cure 4 The Kids, United StatesReviewed by:
Nazim Benzerdjeb, Hospices Civils de Lyon, FranceSatyakant Chitturi, California Department of Corrections and Rehabilitation (CDCR), United States
Ajay Yechuri, Raleigh General Hospital, United States
Copyright © 2024 Chandramohan, Garapati, Nangia, Simhadri, Lapsiwala, Jena and Singh. This is an open-access article distributed under the terms of the Creative Commons Attribution License (CC BY). The use, distribution or reproduction in other forums is permitted, provided the original author(s) and the copyright owner(s) are credited and that the original publication in this journal is cited, in accordance with accepted academic practice. No use, distribution or reproduction is permitted which does not comply with these terms.
*Correspondence: Deepak Chandramohan, ZGVlcGFrY2hhbmRyYW1vaGFuQHVhYm1jLmVkdQ==