Abstract
Purpose:
The objective of this research is to examine the occurrence, clinical manifestations, and determinants of pulmonary embolism (PE) in older individuals diagnosed with chronic obstructive pulmonary disease (COPD).
Methods:
A retrospective analysis was performed on elderly patients diagnosed with COPD, who were admitted to five different hospitals within our province. These patients were categorized into two groups based on the presence or absence of pulmonary embolism (PE). And systematically compile and examine the foundational data, clinical attributes, and pertinent laboratory parameters outlined in their respective medical records. These encompass blood routine, arterial blood gas analysis, coagulation markers, and biochemical indicators.
Results:
A total of 958 elderly patients with COPD were included in the study. Among them, 121 patients (12.63%) were found to have complications with PE. During hospitalization, 50 cases (5.22%) resulted in death. In the multivariate analysis, several factors were found to be significantly associated with a higher prevalence of PE, including age, female gender, deep vein thrombosis, hypertension, PaCO2 ≤ 40 mmHg, and normal clinical signs and symptoms on chest X-rays (p < 0.05). The RDW-SD and RDW-CV values of the COPD combined with the PE group were significantly higher compared to those of the COPD without PE group (p < 0.001). The risk of PE caused by higher RDW-SD was significantly greater than that caused by lower RDW-SD (p < 0.05). The area under the curve for RDW-SD in predicting PE is 0.723. The critical value of RDW-SD was determined to be 46.25, with a sensitivity of 75.59% and a specificity of 67.5%.
Conclusion:
It is essential to give careful attention to the prevalence and factors that put elderly patients with COPD at risk for PE. The utilization of RDW could potentially serve as a predictive tool for identifying the onset of PE in COPD patients.
1 Introduction
Pulmonary thromboembolism (PTE), primarily manifested as pulmonary embolism (PE) in 90% of cases (1, 2), occurs when thrombi occlude pulmonary vessels. Although dual pulmonary circulation usually prevents pulmonary infarction (3), deep venous thrombosis (DVT) remains the predominant embolic source (4, 5). COPD exacerbates PE risk through inflammation-mediated endothelial dysfunction and hypercoagulability (6), with clinical presentations often mimicking acute COPD exacerbations, leading to frequent misdiagnosis (7–9). Timely diagnosis critically impacts prognosis, requiring clinician expertise in selecting appropriate diagnostic methods (10), where CTPA and laboratory indicators prove particularly valuable (11).
CTPA has become the primary diagnostic modality for PE (12), offering non-invasive 3D vascular reconstruction with high spatial resolution (13). Its technical advantages include rapid subsegmental emboli detection and reduced respiratory artifacts (14), maintaining high sensitivity/specificity while ensuring cost-effectiveness (15).
COPD’s chronic hypoxia induces erythrocytosis and impairs coagulation factor clearance (16), while systemic inflammation activates coagulation pathways through endothelial damage (17). Although inflammatory factors may drive coagulation changes as extrapulmonary COPD manifestations (18), conventional indicators (APTT, PT) reflect endogenous pathway activation (19), with D-dimer indicating coagulation-fibrinolysis interplay (20). Notably, PaCO2 levels show significant decreases in COPD-PE patients (21). Over the past few years, a rise has been observed in the frequency of Red Cell Distribution Width (RDW) in a wide range of illnesses. This observation implies that RDW holds the potential as a valuable marker for distinguishing between different diseases (22).
Coagulation function and arterial blood gas analysis have established reference values for diagnosing COPD combined with PE. However, currently, CTPA examination remains one of the most reliable, fastest, and sensitive methods for diagnosing PE. Coagulation function and blood gas analysis provide clues for diagnosing COPD combined with PE and also have value in preventing the occurrence of this combination. This research is to retrospectively analyze elderly patients with COPD and PE, exploring the risk factors and predictive value of clinical characteristics, CTPA results, and laboratory indicators.
2 Methods
2.1 Research object
This study adhered to the case inclusion criteria and analyzed 958 elderly patients diagnosed with COPD from 5 different hospitals in our province between June 1, 2022, and May 31, 2023. A retrospective study was carried out by categorizing elderly patients with COPD into two groups according to the occurrence of PE. The initial cohort, denoted as the observation group, was composed of PE-inflicted elderly COPD patients. In contrast, the control group included elderly COPD patients without PE. The study was sanctioned by the institutional review board at each participating center and adhered to the principles outlined in the Declaration of Helsinki. Considering its retrospective design, the necessity for written informed consent was waived.
2.2 Inclusion and exclusion criteria
Inclusion criteria: (1) The age of the patient is ≥60 years old; (2) According to the global initiative on chronic obstructive pulmonary disease (GOLD) standard (23), doctors diagnosed patients with COPD. Additionally, patients who were previously hospitalized and diagnosed with COPD at discharge, as well as those receiving treatment for COPD, were included; (3) The patient was diagnosed with PE based on the criteria outlined in the ESC Pulmonary Embolism Diagnosis and Treatment Guidelines (24).
Exclusion criteria: (1) Individuals with prior blood transfusion records and present hematologic disorders (e.g., anemia, irregular blood cell production, and blood cancers); (2) Participants lacking complete or accessible data.
2.3 Data collection
Basic information, like age and gender, should be included in the medical records of older individuals. Additionally, clinical features including blood pressure, pulse rate, and signs and symptoms associated with deep vein thrombosis (DVT), like pain, redness, and swelling of the affected limb, must be documented. Electrocardiogram attributes such as right bundle branch, right QRS axis deviation, and S1Q3T3 should also be noted, in addition to radiological findings from chest X-rays and any other pertinent information.
Laboratory parameters including complete blood count (CBC), arterial blood gas (ABG) analysis, coagulation profile, and biochemical indices were systematically collected. The CBC evaluation encompassed: white blood cell (WBC) count, red blood cell (RBC) count, hemoglobin (Hb) concentration, platelet count (PLT), red cell distribution width (RDW) parameters [coefficient of variation (RDW-CV) and standard deviation (RDW-SD)], mean platelet volume (MPV), platelet distribution width (PDW), and hematocrit (Hct). RDW-CV was calculated as (standard deviation of erythrocyte volume/mean corpuscular volume [MCV]) × 100, reflecting relative volumetric variation, while RDW-SD provided absolute erythrocyte size distribution in femtoliters (fL). Comorbid conditions (e.g., heat exhaustion, diabetes mellitus) and established PE risk factors including malignancy and prior venous thromboembolism were concurrently documented.
2.4 Statistical method
The IBM SPSS 26.0 software was employed to analyze all the data in this particular study. To assess the normal distribution of the dataset, the Shapiro–Wilk method was implemented, and any observed differences were statistically considered significant if p < 0.05. For continuous variables, the mean ± standard deviation (SD) or median values were used to present the data, and the Student t-test or Mann–Whitney U test was utilized for analysis. As for categorical data, cases (counts) or percentages were presented, and the chi-square test was employed for analysis. Relevant variables were included in the logistic regression model. This model aimed to determine the independent risk factors associated with COPD patients who had PE. The presence of PE was also evaluated in terms of its impact on in-hospital mortality and length of stay. To assess the discriminant performance of the parameters, the receiver operating characteristic (ROC) curve was utilized. The corresponding area under the curve (AUC) with a 95% confidence interval (CI) was employed for comparing predicted probabilities. The optimal cutoff value, determined based on the Youden index, was used to calculate the sensitivity and specificity cutoff values of the parameters.
3 Results
3.1 Analysis of baseline demographic characteristics of patients and potential clinical characteristics and risk factors of PE
Among the 958 elderly patients diagnosed with COPD, with a mean age of 75.4 ± 7.6 years and 65.6% being male, a total of 121 patients were diagnosed with PE. This corresponds to an average prevalence of 12.63% (Figure 1). Table 1 provides a list of baseline demographics, potential clinical characteristics, and risk factors associated with PE.
Figure 1

Grouping information.
Table 1
| Total population | COPD with PE | COPD without PE | t/X2 | p-value | ||||
|---|---|---|---|---|---|---|---|---|
| n | % | n | % | n | % | |||
| N | 958 | 100.0 | 121 | 100.0 | 837 | 100.0 | ||
| Age (Mean ± SD, years) | 75.4 (7.6) | 78.6 (7.7) | 74.9 (7.4) | 5.08 | <0.001 | |||
| Sex - Men | 628 | 65.6 | 61 | 50.4 | 567 | 67.7 | 14.06 | <0.001 |
| Recent bed rest ≥3 days | 238 | 24.8 | 41 | 33.9 | 197 | 23.5 | 6.06 | 0.01 |
| Recent surgery | 32 | 3.3 | 7 | 5.8 | 25 | 3.0 | 2.56 | 0.11 |
| Previous venous thromboembolism | 86 | 9.0 | 20 | 16.5 | 66 | 7.9 | 9.66 | 0.002 |
| Malignant tumor | 192 | 20.0 | 17 | 14.0 | 175 | 20.9 | 3.10 | 0.08 |
| Heart failure | 104 | 10.9 | 17 | 14.0 | 87 | 10.4 | 1.46 | 0.23 |
| Diabetes Mellitus | 158 | 16.5 | 16 | 13.2 | 142 | 17.0 | 1.08 | 0.30 |
| Hypertension | 247 | 25.8 | 41 | 33.9 | 206 | 24.6 | 4.75 | 0.03 |
| Atrial fibrillation | 97 | 10.1 | 14 | 11.6 | 83 | 9.9 | 0.32 | 0.57 |
| Coronary Artery Disease | 183 | 19.1 | 28 | 23.1 | 155 | 18.5 | 1.46 | 0.23 |
| Stroke | 74 | 7.7 | 11 | 9.1 | 63 | 7.5 | 0.36 | 0.55 |
| Inflammatory bowel disease | 6 | 0.6 | 0 | 0.0 | 6 | 0.7 | 0.87 | 0.35 |
| Renal failure | 66 | 6.9 | 10 | 8.3 | 56 | 6.7 | 0.41 | 0.52 |
| Liver cirrhosis | 20 | 2.1 | 1 | 0.8 | 19 | 2.3 | 1.08 | 0.30 |
| At-home O2 therapy | 215 | 22.4 | 20 | 16.5 | 195 | 23.3 | 2.78 | 0.10 |
| Oral anticoagulation | 89 | 9.3 | 9 | 7.4 | 80 | 9.6 | 0.56 | 0.45 |
| Antiplatelet therapy | 347 | 36.2 | 49 | 40.5 | 298 | 35.6 | 1.10 | 0.30 |
| purulent sputum | 230 | 24.0 | 20 | 16.5 | 210 | 25.1 | 4.27 | 0.04 |
| Clinical signs of deep venous thrombosis | 81 | 8.5 | 30 | 24.8 | 51 | 6.1 | 47.76 | <0.001 |
| SpO2 < 90 mmHg or O2 therapy | 535& | 58.0 | 70 | 60.9 | 465 | 57.5 | 0.23 | 0.63 |
| At least one abnormal ECG indicates pulmonary embolism | 187&& | 19.6 | 32 | 26.4 | 155 | 18.7 | 4.23 | 0.04 |
| pCO2 < 40 mmHg | 414&&& | 48.2 | 66 | 60.0 | 348 | 46.5 | 8.35 | 0.004 |
| pH > 7.45 | 255&&& | 29.7 | 38 | 34.5 | 217 | 29.0 | 1.43 | 0.23 |
| Normal chest X-ray | 182&&&& | 21.1 | 36 | 35.0 | 146 | 19.3 | 13.39 | <0.001 |
Comparison of baseline characteristics and clinical complications of included patients.
&Data of 35 patients were lost (Patients with PE: 6; Patients without PE: 29); &&Data of 6 patients were lost (Patients without PE: 6); &&&Data of 99 patients were lost (Patients with PE: 11; Patients without PE: 88); &&&&Data of 97 patients were lost (Patients with PE: 18; Patients without PE: 79).
3.2 Analysis of clinical and pathological features of patients
In this study, a total of 778 patients (81.2%) had at least one disease, while 220 patients (23.0%) had two or more concurrent diseases. During hospitalization, 887 cases (92.6%) underwent chest X-rays, with 181 cases (20.4%) showing no significant changes, 323 cases (36.4%) exhibiting pulmonary infiltrative changes, and 130 cases (14.7%) presenting pleural effusion. Arterial blood gas analysis was conducted in 870 cases (90.8%), revealing that 256 cases (29.4%) had a pH value ≥7.45, and 415 cases (47.7%) had PaCO2 levels within or below the normal range. The average duration of hospitalization for patients was (14.4 ± 8.5) days. Among them, 50 cases (5.18%) resulted in death during hospitalization, including 7 cases (5.8%) of patients with PE. Compression ultrasound was performed in 164 cases (17.1%), and 62 cases (6.42%) were found to have complications of DVT. Interestingly, among the patients without PE on chest vascular CT, 26 individuals were diagnosed with DVT, accounting for 2.71% of the total population and 41.93% of the DVT patients.
3.3 Comparison of laboratory test indexes of patients
In comparison to the control group, the observation group exhibited considerably higher levels of RDW-SD and RDW-CV (p < 0.001). The albumin (ALB) level in the observation group was markedly lower than that in the control group (p < 0.001). Furthermore, the observation group displayed significantly elevated levels of ALT, AST, and lactate dehydrogenase (LDH-L) in contrast to the control group (p < 0.001). Additionally, the D-dimer concentration in the observation group was notably higher than that in the control group (p < 0.001).
The levels of RBC, Hb, Hct, PLT, platelet crit (PCT %), eosinophils (EO %), lymphocytes (LYM %), oxygen saturation (SO2%), partial pressure of oxygen (PO2%), and fibrinogen (FIB) in the observation group exhibited significant reduction compared to the control group (p < 0.05). Furthermore, the observation group demonstrated significantly elevated MPV, neutrophils (Neut %), lactate (Lac %), and prothrombin time (PT) in comparison to the control group (p < 0.05). Table 2 introduces a comparative analysis of laboratory test parameters, encompassing blood count, biochemical measures, blood gas analysis, and coagulation markers, between the two patient groups.
Table 2
| Parameters | COPD with PE | COPD without PE | P value |
|---|---|---|---|
| WBC (×109/l) | 8.41 (5.69–10.87) | 8.26 (6.3–10.31) | 0.961 |
| RBC (×1012/l) | 4.18 ± 0.67 | 4.50 ± 0.57 | 0.031 |
| HB (g/l) | 124.89 ± 17.50 | 135.07 ± 18.12 | 0.006 |
| HCT (%) | 37.5 (35.05–42.05) | 41.5 (37.9–45.3) | 0.013 |
| MCV (fl) | 92.78 ± 7.13 | 92.66 ± 5.04 | 0.789 |
| MCH (Pg) | 29.87 ± 2.50 | 30.14 ± 1.73 | 0.769 |
| MCHC (g/l) | 321.60 ± 15.91 | 321.55 ± 10.70 | 0.894 |
| PLT (×109/l) | 162.9 (131.6–247) | 209 (175–256) | 0.010 |
| RDW-SD (fl) | 48.8 (43.7–52.37) | 43.9 (41.0–45.2) | < 0.001 |
| RDW-CV (%) | 14.8 (12.78–15.37) | 12.8 (12.0–13.9) | < 0.001 |
| PDW (fl) | 12.05 (11.0, 13.8) | 11.3 (9.6–13.4) | 0.059 |
| MPV (fl) | 10.66 ± 1.41 | 9.67 ± 1.09 | 0.025 |
| PCT (%) | 0.19 (0.14–0.28) | 0.22 (0.19–0.26) | 0.045 |
| P-LCR (%) | 28.79 ± 9.49 | 25.60 ± 8.11 | 0.062 |
| EO (×109/l) | 0.03 (0.01–0.09) | 0.08 (0.02–0.19) | 0.001 |
| NEUT (%) | 79.4 (75.26–85.21) | 75.1 (69.4–83.4) | 0.015 |
| LYM (%) | 12.44 (8.14–15.44) | 15.69 (10.0–20.9) | 0.035 |
| MONO (%) | 6.39 (4.89–8.31) | 6.5 (5.3–8.3) | 0.370 |
| EO (%) | 0.64 (0–1.14) | 1.1 (0.4–2.5) | 0.010 |
| ALB (g/l) | 35.5 (33.8–38.8) | 38.9 (35.0–41.4) | < 0.001 |
| ALT (μ/l) | 24 (13–33.7) | 14 (9–19) | < 0.001 |
| AST (μ/l) | 18.4 (14.4–30.4) | 17 (12–18) | < 0.001 |
| LDH-L (μ/l) | 238.0 (194.0–277.0) | 176 (155–202) | < 0.001 |
| CHOL (mmol/l) | 4.42 (3.51–4.75) | 4.21 (3.71–5.2) | 0.394 |
| TG (mmol/l) | 1.34 (0.96–1.56) | 1.16 (0.78–1.48) | 0.065 |
| CREA (μmol/l) | 59.0 (51–87.34) | 58.6 (54–74) | 0.932 |
| UA (μmol/l) | 238.2 (172–374.90) | 245 (211–327.6) | 0.879 |
| PH | 7.46 (7.5–7.57) | 7.53 (7.51–7.56) | 0.328 |
| SO2 (%) | 92.4 (88.54–96.34) | 95.69 (93.38–97.4) | 0.003 |
| PO2 (mmHg) | 64.36 (52.9–77.2) | 73.3 (64.4–75.1) | 0.005 |
| PCO2 (mmHg) | 42.3 (35.9–52.5) | 43.5 (41–50.9) | 0.343 |
| Lac (mmol/l) | 1.76 (1.34–2.34) | 1.56 (1.1–1.95) | 0.033 |
| PT (sec) | 13.9 (13.0, 15.2) | 13.1 (12.8, 14.0) | 0.009 |
| APTT (sec) | 36.9 (31.1–41.9) | 36.2 (32.6–38.6) | 0.811 |
| TT (sec) | 16.8 (15.54–19.65) | 16.6 (15.7–17.5) | 0.316 |
| FIB (g/l) | 3.65 (2.32–5.17) | 4.74 (3.5–5.95) | 0.002 |
| D-Dimer (μg/ml) | 2.61 (1.86–9.14) | 0.43 (0.30–0.73) | < 0.001 |
Comparison of laboratory test indexes included in patients.
3.4 Univariate and multivariate analysis of clinical and pathological risk factors associated with the prevalence of PE
A higher occurrence of PE was found to be significantly linked with various factors based on the univariate analysis. These factors encompassed age, female gender, previous occurrence of venous thromboembolism, the existence of at least one ECG abnormality implying PE, pH ≥ 7.45, PaCO2 ≤ 40 mm Hg, absence of anomalies in a chest radiograph, clinical indications and symptoms indicative of deep vein thrombosis, recent surgical procedure, recently extended bed rest for at least 3 days, and clinical records of heart failure and hypertension (p < 0.05). Conversely, patients with malignant tumors and those with purulent sputum had a significantly lower prevalence of PE. The summarized results of the univariate analysis can be found in Table 3.
Table 3
| Univariate | Multivariate | |||
|---|---|---|---|---|
| Adjusted OR | 95% CI | Adjusted OR | 95% CI | |
| Age (Mean ± SD, years) | 1.06 | 1.03;1.08# | 1.04 | 1.02;1.07# |
| Sex - Men | 0.50 | 0.35;0.71# | 0.41 | 0.27;0.64# |
| Recent bed rest ≥3 days | 1.68 | 1.13;2.47* | Not selected | Not selected |
| Recent surgery | 2.08 | 0.91;4.72* | Not selected | Not selected |
| Previous venous thromboembolism | 2.30 | 1.36;3.88# | Not selected | Not selected |
| Malignant tumor | 0.61 | 0.37;1.02 | – | – |
| Heart failure | 1.43 | 0.84;2.45* | Not selected | Not selected |
| Diabetes mellitus | 0.80 | 0.49;1.33 | – | – |
| Hypertension | 1.55 | 1.03;2.30* | 1.61 | 1.02;2.62* |
| Atrial fibrillation | 1.20 | 0.69;2.12 | – | – |
| Coronary artery disease | 1.33 | 0.85;2.06 | – | – |
| Stroke | 1.20 | 0.62;2.30 | – | – |
| Renal failure | 1.28 | 0.66;2.49 | – | – |
| Liver cirrhosis | 0.34 | 0.06;2.45 | – | – |
| At-home O2 therapy | 0.65 | 0.40;1.05 | – | – |
| Oral anticoagulation | 0.80 | 0.41;1.56 | – | – |
| Antiplatelet therapy | 1.20 | 0.82;1.75 | – | – |
| Purulent sputum | 0.58 | 0.36;0.95 | – | – |
| Clinical signs of deep venous thrombosis | 5.20 | 3.22;8.39# | 5.64 | 3.13;10.16# |
| SpO2 < 90 mmHg or O2 therapy | 1.14 | 0.77;1.69 | – | – |
| At least one abnormal ECG indicates pulmonary embolism | 1.55 | 1.01;2.38* | Not selected | Not selected |
| pCO2 < 40 mmHg | 1.74 | 1.18;2.56# | 1.98 | 1.25;3.15# |
| pH > 7.45 | 1.24 | 0.82;1.88* | Not selected | Not selected |
| Normal chest X-ray | 2.22 | 1.43;3.41# | 1.91 | 1.15;3.14# |
Univariate and multivariate analysis of risk factors of clinical characteristics.
*p < 0.05; #p < 0.01.
In the analysis that accounts for multiple variables, numerous factors were discovered to exhibit a significant correlation with a greater occurrence of PE (p < 0.05). These factors encompass age, being female, the presence of clinical indications implying deep vein thrombosis, high blood pressure, PaCO2 ≤ 40 mmHg, and a chest X-ray within normal limits. Additional information can be seen in Table 3.
Patients in the observation group experienced a slightly longer average hospital stay in comparison to those in the control group (15.8 days versus 14.2 days, p = 0.06). Despite a slightly higher in-hospital mortality rate being observed in the observation group, this difference did not reach statistical significance (5.8% versus 5.1%, p = 0.76).
3.5 Logistic regression analysis of laboratory indexes of patients
The laboratory parameters exhibiting significant disparities (p < 0.001), as shown in Table 2, were integrated into the multifactor logistic regression model. Assessing the logistic regression model in Table 4 unveils the autonomous factors positing risks for PE. LDH-L, RDW-SD, and D-dimer were identified as autonomous risk factors for PE in elderly COPD patients (p < 0.05).
Table 4
| Variable | Adjusted OR | 95% CI | p-value |
|---|---|---|---|
| RDW-SD (fl) | 1.179 | 1.037–1.359 | 0.005 |
| RDW-CV (%) | 1.024 | 0.847–1.186 | 0.793 |
| ALB (g/l) | 0.925 | 0.763–1.018 | 0.149 |
| ALT (μ/l) | 1.007 | 0.976–1.043 | 0.626 |
| AST (μ/l) | 0.973 | 0.910–1.063 | 0.711 |
| LDH-L (μ/l) | 1.024 | 1.021–1.046 | 0.029 |
| D-Dimer (μg/ml) | 1.515 | 1.041–2.204 | 0.025 |
Logistic regression model analysis showed independent laboratory index risk factors of PE.
3.6 Analysis of the diagnostic value of RDW and D-dimer in predicting PE in patients with COPD
To assess the predictive precision of RDW-CV, RDW-SD, and D-dimer for PE, ROC curve analysis was conducted. The resulting AUC values were determined as 0.778, 0.723, and 0.887, correspondingly. The critical values that yielded the best prediction for PE were determined to be 46.25 for RDW-SD, 1.747 for D-dimer, and 13.59 for RDW-CV ratio. The corresponding sensitivity and specificity values were 75.59 and 67.5% for RDW-SD, 82.92 and 92.5% for D-dimer, and 78.82 and 77.5% for RDW-CV ratio. Please refer to Figure 2 for a visual representation of the results. Table 5 provides detailed statistics on the prediction accuracy of RDW and D-dimer.
Figure 2
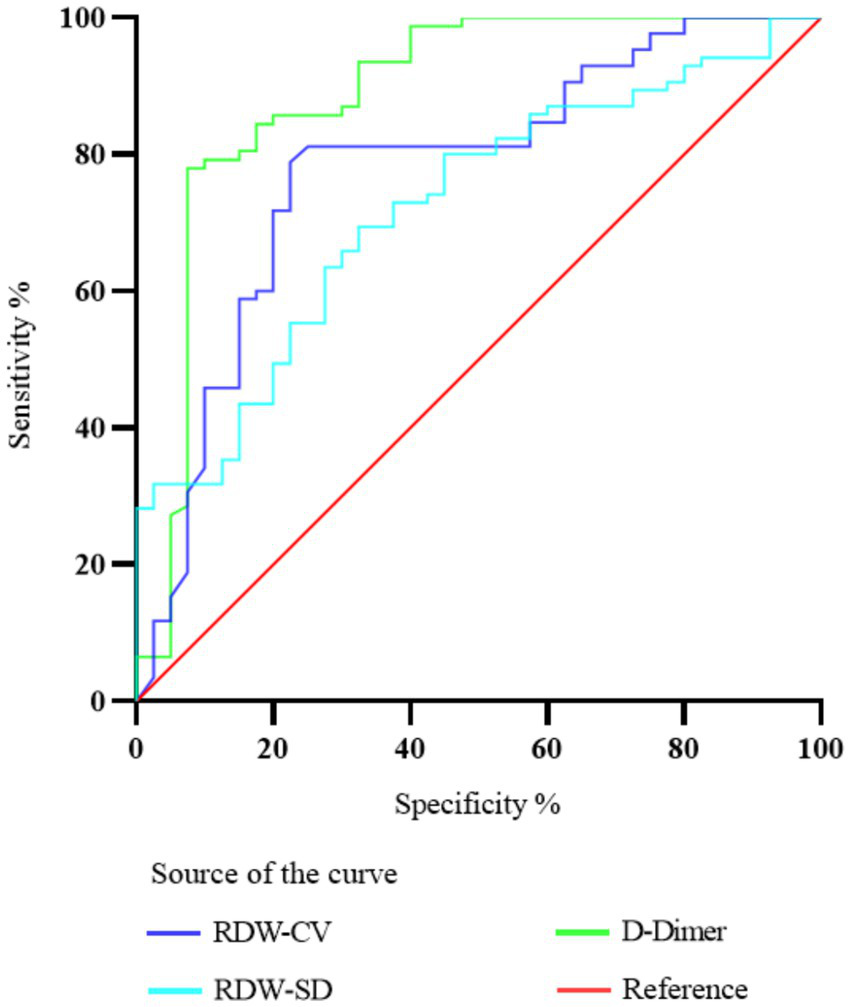
Diagnostic value of ROC curve comparison of RDW-CV, RDW-SD, and D-dimer in predicting PE in patients with COPD.
Table 5
| Parameters | RDW-CV | RDW-SD | D-Dimer |
|---|---|---|---|
| Cut off | 13.59 | 46.25 | 1.747 |
| AUC | 0.778 | 0.723 | 0.887 |
| 95% CI | 0.6863 to 0.8687 | 0.6312 to 0.8141 | 0.8123 to 0.9621 |
| Sensitivity (%) | 78.82 | 75.59 | 82.92 |
| Specificity (%) | 77.5 | 67.5 | 92.5 |
| p-value | <0.001 | <0.001 | <0.001 |
Comparison of discriminant ability between RDW and D-dimer in predicting COPD and PE.
4 Discussion
During this investigation, a noteworthy connection emerged between the prevalence of PE and the clinical indicators and manifestations of deep vein thrombosis (DVT) (with an odds ratio of around 5.6). Merely a minor proportion of individuals (6.1%) did not encounter the development of PE. From a pathophysiological perspective, it has been suggested that patients with COPD and PE may have reduced partial pressure of carbon dioxide (25). However, there is ongoing debate regarding the clinical evidence supporting this view. Some studies have reported that PE may occur due to a decrease in PaCO2 during COPD exacerbations, while others have argued that the diagnostic value of arterial blood gas testing in PE is limited unless included in the clinical score (26, 27). In our investigation, we veer towards the latter perspective since we noted a reduction in the carbon dioxide’s partial pressure in 60.0% of individuals identified with PE and in 46.5% of those without a diagnosis of PE.
Earlier research has shown that there is a high occurrence of imaging alterations, specifically consolidation on chest radiographs, among senior individuals diagnosed with COPD (28). Furthermore, these changes have been associated with an unfavorable prognosis. According to our research findings, around 21.1% of individuals diagnosed with COPD exhibited normal results in their chest X-rays. This observation was linked to a higher probability of developing VTE, with an odds ratio of approximately 1.9. Furthermore, our study identified that among elderly COPD patients who do not experience PE, the presence of other risk factors alongside “clinical indications and manifestations of DVT” does not serve as an efficient method for diagnosing or excluding the possibility of PE.
According to this study, it appears that PE has a limited impact on patient prognosis. In the case of elderly individuals diagnosed with COPD, there is no mortality disparity of statistical significance observed when comparing patients with and without PE (5.8% vs. 5.1%, p = 0.76). Additionally, the hospital stay for patients with PE was only slightly longer compared to those without PE (15.8 days vs. 14.2 days, p = 0.06). This suggests that hospitalization during diagnosis and subsequent treatment effectively reduces the risk of death and lengthier hospital stays.
The investigation revealed that there was a noticeable increase in the levels of RDW-CV and RDW-SD among elderly COPD patients with PE in comparison to those who did not have PE. Moreover, heightened RDW-SD levels exhibited a considerably augmented likelihood of PE, whereas diminished RDW-SD levels were linked to a decreased risk. The escalated susceptibility to PE in COPD patients might be attributed to multiple mechanisms, encompassing systemic inflammation (29), hypoxemia (30), amplified oxidative stress (31), dysfunction of endothelium (32), and an inclination towards increased blood clot formation (33). The results derived from this investigation imply that RDW has the potential to function as an alternative biomarker to gauge the level of inflammatory activity. Previous studies have also indicated a possible link between inflammation and chronic thromboembolic pulmonary hypertension in RDW (34). The occurrence of these irregularities can involve the amplified release of erythropoietin and an undetected sudden decline in cardiac functionality.
A multivariate analysis employing logistic regression was carried out to assess the influence of various risk factors on the presence of both COPD and PE. Our study reveals that RDW-SD, LDH-L, and D-dimer possess distinct predictive significance for PE, regardless of the presence of other risk factors. The risk of PE is significantly increased by both elevated and decreased levels of D-dimer. Additionally, an augmented risk of PE is closely linked with RDW-SD, underscoring its involvement as a contributing factor to PE. Detecting PE early is of utmost importance for patients at high risk, and doctors can assess the risk in COPD and PE patients by considering the levels of RDW-SD.
RDW, an easily measured laboratory factor that is relatively simple, inexpensive, and has been recently demonstrated to predict mortality and morbidity in various diseases, has emerged as a potential predictor of PE prognosis (35). In one study involving 702 PE patients, RDW levels were found to be a potential marker for mortality (36). Previous research has indicated that blood RDW levels have the potential to serve as an uncomplicated and convenient measure for forecasting the likelihood of mortality within 30 days for individuals with PE. In addition, Hammons et al. noted a connection between RDW and prognosis, severity, and survival rates in patients experiencing acute PE (37).
Nevertheless, limited investigations have focused on the potential of RDW in predicting PE specifically in COPD patients. Analysis of ROC curves has demonstrated that D-dimer exhibits a higher AUC in predicting PE compared to RDW-SD. Notably, while D-dimer demonstrates superior diagnostic accuracy in acute PE detection, our findings highlight RDW’s unique clinical merits as a chronic disease progression marker. The persistent elevation of RDW may reflect cumulative inflammatory burden and hypoxia-mediated erythrocyte dysfunction in COPD patients (30, 34), potentially serving as an early warning sign for subclinical thrombotic predisposition prior to acute events. Particularly in scenarios where D-dimer interpretation is confounded by recent surgery, trauma, or chronic inflammatory states (20), RDW provides complementary value through its stability across these clinical conditions. Future investigations should explore optimized biomarker panels combining RDW’s chronic risk stratification capacity with D-dimer’s acute phase responsiveness, potentially enhancing PE prediction in complex COPD populations. This dual-marker approach could prove crucial for implementing personalized anticoagulation strategies in elderly COPD patients with varying thrombotic risk trajectories. As a result, we propose the hypothesis that heightened levels of RDW could potentially function as a reliable marker for the presence of PE in COPD patients.
5 Conclusion
In this multicenter retrospective research, we discovered that 2.71% of elderly patients with COPD were diagnosed with DVT without PE. This finding highlights the importance of considering the prevalence of VTE. Using multivariate analysis, we discovered numerous potential clinical risk factors associated with PE in patients with COPD. These factors include being female, exhibiting clinical symptoms and signs indicating DVT, having hypertension, having a PaCO2 level below 40 mmHg, and presenting with a normal chest X-ray. Moreover, we uncovered that RDW-SD might serve as a promising biomarker for the diagnosis of PE in elderly individuals diagnosed with COPD.
Statements
Data availability statement
The original contributions presented in the study are included in the article/Supplementary material, further inquiries can be directed to the corresponding authors.
Author contributions
CJ: Methodology, Project administration, Investigation, Writing – original draft, Writing – review & editing. YH: Methodology, Investigation, Software, Writing – original draft, Writing – review & editing. LF: Investigation, Project administration, Resources, Writing – original draft, Writing – review & editing.
Funding
The author(s) declare that financial support was received for the research and/or publication of this article. This work was su250, the National Key Research and Development Program of China (Grants No.0702).
Conflict of interest
The authors declare that the research was conducted in the absence of any commercial or financial relationships that could be construed as a potential conflict of interest.
Publisher’s note
All claims expressed in this article are solely those of the authors and do not necessarily represent those of their affiliated organizations, or those of the publisher, the editors and the reviewers. Any product that may be evaluated in this article, or claim that may be made by its manufacturer, is not guaranteed or endorsed by the publisher.
Supplementary material
The Supplementary material for this article can be found online at: https://www.frontiersin.org/articles/10.3389/fmed.2025.1421169/full#supplementary-material
- COPD
chronic obstructive pulmonary disease
- PE
pulmonary embolism
- RDW
red cell distribution width
- DVT
deep venous thrombosis
- CTPA
CT pulmonary angiography
- APTT
activated partial thromboplastin time
- PT
prothrombin time
- WBC
white blood cell
- RB
red blood cell
- Hb
hemoglobin
- PLT
platelet count
- RDW-CV
coefficient of variation
- RDW-SD
standard deviation
- MPV
mean platelet volume
- PDW
platelet distribution width
- Hct
hematocrit
- MCV
mean corpuscular volume
- MCH
mean corpuscular hemoglobin
- MCHC
mean corpuscular hemoglobin concentration
- PCT
platelet crit
- EO
eosinophils
- LYM
lymphocytes
- MONO
monocytes
- Neut
neutrophils
- ALB
albumin
- ALT
alanine aminotransferase
- AST
aspartate aminotransferase
- LDH-L
lactate dehydrogenase
- CHOL
cholesterol
- TG
triglyceride
- CREA
creatinine
- UA
uric acid
- SO2
oxygen saturation
- PO2
partial pressure of oxygen
- PaCO2
partial pressure of carbon dioxide
- Lac
lactate
- TT
thrombin time
- FIB
fibrinogen
- ROC
receiver operating characteristic
- AUC
area under the curve
- CI
confidence interval
- OR
odds ratio
- VTE
venous thromboembolism
- HIF-2
hypoxia-inducible factor-2
- AECOPD
acute exacerbation of chronic obstructive pulmonary disease
- ESC
European society of cardiology
Glossary
References
1.
Pulmonary embolism. Nat Rev Dis Primers. (2018) 4:18031. doi: 10.1038/nrdp.2018.31
2.
Goldhaber SZ . Pulmonary embolism. Lancet. (2018) 363:1295–305. doi: 10.1016/S0140-6736(04)16004-2
3.
Ten Cate V Prochaska JH Schulz A Nagler M Robles AP Jurk K et al . Clinical profile and outcome of isolated pulmonary embolism: a systematic review and meta-analysis. EClinicalMedicine. (2023) 59:101973. doi: 10.1016/j.eclinm.2023.101973
4.
Bikdeli B Caraballo C Trujillo-Santos J Galanaud JP di Micco P Rosa V et al . Clinical presentation and short- and long-term outcomes in patients With isolated distal deep vein thrombosis vs proximal deep vein Thrombosis in the RIETE registry. JAMA Cardiol. (2022) 7:857–65. doi: 10.1001/jamacardio.2022.1988
5.
Shi Y Wang T Yuan Y Su H Chen L Huang H et al . Silent pulmonary embolism in deep vein thrombosis: relationship and Risk factors. Clin Appl Thromb Hemost. (2022) 28:10760296221131034. doi: 10.1177/10760296221131034
6.
Jiménez D Agustí A Tabernero E Jara-Palomares L Hernando A Ruiz-Artacho P et al . Effect of a pulmonary embolism diagnostic strategy on clinical outcomes in patients hospitalized for COPD exacerbation: a randomized clinical trial. JAMA. (2021) 326:1277–85.
7.
Chaireti R . In patients hospitalized for COPD exacerbation, a PE diagnostic strategy + usual care did not improve outcomes. Ann Intern Med. (2022) 175:JC19. doi: 10.7326/J21-0017
8.
Aleva FE Voets LWLM Simons SO de Mast Q van der Ven AJAM Heijdra YF . Prevalence and localization of pulmonary embolism in unexplained acute exacerbations of COPD: a systematic review and Meta-analysis. Chest. (2017) 151:544–54. doi: 10.1016/j.chest.2016.07.034
9.
Bertoletti L Couturaud F Sanchez O Jimenez D . Pulmonary embolism and chronic obstructive pulmonary disease. Semin Thromb Hemost. (2023) 49:809–15. doi: 10.1055/s-0042-1756190
10.
Ende-Verhaar Y Huisman M FJTr K . To screen or not to screen for chronic thromboembolic pulmonary hypertension after acute pulmonary embolism. Thromb Res. (2017) 151:1–7. doi: 10.1016/j.thromres.2016.12.026
11.
Rodríguez C Solier A Marín M Tenes A Durán D Retegui A et al . Prognostic significance of findings on CTPA supporting an alternative diagnosis to PE among patients hospitalized for an exacerbation of COP D: predefined subanalysis of the SLICE trial. Arch Bronconeumol. (2022) 58:T412–7. doi: 10.1016/j.arbres.2022.02.012
12.
Rothenberg SA Savage CH Abou Elkassem A Singh S Abozeed M Hamki O et al . Prospective evaluation of AI triage of pulmonary emboli on CT Pulmonary angiograms. Radiology. (2023) 309:e230702. doi: 10.1148/radiol.230702
13.
Pu J Gezer NS Ren S Alpaydin AO Avci ER Risbano MG et al . Automated detection and segmentation of pulmonary embolisms on compute d tomography pulmonary angiography (CTPA) using deep learning but without manual outlining. Med Image Anal. (2023) 89:102882. doi: 10.1016/j.media.2023.102882
14.
Cahan N Marom EM Soffer S Barash Y Konen E Klang E et al . Weakly supervised attention model for RV strain classification from volumetric CTPA scans. Comput Methods Prog Biomed. (2022) 220:106815. doi: 10.1016/j.cmpb.2022.106815
15.
Righini M Robert-Ebadi H Cremonesi A Elias A Sanchez O Le Moigne E et al . Risk of neonatal hypothyroidism in newborns from mothers exposed to CT. J Thromb Haemost. (2022) 20:2550–5. doi: 10.1111/jth.15843
16.
Myronenko O Foris V Crnkovic S Olschewski A Rocha S Nicolls MR et al . Endotyping COPD: hypoxia-inducible factor-2 as a molecular "switch" between the vascular and airway phenotypes?Eur Respir Rev. (2023) 32:220173. doi: 10.1183/16000617.0173-2022
17.
Racanelli AC Kikkers SA Choi AMK Cloonan SM . Autophagy and inflammation in chronic respiratory disease. Autophagy. (2018) 14:221–32. doi: 10.1080/15548627.2017.1389823
18.
Yao R-Q Ren C Xia Z-F Yao Y-M . Organelle-specific autophagy in inflammatory diseases: a potential therapeutic target underlying the quality control of multiple organelles. Autophagy. (2021) 17:385–401. doi: 10.1080/15548627.2020.1725377
19.
Liu M Hu R Jiang X Mei X . Coagulation dysfunction in patients with AECOPD and its relation to infection and hypercapnia. J Clin Lab Anal. (2021) 35:e23733. doi: 10.1002/jcla.23733
20.
Zhang M Zhang J Zhang Q Yang X Shan H Ming Z et al . D-dimer as a potential biomarker for the progression of COPD. Clin Chim Acta. (2016) 455:55–9. doi: 10.1016/j.cca.2016.01.024
21.
Duiverman ML Vonk JM Bladder G van Melle JP Nieuwenhuis J Hazenberg A et al . Home initiation of chronic non-invasive ventilation in COPD patients with chronic hypercapnic respiratory failure: a randomised controlled trial. Thorax. (2020) 75:244–52. doi: 10.1136/thoraxjnl-2019-213303
22.
Alparslan Bekir S Tuncay E Gungor S Yalcinsoy M Sogukpinar Ö Gundogus B et al . Can red blood cell distribution width (RDW) level predict the severity of acute exacerbation of chronic obstructive pulmonary disease (AECOP D)?Int J Clin Pract. (2021) 75:e14730. doi: 10.1111/ijcp.14730
23.
Agusti A Böhm M Celli B Criner GJ Garcia-Alvarez A Martinez F et al . GOLD COPD DOCUMENT 2023: a brief update for practicing cardiologists. Clin Res Cardiol. (2024) 113:195–204. doi: 10.1007/s00392-023-02217-0
24.
Pruszczyk P Klok FA Kucher N Roik M Meneveau N Sharp ASP et al . Percutaneous treatment options for acute pulmonary embolism: a clinical consensus statement by the ESC working group on pulmonary Circulation and right ventricular function and the European Association of Percutaneous cardiovascular interventions. EuroIntervention. (2022) 18:e623–38. doi: 10.4244/EIJ-D-22-00246
25.
Chopin C Fesard P Mangalaboyi J Lestavel P Chambrin MC Fourrier F et al . Use of capnography in diagnosis of pulmonary embolism during acute respiratory failure of chronic obstructive pulmonary disease. Crit Care Med. (1990) 18:353–7. doi: 10.1097/00003246-199004000-00001
26.
Nizet TAC van den Elshout FJJ Heijdra YF van de Ven MJT Mulder PGH Folgering HTM . Survival of chronic hypercapnic COPD patients is predicted by smoking habits, comorbidity, and hypoxemia. Chest. (2005) 127:1904–10. doi: 10.1378/chest.127.6.1904
27.
Tillie-Leblond I Marquette C-H Perez T Scherpereel A Zanetti C Tonnel A-B et al . Pulmonary embolism in patients with unexplained exacerbation of chronic obstructive pulmonary disease: prevalence and risk factors. Ann Intern Med. (2006) 144:390–6. doi: 10.7326/0003-4819-144-6-200603210-00005
28.
Govaere O Petersen SK Martinez-Lopez N Wouters J Van Haele M Mancina RM et al . Macrophage scavenger receptor 1 mediates lipid-induced inflammation in non-alcoholic fatty liver disease. J Hepatol. (2022) 76:1001–12. doi: 10.1016/j.jhep.2021.12.012
29.
Rizkallah J Man SFP Sin DD . Prevalence of pulmonary embolism in acute exacerbations of COPD: a systematic review and metaanalysis. Chest. (2021) 135:786–93. doi: 10.1378/chest.08-1516
30.
Hoffman JS Viswanath VK Tian C Ding X Thompson MJ Larson EC et al . Smartphone camera oximetry in an induced hypoxemia study. NPJ Digit Med. (2022) 5:146. doi: 10.1038/s41746-022-00665-y
31.
Shin S Gombedza FC Awuah Boadi E Yiu AJ Roy SK Bandyopadhyay BC . Reduction of TRPC1/TRPC3 mediated ca2+−signaling protects oxidative stress-induced COPD. Cell Signal. (2023) 107:110681. doi: 10.1016/j.cellsig.2023.110681
32.
Dinh-Xuan AT Pepke-Zaba J Butt AY Cremona G Higenbottam TW . Impairment of pulmonary-artery endothelium-dependent relaxation in chronic obstructive lung disease is not due to dysfunction of endothelial cell membrane receptors nor to L-arginine deficiency. Br J Pharmacol. (1993) 109:587–91. doi: 10.1111/j.1476-5381.1993.tb13611.x
33.
Jervan Ø Haukeland-Parker S Gleditsch J Tavoly M Klok F Steine K et al . The effects of exercise training in patients with persistent dyspnea following pulmonary embolism: a randomized controlled trial. Chest. (2023) 164:981–91. doi: 10.1016/j.chest.2023.04.042
34.
Salvagno GL Sanchis-Gomar F Picanza A Lippi G . Red blood cell distribution width: a simple parameter with multiple clinical applications. Crit Rev Clin Lab Sci. (2015) 52:86–105. doi: 10.3109/10408363.2014.992064
35.
Hammons L Filopei J Steiger D Bondarsky E . A narrative review of red blood cell distribution width as a marker for pulmonary embolism. J Thromb Thrombolysis. (2019) 48:638–47. doi: 10.1007/s11239-019-01906-w
36.
Ozsu S Abul Y Gunaydin S Orem A Ozlu T . Prognostic value of red cell distribution width in patients with pulmonary embolism. Clin Appl Thromb Hemost. (2021) 20:365–70. doi: 10.1177/1076029612464901
37.
Bateman RM Sharpe MD Jagger JE Ellis CG Solé-Violán J López-Rodríguez M et al . 36th international symposium on intensive care and emergency medicine: Brussels, Belgium. Crit Care. (2016) 20:94. doi: 10.1186/s13054-016-1208-6
Summary
Keywords
chronic obstructive pulmonary disease, pulmonary embolism, red cell distribution width, clinical characteristics, risk factors
Citation
Jin C, Hu Y and Liu F (2025) Clinical characteristics, clinical laboratories, and risk factors of elderly patients with chronic obstructive pulmonary disease complicated with pulmonary embolism. Front. Med. 12:1421169. doi: 10.3389/fmed.2025.1421169
Received
22 April 2024
Accepted
03 March 2025
Published
14 May 2025
Volume
12 - 2025
Edited by
Silvia Rossi Paccani, GlaxoSmithKline, Italy
Reviewed by
Warawut Chaiwong, Chiang Mai University, Thailand
Roberto Giovanni Carbone, University of Genoa, Italy
Updates
Copyright
© 2025 Jin, Hu and Liu.
This is an open-access article distributed under the terms of the Creative Commons Attribution License (CC BY). The use, distribution or reproduction in other forums is permitted, provided the original author(s) and the copyright owner(s) are credited and that the original publication in this journal is cited, in accordance with accepted academic practice. No use, distribution or reproduction is permitted which does not comply with these terms.
*Correspondence: Fang Liu, kathyliufang2022@outlook.com; Yanping Hu, huyanping2307@163.com
Disclaimer
All claims expressed in this article are solely those of the authors and do not necessarily represent those of their affiliated organizations, or those of the publisher, the editors and the reviewers. Any product that may be evaluated in this article or claim that may be made by its manufacturer is not guaranteed or endorsed by the publisher.