 Qiuyi Huo1,2†
 Jin Li
- 1Department of Ophthalmology, Eye Institute, Eye & ENT Hospital, Fudan University, Shanghai, China
- 2Department of Cataract, Eye Hospital, School of Ophthalmology and Optometry, Wenzhou Medical University, Wenzhou, China
Background: We investigated the metabolic profiles of aqueous humor (AH) among patients with high-myopia complicated nuclear cataract (HMnC), age-related nuclear cataract (NC), cortical cataract (CC), and high myopia (HM); we sought to identify possible metabolic mediators for these conditions.
Methods: The metabolic data of AH from 29 patients (nine with HMnC, nine with CC, seven with NC, and four with high myopia) were analyzed by liquid chromatography-tandem mass spectrometry. Principal component analysis, sample correlation analysis, and orthogonal partial least squares discriminant analysis modeling were conducted. Univariate and multivariate analyses were performed to identify differential metabolites with potential biological significance.
Results: For HMnC patients, the level of glutathione was decreased, whereas arginine, tyrosine, and tryptophan were more abundant in AH. Dihomomethionine and 8-methylthiooctanaldoxime located in the methionine metabolic pathways were downregulated in NC samples compared with HMnC samples. Additionally, the levels of D-alanyl-D-alanine, 1-methylpyrrolinium, L-phenylalanine, ecgonine methyl ester, ecgonine, tropinone, and azacyclohexane, NNK-N-oxide, 3-succinoylpyridine, and N-nitrosodimethylamine were all upregulated in HM samples compared with HMnC samples.
Conclusion: This work identified valuable metabolic biomarkers and pathways that may improve understanding HMnC pathogenesis. Here, we found that a decrease in glutathione might promote the occurrence of HMnC. Arginine, tyrosine, and tryptophan were more abundant in AH from HMnC patients and tended to prevent HMnC progression. These findings have translational value in terms of developing new therapeutic measures for HMnC-related complications.
1 Introduction
High myopia (HM) is defined as an axial length (AL) >26 mm or the spherical equivalent of <−6.0 diopters (D). By 2050, 938 million people will have HM, comprising approximately 9.8% of the world’s population (1). HM is a predisposing factor for cataracts (2); high-myopia complicated nuclear cataract (HMnC) exhibits rapid deterioration along with poor preoperative biological detection, surgical complexity, and increased postoperative complications (3). Thus, there is a need to understand the pathogenesis of HMnC for effective prevention and treatment.
Metabolomics is a new field that involves collections of small metabolic molecules (4) to help predict disease risk, identify biomarkers, and assess disease progression (5). Active metabolites rely on chemical modifications or interactions with macromolecules to affect the genome, epigenome, transcriptome, and/or proteome (6, 7). Metabolite abnormalities in aqueous humor (AH) can be used to characterize various ocular diseases (8). In the eye, the lens capsule was bathed by aqueous humor, so AH affected the lens (9). In a gas chromatography/time-of-flight mass spectrometry analysis, Chen et al. (10) found that glycine could serve as a potential biomarker for the early diagnosis of primary congenital glaucoma. Wei et al. (11) observed abnormalities in amino acid, fatty acid, and carbohydrate metabolism in AH in patients with central retinal vein occlusion. Lactate, succinate, 2-hydroxybutyrate, asparagine, dimethylamine, histidine, threonine, and glutamine were identified as metabolites with potential play roles in the development and progression of diabetic retinopathy (12).
Although metabolomics has revealed the metabolic characteristics of common ocular diseases, few studies have concerned the characteristics of AH metabolism in HMnC. To address this knowledge gap, we sought to identify novel metabolite markers for HMnC using AH samples.
2 Methods
2.1 Clinical sample collection
Twenty-nine patients were included in this study. NC, CC, and HMnC underwent normal cataract surgery and HM without cataract underwent posterior scleral reinforcement surgery. The patients in the HM group do not have cataracts HM. The inclusion criteria for all patients were age ≥18 years, no intraoperative or postoperative complications and AL ≥26 mm in patients with HMnC and patients with HM. There was no requirement for the axial length of patients with CC and patients with NC. Only patients with HMnC were regrouped, and HMnC patients with 26 ≤ AL < 28 mm were assigned to group A, and the remains were assigned to group B (13–15). Patients who met either of the following criteria were excluded from our analysis: (1) presence of strabismus, keratopathy, glaucoma, uveitis, choroidal neovascularization, and/or macular degeneration; (2) presence of hypertension and/or diabetes.
2.2 Metabolic profiling and data processing
First, all samples were analyzed by high-performance liquid chromatography-tandem mass spectrometry (HPLC-MS). A Vanquish ultra-high performance liquid chromatograph and a Waters ACQUITY UPLC BEH Amide liquid chromatography columns were used for chromatographic separation of the target compounds. Compound Discover V3.1 software was used to extract data. Compound identification involved online searches of mzCloud and the comprehensive database ChemSpider. The criteria used for the identification of differential metabolites were t-test p-value <0.05 [or −log10 (p-value) >1.3] and VIP >1. Principal component analysis was used for the reduction of data dimensionality through orthogonal transformation. Correlation coefficients between samples were calculated based on the relative expression levels of all metabolites identified by positive and negative ion channels. Finally, orthogonal partial least squares discriminant analysis (OPLS-DA) modeling was conducted to identify differential metabolites with potential biological significance. Metabolic pathway annotation and enrichment analysis of differential metabolites were performed using the Kyoto Encyclopedia of Genes and Genomes Pathway data.1 Differential metabolites were annotated using the Human Metabolome Database (HMDB).
2.3 Statistical analysis
Statistical analyses were performed with SPSS Statistics 26 software. Differential metabolites were compared among groups using the Student’s t-test and analysis of variance. Multivariate statistical analysis was used to compare variable importance in projection (VIP) values for OPLS-DA. The p-values in this study will be uniformly expressed as −log10 (p-value). −log10 (p-value) >1.3 (equal to p-value <0.05) was considered statistically significant.
3 Results
3.1 Clinical data and patient characteristics
The 29 AH samples shown in Table 1 were divided into four groups: high myopia nuclear cataract (HMnC), age-related cortical cataract (CC), age-related nuclear cataract (NC), and high myopia (HM). The sample size, age, and gender of each subgroup were shown in Table 1. The study protocol was approved by the Ethics Committee of the Eye Hospital of Wenzhou Medical University (ID: 2022-009-K-07-01) and conducted following the principles of the Declaration of Helsinki.

Table 1. Sample information.
3.2 Nontargeted metabolomics in AH samples
Table 2 shows the metabolites that had exact matches in multiple databases (mzCloud Search, ChemSpider Search, and MassList Search). In positive ion mode, the number of metabolites was 5,000; 43 had exact matches. The total number of metabolites in negative ion mode was 5,083; 44 had exact matches.
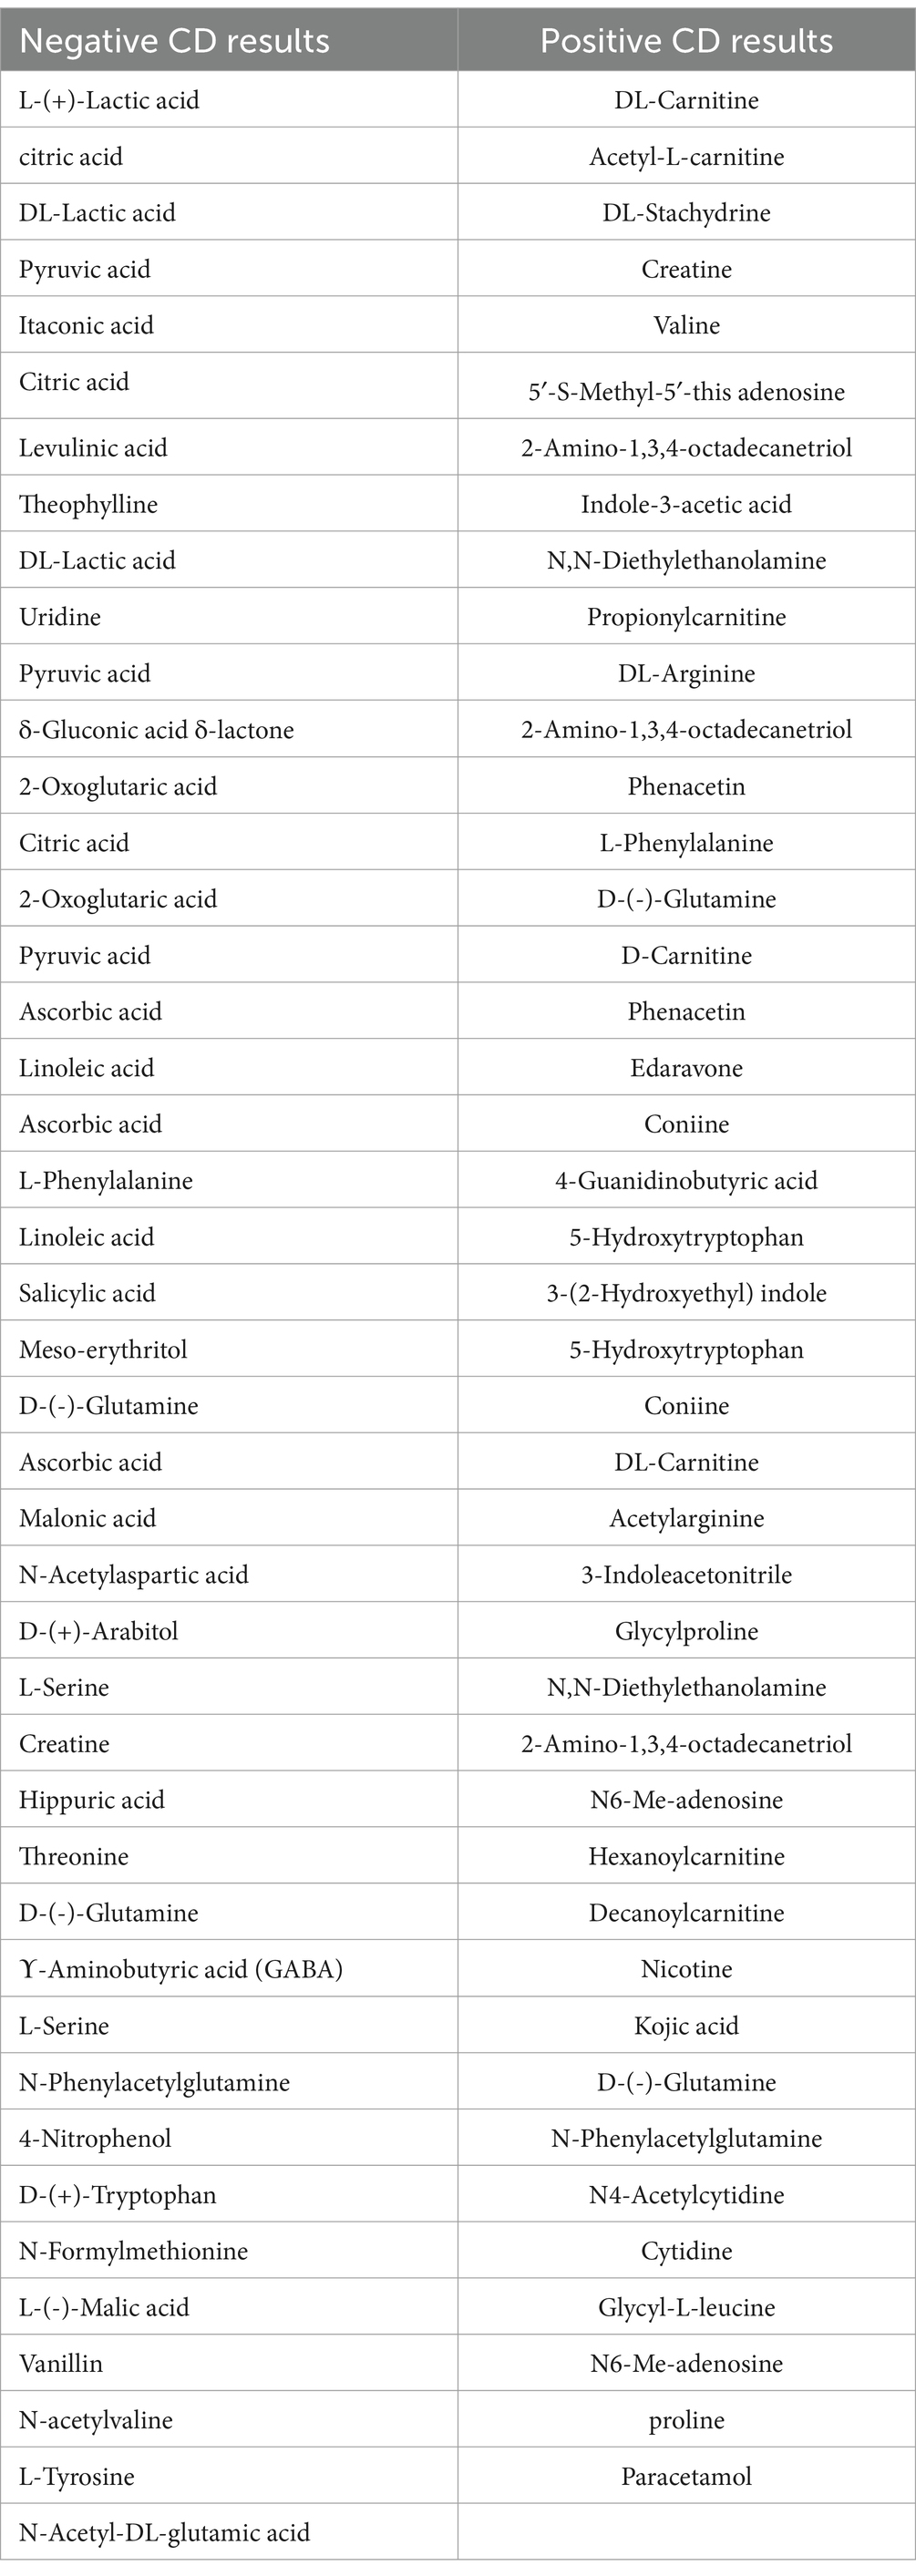
Table 2. Compound discover (CD) results for metabolites with exact matches.
The HMDB annotation results for metabolites are shown in Figure 1. Figures 1A,B show the HMDB annotation results for HMnC-vs.-CC differential metabolites. Differential metabolites mainly included organic acids and their derivatives, carboxylic acids and their derivatives, organic heterocyclic compounds, and organic oxygen compounds. Figures 1C,D show the HMDB annotation results for HMnC-vs.-HM differential metabolites. Differential metabolites mainly included four categories: organic oxygen compounds, carboxylic acids, and their derivatives, benzenes, and organic acids and their derivatives.
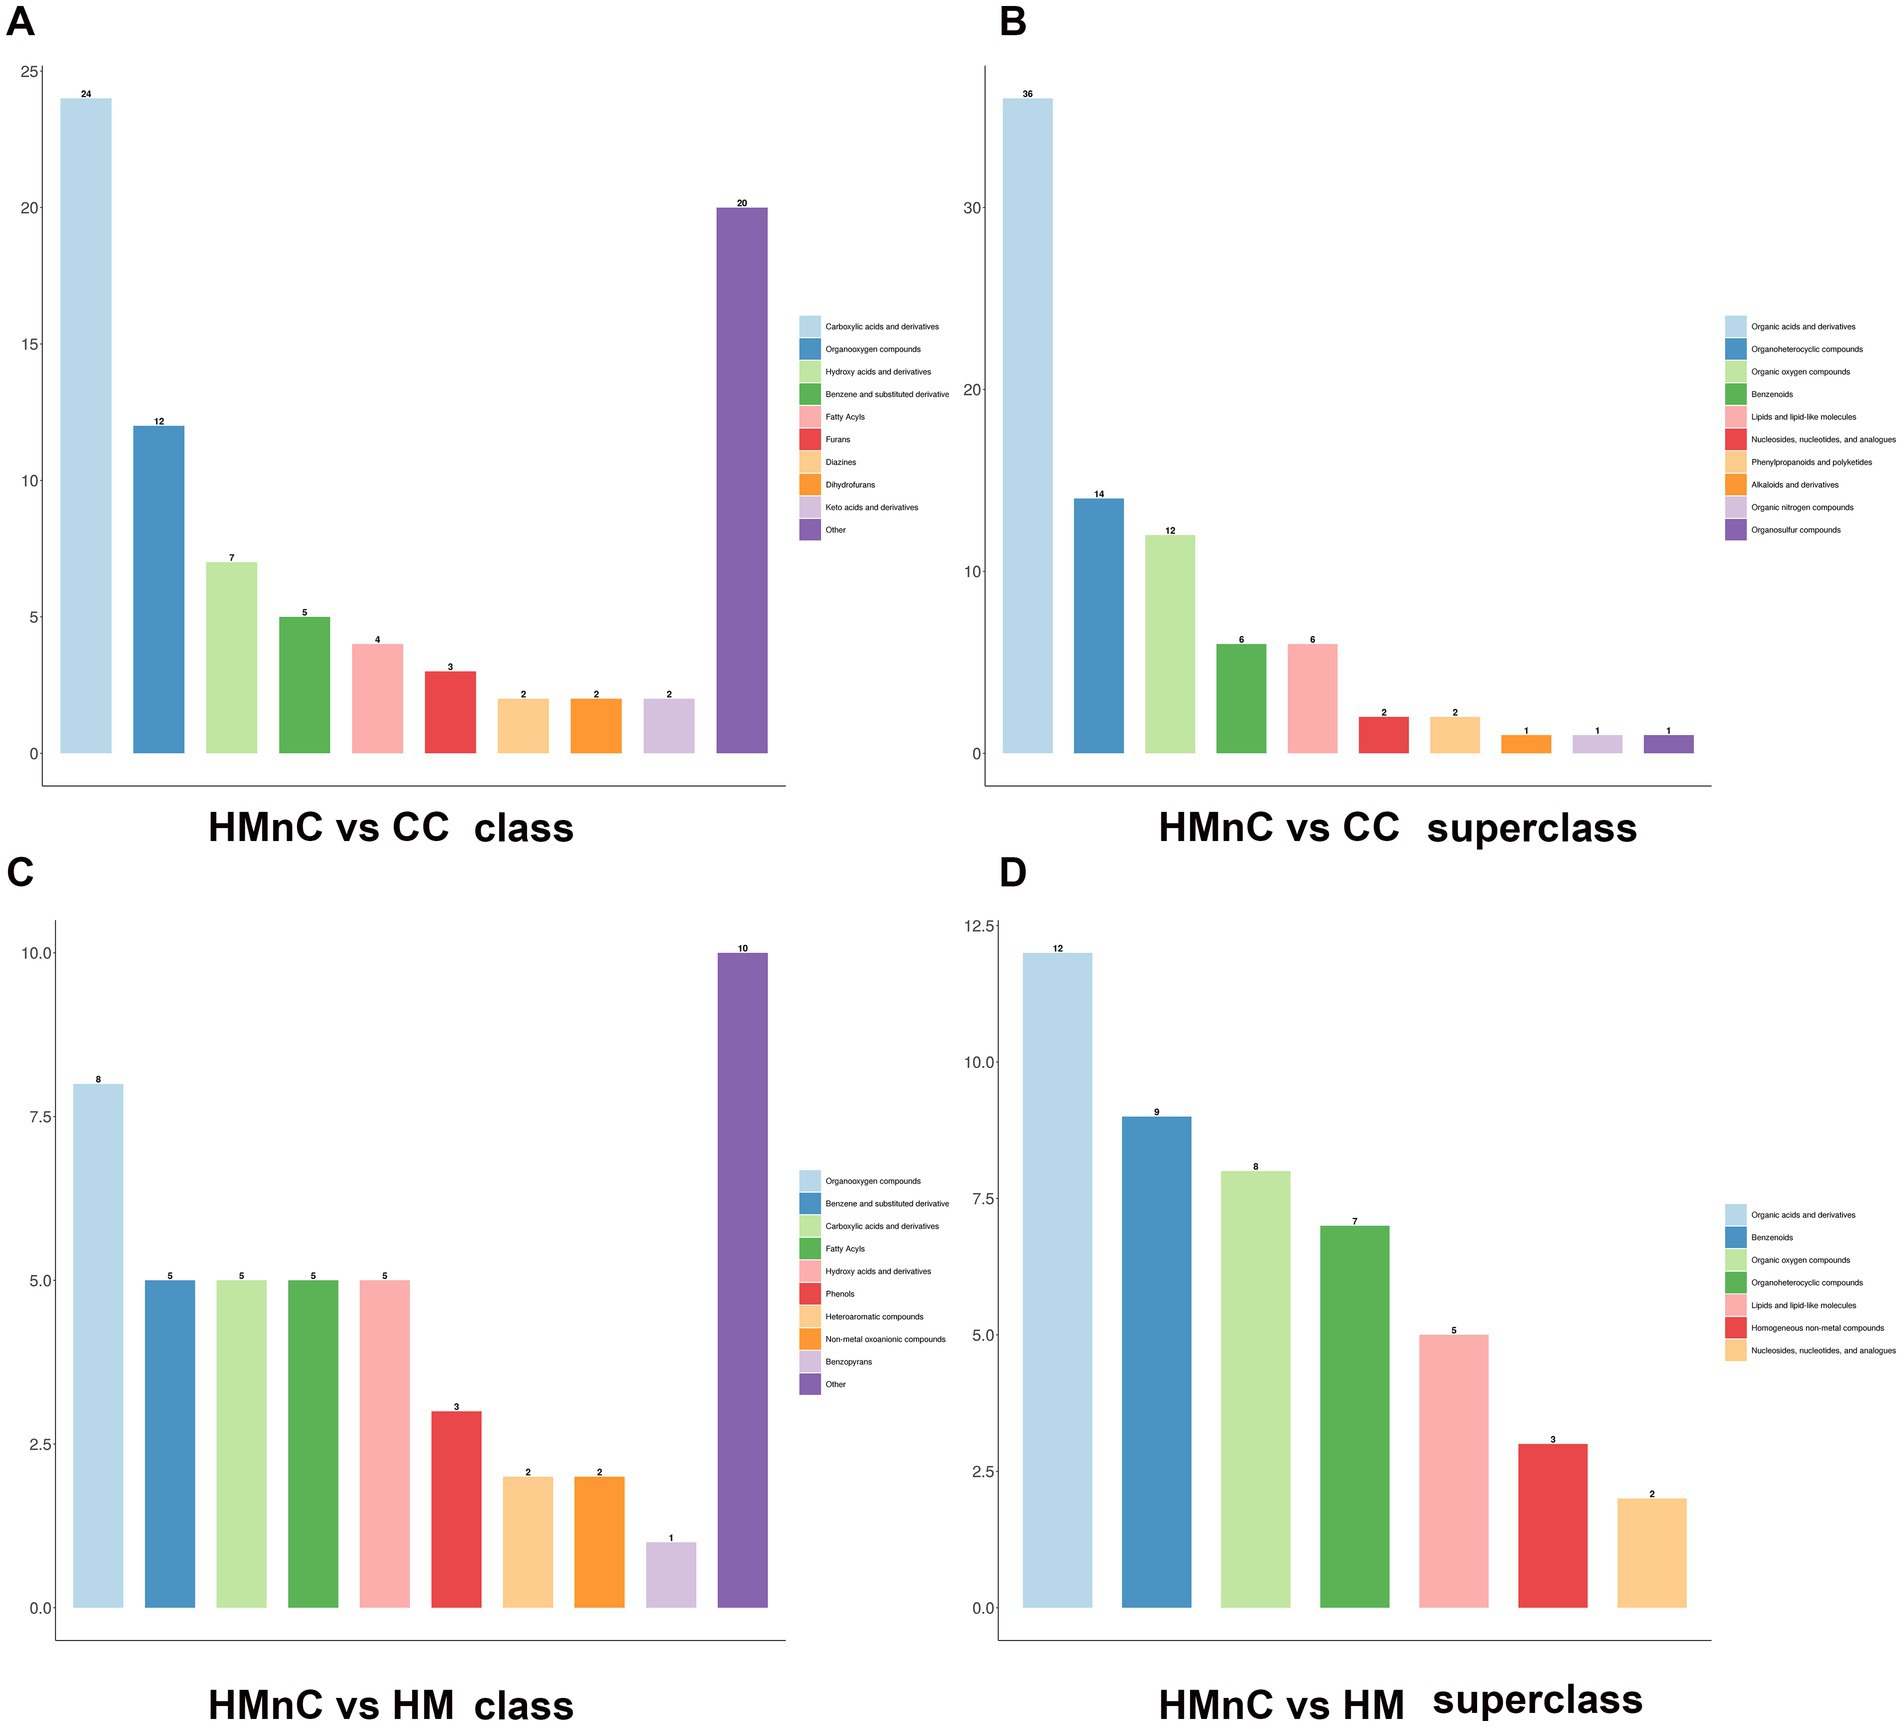
Figure 1. HMDB annotation results based on class and superclass modes were divided into 10 categories. Panels (A,B) show HMnC-vs-CC comparisons; panels (C,D) show HMnC-vs-HM comparisons.
3.3 Principal component analysis and OPLS-DA modeling
The samples were divided into four groups as shown in Figure 2A. Samples from patients with HMnC and patients with NC belonged to one group; samples from patients with CC and patients with HM were in other groups, respectively. The groups were separated by principal component analysis; PC1 showed that the HMnC group had a 31.7% difference from the HM group. PC2 showed that the CC group was separated from the other cataract groups (HMnC and NC); this component explained 9.2% of the difference. Figure 2B shows that there were apparent differences in metabolites among the groups. Finally, the HMnC and NC samples were clustered into one group, whereas the CC and HM samples were clustered into another group.
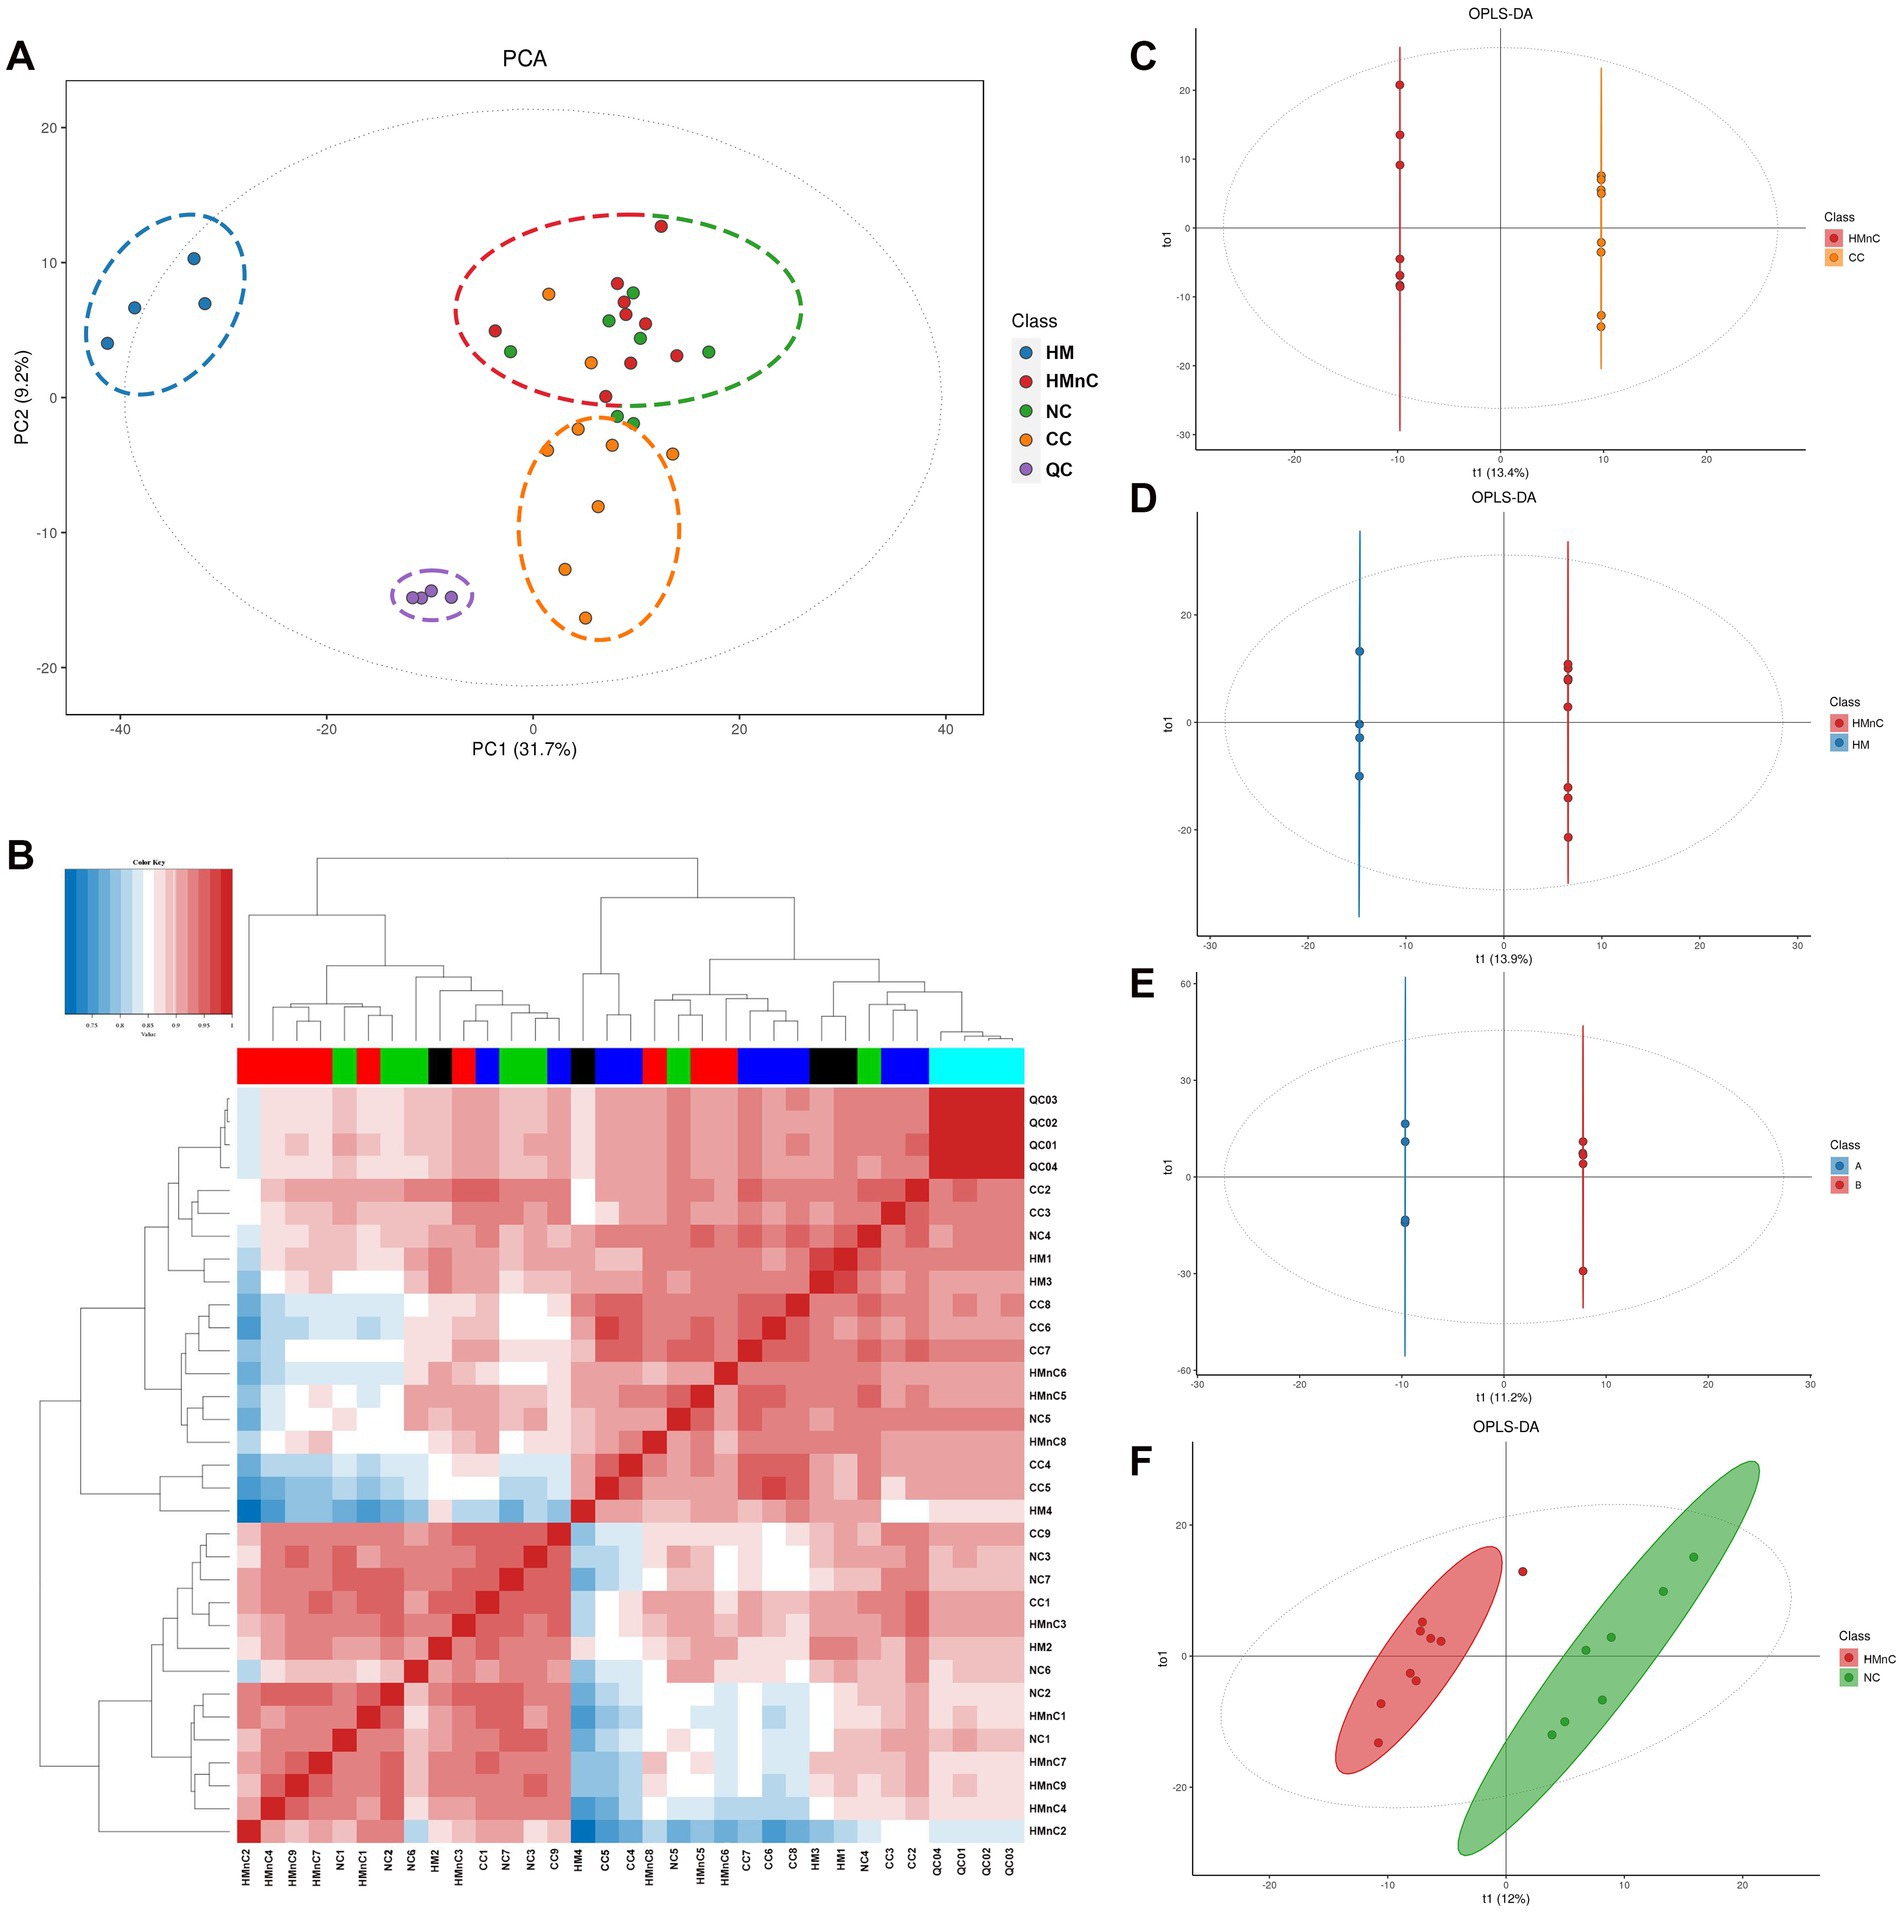
Figure 2. Panel (A) shows a principal component analysis scatter plot. Panel (B) shows a diagram of the correlation analysis between samples; the gradient from white to blue indicates a negative correlation, whereas the gradient from white to red indicates a positive correlation. Panels (C–F) show OPLS-DA modeling scatter plots that compare different groups. T1 represents the predicted principal component score of the first principal component; To1 represents the first orthogonal principal component score.
The modeling results obtained using OPLS-DA are shown in Supplementary Table S1. The HMnC group was used as the control group to conduct paired modeling with the HM, NC, and CC groups. Paired modeling was also performed between the HMnC A and HMnC B groups. Except for the comparison between HMnC and NC, the Q2 value for all group comparisons was >0.6, indicating that the constructed models were reliable. The OPLS-DA score plots (Figures 2C–F) indicated that clear separation occurred among the comparison groups.
3.4 Differential metabolite analysis
The numbers of metabolic differences are shown in Figure 3. The top 10 upregulated and downregulated differential metabolites are shown in Supplementary Table S2. Compared with CC samples, HMnC samples had 178 differential metabolites (114↑ and 64↓). The upregulated metabolites were guaiacol sulfate, glycerophosphoglycerol, and 2-oxovalericacid; the downregulated metabolites were 5-(2′-carboxyethyl)-4_6-dihydroxypicolinate, d-pipecolicacid, 2-3-4-5-tetrahydrodipicolinate (Supplementary Table S2-1). Compared with HM samples, HMnC samples had 376 differential metabolites (371 ↑ and 4 ↓). Tropicamide and N, N-diethylethanolamine were upregulated; lidocaine N-oxide and N′-hydroxy-4-pentylbenzenecarboximidamide were downregulated (Supplementary Table S2-2). Compared with NC, HMnC samples had 30 differential metabolites (19↑ and 11↓). Sebacic acid and 2-oxovalericacid were upregulated; etilevodopa, 4-phenyl butyric acid, and alpha-glutamyl-4-hydroxyproline were downregulated (Supplementary Table S2-3). Compared with HMnC B group samples, HMnC A group samples had 26 differential metabolites (7↑ and 19↓). p-cresolsulfatepotassium, (2S)-2-piperazinecarboxylic acid, and N-phenylacetylglutamine were upregulated; chorismate and 3_4-dihydroxymandelate were downregulated (Supplementary Table S2-4).
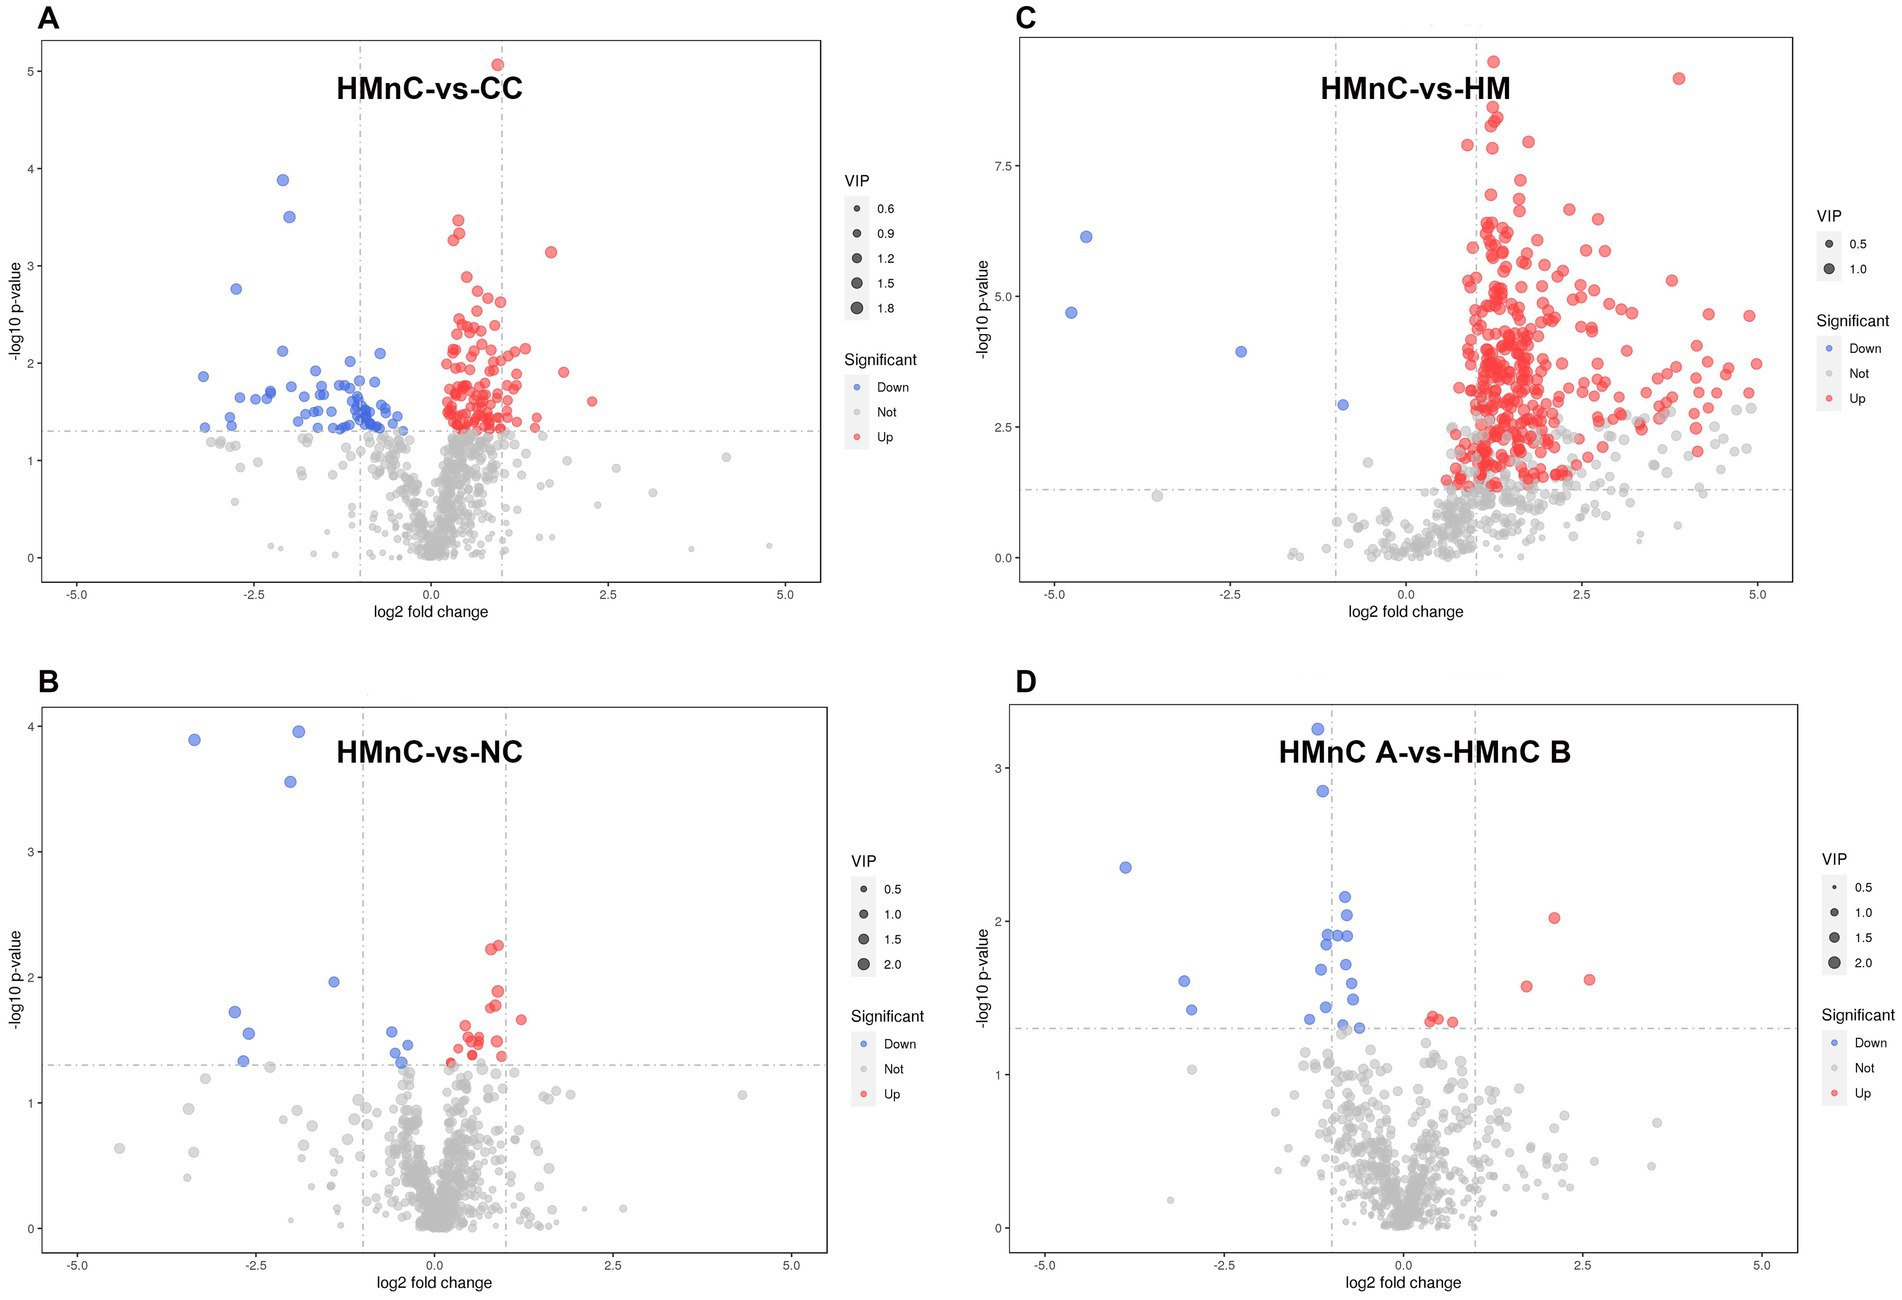
Figure 3. (A) HMnC-vs-CC, (B) HMnC-vs-NC, (C) HMnC-vs-HM, (D) A-vs-B. Each point in the volcano plot represents a metabolite; the horizontal axis represents the fold change for each substance in the group (base 2 logarithm), whereas the vertical axis represents the p-value from Student’s t-test (base 10 negative logarithm). The sizes of the scatter points represent VIP values in the OPLS-DA model; larger scatter points indicate a larger VIP value and greater compound importance. Scattered point colors represent the final screening results, with significantly upregulated metabolites in red, significantly downregulated metabolites in blue, and out-of-threshold metabolites in gray. The selection criteria were t-test p-value < 0.05 and VIP > 1.
3.5 Metabolic pathway annotation and enrichment analysis of differential metabolites
Figure 4A and Supplementary Table S3-1 show the top 10 annotated and enriched pathways of differential metabolites in HMnC samples vs. CC samples. These pathways include glutathione metabolism; chlorocyclohexane and chlorobenzene degradation; microbial metabolism in diverse environments; pentose phosphate pathway; purine metabolism; styrene degradation; chloroalkane and chloroalkene degradation; lysine biosynthesis; isoquinoline alkaloid biosynthesis; biofilm formation—Escherichia coli; the pathway with a statistically significant difference was hsa00480 glutathione metabolism (Supplementary Figure S1). Compared to the HMnC, glycine was a significantly upregulated metabolite, whereas ascorbic acid was downregulated in the CC samples.
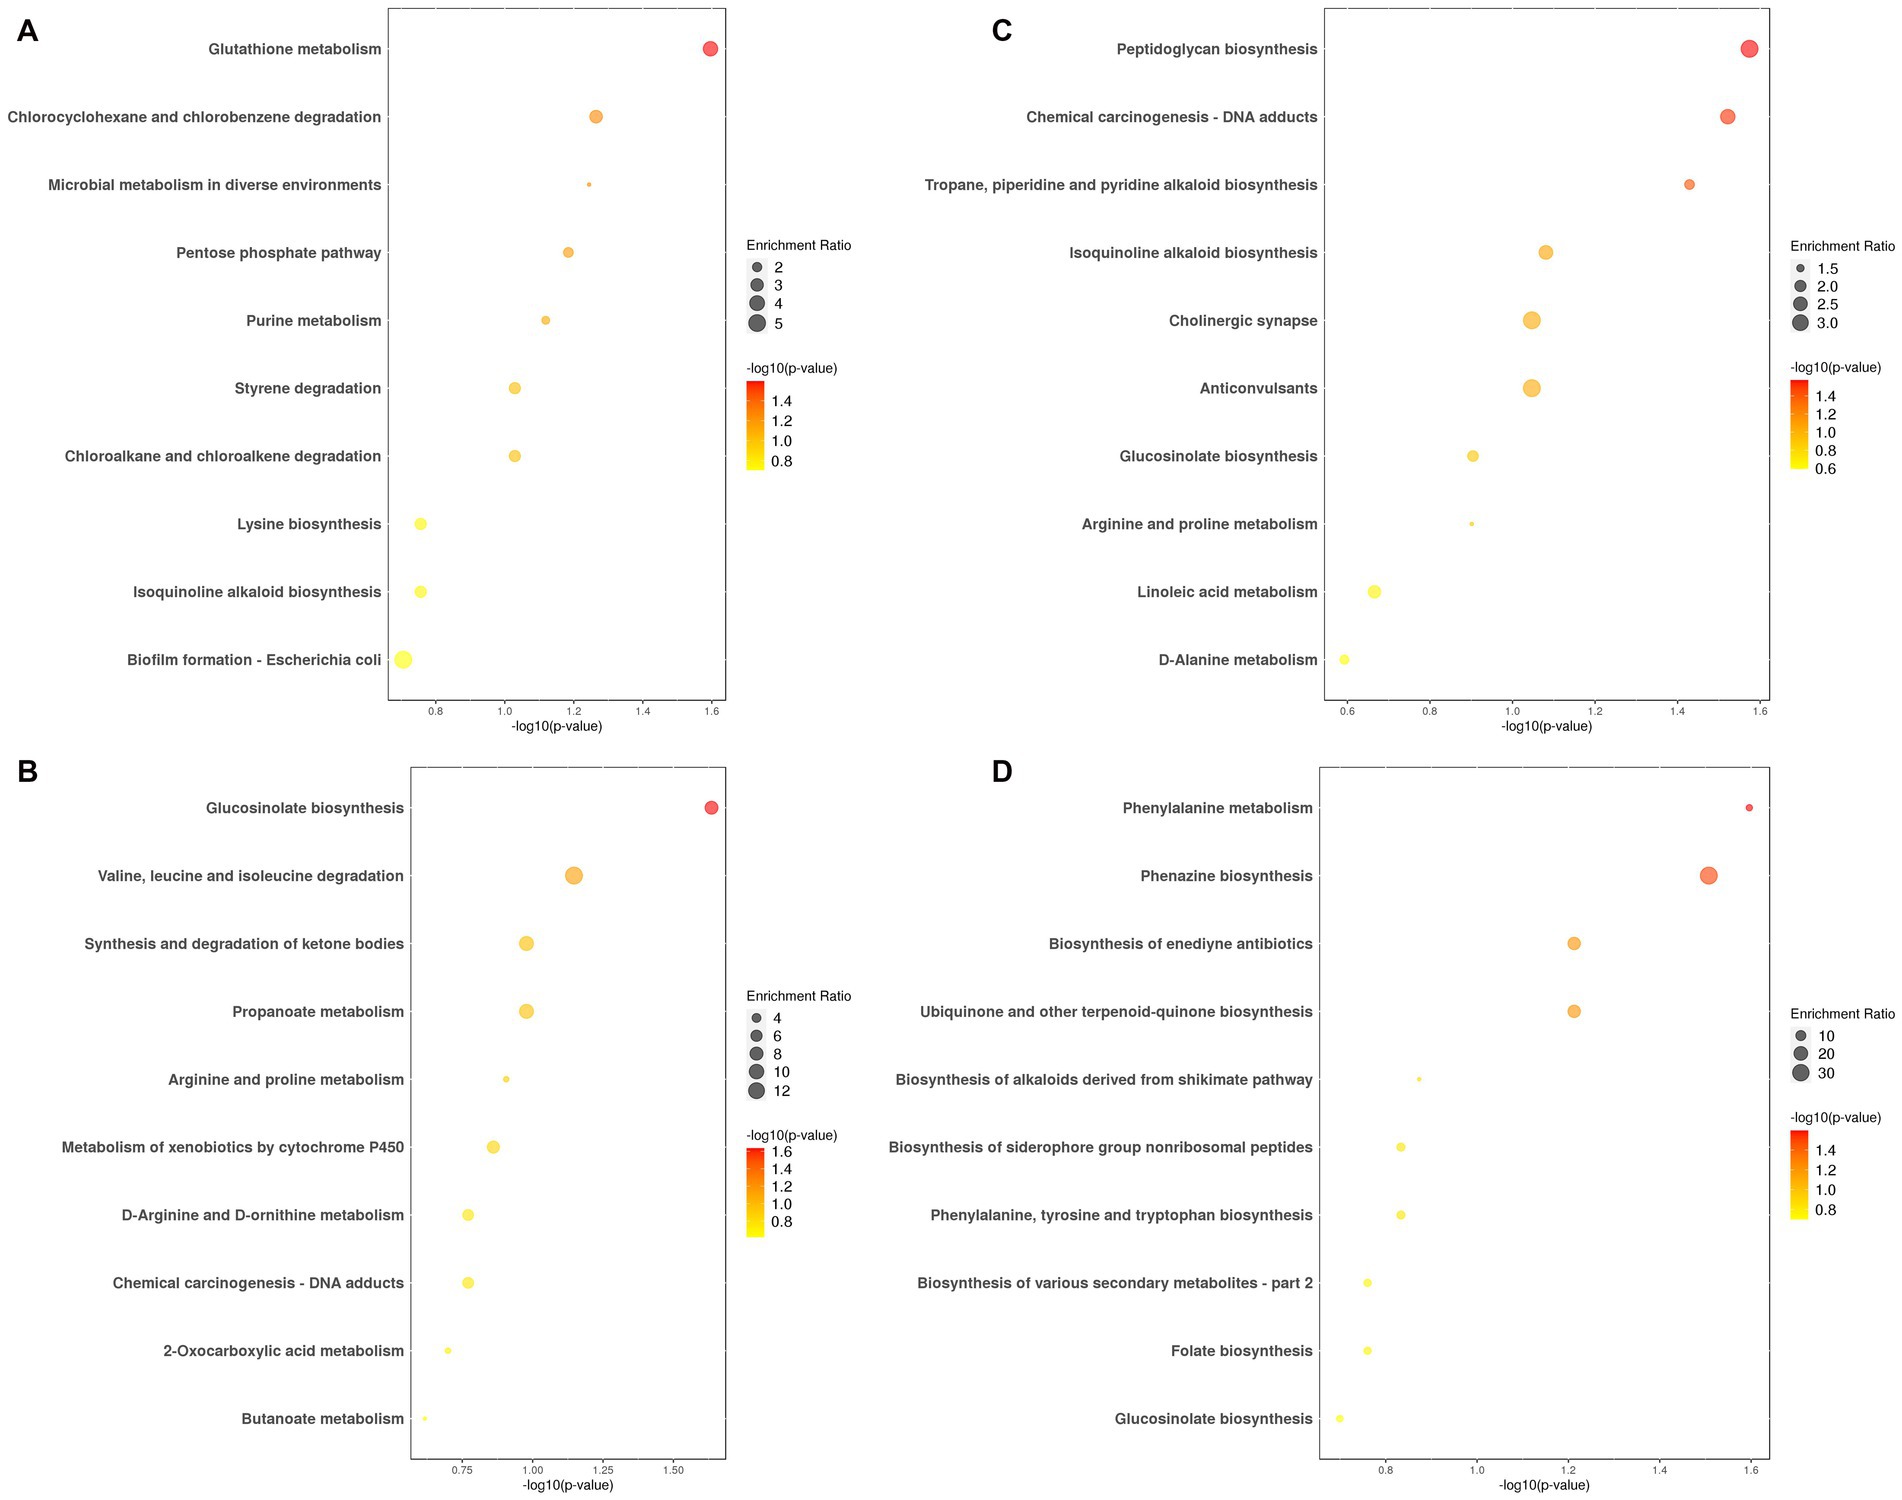
Figure 4. The top 10 annotated and enriched pathways of differential metabolites. (A) HMnC-vs-CC, (B) HMnC-vs-NC, (C) HMnC-vs-HM, (D) HMnC A-vs-HMnC B. Each point in the plot represents a pathway; the horizontal axis represents -log10 (p-value), whereas the vertical axis represents the pathway name. The sizes of the points represent enrichment ratio; larger points indicate a higher number of enriched genes. The point colors represent the significance of enrichment. The darker the color of the dot, the larger the value of -log10 (p-value). The selection criteria were t-test -log10 (p-value)> 1.3.
Figure 4B and Supplementary Table S3-2 show the top 10 annotated and enriched pathways for the differential metabolites in HMnC samples vs. NC samples. These pathways include glucosinolate biosynthesis; valine, leucine, and isoleucine degradation; propanoate metabolism; synthesis and degradation of ketone bodies; arginine and proline metabolism; metabolism of xenobiotics by cytochrome P450; chemical carcinogenesis—DNA adducts; D-arginine and D-ornithine metabolism; 2-oxocarboxylic acid metabolism and butanoate metabolism; the pathway with a statistically significant difference was map00966 glucosinolate biosynthesis (Supplementary Figure S2). Differential metabolites were located in the methionine metabolic pathways. Compared with HMnC samples, dihomomethionine and 8-Methylthiooctanaldoxime were downregulated in NC samples.
Figure 4C and Supplementary Table S3-3 show the top 10 annotated and enriched pathways for the differential metabolites in HMnC samples vs. HM samples. These pathways included peptidoglycan biosynthesis; chemical carcinogenesis_DNA adducts; tropane, piperidine, and pyridine alkaloid biosynthesis; isoquinoline alkaloid biosynthesis; cholinergic synapse; anticonvulsants; glucosinolate biosynthesis; arginine and proline metabolism; linoleic acid metabolism and D-alanine metabolism. Pathways with statistically significant differences included map00550 peptidoglycan biosynthesis, hsa05204 chemical carcinogenesis_DNA adducts, and map 00960 tropane, piperidine, and pyridine alkaloid biosynthesis (Supplementary Figure S3). The differential metabolite in map00550 is located in the amino sugar and nucleotide sugar metabolism. Compared with HMnC samples, the levels of D-alanyl-D-alanine is upregulated in HM samples. The differential metabolites in map00960 are located in the arginine and proline metabolic pathways and the phenylalamine, tyrosine, and tryptophan metabolic pathways. Compared with HMnC samples, the levels of 1-methylpyrrolinium, L-phenylalanine, ecgonine methyl ester, ecgonine, tropinone, and azacyclohexane were all upregulated in HM samples; the differential metabolite in hsa05204 is centered in N-nitroso compounds. Compared with HMnC samples, the levels of NNK-N-oxide, 3-succinoylpyridine; N-nitrosodimethylamine were upregulated in HM samples.
Figure 4D and Supplementary Table S3-4 show the top 10 annotated and enriched pathways for the differential metabolites in HMnC A group samples vs. HMnC B group samples. These pathways included phenylalanine metabolism; phenazine biosynthesis; biosynthesis of enediyne antibiotics; ubiquinone and other terpenoid-quinone biosynthesis; biosynthesis of alkaloids derived from the shikimate pathway; phenylalanine, tyrosine, and tryptophan biosynthesis; biosynthesis of siderophore group nonribosomal peptides; folate biosynthesis; biosynthesis of various secondary metabolites_part 2 and glucosinolate biosynthesis. Pathways with statistically significant differences included hsa00360 phenylalanine metabolism and map00405 phenazine biosynthesis (Supplementary Figure S4). We found differential metabolites in the phenylalanine biosynthesis and metabolism pathways. Compared with HMnC A group samples, N-acetyl-L-phenylalanine and phenylacetylglutamine were upregulated in HMnC B group samples, whereas chorisate was downregulated.
4 Discussion
Metabolomics is a powerful method for studying pathophysiological processes. Using HPLC-MS for metabolomics analysis allows for high sensitivity and resolution in detecting a wide range of metabolites in complex biological samples. The combination of mzCloud and ChemSpider databases enhances metabolite identification accuracy and efficiency, offering extensive spectral and chemical information that surpasses traditional databases. Many researches also used HPLC-MS, mzCloud, and ChemSpider databases for analysis (16–18). This integrated approach supports more reliable biomarker discovery and metabolic profiling in research. In our future studies, we also consider using other databases or methods for cross-validation to improve the reliability of the results. The KEGG database provides a systematically curated repository of canonical metabolic pathways, enzyme functions, and molecular networks, offering robust annotation capabilities. Previous researchers, Kanehisa et al. (19), also used KEGG databases for functional genomics and pathway-centric analyses. Cross-validation with alternative pathway databases (e.g., MetaCyc) represents a robust methodological strategy to enhance the reliability and biological plausibility of pathway annotations in untargeted metabolomics studies.
Cataract pathogenesis involves changes in lens protein expression (20) and amino acid structure (21); increased oxidative stress damage and changes in enzyme activity (22); epigenetic methylation of antioxidant genes (23), genetic mutations (24), and the intraocular inflammatory microenvironment activated after surgery (25). In this study, we found that glycine upregulation caused an increase in glutathione; the glutathione level was significantly lower in HMnC samples than in CC samples, suggesting that a decrease in the glutathione level might promote the occurrence of NC in patients with HM. Differentially phosphorylated sites have been associated with glutathione metabolism in patients with HM (26). Moreover, levels of glutathione reportedly differ according to cataract type, and glutathione rapidly decreases in patients with NC (27). Our findings were consistent with the results of previous studies concerning the glutathione level in the HMnC group.
Furthermore, we found that the levels of 1-methylpyrroline, L-phenylalanine, ecgonine methyl ester, ecgonine, tropinone, and piperidine were all upregulated in HM samples, compared with HMnC samples; these changes promoted the metabolism of the arginine, tyrosine, amino acid and tryptophan. Therefore, the levels of these amino acids were higher in the HMnC group. In a previous study, samples from patients with HM exhibited metabolite abundance and metabolic changes (8). The most abundant metabolites in AH from patients with HM were aminocaprylic acid, arginine, citrulline, and dihydrosphingosine (28). Distinct lens proteins are cross-linked by tryptophan and tyrosyl radicals in advanced NC lenses (29). A disturbance in tryptophan metabolism has been associated with cataract formation (30). Increases in tryptophan, tyrosine, carnitine, and glycerophosphate in the lenses of OXYS rats were attributed to a compensatory response to oxidative stress (31). Our research results were consistent with the previous findings about the higher levels of amino acids in the HMnC group.
The levels of cysteine-related metabolites exhibited the following pattern (from high to low): HM, HMnC B, HMnC A, and NC. Notably, these levels were positively correlated with axial length. In groups with longer axial length, the phenylalanine metabolic pathway was upregulated, whereas the synthetic pathway was downregulated. Homocysteine and methionine levels are higher in myopic rodent eyes than in normal rodent eyes (32). Decreased levels of dopamine and its metabolites, along with slower biosynthesis, were observed in a chick model of myopia, suggesting that retinal dopamine is involved in the regulation of eye axis growth (33). Feldkaemper hypothesized that dopamine constitutes a “stop” signal for axial growth (34). Form deprivation myopia and lens-induced myopia could be inhibited by topical application of levodopa (35, 36). The results of our study were consistent with the results of previous studies about the relationship between axial length and phenylalanine metabolic pathway.
This work had some limitations. First, we only recruited 29 eligible patients; this small sample size might have led to bias in the subgroup analysis. Second, although this study suggested that glutathione reduction could induce NC in HM, the metabolomic comparison of CC and NC lacked robust evidence. Third, model stability might have affected the experimental analysis. Considering the implications of our results, we are recruiting additional patients and collecting more detailed clinical data to validate our metabolomic findings.
5 Conclusion
Patients with HMnC had an AH metabolomic profile distinct from the profiles in patients with CC and patients with NC. Compared with patients with HM, arginine, tyrosine, and tryptophan levels were increased in AH samples from patients with HMnC. A decrease in glutathione might induce NC in patients with HM. The levels of methionine-related metabolites were positively correlated with eye axis growth, whereas the level of phenylalanine was negatively correlated with eye axis growth. Routine assessments of aqueous metabolomic profiles in patients undergoing posterior scleral reinforcement surgery may help to assess the risk of subsequent NC.
Data availability statement
The original contributions presented in the study are included in the article/Supplementary material, further inquiries can be directed to the corresponding authors.
Ethics statement
The studies involving humans were approved by Institutional Review Board of the Eye Hospital of Wenzhou Medical University. The studies were conducted in accordance with the local legislation and institutional requirements. The participants provided their written informed consent to participate in this study.
Author contributions
QH: Methodology, Writing – original draft. YX: Data curation, Writing – review & editing. YW: Conceptualization, Software, Writing – review & editing. SZ: Investigation, Writing – original draft. ZL: Methodology, Writing – original draft. JL: Supervision, Writing – review & editing.
Funding
The author(s) declare that financial support was received for the research and/or publication of this article. This research was funded by National Natural Science Foundation of China, Grant/Award Number: 81670840; Zhejiang Provincial Clinical Research Center for Pediatric Disease, Grant/Award Number: 2022E50003.
Conflict of interest
The authors declare that the research was conducted in the absence of any commercial or financial relationships that could be construed as a potential conflict of interest.
The reviewer JY declared a shared affiliation with the author QH to the handling editor at the time of review.
Publisher’s note
All claims expressed in this article are solely those of the authors and do not necessarily represent those of their affiliated organizations, or those of the publisher, the editors and the reviewers. Any product that may be evaluated in this article, or claim that may be made by its manufacturer, is not guaranteed or endorsed by the publisher.
Supplementary material
The Supplementary material for this article can be found online at: https://www.frontiersin.org/articles/10.3389/fmed.2025.1454840/full#supplementary-material
Footnotes
References
1. Holden, BA, Fricke, TR, Wilson, DA, Jong, M, Naidoo, KS, Sankaridurg, P, et al. Global prevalence of myopia and high myopia and temporal trends from 2000 through 2050. Ophthalmology. (2016) 123:1036–42. doi: 10.1016/j.ophtha.2016.01.006
2. Perkins, ES. Cataract: refractive error, diabetes, and morphology. Br J Ophthalmol. (1984) 68:293–7. doi: 10.1136/bjo.68.5.293
3. Ma, S, Zhu, X, Li, D, Yang, F, Meng, J, Jiang, Y, et al. (2022) The potential role of circular RNAs in high-myopic cataract suggested by whole transcriptome sequencing. SSRN Electron J. Available online at: https://ssrn.com/abstract=4139241
4. Rinschen, MM, Ivanisevic, J, Giera, M, and Siuzdak, G. Identification of bioactive metabolites using activity metabolomics. Nat Rev Mol Cell Biol. (2019) 20:353–67. doi: 10.1038/s41580-019-0108-4
5. Schmidt, DR, Patel, R, Kirsch, DG, Lewis, CA, Vander Heiden, MG, and Locasale, JW. Metabolomics in cancer research and emerging applications in clinical oncology. CA Cancer J Clin. (2021) 71:333–58. doi: 10.3322/caac.21670
6. Costa Dos Santos, G Jr, Renovato-Martins, M, and de Brito, NM. The remodel of the “central dogma”: a metabolomics interaction perspective. Metabolomics. (2021) 17:48. doi: 10.1007/s11306-021-01800-8
7. Guijas, C, Montenegro-Burke, JR, Warth, B, Spilker, ME, and Siuzdak, G. Metabolomics activity screening for identifying metabolites that modulate phenotype. Nat Biotechnol. (2018) 36:316–20. doi: 10.1038/nbt.4101
8. Ji, Y, Rao, J, Rong, X, Lou, S, Zheng, Z, and Lu, Y. Metabolic characterization of human aqueous humor in relation to high myopia. Exp Eye Res. (2017) 159:147–55. doi: 10.1016/j.exer.2017.03.004
9. Borrás, T. The cellular and molecular biology of the iris, an overlooked tissue: the iris and pseudoexfoliation glaucoma. J Glaucoma. (2014) 23:S39–42. doi: 10.1097/IJG.0000000000000104
10. Chen, X, Chen, Y, Wang, L, and Sun, X. Metabolomics of the aqueous humor in patients with primary congenital glaucoma. Mol Vis. (2019) 25:489.
11. Wei, P, He, M, Teng, H, and Han, G. Metabolomic analysis of the aqueous humor from patients with central retinal vein occlusion using UHPLC-MS/MS. J Pharm Biomed Anal. (2020) 188:113448. doi: 10.1016/j.jpba.2020.113448
12. Jin, H, Zhu, B, Liu, X, Jin, J, and Zou, H. Metabolic characterization of diabetic retinopathy: an 1H-NMR-based metabolomic approach using human aqueous humor. J Pharm Biomed Anal. (2019) 174:414–21. doi: 10.1016/j.jpba.2019.06.013
13. Cheng, H, Kane, JX, Liu, L, Li, J, Cheng, B, and Wu, M. Refractive predictability using the IOLMaster 700 and artificial intelligence-based IOL power formulas compared to standard formulas. J Refract Surg. (2020) 36:466–72. doi: 10.3928/1081597X-20200514-02
14. Darcy, K, Gunn, D, Tavassoli, S, Sparrow, J, and Kane, JX. Assessment of the accuracy of new and updated intraocular lens power calculation formulas in 10,930 eyes from the UK National Health Service. J Cataract Refract Surg. (2020) 46:2–7. doi: 10.1016/j.jcrs.2019.08.014
15. Szalai, E, Toth, N, Kolkedi, Z, Varga, C, and Csutak, A. Comparison of various intraocular lens formulas using a new high-resolution swept-source optical coherence tomographer. J Cataract Refract Surg. (2020) 46:1138–41. doi: 10.1097/j.jcrs.0000000000000329
16. Guan, H, Li, P, Wang, Q, Zeng, F, Wang, D, Zhou, M, et al. Systematically exploring the chemical ingredients and absorbed constituents of Polygonum capitatum in hyperuricemia rat plasma using UHPLC-Q-Orbitrap HRMS. Molecules. (2022) 27:3521. doi: 10.3390/molecules27113521
17. Ribbenstedt, A, Ziarrusta, H, and Benskin, JP. Development, characterization and comparisons of targeted and non-targeted metabolomics methods. PLoS One. (2018) 13:e0207082. doi: 10.1371/journal.pone.0207082
18. Tominari, T, Takatoya, M, Matsubara, T, Matsunobe, M, Arai, D, Matsumoto, C, et al. Establishment of a triple quadrupole HPLC-MS quantitation method for dystrophin protein in mouse and human skeletal muscle. Int J Mol Sci. (2023) 25:303. doi: 10.3390/ijms25010303
19. Kanehisa, M, Sato, Y, Kawashima, M, Furumichi, M, and Tanabe, M. KEGG as a reference resource for gene and protein annotation. Nucleic Acids Res. (2016) 44:D457–62. doi: 10.1093/nar/gkv1070
20. Yousefi, R. Crystallins as important pathogenic targets for accumulation of structural damages resulting in protein aggregation and cataract development: introduction to this special issue of biochemistry (Moscow). Biochemistry. (2022) 87:87–90. doi: 10.1134/S0006297922020018
21. Xu, W, Xu, J, Shi, C, Wu, J, Wang, H, Wu, W, et al. A novel cataract-causing mutation Ile82Met of γA crystallin trends to aggregate with unfolding intermediate. Int J Biol Macromol. (2022) 211:357–67. doi: 10.1016/j.ijbiomac.2022.04.205
22. Quan, Y, Du, Y, Tong, Y, Gu, S, and Jiang, JX. Connexin gap junctions and hemichannels in modulating lens redox homeostasis and oxidative stress in cataractogenesis. Antioxidants. (2021) 10:1374. doi: 10.3390/antiox10091374
23. Zhu, X, Li, D, Du, Y, He, W, and Lu, Y. DNA hypermethylation-mediated downregulation of antioxidant genes contributes to the early onset of cataracts in highly myopic eyes. Redox Biol. (2018) 19:179–89. doi: 10.1016/j.redox.2018.08.012
24. Yu, Y, Qiao, Y, Ye, Y, Li, J, and Yao, K. Identification and characterization of six β-crystallin gene mutations associated with congenital cataract in Chinese families. Mol Genet Genomic Med. (2021) 9:e1617. doi: 10.1002/mgg3.1617
25. Song, P, Li, P, Geng, W, Qin, M, Su, S, Zhou, T, et al. Cytokines possibly involved in idiopathic epiretinal membrane progression after uncomplicated cataract surgery. Exp Eye Res. (2022) 217:108957. doi: 10.1016/j.exer.2022.108957
26. Zhang, S, Zhang, K, He, W, Lu, Y, and Zhu, X. Quantitative phosphoproteomic comparison of lens proteins in highly myopic cataract and age-related cataract. Biomed Res Int. (2021) 2021:6668845. doi: 10.1155/2021/6668845
27. Pau, H, Graf, P, and Sies, H. Glutathione levels in human lens: regional distribution in different forms of cataract. Exp Eye Res. (1990) 50:17–20. doi: 10.1016/0014-4835(90)90005-F
28. Barbas-Bernardos, C, Armitage, EG, García, A, Mérida, S, Navea, A, Bosch-Morell, F, et al. Looking into aqueous humor through metabolomics spectacles—exploring its metabolic characteristics in relation to myopia. J Pharm Biomed Anal. (2016) 127:18–25. doi: 10.1016/j.jpba.2016.03.032
29. Paviani, V, Junqueira de Melo, P, Avakin, A, Di Mascio, P, Ronsein, GE, and Augusto, O. Human cataractous lenses contain cross-links produced by crystallin-derived tryptophanyl and tyrosyl radicals. Free Radic Biol Med. (2020) 160:356–67. doi: 10.1016/j.freeradbiomed.2020.08.020
30. Dmuchowska, DA, Pietrowska, K, Krasnicki, P, Kowalczyk, T, Misiura, M, Grochowski, ET, et al. Metabolomics reveals differences in aqueous humor composition in patients with and without pseudoexfoliation syndrome. Front Mol Biosci. (2021) 8:682600. doi: 10.3389/fmolb.2021.682600
31. Luo, Y, Cui, H-P, Liu, Y, and Chen, L. Metabolomics and biomarkers in ocular matrix: beyond ocular diseases. Int J Ophthalmol. (2020) 13:991–1003. doi: 10.18240/ijo.2020.06.21
32. Hsi, E, Wang, YS, Huang, CW, Yu, ML, Juo, SH, and Liang, CL. Genome-wide DNA hypermethylation and homocysteine increase a risk for myopia. Int J Ophthalmol. (2019) 12:38–45. doi: 10.18240/ijo.2019.01.06
33. Stone, RA, Lin, T, Laties, AM, and Iuvone, PM. Retinal dopamine and form-deprivation myopia. Proc Natl Acad Sci USA. (1989) 86:704–6. doi: 10.1073/pnas.86.2.704
34. Brown, DM, Mazade, R, Clarkson-Townsend, D, Hogan, K, Datta Roy, PM, and Pardue, MT. Candidate pathways for retina to scleral signaling in refractive eye growth. Exp Eye Res. (2022) 219:109071. doi: 10.1016/j.exer.2022.109071
35. Thomson, K, Morgan, I, Karouta, C, and Ashby, R. Levodopa inhibits the development of lens-induced myopia in chicks. Sci Rep. (2020) 10:13242. doi: 10.1038/s41598-020-70271-z
Keywords: high-myopia complicated nuclear cataract, aqueous humor, HPLC-MS, metabolites, enrichment analysis
Citation: Huo Q, Xu Y, Wang Y, Zhang S, Liu Z and Li J (2025) Metabolomics analysis of aqueous humor from patients with high-myopia complicated nuclear cataract. Front. Med. 12:1454840. doi: 10.3389/fmed.2025.1454840
Edited by:
Ryoji Yanai, Tokushima University, JapanReviewed by:
Juan Sanchez Naves, Opthalmedic and I.P.O., SpainJun Zhu, Yangzhou University, China
Jin Yang, Fudan University, China
Copyright © 2025 Huo, Xu, Wang, Zhang, Liu and Li. This is an open-access article distributed under the terms of the Creative Commons Attribution License (CC BY). The use, distribution or reproduction in other forums is permitted, provided the original author(s) and the copyright owner(s) are credited and that the original publication in this journal is cited, in accordance with accepted academic practice. No use, distribution or reproduction is permitted which does not comply with these terms.
*Correspondence: Zhexuan Liu, MTI5NDE4MDc0MUBxcS5jb20=; Jin Li, bGlqaW5fd3pAZXllLmFjLmNu
†These authors have contributed equally to this work and share first authorship