 Yauhen Statsenko1,2,3*
 Darya Smetanina2
 Roman Voitetskii1
 Gillian Lylian Simiyu2
 Mikalai Pazniak4
 Elena Likhorad4
 Aleh Pazniak4
 Pavel Beliakouski4*
 Dmitri Abelski4
 Fatima Ismail5
 Klaus Neidl-Van Gorkom2
 Milos Ljubisavljevic6,7
- 1Medical Imaging Platform, ASPIRE Precision Medicine Research Institute Abu Dhabi, Al Ain, United Arab Emirates
- 2Department of Radiology, College of Medicine and Health Sciences, United Arab Emirates University, Al Ain, United Arab Emirates
- 3Big Data Analytics Center, United Arab Emirates University, Al Ain, United Arab Emirates
- 4Microsurgery Department, Eye Microsurgery Center “Voka”, Minsk, Belarus
- 5Department of Pediatrics, College of Medicine and Health Sciences, United Arab Emirates University, Al Ain, United Arab Emirates
- 6Department of Physiology, College of Medicine and Health Sciences, United Arab Emirates University, Al Ain, United Arab Emirates
- 7Neuroscience Platform, ASPIRE Precision Medicine Research Institute Abu Dhabi, Al Ain, United Arab Emirates
Background: Structural outcomes of corneal collagen cross-linking (CXL) have not been thoroughly investigated. Clinical risk assessment would benefit from a reliable prognosis of postoperative minimal (MCT) and central corneal thickness (CCT).
Objective: The objective of this study was to find a combination of diagnostic modalities and measurements that reliably reflect CXL efficiency in terms of corneal thickness.
Methods: We retrospectively reviewed the medical histories of 107 patients (131 eyes) who underwent CXL. The dataset included preoperative examinations and follow-up results, which totalled 796 observations.
Results: The postoperative changes in MCT are more pronounced, clinically relevant, and meaningful than in CCT. MCT should serve as the major clinical marker of corneal thinning after CXL. The cornea's potential to recover reduces in advanced keratoconus. A polynomial curve demonstrates the natural course of corneal remodeling. It includes thinning immediately after CXL and stabilization with partial recovery of corneal thickness over time. Baseline pachymetry data can adequately reflect the outcomes. Preoperative BAD and topographic indices strongly correlate with the outcomes. Keratometry and refractometry data exhibit moderate associations with postoperative corneal thickness. The models trained on a combination of top correlating features, clinical data, and time after intervention provide the most reliable prognosis.
Conclusion: Risk assessment is accurate with multimodal preoperative diagnostics. A stratification system should take into account findings in different diagnostic modalities.
1 Introduction
Keratoconus (KC) is an ectatic corneal disorder leading to visual impairment. KC usually presents in the second or third decade of life with a global prevalence of 138 per 100,000 people (1, 2). The etiology remains unclear: A combination of genetic, biomechanical, and environmental factors may account for disease occurrence (3). KC risk factors include frequent eye rubbing, allergic reactions, and permanent ultraviolet radiation exposure (4). In early stages, the pathology is asymptomatic (5). Corneal topography is a screening technique aimed at promoting early treatment before irregular astigmatism, myopia, and corneal scarring develop (6–8).
Currently, corneal collagen cross-linking (CXL) is the most effective method to halt KC progression by rejuvenating collagen fibril molecules. As a result, KC remains firm for up to 28 years. Although CXL may damage endothelial cells and injure nerves (9), the procedure prevents the severe KC stages that would require corneal transplantation (keratoplasty) (10). Despite a high graft survival rate (90.4%), the method has limitations and side effects (11, 12). Treatment response varies among patients; therefore, risk assessment will enable the delivery of individualized medical care.
Herein, we critically appraise clinical evaluation, pachymetry, visiometry, refractometry, and topography tests for assessing KC progression after the treatment. An ophthalmic examination includes a comprehensive series of tests that indicate the optimal timing of CXL (13). Since KC causes corneal thinning and protrusion, pachymetry readings may help to forecast CXL effectiveness (14). According to recent studies, corneal thickness decreases rapidly within 3 months after CXL and restores to the baseline level within a year (15). Little extension between the outer and inner surfaces of the cornea leads to favorable outcomes (16).
Maximum curvature value (Kmax) is a strong predictor of disease progression and effectiveness of CXL. The smaller the preoperative Kmax is, the more successful the intervention will be (17, 18). The results in the best-corrected visual acuity (BCVA) test also reflect the efficacy of CXL. Recent studies have tried to identify the most accurate predictors of disease progression and patients' responses to interventions. However, they considered a limited number of parameters. To overcome this limitation, we initiated the current project.
2 Objectives
The aim of the current study is to find and set up a combination of diagnostic modalities and measurements that reliably reflect CXL efficiency. Hypothetically, risk assessment is more accurate with multimodal preoperative diagnostics than unimodal. If this is the case, a risk stratification system should take into account different diagnostic modalities to predict the efficiency of treatment. Alternatively, the study should highlight a diagnostic modality most strongly correlated with treatment outcomes. Knowledge of this modality will allow us to create the desired unimodal risk assessment tool.
The following study adopts the current trend of introducing machine learning (ML) into clinical practice. The predictive ML models foster further development of precision medicine by identifying optimal therapy and individualizing treatment options. In addition to creating models, we want to help ophthalmologists interpret various instrumental findings together with clinicodemographic data. For this, our study will explore the value of keratometry, pachymetry, visiometry, refractometry, and topography tests. These data will help provide a more explicit informative value of the tests, which, in turn, will help improve clinician decision-making.
To achieve the study aim, we formulated and fulfilled the following tasks:
1. Assess the relationships between pre- and postoperative pachymetry findings.
2. Examine the association of CXL outcomes with the results in keratometry, visiometry, refractometry, topography tests, and clinical examination.
3. Model the dynamics in the central corneal thickness (CCT) and minimal corneal thickness (MCT) after CXL for KC.
4. Identify top-informative features of CXL effectiveness in KC care.
3 Materials and methods
3.1 Study cohort
The KC prevalence largely varies among different populations; therefore, estimating the minimal sample size was challenging. To decide on the number of patients required for the current research, we analyzed recently published reports on CXL outcomes. The number of cases in the original studies depends on the study design, objectives, and resources. Often, pilot studies or preliminary reports assess the safety or explore the initial efficacy of CXL in a small group of patients, from 10 to 30 cases (19–26). Single-center clinical studies typically evaluate outcomes such as corneal stabilization, visual acuity improvement, or changes in keratometry values in a specific patient population of 2–100 (27–30). To provide more robust evidence on the safety, efficacy, and long-term outcomes, multicenter studies and comparative clinical trials include diverse patient populations and may compare different CXL techniques in a large cohort of patients: from 100 to 500 cases (31–33).
We retrospectively reviewed the medical histories of 107 KC patients (131 eyes) who underwent CXL in the medical center “Voka” from January 2018 to December 2022. The study included male and female patients of all ages with a history of KC treated with CXL. Exclusion criteria were age under 16 years, corneal thickness below 400 microns, severe dry eye, other corneal diseases or infections, prior re-CXL, pregnancy, and missing follow-up examinations. We also excluded cases with advanced KC stages, cicatricial corneal changes observed during biomicroscopy, and autoimmune diseases in decompensation. Physicians examined each patient one time before and several times after the intervention. The examination included slit-lamp biomicroscopy, pachymetry, keratometry, and computerized corneal topography tests.
The final dataset contained the results of preoperative examinations and follow-ups, which totalled 796 observations. Males outnumbered females: 79 vs. 28 (73.8% vs. 26.2%). The average age was roughly equal in both sexes: 29 ± 9 vs 29 ± 7 years, respectively. The studied cases had different severity. Our study included patients with subclinical KC (1 case, 0.76%) and those with KC stages 1 through 3-4. Stage 3 KC was observed in approximately one-third of the patients (41 cases, 31.2%), while nearly half had stage 2 or 2-3 KC (30 cases, 22.9%, and 27 cases, 20.61%, respectively). The most severe cases in our cohort were classified as stage 3–4 KC (13 cases, 9.92%).
3.1.1 Diagnostics of keratoconus
In this study, physicians adopted the following primary diagnostic criteria for keratoconus: an elevated corneal curvature with a Kmax value exceeding 47.0 D, asymmetric astigmatism (a difference of more than 3.0 D in the curvatures of the anterior corneal surface between the two principal meridians), corneal thinning at the site of the cone-shaped protrusion less than 490 μm, and BCVA worse than 20/20 (1.0).
To diagnose KC, our team identified where the typically dome-shaped cornea protrudes outward, forming a cone. During corneal topography tests, we searched for specific topographic patterns indicative of KC. These patterns include localized steepening of the cornea in the mid-peripheral region below the corneal midline (34), an asymmetric bow tie pattern with a skewed radial axis (35), a pear-shaped distortion of the central keratoscopy rings with initial steepening in the temporal quadrant (36), and irregular astigmatism with uneven keratoscopy mires.
Recent research has identified keratometry indices as the most reliable parameters for distinguishing between healthy eyes and KC cases (37). Key features of KC include anterior surface elevation readings greater than 12 μm and posterior surface elevation readings exceeding 20 μm in the central cornea.
For borderline cases, the following findings raised suspicion of KC: anterior surface elevation between 6 and 12 μm, posterior surface elevation ranging from 8 to 20 μm, and a KC index (KI) greater than 1.07 (38, 39). A central keratoconus index (CKI) greater than 1.03 served as a diagnostic criterion for definite KC, though not for its subclinical form (40, 41). Pachymetry tests were also used to support the KC diagnosis. An average pachymetric progression index exceeding 1.6 indicated definite KC (39), while a minimal pachymetry value below 450 μm signaled corneal thinning associated with the disease.
Although not part of our study, physicians can evaluate posterior elevation as a reliable diagnostic marker for KC. A maximal elevation difference greater than 12 μm suggests subclinical pathology, while a difference exceeding 16 μm is diagnostic for KC (42). The optimal method for measuring posterior elevation remains debated. The standard approach analyzes the maximum value above the best-fit sphere within the central 5 mm of the posterior cornea (43). For greater accuracy, some researchers recommend measuring posterior elevation at the thinnest point of the cornea (44, 45). While posterior elevation is a valuable diagnostic tool, physicians should not use it in isolation to identify subclinical or clinical KC cases.
3.1.2 Stages of keratoconus
To assess the severity of KC, we followed the classification system originally proposed by M. Amsler in 1938 and later revised by Krumeich in 1998 (46, 47). However, certain cases proved challenging to categorize as different diagnostic parameters often correspond to different stages of the disease. In these instances, we utilized the ABCD grading system, which addresses the shortcomings of the Amsler-Krumeich classification. Specifically, the older system does not incorporate posterior elevation data or visual acuity, relies on apical corneal thickness rather than the thinnest corneal point, and struggles to distinguish between normal and abnormal cases effectively (48, 49). By employing the ABCD system alongside slit-lamp biomicroscopy findings, we overcame these limitations and evaluated cases more accurately (see Table 1).
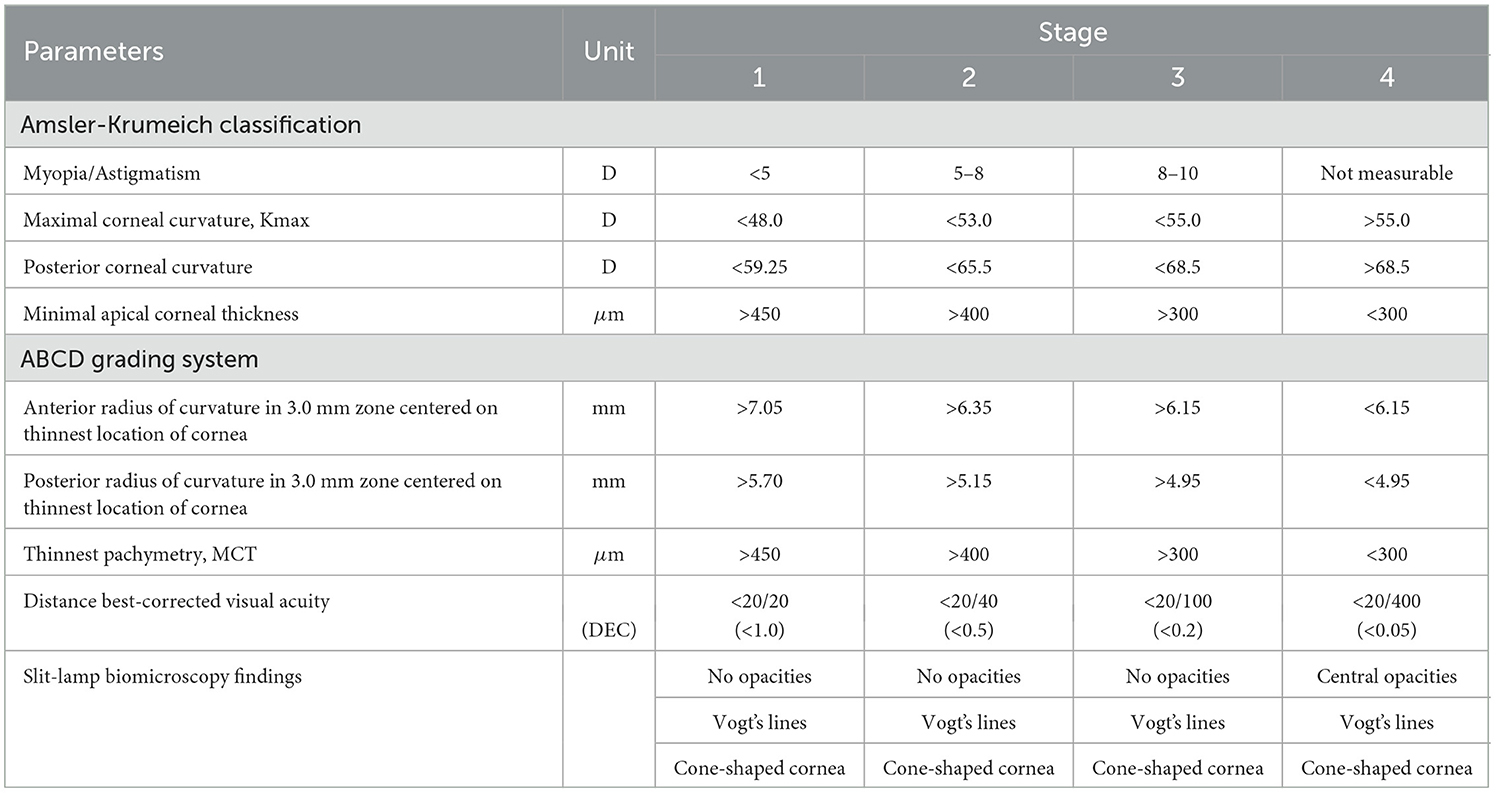
Table 1. Criteria for grading KC in this study.
3.2 Methods
Keratometry data were collected from Marco ARK-1 Series autorefractor/keratometer. Topography and pachymetry tests were done with WaveLight Oculyzer II corneal topographer. The diagnostic device also works as an optical pachymeter which determines how thick the cornea is. The method does not require contact as it uses light-based technologies to measure the corneal thickness. Furthermore, the application of the technique is painless and highly informative. The results of the pachymetry test are detailed maps of the cornea.
The topography examination provided us with refractometry indices and elevation back parameters obtained from the corneal apex. The best-fit sphere (BFS) is the most common reference for corneal elevation. The sphere has an “exclusion zone”, i.e., a 4.00 mm circle area around the MCT point. The surface area outside the zone is called the “exclusion map”. The raw data of the map are used to compute the elevation back map parameters (50).
Visual acuity was measured with the Golovin-Sivtsev scale, a standardized assessment tool in the countries that use the Cyrillic alphabet (51). The scale scores range from 0.1 to 2.0 decimal units, with 1.0 or 100% for the average vision. A score below 1 indicates myopia, and over 1 suggests far-sightedness or hypermetropia.
3.2.1 Indications for corneal collagen cross-linking
In this study, physicians recommended CXL for patients with confirmed KC progression. The criteria for the progression were as follows: an increase in Kmax of at least 1.0 dioptre (D) over a 6- to 12-month period, a rise in the difference between steep and flat keratometry of ≥1.0 D within 1 year, an increase in average keratometry of ≥0.75 D, a reduction in CCT of ≥2%, a decline in spherical equivalent of more than 0.5 D, and a decrease in uncorrected visual acuity (UCVA) of at least one line on the Snellen chart over 12 months. The last criterion corresponds to a loss of visual acuity significant enough to necessitate new contact lenses more than once every 2 years.
3.2.2 Protocol of corneal collagen cross-linking
We adhered to the standard Dresden Protocol, as G. Wollensak et al. outlined in 2003 (52). Following this protocol, the corneal epithelium in the central area (7–9 mm) was removed and left for 30 min. A 0.1% riboflavin solution mixed with 20% dextran was then applied to the corneal surface. Over the next 30 min, the cornea was irradiated with ultraviolet light at a wavelength of 365–370 nm and an irradiance of 3 mW/cm2. Riboflavin was reapplied every 5 min during this period. Throughout the procedure, the cornea absorbed ultraviolet radiation, achieving an energy density of 5.4 J/cm2.
We did not study outcomes in patients with very thin cornea. Historically, a corneal thickness of less than 400 μm after removing the epithelium was regarded as a contraindication for CXL. However, the introduction of hypo-osmolar riboflavin solutions allowed for corneal swelling to be induced during the procedure. This swelling increases the corneal thickness before ultraviolet exposure. If the cornea measures less than 400 microns after epithelial removal, the hypotonic riboflavin solution helps elevate the thickness to above 400 microns, making the treatment feasible (53). As a result, studies on hypo-osmolar riboflavin solutions indicated that an excessively thin cornea might no longer pose a limitation for treatment (54, 55).
3.3 Study methodology
3.3.1 Data preprocessing and exploration analysis
Upon examination, the study dataset was complete for most variables with few missing values in visiometry findings. Exploratory analysis indicated a strong association between visiometry data and results in pachymetry tests. The relationships were well-defined and consistent, which ensured the statistical robustness of predicting missing values in a linear imputation technique. Linear regression imputation preserved the natural relationships between variables in the dataset, ensuring that the imputed values align with the observed data structure. The exploratory analysis of the dataset followed data preprocessing.
The study cohort was monitored for up to 50 months after CXL. To assess CXL outcomes, we calculated descriptive statistics and then applied the Kruskal–Wallis test to find marked changes in the parameters that did not follow the normal distribution. We resorted to the Student's t-test to compare the normally distributed pre- and postoperative findings. The individual results outside the diapason [15, 85] percentile were considered outliers and excluded from further analysis. The Cohen's D test revealed if the postoperative changes in CCT and MCT were clinically meaningful.
3.3.2 Statistical approaches to tasks
To complete the first task, we examined the relationships between CCT and MCT before and after CXL. We used the Shapiro–Wilk test to check the distribution of the data. The relationships between normally distributed variables were tested with Pearson's correlation. For the other variables, the Spearman correlation was used. The significance level of p < 0.05 indicated a strong association between the data and CXL outcomes.
Working on the second task, we applied the same approach. Specifically, we analyzed associations between pre- and postoperative findings. For this purpose, we computed pairwise correlation coefficients among corneal thickness values, keratometry, topography, visiometry, and refractometry readings.
To address the third task, we trained models to predict MCT and CCT changes after CXL from individual preoperative parameters. We selected linear and polynomial equations to model the trends in corneal thickness during the follow-up. Then, we used the Bayesian information criterion (BIC) to score and select the optimal model type.
To forecast the success of treatment, we constructed ML models predicting CXL outcomes from the preoperative findings. In the follow-up examinations, corneal thickness reflected the structural outcome of CXL. Therefore, the targeted variables were change in CCT and variation in MCT. Regression models were trained to forecast CCT and MCT dynamics from the four groups of predictors: keratometry readings, visiometry and refractometry data, topography and deviation indices. We performed feature selection and split the original dataset into training and testing subsets - 70 vs. 30% of the data correspondingly.
To train and validate multiple ML models, we used a 5-fold cross-validation technique. Training and validation were conducted with Decision Tree, Random Forest, XGBoost, and LightGBM regressors. The performance was assessed with the mean absolute error (MAE), proportion of MAE to the range of values (ROV), root mean square error (RMSE), and R2.
To streamline the training process and augment the models' performance, we implemented Optuna framework and optimized hyperparameters. The framework allowed us to investigate various permutations of hyperparameters for each model. The results of validation tests revealed the top-performing configuration. We measured the models' generalization on unseen data.
4 Results
The study showed a significant improvement in keratometry readings and topographic indices after CXL (see Table 2). In visiometry findings, UCVA increased from 0.27 ± 0.23 to 0.33 ± 0.30 (p = 0.0286). However, other functional parameters remained stable after the invasion. In early-to-moderate KC cases, UCVA often improves more noticeably because CXL primarily addresses the biomechanical and structural irregularities of the cornea rather than directly altering refractive power (19, 56, 57)
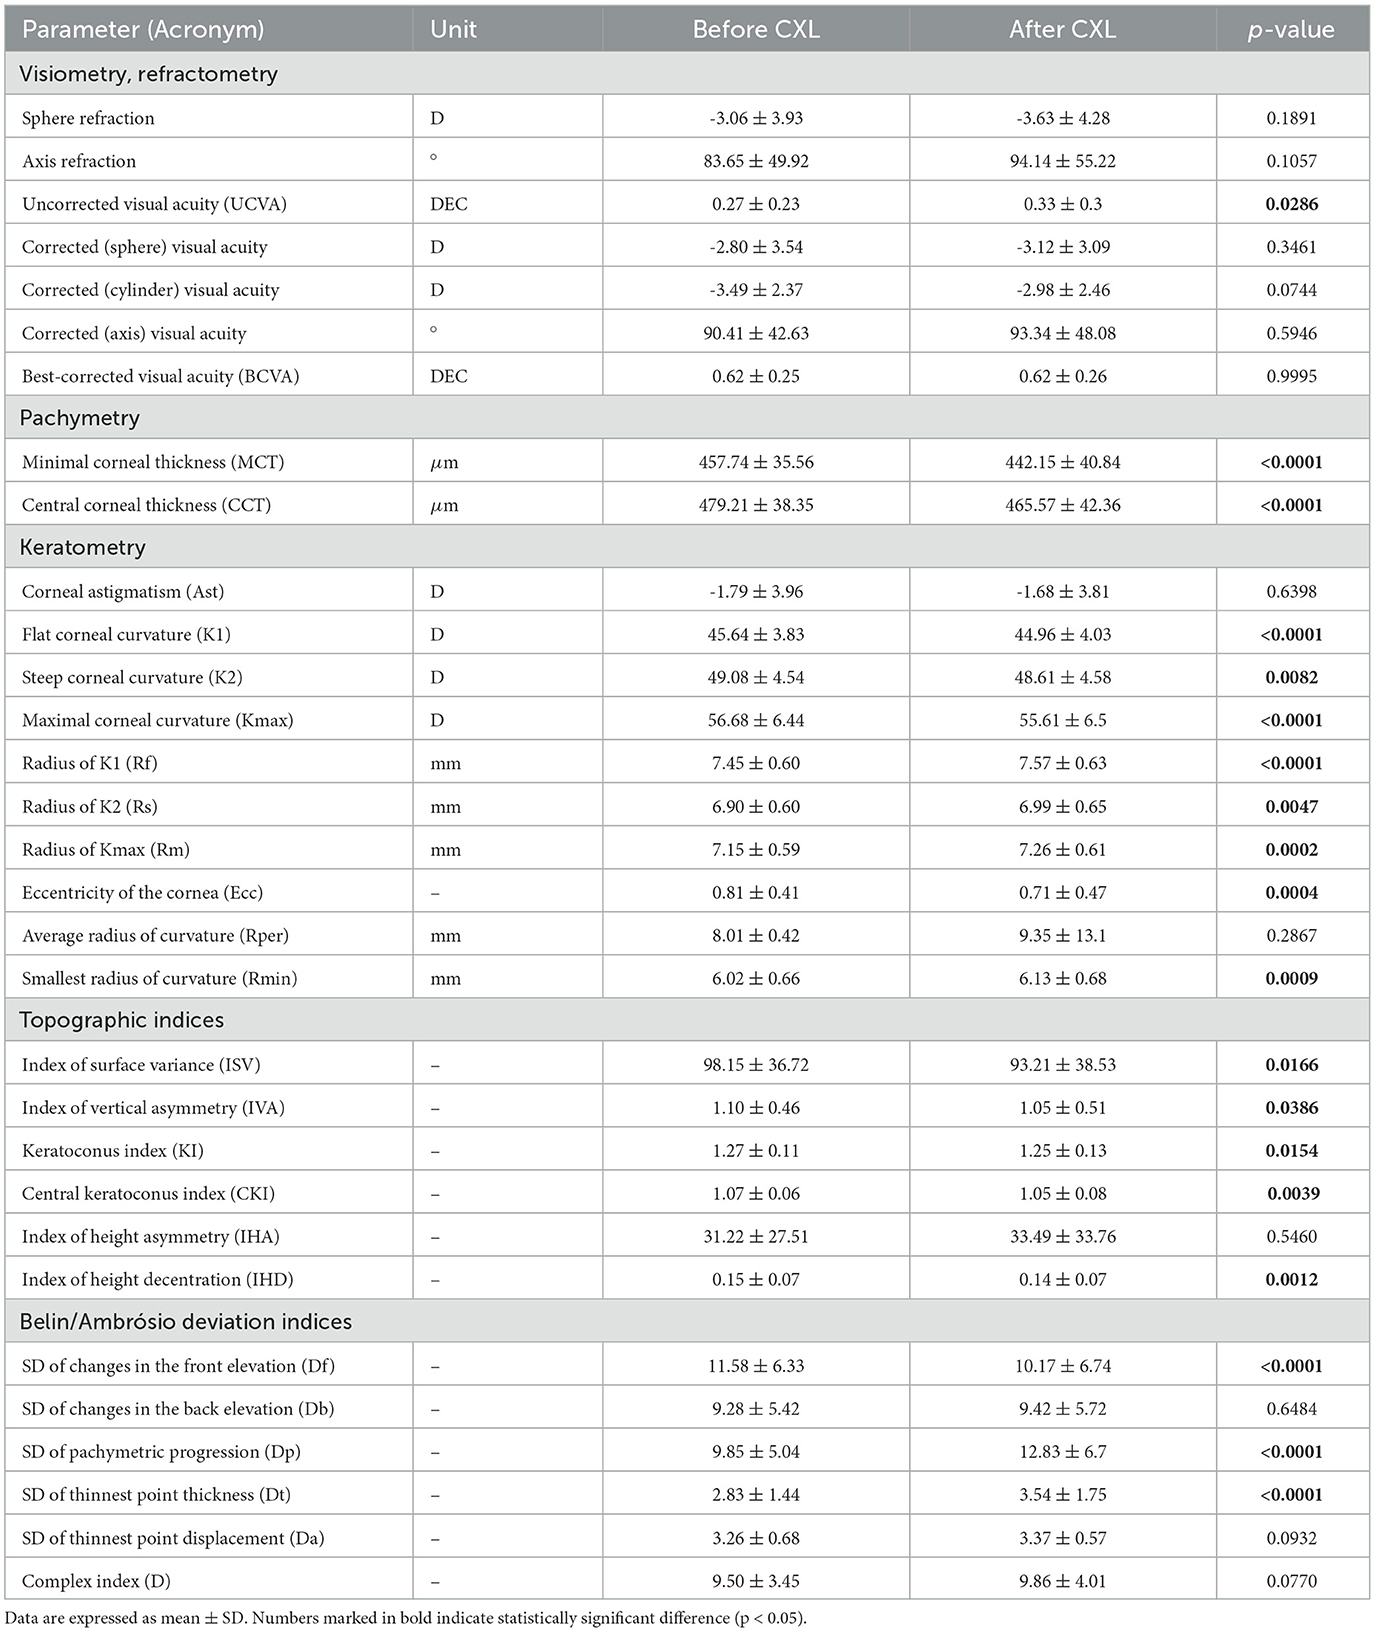
Table 2. Characteristics of study participants before and after CXL (mean follow-up period 14 months).
4.1 Pre and postoperative pachymetry findings
In our study, the average MCT before CXL was 457.74 ± 35.56 μm. Most protocols for standard epithelium-off CXL require a minimum corneal thickness of 400 μm after epithelial removal. Modified techniques (e.g., hypo-osmolar riboflavin or epithelium-on CXL) can accommodate thinner corneas. In advanced cases, MCT helps determine suitability for other interventions such as corneal transplant or intracorneal ring segment implantation (58).
The average preoperative value for CCT was 479.21 ± 38.35 μm. Although CCT is a hallmark of KC, it does not reflect the clinical stage according to the Amsler-Krumeich classification. MCT shows the disease stage more accurately because the cornea thins in a peripheral or paracentral location, not necessarily at its geometric center. Hence, CCT measurements may miss the area of maximum thinning, leading to an underestimation of disease severity. MCT directly captures the thinnest point of the cornea, providing a more accurate assessment (59, 60).
The average duration of the follow-up period was 14.01 ± 9.98 months. At this time, both CCT and MCT markedly decreased. The thickness of the central cornea dropped from 479.21 ± 38.35 to 465.57 ± 42.36 μm, and MCT reduced from 457.74 ± 35.56 to 442.15 ± 40.84 μm (p < 0.0001) (see Table 2). Transient thinning is a normal response to the treatment. The reasons behind the thinning are dehydration during surgery, keratocyte apoptosis, corneal healing, and remodeling.
According to the Cohen's D test, the postoperative change in MCT was clinically relevant. The test result 0.4758 was approximately 0.5 indicating a moderate magnitude of change. For CCT, the Cohen's D was 0.33. While statistically significant, this change represents a small-to-moderate effect size, which may or may not meet thresholds for clinical relevance depending on specific clinical guidelines or patient outcomes. Hence, the postoperative changes in MCT should serve as the major clinical marker of corneal thinning and thickening since they are more pronounced and meaningful than the CCT dynamics.
An association between MCT and CCT was stronger after CXL (r = 0.9 vs. 0.79, p < 0.001). The treatment induces cross-linking uniformly across the corneal stroma, leading to a more homogeneous distribution of biomechanical strength. This uniformity reduces localized thinning and protrusion, resulting in a more consistent relationship between MCT and CCT post-procedure (61).
We also explored relationships between preoperative pachymetry parameters and postoperative findings (see Figure 1). The preoperative MCT and CCT had a weak correlation with pachymetry data after CXL. This suggests the absence of a linear association between preoperative pachymetry data and the structural outcomes of CXL.
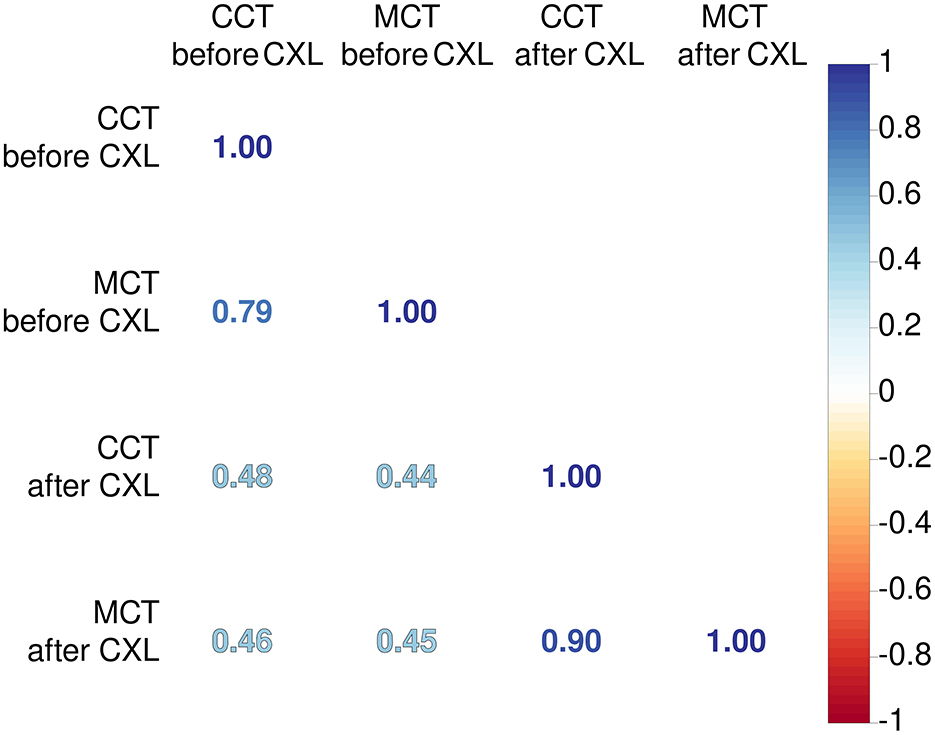
Figure 1. Coefficients of Pearson's correlations between corneal thickness before and after CXL. Color of numbers encodes p-level, and all associations are significant with p < 0.05.
4.2 Relationship between preoperative parameters and corneal thickness after CXL
Preoperative keratometry findings exhibited moderate and weak associations with postoperative pachymetry data (see Figure 2A). Corneal eccentricity (Ecc) describes the rate of flattening from the center to the periphery of the cornea, and in our study, it demonstrated a strong inverse correlation with CCT and MCT after CXL (r = −0.52 and −0.60, respectively; p = 2.90 × 10⁻⁹ and p = 2.05 × 10⁻¹²). In analogous to this, corneal astigmatism (Ast) before CXL had a negative correlation with both CCT and MCT after the invasion (r = −0.46, p = 2.70 × 10⁻⁷ and r = −0.56, p = 1.51 × 10⁻¹⁰ respectively). Higher Ecc and Ast indicate a more advanced disease when the corneal thinning is more severe both before and after the intervention.
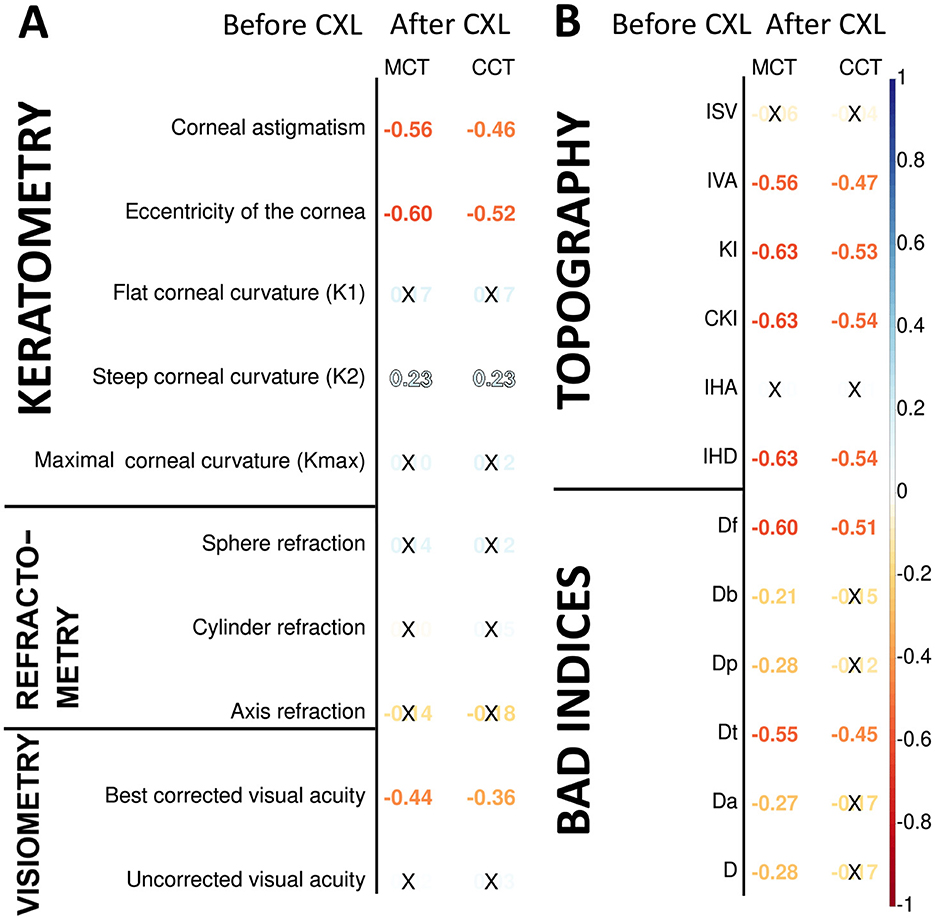
Figure 2. Pearson's correlations of postoperative corneal thickness with keratometry, pachymetry, visiometry, and refractometry findings before CXL (A), corneal topography and deviation indices before CXL (B). Color of numbers encodes p-level, and insignificant associations are marked with crosses.
The preoperative K2 value had a weak positive correlation with the pachymetry data after CXL: r = 0.23, p = 0.001 for both minimal and central corneal thickness. The flat and maximal keratometry readings also had a direct association with the corneal thickness, although it was unremarkable; r = 0.10÷0.17; p > 0.05. Before the intervention, corneas with higher keratometry values generally exhibit more advanced ectasia. In these cases, the corneal regions are thinner at or near the cone apex. The biomechanical stability of these corneas is lower, which may influence the remodeling of their tissue in response to CXL. Below is why the connection of postoperative CCT and MCT with K1 and Kmax is slacker than with K2. In KC, the cone is often asymmetric, with the steepest curvature (K2) located away from the central cornea. The post-CXL remodeling is driven by the cone's location and steepness, which are more directly related to K2 than other keratometry values. This suggests a tighter relationship between the preoperative K2 value and pachymetry readings.
Most preoperative functional parameters were weak correlates of the postoperative pachymetry values. An exception was BCVA which exhibited a moderate negative association with MCT (r = −0.44, p = 1.31 × 10⁻⁶). In advanced KC, the cornea is thin and weak before the surgery, which results in worse preoperative BCVA. After CXL, the weak cornea undergoes significant collagen compaction and structural remodeling (15, 62).
Pachymetry data correlated stronger with topography and BAD indices than keratometry and refractometry data (see Figure 2B). All these measurements reflect the structural and geometric properties of the cornea, but topographic and BAD indices are more directly tied to corneal thickness variations (63). The index of height decentration (IHD) directly quantifies the asymmetry of the posterior corneal surface elevation, which is closely linked to the location and severity of corneal thinning in KC (64, 65). For this reason, corneal thickness had a strong negative relationship with IHD (r = −0.63, p = 1.31 x 10⁻¹³).
All topographic readings and the elevation back map parameters correlated stronger with MCT than CCT because MCT provides a more direct measure of the corneal region most affected by ectatic changes in keratoconus. The KI index showed the strongest negative relationship with MCT (r = −0.63, p = 1.72 × 10⁻¹³). The CKI index was associated slightly stronger with both MCT and CCT (r = −0.63, p = 1.44 × 10⁻¹³ and r = −0.54, p = 7.56 × 10⁻¹⁰, respectively). KI measures the ratio between mean radius values in the upper half and lower half of the cornea. CKI evaluates the ratio between the mean radius of curvature in a peripheral placido ring and the mean radius of curvature of the central ring. These indices are strongly influenced by corneal steepening and asymmetry (40, 66).
We also studied the correlation of postoperative pachymetry findings with parameters of elevation maps that measure corneal height in micrometers. Posterior elevation represents the true deformation of the cornea. The top correlates of MCT were the data received at the following maps: posterior elevation and posterior elevation with BFS (see Figures 3A, B, respectively). In advanced KC, the cornea is thinner and weaker; therefore, it bulges more at the back.
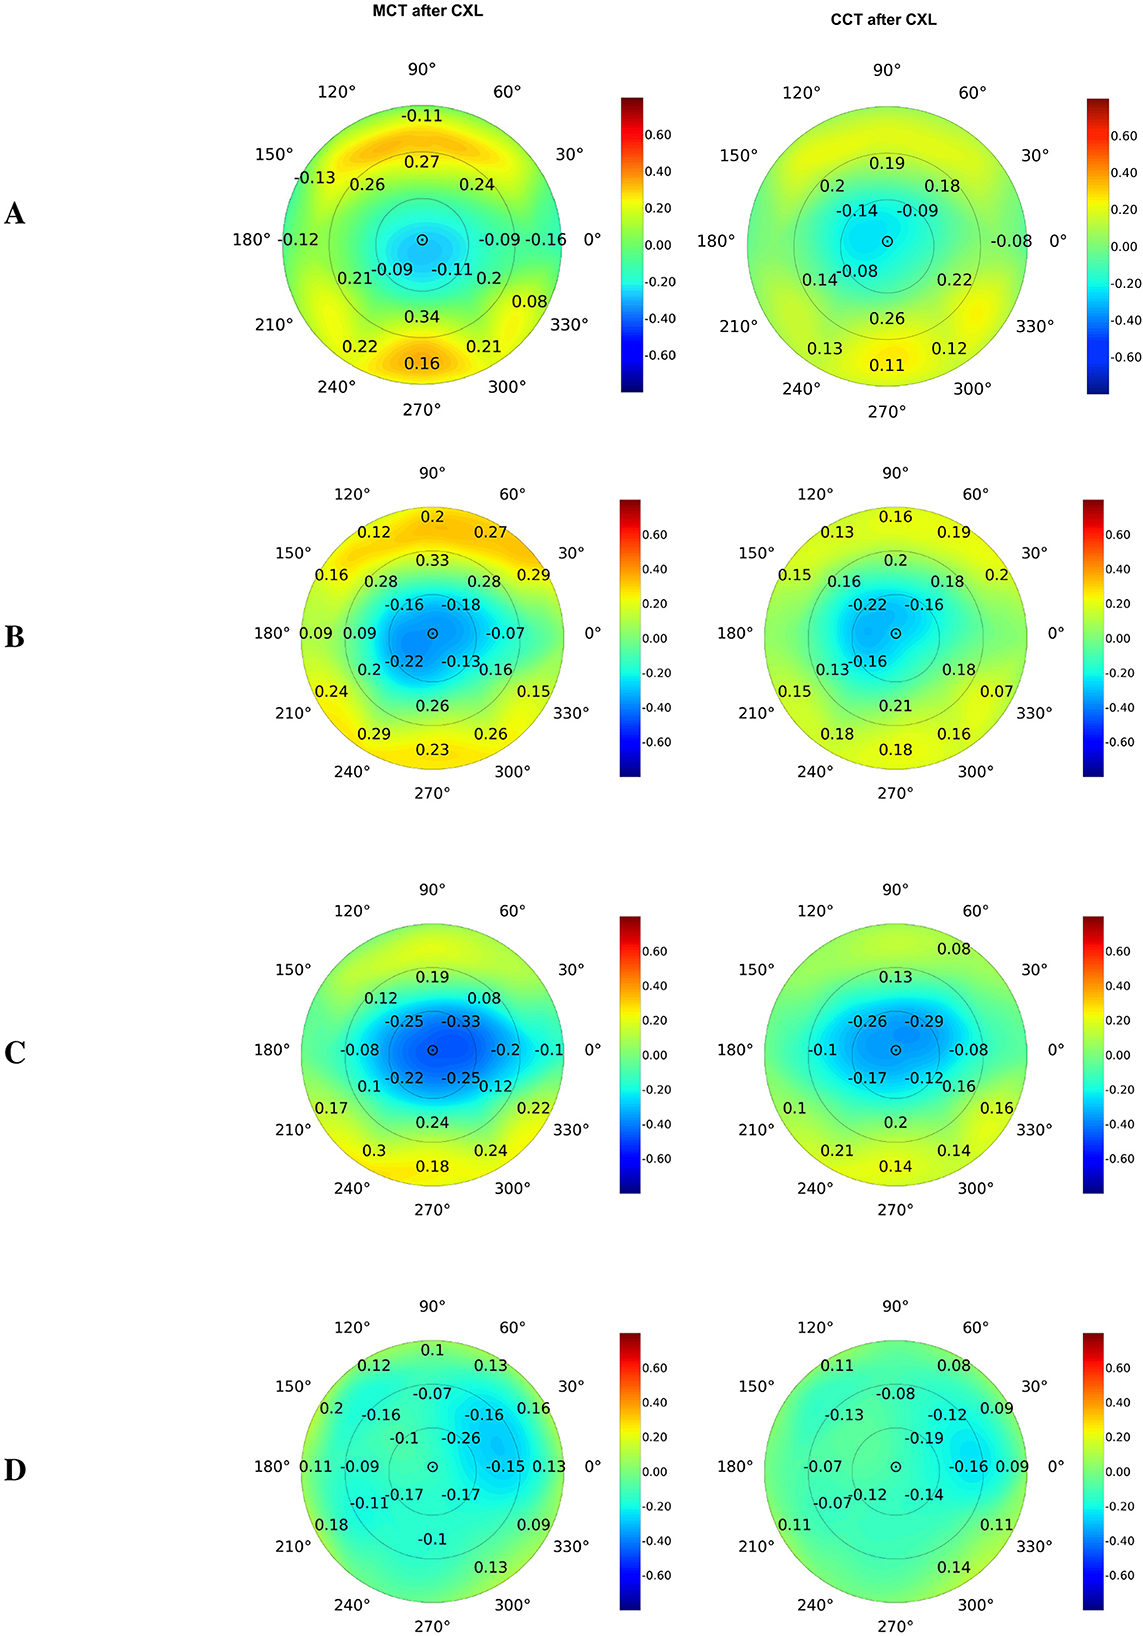
Figure 3. Pearson's correlations of postoperative corneal thickness with preoperative parameters of elevation back maps: posterior elevation (A), posterior elevation with the best-fit sphere (B), exclusion map (C), and exclusion zone (D). Numbers show correlation coefficients for significant associations with p < 0.05.
The exclusion map identifies areas of the cornea that deviate significantly from a reference geometry (67). In our study, the exclusion map area parameters expressed a moderate association with MCT and CCT (see Figure 3C). Meanwhile, findings of exclusion zone showed a weaker correlation with pachymetry measurements (see Figure 3D). In KC, structural changes in the cornea directly impact the exclusion map data. The exclusion zone parameters capture broad geometric characteristics of the cornea, and they reflect the localized corneal thinning less reliably (67).
4.3 Corneal pachymetry after CXL
We modeled postoperative structural changes with linear and polynomial regressions. The dataset included 796 cases. The observational period length ranged from 4 to 52 months. As seen in Figure 4, the linear trends showed a steady decline in pachymetry readings. The slope describing the MCT dynamics was negative but non-significant: β = −0.1891, p = 0.169 (see Figure 4A). The polynomial function depicting the relationship between time and change in MCT also declined during the first 20 months and then reached a plateau. The trend exhibited a positive shift starting from the 28th month of observation, with a reversal toward baseline MCT 52 months after the surgery. The further prognosis might be inaccurate because our study lacks observations covering the later stages of recovery. The BIC value was slightly lower in the first- than in the second-degree equation: 1692.6 vs. 1697.3, respectively. Although this fact suggested a linear dependency between MCT and time, the MAE values for the first- and second-degree equations were almost equal: 21.68 vs. 21.71 μm.
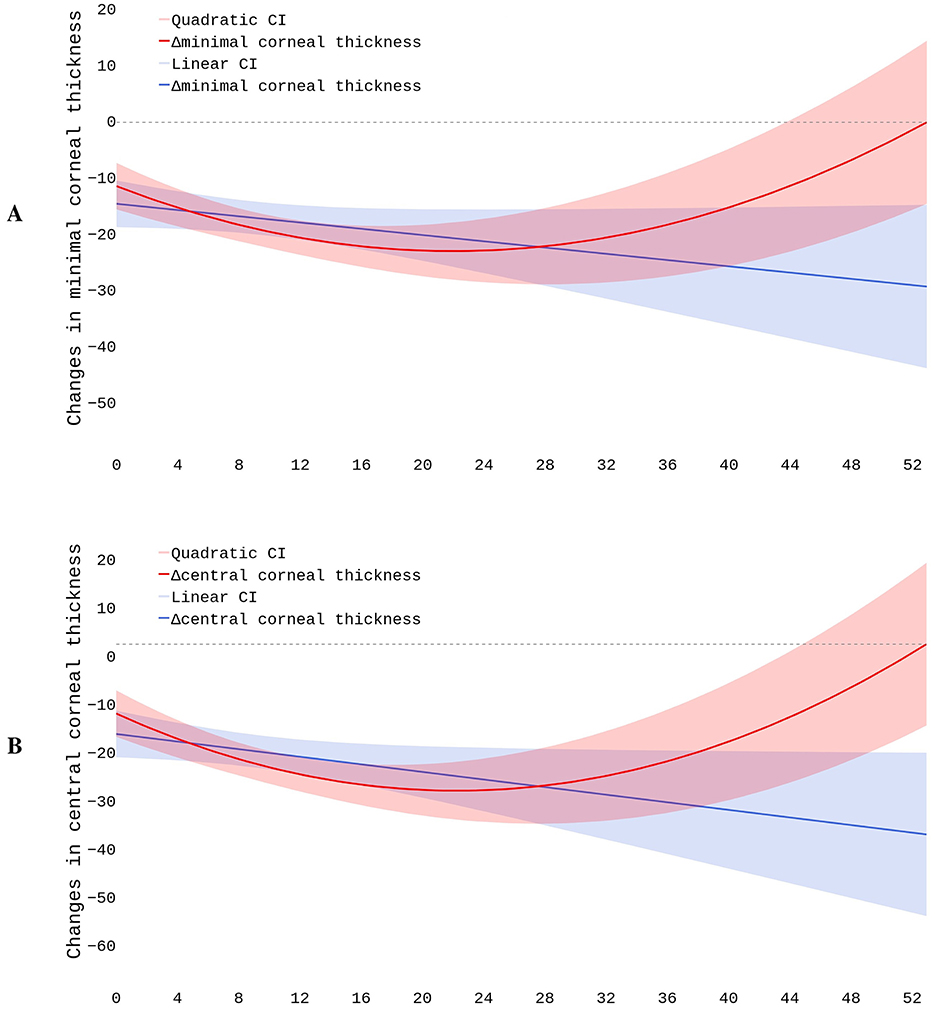
Figure 4. Postoperative changes in minimal (A) and central (B) corneal thickness.
The plot describing residual vs. fitted values indicated that the linear model did not accommodate the data properly, and the polynomial model match them slightly better. These findings suggest a non-linear association between time after surgery and postoperative MCT values. Still, the structured residuals indicate that other factors may account for the large variance in corneal thickness after CXL. Q-Q plots revealed that residuals did not follow the normal distribution. This could indicate the presence of outliers or non-constant variance impacting model's reliability. In clinical settings, this suggests including other predictors in addition to the duration of observation (see Section 4.4).
For dynamics in CCT, the slope coefficient was negative and significant: β = −0.3002, p = 0.035 (see Figure 4B). The second-degree polynomial model of changes in CCT also reflected the postoperative dynamics more accurately than the linear regression. The BIC and MAE for these models were close: 1697 vs. 1701 and 22.50 vs. 22.38 μm, respectively. In the plot describing residual vs. fitted values, residuals followed a more structured pattern in the polynomial than linear regression. This justified the non-linear relationship between the time and change in CCT. Q-Q plots showed a significant deviation of residuals from the normal distribution both in the linear and quadratic equations.
The quadratic function drew a U-shaped trend in CCT changes during the first 4.3 years after CXL. In the first 20 months, the thinning was pronounced. Then, the corneal thickness remained stable for approximately 8 months. Between the 28th and 52nd months, the cornea progressively recovered its baseline thickness. Afterwards, the cornea continued thickening. The postoperative variation in pachymetry tests largely depends on the characteristics of the study cohort. In the early stages of the disease, the cornea's potential to recover its thickness after CXL is largely higher than in advanced KC.
The reported R2 values indicate extremely poor model fit. It was 0.0006 vs. 0.0007 and 0.0005 vs. 0.0012 for the linear and polynomial functions describing MCT and CCT models, respectively. Hence, neither regression model effectively predicts postoperative data. The findings suggest that unaccounted factors affect the postoperative fluctuations in the pachymetry data. These factors may include biomechanical response variability after CXL, patient-specific healing mechanisms, corneal hydration, and epithelial remodeling. To improve the accuracy of the prediction, we included preoperative findings in the models.
4.4 Prognosing CXL outcomes in KC patients
In our models, the prediction of postoperative MCT variations was more accurate than CCT. For a reliable prognosis of postoperative corneal thickness, we used several groups of findings: keratometry readings, visiometry and refractometry data, topography and BAD indices. We also investigated whether the prediction accuracy improves with the top correlating features from various modalities at the input to the model.
Combinations of the top correlates with clinical data and time after surgery showed the highest predictive potential (see Tables 3, 4, Figure 5). The reliability of the models trained to predict MCT from preoperative findings was high: R2 = 0.71 ± 0.02 and RMSE = 22.71 ± 0.60. The performance metrics for CCT models were 0.73 ± 0.01 and 23.29 ± 0.23. Hence, risk assessment is more accurate with multimodal preoperative diagnostics than unimodal.

Table 3. Regression metrics for predicting minimal corneal thickness.
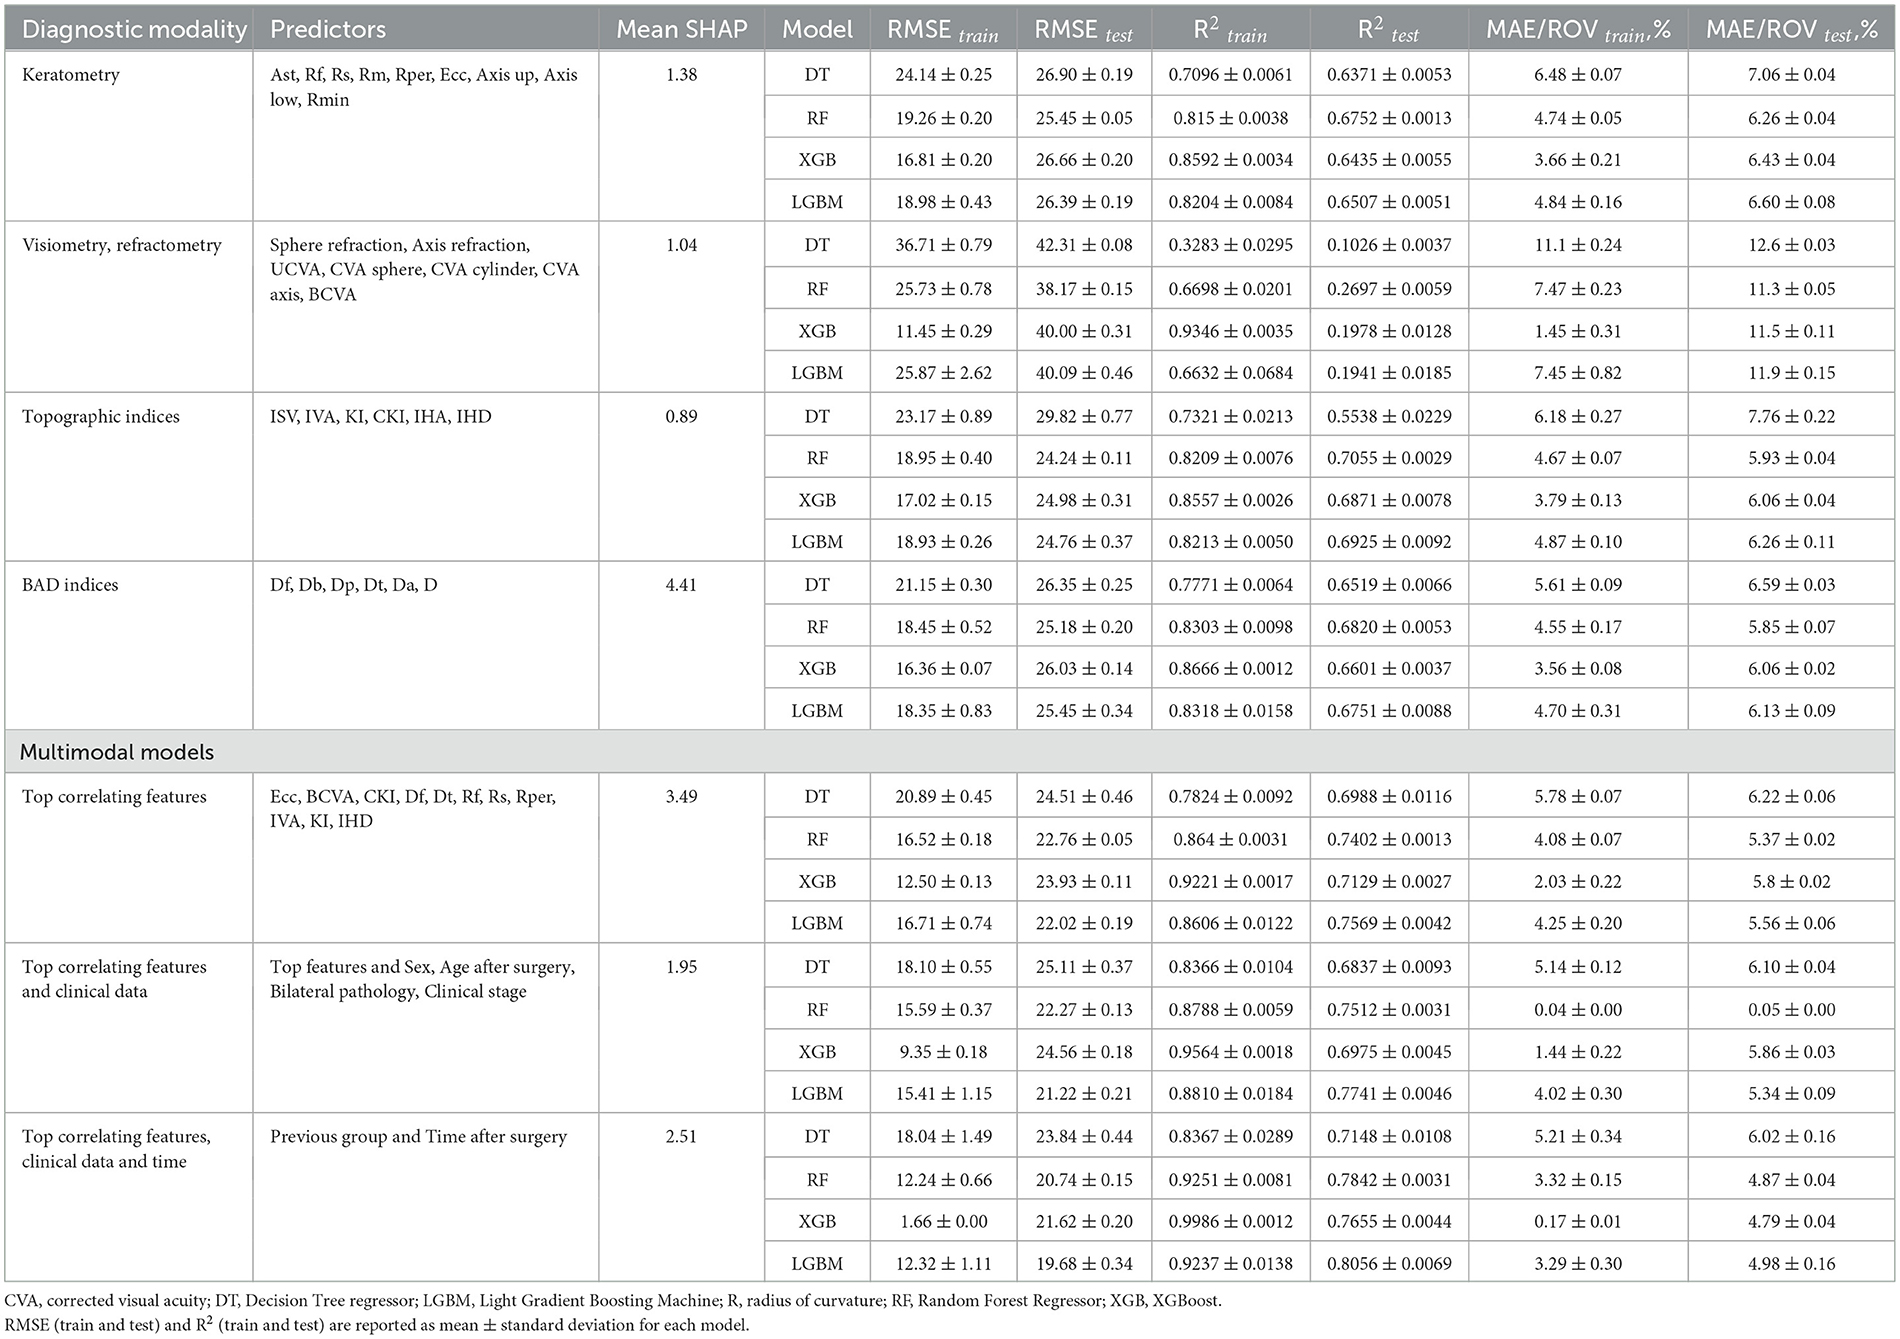
Table 4. Regression metrics for predicting central corneal thickness.
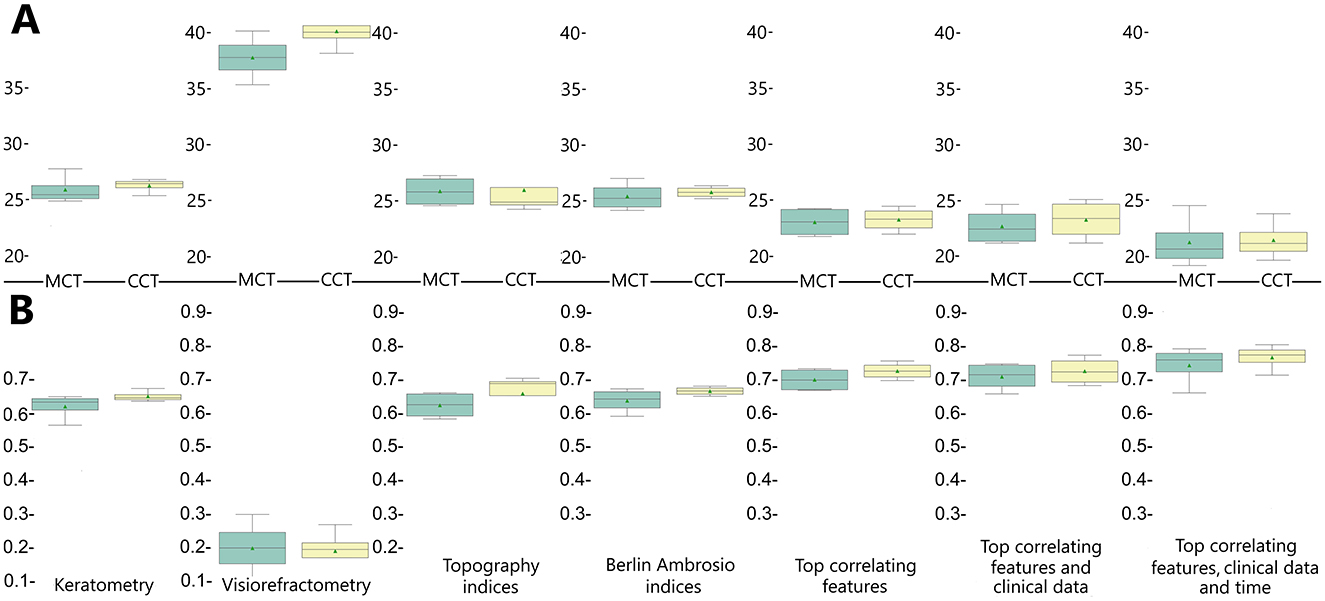
Figure 5. Accuracy of regression models trained to predict postoperative changes in minimal and central corneal thickness reported in R2 (A) and RMSE (B).
To illustrate the impact of predictors on model outcomes, we computed SHAP values for each variable group and averaged the summary value across individual variables within those groups. In BAD indices, the mean SHAP value was maximal (see Tables 3, 4). However, only BAD-Dt had a strong predictive power since it indicates the thinnest point thickness of the cornea. Many BAD indices had lower predictive power than individual keratometry, visiometry, and topography findings (see Figure 6).
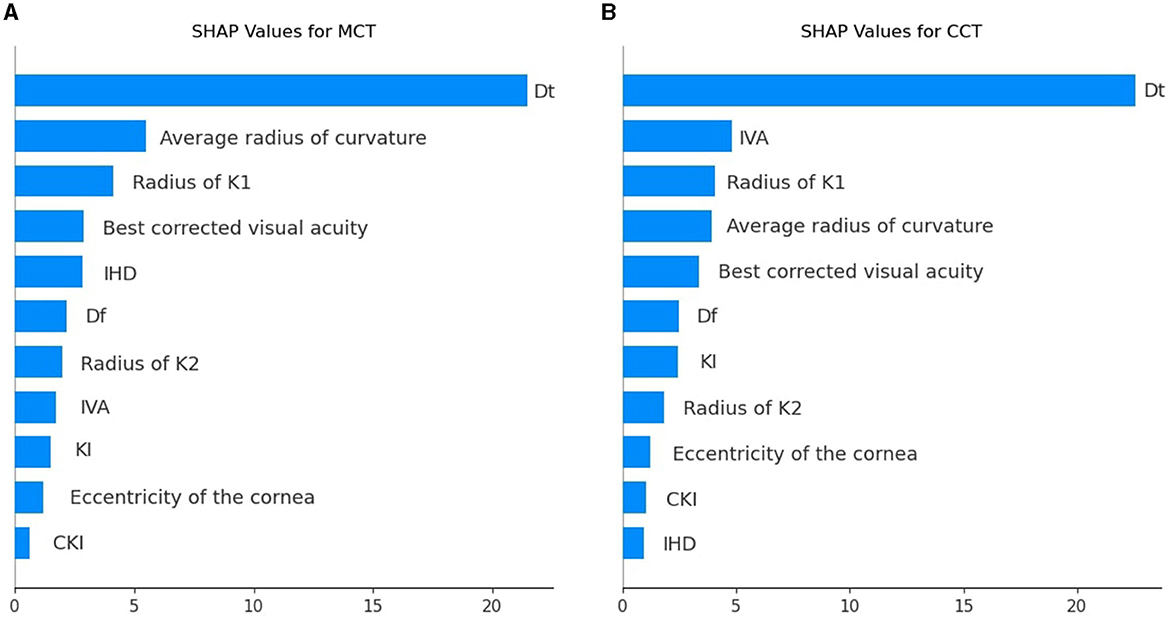
Figure 6. SHAP values for individual predictors among the top correlating features used to prognosticate postoperative MCT (A) and CCT (B).
Dt and MCT are often used interchangeably, but they may differ and show a reverse association in certain situations where the thinnest point lies outside the central cornea. In ectatic corneas (e.g., keratoconus), the thinnest point is often displaced and located in the inferior-temporal region. Diagnostic devices can define MCT differently. If MCT is measured only in the central cornea, it may not capture the actual thinnest point outside this region. As a result, MCT in the central zone might appear thicker than Dt, creating a reverse association. A comprehensive analysis of all preoperative findings allows one to assess risks in CXL reliably.
When trained on the findings of each diagnostic modality, the models with BAD indices achieved the top performance: R2 = 0.64 ± 0.004 and 0.67 ± 0.01, RMSE = 23.39 ± 0.15 and 25.76 ± 0.24 for MCT and CCT models, respectively. A high SHAP value of Dt serves as an explanation of the high predictive potential of the BAD findings. The predictive potential of topographic findings was slightly lower: R2 = 0.63 ± 0.01 and 0.66 ± 0.02, RMSE = 25.85 ± 0.33 and 25.95 ± 0.39, for MCT and CCT prognosis. The pre-operative IHD value was a strong predictor of MCT. IHD captures vertical decentration and corneal asymmetry–the determinants of corneal thinning and remodeling after CXL. The IVA index was the second top informative predictor of CCT. Higher IVA values indicate steeper inferior curvature, which is often associated with corneal thinning in the central regions.
Models trained on keratometry readings were slightly less reliable than those trained on BAD indices: R2=0.62 ± 0.004 and 0.65 ± 0.00, RMSE = 25.99 ± 0.15 and 26.36 ± 0.16 for MCT and CCT, respectively. Keratometry findings characterize surface shape but do not reflect how the cornea will respond structurally to CXL. According to our results, visiometry and refractometry data were the worst predictors of postoperative MCT and CCT: R2 = 0.20 ± 0.02 and 0.19 ± 0.01, RMSE = 37.78 ± 0.40 and 40.15 ± 0.25, respectively. Vision characteristics and refraction parameters illustrate the optical outcome of the disease. They show a loose correlation with pachymetry data, which explains the questionable performance of the models trained on visiometry and refractometry findings.
5 Discussion
5.1 Pachymetry after corneal collagen cross-linking
A limited number of studies revealed postoperative changes in MCT and CCT. Meanwhile, monitoring corneal thickness is important because it ensures the absence of complications: corneal ectasia, wound dehiscence, delayed healing, and decreased intraocular pressure (68, 69). Our observations revealed mid-term CXL outcomes (approximately 4 years). The corneal thickness dropped after CXL, and the negative trend continued for approximately 52 months. In some studies, authors followed the patients with mild KC for 12 months, and they also showed a steady decline in corneal thickness (70, 71).
Our findings confirmed the relationship between pre- and postoperative pachymetry values, both central and minimal. Hence, the baseline pachymetry data can reflect the intervention outcomes. In the current study, both preoperative CCT and MCT findings correlated higher with the preoperative CCT than with MCT. These results suggest that researchers should recognize CCT as an important input to models prognosticating results in pachymetry tests after the surgery. Currently, MCT is considered a strong predictor of CXL effectiveness (15, 72).
Preoperative CCT and MCT findings correlated closely (r = 0.79, p < 0.001). In KC, steepening of the cornea is irregular, which results in irregular astigmatism (1). The association between CCT and MCT after CXL strengthened compared to the preoperative status (r = 0.90 vs. 0.79, p < 0.001). Hence, CXL halts the KC progression, and changes in the corneal thickness become more uniform due to a decrease in the interfibrillar distance (73).
A postoperative decline in pachymetry values is a natural process of corneal remodeling after CXL. In our study, the alterations were accompanied by an improvement in UCVA and keratometric values. Other studies also reported an improvement in visual acuity after CXL (74, 75). However, the study authors focused primarily on corrected distance visual acuity. In their works, the functional outcome of CXL depended on preoperative visual parameters (74, 75). In another study, an improvement in vision after CXL did not correlate significantly with the change in corneal thickness (15). Complex variations in the biomechanics of the cornea may account for the discrepant findings in recent studies on the restoration after CXL.
5.2 Association between preoperative ophthalmometry findings and CXL outcomes
The corneal refractive power depends on the corneal thickness and curvature (76). The majority of KC studies revealed a change in visual refractometry, keratometry readings, and corneal flattening after CXL (77, 78). Clinical trials should consider the baseline corneal thickness for designing a CXL protocol and prescribing the treatment to the patients because the outcome depends on initial pachymetry findings (79, 80). Previous studies rarely used pachymetry data to evaluate the CXL effectiveness. Keratometry remains the major outcome measurement in the assessment of the disease dynamics because the key factors affecting refraction are the refractive index of the cornea and adjacent tear film (81). A recent publication supports the correlation between the corneal thickness and Kmax (82).
The Pentacam topography screening indices (ISV, IVA, KI, CKI, etc.) form a corneal thickness profile that reflects variations of the thinnest point in the peripheral cornea. According to our data, the indices are the top correlates of MCT post-CXL. From other studies, corneal topography is the best method for early detection and monitoring progression of KC (83).
The current study revealed a negative relationship between postoperative pachymetry findings and preoperative data on BCVA and Ast. The relationship between preoperative visual acuity and postoperative corneal thickness after CXL is not straightforward as these factors are influenced by multiple variables, including the severity of keratoconus, corneal biomechanics, and the CXL procedure itself. A recent study revealed an association between preoperative corneal thickness and postoperative corrected visual acuity (84). Visual acuity is a marker of a functional result of CXL, and corneal thickness depicts structural consequence of the procedure. Functional and structural outcomes of CXL are tightly connected. Still, a confounding factor may account for the loose association between preoperative results in the vision test and postoperative corneal thickness.
Our study showed a pronounced correlation between postoperative corneal thickness and preoperative topographic indices such as IVA, KI, CKI, and IHD. IVA quantifies surface variance and vertical asymmetry, and it might serve as an indirect predictor of corneal biomechanical behavior post-CXL. Greenstein et al. reported an improvement in 3 of 6 topographic indices a year after CXL, suggesting an overall improvement in corneal shape (15). Researchers used topographic findings to develop new treatment methods, such as topography-guided CXL and accelerated CXL combined with topography-guided photorefractive keratectomy (85, 86). However, their findings do not explain the direct correlations of topographic indices with pachymetry changes.
We identified a weak-to-moderate relationship between preoperative elevation back map parameters and the pachymetry findings after CXL. The posterior surface of the cornea has more fluid than the anterior wall, and it is a more sensitive indicator of abnormality (87). Therefore, it was necessary to study the association of the elevation back map parameters with postoperative outcomes. In a study on corneal remodeling, elevation back map values significantly increased during a year after the treatment (88). Still, it is challenging to explain the relationship between preoperative parameters of the posterior surface of the cornea and pachymetry values after CXL.
5.3 Long-term changes in corneal curvature after CXL
We used linear and polynomial models to forecast a long-term change in the corneal thickness after CXL. First-degree models showed negative linear trends in CCT and MCT values, which replicates the literature data. Other authors also observed a linear decrease in pachymetry values (16, 89). They reported a pronounced thinning of the cornea in the first year after the intervention (16).
The linear model constructed by us was sensitive to the initial steep decline, and the steady negative tendency in the corneal thickness persisted for 4 years. The recovery phase might be non-uniform across all patients (90), and pachymetry values did not return to the baseline values in all the cases. For this reason, the linear model predicted a decrease even though the thickness stabilized or partially recovered later.
According to our data, the polynomial curve demonstrated the complex time-to-corneal-thickness association more reliably than the linear trendline. The findings reflect the natural course of post-CXL corneal remodeling. It includes thinning immediately after CXL and stabilization with partial recovery of corneal thickness over time. Both MCT and CCT show progressive reduction throughout the first 20 months of observation. Thereafter, corneal thickening occurs, restoring baseline values at ~52 months post-surgery.
Meanwhile, studies by Greenstein et al. showed that the cornea almost regained its minimal thickness in 12 months after CXL (15, 32). In these studies, the cases were more severe than in our observation, which is evident from the higher preoperative Kmax (60.9 ± 9.5 D) and lower MCT (440.7 ± 52.9 μm). Hence, it is not clear what may account for the quick regeneration of the cornea in the report by Greenstein on the efficiency of the standard CXL protocol.
A study by Holopainen et al. also revealed quick positive dynamics in MCT. The authors found that corneal thickness decreased shortly after cross-linking. However, at the follow-up 6 months later, the cornea regained its original thickness (91). Mild severity of the observed cases may explain the rapid improvement in this cohort of patients. In that study, the preoperative value for Kmax was 48.9 ± 3.7 vs. 56.68 ± 6.44 D in our research. Before CXL, the corneas were also markedly thicker: The average MCT was 483 ± 54 vs. 458 ± 36 μm in our observation. The marked difference in the patient populations may rationalize the discrepancies in findings between the studies.
An article by Chan et al. revealed postoperative changes after accelerated CXL. The cases were more severe than in our study: Preoperative Kmax was 61.99 ± 10.37 D. However, the corneal thinning was less pronounced than in our research: MCT before the treatment was 467.05 ± 38.59 μm. According to these authors, MCT slightly decreased to 454.84 ± 47.21 μm 2 years after the intervention, and the cornea continued thinning. In 5 years post-CXL, the size dropped to 452.68 ± 60.12 μm (p < 0.05), and the reduction in MCT became pronounced (89). The postoperative dynamics of this observation was worse than in our research, probably, due to more severe cases and application of another CXL protocol.
Earlier studies reported contradicting findings on the dynamics of corneal thinning after CXL. Differences in patient populations account for heterogeneity in literature data. For example, Holopainen et al. observed corneal thinning within the first month with a gradual thickening within the next 5 months (91). The patients regained the original corneal thickness 6 months after the treatment because they had mild disease forms. In their cases, the preoperative MCT was 483 ± 54 μm, and the Kmax value was 48.9 ± 3.7 D, which corresponds to the 1st stage in the Amsler-Krumeich classification. Greenstein et al. received similar findings. According to them, the cornea thinned at 1 month and from the 1st to the 3rd month. Then, the thickness recovered between the 3rd and the 6th month. Still, it is challenging to interpret these data because the authors reported neither the preoperative Kmax nor the disease stage (15).
Corneal thickness below 400 μm was an exclusion criterion in our research. Patients with skinny corneas (<400 μm) are at risk for excessive corneal thinning and potential complications. In a study with preoperative Kmax values of 61.70 ± 11.10 D (stage 4), patients were followed, on average, for 36 months after the intervention. Despite the lengthy observation, the cornea thinned from 460.9 ± 51.4 to 434.9 ± 63 μm (18). In another study, patients with preoperative MCT lower than 430μm showed early progression after conventional CXL (92). Knowledge on this motivated us to exclude cases with skinny corneas from the research. In skinny corneas, accelerated CXL protocol is safer. Still, the application of this protocol does not ensure the success of the intervention (89).
5.3.1 Changes in biomechanical properties of the cornea after CXL
In the early stages of KC, biomechanical changes are hard to detect and measure in vivo. Therefore, researchers use animal models or human eye-banked corneas to study corneal changes (93–95). The refinements of the affected cornea include a reduction in the number of collagen fibril lamellae and a decrease in the density of the sub-basal nerve plexus, endothelial cells, and stromal keratocytes (96–99). CXL stops further corneal weakening by creating new covalent bonds in the corneal stroma (95). The formed cross-links hold collagen fibers (100). Some studies observed an improvement in collagen fibril organization due to CXL (101). The diameter of anterior stromal collagen fibers increases more markedly (102).
Hydration impacts the biomechanical characteristics of the cornea. After CXL, the hydration level rises making the cornea stiffer to stretch (103). An in vivo study showed that the cornea thins and loses water after CXL (104, 105). Then, it recovers toward baseline thickness, and the level of hydration restores (106). The endothelium regulates corneal hydration (107). In KC, the endothelial cell loss due to apoptosis alters water-electrolyte balance and distorts the cornea. Although CXL improves corneal function, the procedure possesses side effects. It decreases the endothelial cell density by producing reactive oxygen species, which are cytotoxic in high concentrations (108, 109).
5.4 Determinants of CXL effectiveness in KC patients
Information on the determinants of CXL success is limited (110). For prognosticating postoperative outcomes, researchers commonly perform univariate analysis, which is the most straightforward data processing procedure (111). We focused on the structural outcomes of CXL and trained ML algorithms to forecast the postoperative corneal thickness. In both CCT and MCT models, the best predictors were a combination of the top correlates with clinical data and time after surgery. Recent studies also revealed the prediction of CXL efficiency from multiple parameters (112, 113, 169, 170). However, the authors of these studies focused on the CXL's functional outcomes (refractive power). Meanwhile, our research gives a new insight into the structural consequences of the intervention (corneal thinning).
The current research revealed that preoperative BAD indices are the most reliable predictors of postoperative MCT and CCT. Recent studies also suggested these indices as informative predictors of CXL efficiency (113–115). The authors of these studies used functional parameters and keratometry values as the markers of CXL outcomes. In contrast to them, we focused on structural data (results in pachymetry tests).
Keratometry readings and topographic indices are widely used in research to predict CXL outcomes. Our study showed that the predictive potential of these parameters is slightly lower than that of BAD indices. Other authors also consider keratoconus enlargement and preoperative longitudinal changes in corneal topography as prognosing factors of CXL efficiency (83, 116). In our database, most cases had a single baseline examination before the invasion. Therefore, we could not explore longitudinal preoperative findings as potentially informative features. Future studies may improve the prognostication of CXL outcomes with the suggested model inputs.
The visiometry and refractometry findings had the least predictive value in our research. Contrarily, Badawi and Abou Samra showed a strong linear dependency between preoperative BCVA and CXL outcomes (β = −0.945, p < 0.001) (16). In that study, the marker of CXL efficiency was postoperative Kmax, unlike corneal thickness in our study. In untreated KC, a univariate model based on BCVA reveals the disease progression non-reliably: AUC=0.647 (116). CXL prognosis becomes more accurate when bioengineers combine visual acuity with other indicators.
5.4.1 Clinical implication of study
The key benefit of applying AI-based techniques to this study is enhanced predictive accuracy (160). AI models, particularly ML algorithms, gain certain advantages from identifying complex patterns within large datasets (117–129). Non-linear relationships may not be apparent through traditional statistical methods. Therefore, conventional linear models can commonly miss them, but ML can capture non-linear relationships between variables (130–135). Another advantage is that ML models can continuously learn from new data, improving their accuracy and reliability over time (136–149, 161–168).
Our predictive models are accurate enough to be applied in practice. They take into account many preoperative findings to show postoperative changes in the corneal thickness. Future studies may use the same approach to build the models evidencing the efficiency of modified CXL protocols. The CXL technique has many modifications, and the analysis of the personal risk profile allows one to find the optimal intervention for the individual. Today's medicine can benefit from constructing high-performing predictive models that prognosticate treatment outcomes from preoperative findings. By improving prediction accuracy and personalizing treatment, AI can help optimize resource allocation and reduce unnecessary procedures or interventions (134, 149–153). Early and accurate predictions can lead to better patient outcomes, potentially reducing long-term healthcare costs (117, 154–156).
6 Conclusion
• The corneal thickness markedly drops after CXL. Transient thinning is a normal response to the treatment. The reasons behind the thinning are dehydration during surgery, keratocyte apoptosis, corneal healing, and remodeling. The postoperative changes in MCT are more pronounced, clinically relevant, and meaningful than in CCT. MCT should serve as the major clinical marker of corneal thinning after CXL.
• The postoperative changes in pachymetry tests largely depend on the disease stage. The cornea's potential to recover reduces in advanced KC. Linear and polynomial equations reveal different trends in the dynamics of corneal thickness after CXL. According to our data, the polynomial curve demonstrated the complex time-to-corneal-thickness association more reliably than the linear trendline. The findings reflect the natural course of corneal remodeling after CXL. It includes thinning immediately after CXL and stabilization with partial recovery of corneal thickness over time. MCT and CCT show progressive reduction throughout the first 20 months of observation. Afterwards, corneal thickening occurs, restoring baseline values at approximately 52 months post-surgery.
• The baseline pachymetry data can adequately reflect the intervention outcomes due to a marked association between pre- and postoperative corneal thickness, both central and minimal. Preoperative BAD deviation and topographic indices strongly correlate with the structural outcomes of CXL. Keratometry and refractometry data exhibit moderate associations with postoperative corneal thickness. The models trained on a combination of the top correlating features with clinical data and time after surgery provide the most reliable prognosis of postoperative CCT and MCT.
• BAD-Dt is a strong correlate and predictor of postoperative MCT since it indicates the thinnest point thickness of the cornea. Although used interchangeably, Dt and MCT may correlate negatively when the thinnest point is often displaced and located in the inferior-temporal region of ectatic corneas. BAD indices are the most reliable determinants of the corneal thickness after CXL. A high SHAP value of Dt serves as an explanation of the high predictive potential of this diagnostic modality.
• Preoperative topographic indices (CKI, KI, IHD, IVA) are among the top correlates of postoperative MCT; they are also an established tool for early detection and monitoring progression of KC. The predictive potential of topographic findings is slightly lower than BAD. In particular, IHD index captures vertical decentration and corneal asymmetry–the determinants of corneal thinning and remodeling after CXL. Higher IVA values indicate steeper inferior curvature, which is often associated with corneal thinning in the central regions.
• Corneal eccentricity is a keratometry finding that demonstrates a strong inverse association with CCT and MCT after CXL; it describes the rate of flattening from the center to the periphery of the cornea. The reliability of the models trained on keratometry readings is slightly lower than with the aforementioned diagnostic modalities. Keratometry findings describe surface shape but do not reflect how the cornea will respond structurally to CXL.
• Vision characteristics and refraction parameters describe the optical outcome of the disease. They show a loose correlation with pachymetry data, which explains the questionable performance of the models trained on the visiometry and refractometry findings.
Strength and limitations
The study possesses the following strengths:
• Previous studies primarily focused on how preoperative corneal thickness influences postoperative outcomes, including visual acuity and corneal stability. Our study modeled pachymetry values from four groups of features.
• ML prediction models allow physicians to prognosticate treatment outcomes with high precision. The presented statistical models predict postoperative changes in MCT more accurately than in CCT. The clinical value of models prognosticating MCT is also higher because this parameter provides a more direct measure of the corneal region most affected by ectatic changes in keratoconus.
• The study has a strong concept consistent with the principles of precision medicine. The findings advocate for a personalized approach to candidate selection for CXL. Personal risk assessment requires a thorough inspection of patients with pachymetry, visiometry, refractometry, and topography tests. Multimodal preoperative risk assessment provides accurate estimators of treatment efficiency.
The authors recognize the following limitations of this study:
• This study was conducted at a single center and involved a population of Eastern European descent with limited racial diversity. As a result, the findings may not be broadly applicable to other geographic regions or racial groups. Additional research is necessary to evaluate the effectiveness of CXL across different races.
• The retrospective design was another weakness of the research. It might introduce biases due to potential inconsistencies in data collection over time. Nevertheless, the results align with findings from prospective studies. For instance, similar relationships between pre- and postoperative pachymetry measurements have been reported in both retrospective (157) and prospective studies (158). While prospective data collection is ideal, it is often impractical for studying large populations or long-term treatment outcomes. In such cases, retrospective studies serve as valuable tools for investigating rare conditions and evaluating the delayed effects of treatments (159).
• The current study reveals models of corneal thickness after CXL. The equations we built demonstrate the minimal and central corneal thickness dynamics after CXL. The function approximation allows us to judge immediate and delayed outcomes. Still, the postoperative dynamics in pachymetry tests largely depend on the characteristics of the study cohort. In early stages, the cornea's potential to recover its thickness after CXL is vastly higher than in advanced stages of the disease. In addition, the long-term prognosis of MCT changes may be imperfect since the maximal observation period was approximately 50 months.
Data availability statement
The raw data supporting the conclusions of this article will be made available by the authors, without undue reservation.
Ethics statement
The studies involving humans were approved by Tawam Human Research Ethics Committee. The studies were conducted in accordance with the local legislation and institutional requirements. Written informed consent for participation was not required from the participants or the participants' legal guardians/next of kin in accordance with the national legislation and institutional requirements.
Author contributions
YS: Conceptualization, Methodology, Project administration, Supervision, Writing – original draft, Writing – review & editing. DS: Data curation, Investigation, Writing – original draft. RV: Formal analysis, Methodology, Visualization, Writing – review & editing. GS: Data curation, Investigation, Writing – review & editing. MP: Validation, Writing – review & editing. EL: Data curation, Validation, Writing – review & editing. AP: Validation, Writing – review & editing. PB: Conceptualization, Data curation, Validation, Writing – review & editing. DA: Validation, Writing – review & editing. FI: Project administration, Writing – review & editing. KN-V: Project administration, Writing – review & editing. ML: Conceptualization, Visualization, Writing – review & editing.
Funding
The author(s) declare that financial support was received for the research and/or publication of this article. The study was supported by ASPIRE, the technology program management pillar of Abu Dhabi's Advanced Technology Research Council (ATRC), via the ASPIRE Precision Medicine Research Institute Abu Dhabi (ASPIREPMRIAD) award grant number VRI-20-10.
Conflict of interest
MP, EL, AP, PB, and DA were employed by Voka.
The remaining authors declare that the research was conducted in the absence of any commercial or financial relationships that could be construed as a potential conflict of interest.
The author(s) declared that they were an editorial board member of Frontiers, at the time of submission. This had no impact on the peer review process and the final decision.
Publisher's note
All claims expressed in this article are solely those of the authors and do not necessarily represent those of their affiliated organizations, or those of the publisher, the editors and the reviewers. Any product that may be evaluated in this article, or claim that may be made by its manufacturer, is not guaranteed or endorsed by the publisher.
Abbreviations
Ast, corneal astigmatism; BAD, Belin/Ambrósio display; BCVA, best-corrected visual acuity; BFS, best-fit sphere; BIC, Bayesian information criterion; CCT, central corneal thickness; CKI, central keratoconus index; CT, corneal thickness; CXL, corneal collagen cross-linking; D, dioptre; Da, thinnest point displacement SD; Db, SD of changes in the back elevation; DT, Decision tree; Df, SD of changes in the front elevation; Dp, pachymetric progression SD; Dt, thinnest point thickness SD; Ecc, eccentricity of cornea; EBM, elevation back map; IHA, Index of height asymmetry; IHD, Index of height decentration; ISV, Index of surface variance; IVA, Index of vertical asymmetry; K1, flat corneal curvature; K2, steep corneal curvature; Kmax, maximal corneal curvature/maximum keratometry value; KC, keratoconus; KI, Keratoconus index; LB, LightBoost; MAE, mean absolute error; MCT, minimal corneal thickness; ML, machine learning; OCT, optical coherence tomography; RF, Random Forest; Rf, radius of K1; Rm, radius of Kmax; RMSE, root mean square error; ROV, range of values; Rper, average radius of curvature; Rs, radius of K2; Rmin, smallest radius of curvature; SD, standard deviation; UCVA, uncorrected visual acuity; XGB, XGBoost.
References
1. Santodomingo-Rubido J, Carracedo G, Suzaki A, Villa-Collar C, Vincent SJ, Wolffsohn JS. Keratoconus: an updated review. Cont Lens Anterior Eye. (2022) 45:101559. doi: 10.1016/j.clae.2021.101559
2. Hashemi H, Heydarian S, Hooshmand E, Saatchi M, Yekta A, Aghamirsalim M, et al. The prevalence and risk factors for keratoconus: a systematic review and meta-analysis. Cornea. (2020) 39:263–70. doi: 10.1097/ICO.0000000000002150
3. Gordon-Shaag A, Millodot M, Shneor E, Liu Y. The genetic and environmental factors for keratoconus. BioMed Res Internat. (2015) 2015:795738. doi: 10.1155/2015/795738
4. Quartilho A, Gore DM, Bunce C, Tuft SJ. Royston- Parmar flexible parametric survival model to predict the probability of keratoconus progression to corneal transplantation. Eye. (2020) 34:657–62. doi: 10.1038/s41433-019-0554-4
5. Augustin VA, Son HS, Baur I, Zhao L, Auffarth GU, Khoramnia R. Detecting subclinical keratoconus by biomechanical analysis in tomographically regular keratoconus fellow eyes. Eur J Ophthalmol. (2022) 32:815–22. doi: 10.1177/11206721211063740
6. Toprak I, YaylalıV, Yildirim C. A combination of topographic and pachymetric parameters in keratoconus diagnosis. Cont Lens Anterior Eye. (2015) 38:357–62. doi: 10.1016/j.clae.2015.04.001
7. Kymes SM, Walline JJ, Zadnik K, Gordon MO, Collaborative Longitudinal Evaluation of Keratoconus (CLEK) Study Group. Quality of life in keratoconus. Am J Ophthalmol. (2004) 138:527–35. doi: 10.1016/j.ajo.2004.04.031
8. Li Y, Chamberlain W, Tan O, Brass R, Weiss JL, Huang D. Subclinical keratoconus detection by pattern analysis of corneal and epithelial thickness maps with optical coherence tomography. J Cataract Refract Surg. (2016) 42:284–95. doi: 10.1016/j.jcrs.2015.09.021
9. Masiwa LE, Moodley V. A review of corneal imaging methods for the early diagnosis of pre-clinical Keratoconus. J Optom. (2020) 13:269–75. doi: 10.1016/j.optom.2019.11.001
10. Rubinfeld RS, Caruso C, Ostacolo C. Corneal cross-linking: the science beyond the myths and misconceptions. Cornea. (2019) 38:780–90. doi: 10.1097/ICO.0000000000001912
11. Matthaei M, Sandhaeger H, Hermel M, Adler W, Jun AS, Cursiefen C, et al. Changing indications in penetrating keratoplasty: a systematic review of 34 years of global reporting. Transplantation. (2017) 101:1387–99. doi: 10.1097/TP.0000000000001281
12. Lalgudi VG, Shetty R, Nischal KK, Ziai S, Koaik M, Sethu S. Biochemical and molecular alterations and potential clinical applications of biomarkers in keratoconus. Saudi J Ophthalmol. (2022) 36:7–16. doi: 10.4103/SJOPT.SJOPT_203_21
13. Miyakoshi A, Hayashi A, Oiwake T. Parameters of a basic ophthalmic examination that can ensure proper timing of corneal crosslinking in patients with keratoconus. Int Ophthalmol. (2023) 43:4797–802. doi: 10.1007/s10792-023-02881-1
14. Kobashi H, Rong SS. Corneal collagen cross-linking for keratoconus: systematic review. BioMed Res Int. (2017) 2017:8145651. doi: 10.1155/2017/8145651
15. Greenstein SA, Shah VP, Fry KL, Hersh PS. Corneal thickness changes after corneal collagen crosslinking for keratoconus and corneal ectasia: one-year results. J Cataract Refract Surg. (2011) 37:691–700. doi: 10.1016/j.jcrs.2010.10.052
16. Badawi AE, Abou Samra WA. Predictive factors of the standard cross-linking outcomes in adult keratoconus: one-year follow-up. J Ophthalmol. (2017) 2017:4109208. doi: 10.1155/2017/4109208
17. Kírgíz A, Atalay K, Çabuk KŞ, Kaldírím H, Taşkapĺ M. Factors affecting visual acuity after accelerated crosslinking in patients with progressive keratoconus. Arquivos Brasileiros de Oftalmologia. (2016) 79:151–154. doi: 10.5935/0004-2749.20160046
18. Lenk J, Herber R, Oswald C, Spoerl E, Pillunat LE, Raiskup F. Risk factors for progression of keratoconus and failure rate after corneal cross-linking. J Refract Surg. (2021) 37:816–23. doi: 10.3928/1081597X-20210830-01
19. Raiskup F, Theuring A, Pillunat LE, Spoerl E. Corneal collagen crosslinking with riboflavin and ultraviolet-A light in progressive keratoconus: ten-year results. J Cataract Refract Surg. (2015) 41:41–6. doi: 10.1016/j.jcrs.2014.09.033
20. Rechichi M, Mazzotta C, Daya S, Mencucci R, Lanza M, Meduri A. Intraoperative OCT pachymetry in patients undergoing dextran-free riboflavin UVA accelerated corneal collagen crosslinking. Curr Eye Res. (2016) 41:1310–5. doi: 10.3109/02713683.2015.1118130
21. Aixinjueluo W, Usui T, Miyai T, Toyono T, Sakisaka T, Yamagami S. Accelerated transepithelial corneal cross-linking for progressive keratoconus: a prospective study of 12 months. Br J Ophthalmol. (2017) 101:1244–9. doi: 10.1136/bjophthalmol-2016-309775
22. Atia R, Jouve L, Sandali O, Laroche L, Borderie V, Bouheraoua N. Early epithelial remodeling after standard and iontophoresis-assisted corneal cross-linking as evaluated by spectral-domain optical coherence tomography. J Refract Surg. (2018) 34:551–8. doi: 10.3928/1081597X-20180702-01
23. Mazzotta C, Bagaglia SA, Vinciguerra R, Ferrise M, Vinciguerra P. Enhanced-fluence pulsed-light iontophoresis corneal cross-linking: 1-year morphological and clinical results. J Refract Surg. (2018) 34:438–44. doi: 10.3928/1081597X-20180515-02
24. Mazzotta C, Sgheri A, Bagaglia SA, Rechichi M, Di Maggio A. Customized corneal crosslinking for treatment of progressive keratoconus: clinical and OCT outcomes using a transepithelial approach with supplemental oxygen. J Refract Surg. (2020) 46:1582–7. doi: 10.1097/j.jcrs.0000000000000347
25. Mazzotta C, Ferrise M, Gabriele G, Gennaro P, Meduri A. Chemically-boosted corneal cross-linking for the treatment of keratoconus through a riboflavin 0.25% optimized solution with high superoxide anion release. J Clini Med. (2021) 10:1324. doi: 10.3390/jcm10061324
26. De Rosa G, Rossi S, Santamaria C, Boccia R, De Rosa L, D'Alterio FM, et al. Combined photorefractive keratectomy and corneal collagen cross-linking for treatment of keratoconus: a 2-year follow-up study. Therapeut Adv Ophthalmol. (2022) 14:25158414221083362. doi: 10.1177/25158414221083362
27. Moghadam RS, Akbari M, Alizadeh Y, Medghalchi A, Dalvandi R. The outcome of corneal collagen cross-linking in patients with advanced progressive keratoconus: a 2-year follow-up study. Middle East Afr J Ophthalmol. (2019) 26:11–6. doi: 10.4103/meajo.MEAJO_101_18
28. Wu H, Li L, Luo S, Fang X, Shang X, Xie Z, et al. Safety and efficacy of repeated crosslinking assisted by transepithelial double-cycle iontophoresis in keratoconus progression after primary corneal crosslinking. Eye. (2021) 35:3020–7. doi: 10.1038/s41433-020-01365-1
29. Sangah AB, Kumari J, Mumtaz H, Hasan M. Outcomes of corneal topographical Kmax readings 3 months after corneal cross linkage in keratoconus patients. J Commun Hosp Intern Med Persp. (2022) 12:43. doi: 10.55729/2000-9666.1111
30. Vinciguerra R, Pagano L, Borgia A, Montericcio A, Legrottaglie EF, Piscopo R, et al. Corneal cross-linking for progressive keratoconus: up to 13 years of follow-up. J Refract Sur. (2020) 36:838–43. doi: 10.3928/1081597X-20201021-01
31. Hersh PS, Stulting RD, Muller D, Durrie DS, Rajpal RK, Binder PS, et al. United States multicenter clinical trial of corneal collagen crosslinking for keratoconus treatment. Ophthalmology. (2017) 124:1259–70. doi: 10.1016/j.ophtha.2017.03.052
32. Greenstein SA, Hersh PS. Corneal crosslinking for progressive keratoconus and corneal ectasia: summary of US multicenter and subgroup clinical trials. Transl Vision Sci Technol. (2021) 10:13–13. doi: 10.1167/tvst.10.5.13
33. Kandel H, Abbondanza M, Gupta A, Mills R, Watson AS, Petsoglou C, et al. Comparison of standard versus accelerated corneal collagen cross-linking for keratoconus: 5-year outcomes from the Save Sight Keratoconus Registry. Eye. (2024) 38:95–102. doi: 10.1038/s41433-023-02641-6
34. Caroline AMA Patrick J, Norman CW. Corneal Topography in Keratoconus. (1997). Available online at: https://www.clspectrum.com/issues/1997/july/corneal-topography-in-keratoconus (accessed January 03, 2025).
35. Rabinowitz YS. Diagnosing keratoconus and patients at risk. Cataract Refract Surg Today. (2007) 2007:85–7.
36. Caroline PJ, Norman CW. Corneal topography in the diagnosis and management of keratoconus. In: Corneal Topography: Measuring and Modifying the Cornea. Cham: Springer (1992). p. 75–93.
37. Vieira MIS, Jammal AA, Arieta CEL, Alves M, de Vasconcellos JPC. Corneal Scheimpflug topography values to distinguish between normal eyes, ocular allergy, and keratoconus in children. Sci Rep. (2021) 11:24275. doi: 10.1038/s41598-021-03818-3
38. Song J. Sizing Up Keratoconus: the Roles of Topography and Tomography. (2024). Available online at: https://www.reviewofoptometry.com/article/sizing-up-keratoconus-the-roles-of-topography-and-tomography (accessed January 03, 2025).
39. Hashemi H, Beiranvand A, Yekta A, Maleki A, Yazdani N, Khabazkhoob M. Pentacam top indices for diagnosing subclinical and definite keratoconus. J Curr Ophthalmol. (2016) 28:21–6. doi: 10.1016/j.joco.2016.01.009
40. Doctor K, Vunnava KP, Shroff R, Kaweri L, Lalgudi VG, Gupta K, et al. Simplifying and understanding various topographic indices for keratoconus using Scheimpflug based topographers. Indian J Ophthalmol. (2020) 68:2732. doi: 10.4103/ijo.IJO_2111_20
41. Motlagh MN, Moshirfar M, Murri MS, Skanchy DF, Momeni-Moghaddam H, Ronquillo YC, et al. Pentacam corneal tomography for screening of refractive surgery candidates: a review of the literature, part I. Med Hypothesis Discov Innov Ophthalmol. (2019) 8:177–203.
42. de Sanctis U, Aragno V, Dalmasso P, Brusasco L, Grignolo F. Diagnosis of subclinical keratoconus using posterior elevation measured with 2 different methods. Cornea. (2013) 32:911–5. doi: 10.1097/ICO.0b013e3182854774
43. De Sanctis U, Loiacono C, Richiardi L, Turco D, Mutani B, Grignolo FM. Sensitivity and specificity of posterior corneal elevation measured by Pentacam in discriminating keratoconus/subclinical keratoconus. Ophthalmology. (2008) 115:1534–9. doi: 10.1016/j.ophtha.2008.02.020
44. Belin MW, Khachikian SS. Keratoconus: it is hard to define, but Am J Ophthalmol. (2007) 143:500–3. doi: 10.1016/j.ajo.2006.12.030
45. Khachikian SS, Belin MW. Posterior elevation in keratoconus. Ophthalmology. (2009) 116:816–816. doi: 10.1016/j.ophtha.2009.01.009
46. Keratoconus Classification Systems. Available online at: https://entokey.com/keratoconus-classification-systems/ (accessed January 05, 2025).
47. Giannaccare G, Murano G, Carnevali A, Yu AC, Vaccaro S, Scuteri G, et al. Comparison of amsler-krumeich and sandali classifications for staging eyes with keratoconus. Appl Sci. (2021) 11:4007. doi: 10.3390/app11094007
48. Belin M, Duncan J. Keratoconus: the ABCD grading system. Klin Monbl Augenheilkd. (2016) 233:701–7. doi: 10.1055/s-0042-100626
49. Belin MW, Kundu G, Shetty N, Gupta K, Mullick R, Thakur P, et al. A new classification for keratoconus. Indian J Ophthalmol. (2020) 68:2831–4. doi: 10.4103/ijo.IJO_2078_20
50. Muftuoglu O, Ayar O, Ozulken K, Ozyol E, AkincıA. Posterior corneal elevation and back difference corneal elevation in diagnosing forme fruste keratoconus in the fellow eyes of unilateral keratoconus patients. J Refract Surg. (2013) 39:1348–57. doi: 10.1016/j.jcrs.2013.03.023
51. Jonnazarov EI, Avetisov SE, Cervatiuc MI. Improvement of the visual acuity assessment system in deaf-mute children. Chin J Exp Ophthalmol. (2022) 40:1062–70. doi: 10.3760/cma.j.cn115989-20220512-00212
52. Wollensak G, Spoerl E, Seiler T. Riboflavin/ultraviolet-A-induced collagen crosslinking for the treatment of keratoconus. Am J Ophthalmol. (2003) 135:620–7. doi: 10.1016/S0002-9394(02)02220-1
53. Sedaghat M, Bagheri M, Ghavami S, Bamdad S. Changes in corneal topography and biomechanical properties after collagen cross linking for keratoconus: 1-year results. Middle East Afr J Ophthalmol. (2015) 22:212–9. doi: 10.4103/0974-9233.151877
54. Hafezi F, Mrochen M, Iseli HP, Seiler T. Collagen crosslinking with ultraviolet-A and hypoosmolar riboflavin solution in thin corneas. J Refract Surg. (2009) 35:621–4. doi: 10.1016/j.jcrs.2008.10.060
55. Feldman BH, Bunya VY, Santos M, Halfpenny C, Hong A. Techniques for Corneal Collagen Crosslinking: Epi-off vs Epi-on. Available online at: https://eyewiki.org/Techniques_for_Corneal_Collagen_Crosslinking:_Epi-off_vs_Epi-on#cite_note-:1-3 (accessed 20 December 2024).
56. Hersh PS, Greenstein SA, Fry KL. Corneal collagen crosslinking for keratoconus and corneal ectasia: one-year results. J Refract Surg. (2011) 37:149–60. doi: 10.1016/j.jcrs.2010.07.030
57. Wittig-Silva C, Chan E, Islam FM, Wu T, Whiting M, Snibson GR, et al. Randomized, controlled trial of corneal collagen cross-linking in progressive keratoconus: three-year results. Ophthalmology. (2014) 121:812–21. doi: 10.1016/j.ophtha.2013.10.028
58. Kavadarli I, Kaya V. Minimum stromal thickness for corneal collagen crosslinking. J Refract Surg. (2015) 41:250–1. doi: 10.1016/j.jcrs.2014.11.003
59. Quintanilla MGG, Valdez LGV, Zavala J, Valdez JE. Central corneal thickness and minimum corneal thickness difference analysis in keratoconus patients based on optical coherence tomography. Investigat Ophthalmol Visual Sci. (2020) 61:2594–2594.
60. Hashemi H, Heidari Z, Mohammadpour M, Momeni-Moghaddam H, Khabazkhoob M. Distribution pattern of total corneal thickness in keratoconus versus normal eyes using an optical coherence tomography. J Curr Ophthalmol. (2022) 34:216–22. doi: 10.4103/joco.joco_198_21
61. Blackburn BJ, Jenkins MW, Rollins AM, Dupps WJ. A review of structural and biomechanical changes in the cornea in aging, disease, and photochemical crosslinking. Front Bioeng Biotechnol. (2019) 7:66. doi: 10.3389/fbioe.2019.00066
62. Sarma P, Kaur H, Hafezi F, Bhattacharyya J, Kirubakaran R, Prajapat M, et al. Short-and long-term safety and efficacy of corneal collagen cross-linking in progressive keratoconus: a systematic review and meta-analysis of randomized controlled trials. Taiwan J Ophthalmol. (2023) 13:191–202. doi: 10.4103/2211-5056.361974
63. Ghiasian L, Abdolalizadeh P, Hadavandkhani A, Eshaghi A, Hadi Y, Nadjafi-Semnani F. Comparing pentacam HR screening indices in different normal corneal thicknesses among refractive surgery candidates. J Curr Ophthalmol. (2022) 34:200. doi: 10.4103/joco.joco_249_21
64. John AK, Asimellis G. Revisiting keratoconus diagnosis and progression classification based on evaluation of corneal asymmetry indices, derived from Scheimpflug imaging in keratoconic and suspect cases. Clini Ophthalmol. (2013) 7:1539–48. doi: 10.2147/OPTH.S44741
65. Herber R, Lenk J, Ramm L, Wittig D, Patzner MM, Pillunat LE, et al. Evaluation of indices for the assessment and classification of keratoconus based on optical coherence tomography and Scheimpflug technology. Ophthalmic Physiolog Optics. (2024). doi: 10.1111/opo.13425
67. Sridhar U, Tripathy, K. Corneal Topography. (2023). Available online at: https://www.ncbi.nlm.nih.gov/books/NBK585055/?utm_source=chatgptcomnOtitle=CornealTopography (accessed March 20, 2025).
68. Agarwal R, Jain P, Arora R. Complications of corneal collagen cross-linking. Indian J Ophthalmol. (2022) 70:1466–74. doi: 10.4103/ijo.IJO_1595_21
69. Kasumovic SS, Mavija M, Kasumovic A, Lepara O, Duric-Colic B, Cabric E, et al. Intraocular pressure measurements referring to the corneal thickness in keratoconic eyes after corneal crosslinking with riboflavin and ultraviolet A. Med Arch. (2015) 69:334. doi: 10.5455/medarh.2015.69.334-338
70. AlQahtani BS, Alshahrani S, Khayyat WW, Abdalla-Elsayed ME, Altalhi AA, Saifaldein AA, et al. Outcomes of corneal topography among progressive keratoconus Patients 12 months following corneal collagen cross-linking. Clini Ophthalmol. (2021) 15:49–55. doi: 10.2147/OPTH.S284981
71. Cagini C, Di Lascio G, Messina M, Riccitelli F, Dua H. Correlation of central and peripheral keratometric parameters after corneal collagen cross-linking in keratoconus patients. Int Ophthalmol. (2019) 39:2041–8. doi: 10.1007/s10792-018-1041-9
72. Toprak I, YaylalıV, Yildirim C. Factors affecting outcomes of corneal collagen crosslinking treatment. Eye. (2014) 28:41–6. doi: 10.1038/eye.2013.224
73. Subasinghe SK, Ogbuehi KC, Mitchell L, Dias GJ. Morphological alterations of the cornea following crosslinking treatment (CXL). Clini Anatomy. (2021) 34:859–66. doi: 10.1002/ca.23728
74. Godefrooij DA, Boom K, Soeters N, Imhof SM, Wisse RP. Predictors for treatment outcomes after corneal crosslinking for keratoconus: a validation study. Int Ophthalmol. (2017) 37:341–8. doi: 10.1007/s10792-016-0262-z
75. Koc M, Uzel MM, Tekin K, Kosekahya P, Ozulken K, Yilmazbas P. Effect of preoperative factors on visual acuity, corneal flattening, and corneal haze after accelerated corneal crosslinking. J Refract Surg. (2016) 42:1483–9. doi: 10.1016/j.jcrs.2016.08.017
76. Ueno Y, Hiraoka T, Miyazaki M, Ito M, Oshika T. Corneal thickness profile and posterior corneal astigmatism in normal corneas. Ophthalmology. (2015) 122:1072–8. doi: 10.1016/j.ophtha.2015.01.021
77. Kuechler SJ, Tappeiner C, Epstein D, Frueh BE. Keratoconus progression after corneal cross-linking in eyes with preoperative maximum keratometry values of 58 diopters and steeper. Cornea. (2018) 37:1444–8. doi: 10.1097/ICO.0000000000001736
78. Steinberg J, Ahmadiyar M, Rost A, Frings A, Filev F, Katz T, et al. Anterior and posterior corneal changes after crosslinking for keratoconus. Optomet Vision Sci. (2014) 91:178–86. doi: 10.1097/OPX.0000000000000141
79. Nattis A, Donnenfeld ED, Rosenberg E, Perry HD. Visual and keratometric outcomes of keratoconus patients after sequential corneal crosslinking and topography-guided surface ablation: early United States experience. J Refract Surg. (2018) 44:1003–11. doi: 10.1016/j.jcrs.2018.05.020
80. Ozek D, Karaca EE, Kemer OE. Accelerated corneal cross-linking with hypo-osmolar riboflavin in thin keratoconic corneas: 2-year follow-up. Arq Bras Oftalmol. (2020) 83:277–82. doi: 10.5935/0004-2749.20200049
81. Patel S, Tutchenko L. The refractive index of the human cornea: a review. Cont Lens Anterior Eye. (2019) 42:575–80. doi: 10.1016/j.clae.2019.04.018
82. Wajnsztajn D, Shmueli O, Zur K, Frucht-Pery J, Solomon A. Predicting factors for the efficacy of cross-linking for keratoconus. PLoS ONE. (2022) 17:e0263528. doi: 10.1371/journal.pone.0263528
83. Cunha AM, Correia PJ, Alves H., Torr ao L, Moreira R, Falc ao-Reis F, et al. Keratoconus enlargement as a predictor of keratoconus progression. Scientif Reports. (2021) 11:21079. doi: 10.1038/s41598-021-00649-0
84. Hamida Abdelkader SM., Fernández J, Sebastián J, Pi nero DP. Preliminary characterization of predictive factors of the visual change after epi-on and epi-off corneal collagen crosslinking techniques. J Ophthalmol. (2021) 2021:9680253. doi: 10.1155/2021/9680253
85. Niazi S, Del Barrio JA, Sanginabadi A, Doroodgar F, Alinia C, Baradaran-Rafii A, et al. Topography versus non-topography-guided photorefractive keratectomy with corneal cross-linking variations in keratoconus. Int J Ophthalmol. (2022) 15:721.
86. Cortinhal T, Gil J, Rosa A, Quadrado MJ, Murta J. Topography-guided corneal crosslinking for keratoconus: is it enough to treat the cone? Revista Sociedade Portuguesa de Oftalmologia. (2024) 48:23–8. doi: 10.48560/rspo.28285
87. Ambrósio Jr R, Alonso RS, Luz A, Velarde LGC. Corneal-thickness spatial profile and corneal-volume distribution: tomographic indices to detect keratoconus. J Refract Surg. (2006) 32:1851–9. doi: 10.1016/j.jcrs.2006.06.025
88. Pjano MA, Biscevic A, Grisevic S, Gabric I, Salkica AS, Ziga N. Pachymetry and elevation back map changes in keratoconus patients after crosslinking procedure. Med Arch. (2020) 74:105. doi: 10.5455/medarh.2020.74.105-108
89. Chan TC, Tsui RW, Chow VW, Lam JK, Wong VW, Wan KH. Accelerated corneal collagen cross-linking in progressive keratoconus: five-year results and predictors of visual and topographic outcomes. Indian J Ophthalmol. (2022) 70:2930. doi: 10.4103/ijo.IJO_2778_21
90. Chesnaye NC, van Diepen M, Dekker F, Zoccali C, Jager KJ, Stel VS. Non-linear relationships in clinical research. Nephrol Dialysis Transplantat. (2024) 40:244–54. doi: 10.1093/ndt/gfae187
91. Holopainen JM, Krootila K. Transient corneal thinning in eyes undergoing corneal cross-linking. Am J Ophthalmol. (2011) 152:533–6. doi: 10.1016/j.ajo.2011.03.023
92. Sağlík A, Özcan G, Uçakhan Ö. Risk factors for progression following corneal collagen crosslinking in keratoconus. Int Ophthalmol. (2021) 41:3443–9. doi: 10.1007/s10792-021-01908-9
93. Tang Y, Song W, Qiao J, Rong B, Wu Y, Yan X, et al. A study of corneal structure and biomechanical properties after collagen crosslinking with genipin in rabbit corneas. Mol Vis. (2019) 25:574–582.
94. Kling S, Richoz O, Hammer A, Tabibian D, Jacob S, Agarwal A, et al. Increased biomechanical efficacy of corneal cross-linking in thin corneas due to higher oxygen availability. J Refract Surg. (2015) 31:840–6. doi: 10.3928/1081597X-20151111-08
95. Sedaghat MR, Momeni-Moghaddam H, Kangari H, Moradi A, Akbarzadeh R, Naroo SA. Changes in corneal biomechanical parameters in keratoconus eyes with various severities after corneal cross-linking (CXL): a comparative study. Eur J Ophthalmol. (2023) 33:2114–22. doi: 10.1177/11206721231171419
96. Feng R, Xu Z, Zheng X, Hu H, Jin X, Chen DZ, et al. KerNet: a novel deep learning approach for keratoconus and sub-clinical keratoconus detection based on raw data of the Pentacam HR system. IEEE J Biomed Health Inform. (2021) 25:3898–910. doi: 10.1109/JBHI.2021.3079430
97. Efron N, Hollingsworth JG. New perspectives on keratoconus as revealed by corneal confocal microscopy. Clini Exp Optomet. (2008) 91:34–55. doi: 10.1111/j.1444-0938.2007.00195.x
98. Patel DV, McGhee CN. Mapping the corneal sub-basal nerve plexus in keratoconus by in vivo laser scanning confocal microscopy. Investigat Ophthalmol Visual Sci. (2006) 47:1348–51. doi: 10.1167/iovs.05-1217
99. Ku JY, Niederer RL, Patel DV, Sherwin T, McGhee CN. Laser scanning in vivo confocal analysis of keratocyte density in keratoconus. Ophthalmology. (2008) 115:845–50. doi: 10.1016/j.ophtha.2007.04.067
100. Mencucci R, Marini M, Paladini I, Sarchielli E, Sgambati E, Menchini U, et al. Effects of riboflavin/UVA corneal cross-linking on keratocytes and collagen fibres in human cornea. Clini Exp Ophthalmol. (2010) 38:49–56. doi: 10.1111/j.1442-9071.2010.02207.x
101. Germann JA, Martínez-Enríquez E, Martínez-García MC, Kochevar IE, Marcos S. Corneal collagen ordering after in vivo rose bengal and riboflavin cross-linking. Investigat Ophthalmol Visual Sci. (2020) 61:28–28. doi: 10.1167/iovs.61.3.28
102. Alenezi B, Kazaili A, Akhtar R, Radhakrishnan H. Corneal biomechanical properties following corneal cross-linking: does age have an effect? Exp Eye Res. (2022) 214:108839. doi: 10.1016/j.exer.2021.108839
103. Hatami-Marbini H, Rahimi A. The relation between hydration and mechanical behavior of bovine cornea in tension. J Mech Behav Biomed Mater. (2014) 36:90–7. doi: 10.1016/j.jmbbm.2014.03.011
104. Sharif R, Hjortdal J, Sejersen H, Frank G, Karamichos D. Human in vitro model reveals the effects of collagen cross-linking on keratoconus pathogenesis. Sci Rep. (2017) 7:12517. doi: 10.1038/s41598-017-12598-8
105. Hatami-Marbini H, Rahimi A. Interrelation of hydration, collagen cross-linking treatment, and biomechanical properties of the cornea. Curr Eye Res. (2016) 41:616–22. doi: 10.3109/02713683.2015.1042546
106. Rodríguez-López R, Webb JN, Erdi M, Kofinas P, Franco W, Zhang H, et al. Determining the relationship between corneal stiffening and tissue dehydration after corneal cross-linking. Investigat Ophthalmol Visual Sci. (2024) 65:14. doi: 10.1167/iovs.65.13.14
107. Price MO, Mehta JS, Jurkunas UV, Price Jr FW. Corneal endothelial dysfunction: Evolving understanding and treatment options. Prog Retin Eye Res. (2021) 82:100904. doi: 10.1016/j.preteyeres.2020.100904
108. Razmjoo H, Ghoreishi SM, Mohammadi Z, Salam H, Nasrollahi K, Peyman A. Comparison of the findings of endothelial specular microscopy before and after corneal cross-linking. Adv Biomed Res. (2015) 4:52. doi: 10.4103/2277-9175.151567
109. McKay TB, Priyadarsini S, Karamichos D. Mechanisms of collagen crosslinking in diabetes and keratoconus. Cells. (2019) 8:1239. doi: 10.3390/cells8101239
110. Brown SE, Simmasalam R, Antonova N, Gadaria N, Asbell PA. Progression in keratoconus and the effect of corneal cross-linking on progression. Eye Contact Lens. (2014) 40:331–8. doi: 10.1097/ICL.0000000000000085
111. Wisse RP, Godefrooij DA, Soeters N, Imhof SM, Van der Lelij A. A multivariate analysis and statistical model for predicting visual acuity and keratometry one year after cross-linking for keratoconus. Am J Ophthalmol. (2014) 157:519–25. doi: 10.1016/j.ajo.2013.11.001
112. Hatch W, El-Defrawy S, Tone SO, Stein R, Slomovic AR, Rootman DS, et al. Accelerated corneal cross-linking: efficacy, risk of progression, and characteristics affecting outcomes. A large, single-center prospective study. Am J ophthalmol. (2020) 213:76–87. doi: 10.1016/j.ajo.2020.01.006
113. Liu Y, Shen D, Wang Hy, Qi My, Zeng Qy. Development and validation to predict visual acuity and keratometry two years after corneal crosslinking with progressive keratoconus by machine learning. Front Med. (2023) 10:1146529. doi: 10.3389/fmed.2023.1146529
114. Li Y, Qiao C, Wang H, Liu Y, Qi M, Ke L, et al. Prediction model for treatment outcomes 3 years after corneal cross-linking for keratoconus. Int Ophthalmol. (2024) 44:382. doi: 10.1007/s10792-024-03301-8
115. Shetty R, Kundu G, Narasimhan R, Khamar P, Gupta K, Singh N, et al. Artificial intelligence efficiently identifies regional differences in the progression of tomographic parameters of keratoconic corneas. J Refract Surg. (2021) 37:240–8. doi: 10.3928/1081597X-20210120-01
116. Choi JA, Kim MS. Progression of keratoconus by longitudinal assessment with corneal topography. Investigat Ophthalmol Visual Sci. (2012) 53:927–35. doi: 10.1167/iovs.11-8118
117. Kuznetsov N, Habuza T, Zaki N, Ljubisavljevic M, Ismail F, Qandil D, et al. Differentiation between Alzheimer's and non-Alzheimer'dementia with recently proposed marker “deviation from model of normal ageing”. J Neurol Sci. (2023) 455:121411. doi: 10.1016/j.jns.2023.121411
118. Smetanina D, Habuza T, Zaki N, Qandil D, Ismail F, Ljubisavljevic M, et al. Prognostication of MCI-to-dementia conversion with recently proposed marker “deviation from model of normal ageing”. J Neurol Sci. (2023) 455:121459. doi: 10.1016/j.jns.2023.121459
119. Smetanina D, Habuza T, Meribout S, Simiyu G, Ismail F, Al Zahmi F, et al. Individual and environmental risks in stroke: correlation of demographics and meteorological variables with ischemic stroke incidence. J Neurol Sci. (2023) 455:122437. doi: 10.1016/j.jns.2023.122437
120. Statsenko Y, Meribout S, Habuza T, Smetanina D, Simiyu G, Ismail F, et al. Structure-function association patterns of the brain in individuals with different level of cognitive impairment. J Neurol Sci. (2023) 455:121462. doi: 10.1016/j.jns.2023.121462
121. Smetanina D, Habuza T, Meribout S, Simiyu G, Ismail F, Al Zahmi F, et al. Impact of weather and clinicodemographic parameters on ischemic stroke severity. J Neurol Sci. (2023) 455:122438. doi: 10.1016/j.jns.2023.122438
122. Meribout S, Habuza T, Smetanina D, Simiyu G, Ismail F, Gorkom K, et al. Architecture of multimodal diagnostic system for detecting MCI and Alzheimer's dementia. J Neurol Sci. (2023) 455:121425. doi: 10.1016/j.jns.2023.121425
123. Meribout S, Habuza T, Smetanina D, Simiyu G, Ismail F, Gorkom K, et al. Functional changes in age-related neurocognitive slowing and disease-related cognitive decline: evidence from global cognitive tests and psychophysiological tests. J Neurol Sci. (2023) 455:121424. doi: 10.1016/j.jns.2023.121424
124. Meribout S, Habuza T, Smetanina D, Simiyu G, Ismail F, Gorkom K, et al. Rate and onset of cognitive decline and cortical atrophy in normal and pathological ageing. J Neurol Sci. (2023) 455:121426. doi: 10.1016/j.jns.2023.121426
125. Habuza T, Zaki N, Statsenko Y, Elyassami S. MRI and cognitive tests-based screening tool for dementia. J Neurol Sci. (2021) 429:118964. doi: 10.1016/j.jns.2021.118964
126. Statsenko Y, Habuza T, Uzianbaeva L, Gorkom K, Belghali M, Charykova I, et al. Correlation between lifelong dynamics of psychophysiological performance and brain morphology. Neuroradiology. (2021) 63:41–2. doi: 10.26226/morressier.614222d287a68d83cb5d41e7
127. Habuza T, Statsenko Y, Uzianbaeva L, Gorkom K, Zaki N, Belghali M, et al. Models of brain cognitive and morphological changes across the life: machine learning-based approach. Neuroradiology. (2021) 63:10–26226. doi: 10.26226/morressier.614222d287a68d83cb5d41e8
128. Gorkom K, Statsenko Y, Habuza T, Uzianbaeva L, Belghali M, Charykova I, et al. Comparison of brain volumetric changes with functional outcomes in physiologic brain aging. Neuroradiology. (2021) 63:43–44.
129. Habuza T, Zaki N, Statsenko Y, Alnajjar F, Elyassami S. Predicting the diagnosis of dementia from MRI data: added value to cognitive tests. In: The 7th Annual International Conference on Arab Women in Computing in Conjunction with the 2nd Forum of Women in Research; 2021 Aug 25-26; Sharjah, UAE. New York, NY: Association for Computing Machinery (2021). p. 1–7. doi: 10.1145/3485557.3485564
130. Statsenko Y, Babushkin V, Talako T, King F, Smetanina D, Meribout S, et al. Architecture of a model for epileptic seizure detection and classification from EEG recordings. J Neurol Sci. (2023) 455:121580. doi: 10.1016/j.jns.2023.121580
131. Meribout S, Babushkin V, Talako T, King F, Smetanina D, Ismail F, et al. Differentiation between seizure types with source reconstruction technique applied to scalp EEG findings. J Neurol Sci. (2023) 455:121554. doi: 10.1016/j.jns.2023.121554
132. Statsenko Y, Smetanina D, Habuza T, Meribout S, Simiyu G, Ismail F, et al. Prediction of ischemic stroke outcomes from clinicodemographic risks and atmospheric data. J Neurol Sci. (2023) 455:122444. doi: 10.1016/j.jns.2023.122444
133. Statsenko Y, Habuza T, Fursa E, Ponomareva A, Almansoori TM, Al Zahmi F, et al. Prognostication of incidence and severity of ischemic stroke in hot dry climate from environmental and non-environmental predictors. IEEE Access. (2022) 10:58268–86. doi: 10.1109/ACCESS.2022.3175302
134. Statsenko Y, Fursa E, Laver V, Altakarli N, Almansoori T, Al Zahmi F, et al. Prediction of early functional outcomes of hemorrhagic stroke. J Neurol Sci. (2021) 429:118732. doi: 10.1016/j.jns.2021.118732
135. Statsenko Y, Fursa E, Laver V, Altakarli N, Almansoori T, Al Zahmi F, et al. Risk stratification and prediction of severity of hemorrhagic stroke in dry desert climate-a retrospective cohort study in eastern region of Abu Dhabi emirate. J Neurol Sci. (2021) 429:117760. doi: 10.1016/j.jns.2021.117760
136. Statsenko Y, Kuznetsov N, Smetanina D, Habuza T, Meribout S, Simiyu G, et al. Genetic psychophysiology in sports: Patterns of gene-behavior associations in elite athletes. J Neurol Sci. (2023) 455:121137. doi: 10.1016/j.jns.2023.121137
137. Kuznetsov N, Smetanina D, Habuza T, Meribout S, Simiyu G, Ismail F, et al. Association between genes and psychophysiological phenotypes in distinct sports categories. J Neurol Sci. (2023) 455:121940. doi: 10.1016/j.jns.2023.121940
138. Smetanina D, Talako T, King F, Meribout S, Babushkin V, Ismail F, et al. Effect of spatial resolution of EEG recordings on accuracy of automatic detection and classification of epileptic episodes. J Neurol Sci. (2023) 455:121578. doi: 10.1016/j.jns.2023.121578
139. Smetanina D, Meribout S, Habuza T, Simiyu G, Ismail F, Zareba K, et al. Reference curves of age-related volumetric changes in hippocampus and brain ventricles in healthy population. J Neurol Sci. (2023) 455:121995. doi: 10.1016/j.jns.2023.121995
140. Meribout S, Babushkin V, Talako T, King F, Smetanina D, Ismail F, et al. Impact of EEG sampling frequency on the accuracy of automatic seizure detection and classification with DL algorithms. J Neurol Sci. (2023) 455:121104. doi: 10.1016/j.jns.2023.121104
141. Kuznetsov N, Smetanina D, Habuza T, Meribout S, Simiyu G, Ismail F, et al. Interplay between genetic polymorphisms and psychological status of athletes in various sports. J Neurol Sci. (2023) 455:121939. doi: 10.1016/j.jns.2023.121939
142. Statsenko Y, Babushkin V, Talako T, Habuza T, King F, Smetanina D, et al. Application of interpretable machine learning techniques to automatic seizure detection and classification. J Neurol Sci. (2023) 455:121581. doi: 10.1016/j.jns.2023.121581
143. Statsenko Y, Babushkin V, Talako T, Kurbatova T, Smetanina D, Simiyu GL, et al. Automatic detection and classification of epileptic seizures from EEG data: finding optimal acquisition settings and testing interpretable machine learning approach. Biomedicines. (2023) 11:2370. doi: 10.3390/biomedicines11092370
144. Statsenko Y, Habuza T, Smetanina D, Simiyu GL, Uzianbaeva L, Neidl-Van Gorkom K, et al. Brain morphometry and cognitive performance in normal brain aging: age-and sex-related structural and functional changes. Front Aging Neurosci. (2022) 13:713680. doi: 10.3389/fnagi.2021.713680
145. Statsenko Y, Habuza T, Gorkom KNV, Zaki N, Almansoori TM, Al Zahmi F, et al. Proportional changes in cognitive subdomains during normal brain aging. Front Aging Neurosci. (2021) 13:673469. doi: 10.3389/fnagi.2021.673469
146. Statsenko Y, Habuza T, Charykova I, Gorkom K, Zaki N, Almansoori T, et al. AI models of age-associated changes in CNS composition identified by MRI. J Neurol Sci. (2021) 429:118303. doi: 10.1016/j.jns.2021.118303
147. Statsenko Y, Habuza T, Charykova I, Gorkom K, Zaki N, Almansoori T, et al. Predicting cognitive age for screening for neurodegeneration. J Neurol Sci. (2021) 429:118994. doi: 10.1016/j.jns.2021.118994
148. Uzianbaeva L, Statsenko Y, Habuza T, Gorkom K, Belghali M, Charykova I, et al. Effects of sex age-related changes in brain morphology. In: Proceedings of the 44th annual meeting of European Society of Neuroradiology. Geneva; Berlin: Springer (2021) 63:S42–S43. doi: 10.1007/s00234-021-02791-y
149. Statsenko Y, Habuza T, Meribout S, Gorkom K, Almansoori T, Zahmi F, et al. Radiomics and machine learning in predicting pathophysiologic changes in patients with COVID-19-associated pneumonia. In: Insights into Imaging, Vol. 13. European Congress of Radiology; 2022 March 2-6; Vienna, Austria. Berlin: Springer (2022). p. 96. doi: 10.1186/s13244-022-01337-x
150. Statsenko Y, Habuza T, Talako T, Kurbatova T, Simiyu GL, Smetanina D, et al. Reliability of machine learning in eliminating data redundancy of radiomics and reflecting pathophysiology in COVID-19 pneumonia: impact of CT reconstruction kernels on accuracy. IEEE Access. (2022) 10:120901–21. doi: 10.1109/ACCESS.2022.3211080
151. Statsenko Y, Habuza T, Talako T, Pazniak M, Likhorad E, Pazniak A, et al. Deep learning-based automatic assessment of lung impairment in COVID-19 pneumonia: Predicting markers of hypoxia with computer vision. Front Med. (2022) 9:882190. doi: 10.3389/fmed.2022.882190
152. Al Zahmi F, Habuza T, Awawdeh R, Elshekhali H, Lee M, Salamin N, et al. Ethnicity-specific features of COVID-19 among arabs, africans, South asians, East asians, and caucasians in the United Arab Emirates. Front Cell Infect Microbiol. (2022) 11:773141. doi: 10.3389/fcimb.2021.773141
153. Statsenko Y, Al Zahmi F, Habuza T, Almansoori TM, Smetanina D, Simiyu GL, et al. Impact of age and sex on COVID-19 severity assessed from radiologic and clinical findings. Front Cell Infect Microbiol. (2022) 11:777070. doi: 10.3389/fcimb.2021.777070
154. Hefny AF, Almansoori TM, Smetanina D, Morozova D, Voitetskii R, Das KM, et al. Streamlining management in thoracic trauma: radiomics-and AI-based assessment of patient risks. Front Surg. (2024) 11:1462692. doi: 10.3389/fsurg.2024.1462692
155. Statsenko Y, Meribout S, Habuza T, Almansoori TM, Gorkom KNV, Gelovani JG, et al. Patterns of structure-function association in normal aging and in Alzheimer's disease: Screening for mild cognitive impairment and dementia with ML regression and classification models. Front Aging Neurosci. (2023) 14:943566. doi: 10.3389/fnagi.2022.943566
156. Habuza T, Zaki N, Mohamed EA, Statsenko Y. Deviation from model of normal aging in alzheimer's disease: application of deep learning to structural MRI data and cognitive tests. IEEE Access. (2022) 10:53234–49. doi: 10.1109/ACCESS.2022.3174601
157. Han Y, Xu Y, Zhu W, Liu Y, Liu Z, Dou X, et al. Thinner corneas appear to have more striking effects of corneal collagen crosslinking in patients with progressive keratoconus. J Ophthalmol. (2017) 2017:6490915. doi: 10.1155/2017/6490915
158. Tian M, Jian W, Zhang X, Sun L, Shen Y, Zhou X. Predictive factors of the accelerated transepithelial corneal cross-linking outcomes in keratoconus. BMC Ophthalmol. (2022) 22:1–9. doi: 10.1186/s12886-021-02235-4
159. Talari K, Goyal M. Retrospective studies-utility and caveats. J Royal Colle Physi Edinburgh. (2020) 50:398–402. doi: 10.4997/jrcpe.2020.409
160. Habuza T, Navaz AN, Hashim F, Alnajjar F, Zaki N, Serhani MA, et al. Ai applications in robotics, diagnostic image analysis and precision medicine: Current limitations, future trends, guidelines on cad systems for medicine. Inform Med Unlocked (2021) 24:100596. doi: 10.1016/j.imu.2021.100596
161. Shakoor H, Kizhakkayil J, Statsenko Y, Platat C. Separate and combined effects of moderate-intensity exercise training and detraining with protocatechuic acid (pca) on myokines and insulin-signaling pathways in male wistar rats: A preclinical randomized study. Metabolites (2025) 15:87. doi: 10.3390/metabo15020087
162. Nakhal MM, Mydeen AB, Yassin LK, Almazrouei R, Alkamali R, Alsulaimi M, et al. Antibiotics-induced dysbiosis impacts dendritic morphology of adult mouse cortical interneurons. Front Neuroanat. (2025) 19:1557961. doi: 10.3389/fnana.2025.1557961
163. Statsenko Y, Gorkom K, Ljubisabljevic M, Szolics M, Baylis C, et al. Psychological outcomes of age-related brain atrophy. Neuroradiology (2019) 61:S73–S74. doi: 10.1007/s00234-019-02263-4
164. Das KM, Alkoteesh JA, Sheek-Hussein M, Alzadjali SA, Alafeefi MT, Singh R, et al. Role of chest radiograph in mers-cov pneumonia: a single tertiary referral center experience in the united arab emirates. Egypt J Radiol Nucl Med. (2021) 52:133. doi: 10.1186/s43055-021-00517-x
165. Statsenko Y, Habuza T, Gorkom KNV, Zaki N, Almansoori TM. Applying the inverse efficiency score to visual-motor task for studying speed-accuracy performance while aging. Front Aging Neurosci. (2020) 12:574401 doi: 10.3389/fnagi.2020.574401
166. Statsenko Y, Al Zahmi F, Habuza T, Neidl-Van Gorkom K, Zaki N. Prediction of covid-19 severity using laboratory findings on admission: informative values, thresholds, ml model performance. BMJ open (2021) 11:e044500. doi: 10.1136/bmjopen-2020-044500
167. Belghali M, Statsenko Y, Laver V. Stroop switching card test: brief screening of executive functions across the lifespan. Aging Neuropsychol Cogn (2022) 29:14–33. doi: 10.1080/13825585.2020.1844865
168. Statsenko Y, Habuza T, Charykova I, Gorkom KNV, Zaki N, Almansoori TM, et al. Predicting age from behavioral test performance for screening early onset of cognitive decline. Front Aging Neurosci. (2021) 13:661514. doi: 10.3389/fnagi.2021.661514
169. Statsenko Y, Liaonchyk K, Morozova D, Voitetskii R, Pazniak M, Likhorad E, et al. Precision medicine in modelling effectiveness of corneal cross-linking for keratoconus. Heliyon. (2025) 9:e43050. doi: 10.1016/j.heliyon.2025.e43050
Keywords: keratoconus, corneal collagen cross-linking, CXL outcomes, machine learning models, predictive models, keratometry readings, corneal thickness, precision medicine
Citation: Statsenko Y, Smetanina D, Voitetskii R, Simiyu GL, Pazniak M, Likhorad E, Pazniak A, Beliakouski P, Abelski D, Ismail F, Neidl-Van Gorkom K and Ljubisavljevic M (2025) Digital transformation of care for keratoconus patients: ML modeling structural outcomes of corneal collagen cross-linking. Front. Med. 12:1462653. doi: 10.3389/fmed.2025.1462653
Received: 10 July 2024; Accepted: 10 March 2025;
Published: 04 June 2025.
Edited by:
Francisco Monroy, Complutense University of Madrid, SpainReviewed by:
Fivos Panetsos, Complutense University of Madrid, SpainYueguo Chen, Peking University Third Hospital, China
Copyright © 2025 Statsenko, Smetanina, Voitetskii, Simiyu, Pazniak, Likhorad, Pazniak, Beliakouski, Abelski, Ismail, Neidl-Van Gorkom and Ljubisavljevic. This is an open-access article distributed under the terms of the Creative Commons Attribution License (CC BY). The use, distribution or reproduction in other forums is permitted, provided the original author(s) and the copyright owner(s) are credited and that the original publication in this journal is cited, in accordance with accepted academic practice. No use, distribution or reproduction is permitted which does not comply with these terms.
*Correspondence: Yauhen Statsenko, ZS5hLnN0YXRzZW5rb0BnbWFpbC5jb20=; ZS5hLnN0YXRzZW5rb0B1YWV1LmFjLmFl; Pavel Beliakouski, cC5iZWxpYWtvdXNraUBnbWFpbC5jb20=