 He Han
 Zhiyuan Li
 Yunfan Li
 Liwen Zhang2
 Jixiang Chen
 Xin Fan
- 1Department of General Surgery, Affiliated Hospital of Jiangsu University, Zhenjiang, Jiangsu, China
- 2Department of Respiratory, Affiliated Hospital of Jiangsu University, Zhenjiang, Jiangsu, China
Objective: This study explores the clinical significance of elevated tumor markers in patients with biliary pancreatitis. It aims to develop a machine learning-based clinical prediction model to facilitate early intervention and improve outcomes in acute biliary pancreatitis (ABP).
Methods: We collected data from patients admitted with biliary pancreatitis to the Department of General Surgery at Jiangsu University Hospital from January 1, 2016, to December 31, 2023. We recorded general patient information.
Results: Markers including Carbohydrate Antigen (CA) 50, CA19-9, CA125, CA724, CA242, ferritin, leukocyte count, high-sensitivity C-reactive protein (HS-CRP), total bilirubin, direct bilirubin, alanine aminotransferase, and aspartate aminotransferase were significantly higher in the severe acute pancreatitis (SAP) and moderately severe acute pancreatitis (MSAP) groups compared to the mild acute pancreatitis (MAP) group (P < 0.05). Univariate logistic regression analysis identified white blood cell count, HS-CRP, CA50, CA19-9, CA125, urinary amylase, total bilirubin, aspartate aminotransferase, and hospitalization duration as risk factors for progression to MSAP or SAP. Multivariate logistic regression analysis confirmed hospitalization duration as an independent risk factor.
Conclusion: Elevated tumor markers have clinical significance in biliary pancreatitis. We propose a clinical prediction model based on machine learning to screen variables and guide treatment adjustments for MAP.
1 Introduction
Acute pancreatitis (AP) is a common surgical acute abdominal condition with an annual incidence of approximately 3.374 per 10,000 individuals and a mortality rate of 0.116 per 10,000 (1, 2). The rising incidence, influenced by lifestyles high in salt, oil, and fat, requires increased attention to this patient population (3). Acute biliary pancreatitis (ABP), the most prevalent form of AP, constitutes a significant proportion of surgical emergency abdominal cases. AP can progress rapidly, triggering both local and systemic inflammatory responses, which increase the risk of multiple organ failure (MOF) and infections. In severe cases, mortality rates can reach up to 30% (4). Approximately 20% of patients with AP progress to moderate or severe disease, experiencing complications such as acute peripancreatic fluid collection, pancreatic pseudocyst, acute necrotizing fluid collection, and wall necrosis (5, 6). These considerations underscore the need for more accurate clinical prediction models for moderate-to-severe pancreatitis.
Several clinical scoring systems are currently used, such as the Acute Physiology and Chronic Health Evaluation II (APACHE-II) score (7), the Bedside Index for Severity in Acute Pancreatitis (BISAP) score (8), and the modified Ranson score (9). However, each system has its limitations. The APACHE-II score requires extensive data for predicting severe acute pancreatitis (SAP), and its predictive value within 24 hours is relatively poor (10, 11); it also has lower specificity than the Ranson score (12). The BISAP score includes subjective assessments of mental status (13), and the Ranson score can only be calculated 48 h after admission, which limits early risk stratification (9). Early clinical observations have shown that many patients with biliary pancreatitis present with significantly abnormal tumor markers upon admission, providing a unique research opportunity (14).
This study explores the clinical significance of these elevated markers in patients with biliary pancreatitis and aims to develop a machine learning-based clinical prediction model to facilitate early intervention and improve the prognosis of patients with ABP.
2 Materials and methods
2.1 General information
We retrospectively collected clinical data from patients with biliary pancreatitis admitted to the Department of General Surgery at Jiangsu University Hospital between January 1, 2016, and December 31, 2023. Participants were selected based on predefined exclusion and inclusion criteria to ensure a focused and relevant study population. This study was conducted in accordance with the ethical principles of the 1964 Declaration of Helsinki and received approval from the Ethics Committee of Jiangsu University Hospital.
The inclusion criteria were as follows: (1) diagnosed with ABP per the 2021 Acute Pancreatitis Diagnosis and Treatment Guidelines; (2) had gallbladder stones confirmed by computed tomography (CT), magnetic resonance cholangiopancreatography (MRCP), or ultrasound; (3) were aged ≥ 18 years; (4) had no prior history of AP; and (5) underwent complete gastrointestinal tumor markers testing upon admission.
The exclusion criteria were as follows: (1) patients with non-biliary pancreatitis; (2) age ≤ 18 years; (3) patients with multiple prior episodes of AP; (4) patients with concurrent gastrointestinal tract tumors or a history of malignancy; and (5) cases with incomplete clinical data.
According to the revised Atlanta classification (RAC) (15, 16), pancreatitis severity was categorized into mild AP (MAP), moderately severe AP (MSAP), and severe AP (SAP). For the purposes of clinical model construction and analysis, patients categorized as MSAP and SAP were combined into a single non-MAP group, aiming to refine the focus on more severe cases, which are critical for the study’s objectives.
2.2 Data collection
General patient information collected at the outset of the study included age, sex, height, hypertension status, and whether the patient had been diagnosed with diabetes mellitus. Upon admission, a series of laboratory tests were performed to establish a comprehensive baseline for each patient. These tests included measurements of the white blood cell count (WBC) and high-sensitivity C-reactive protein (hs-CRP), along with a suite of liver function tests such as total bilirubin, direct bilirubin, alanine aminotransferase, and aspartate aminotransferase. Additionally, a range of tumor markers was assessed, including alpha-fetoprotein (AFP), carcinoembryonic antigen (CEA), and carbohydrate antigens CA50, CA19-9, CA125, CA724, and CA242, as well as ferritin levels. Further data collected encompassed the presence of common bile duct stones, the diagnosis of acute cholecystitis, and the duration of each patient’s hospitalization. Patients were categorized according to the severity of their condition using the revised Atlanta classification at the time of admission, facilitating subsequent analyses based on these initial assessments.
2.3 Statistical analyses
Data analysis was conducted using SPSS 26.0 (IBM Corp., Armonk, NY, United States) and GraphPad Prism 9.5.0. Normally distributed continuous variables were expressed as mean ± standard deviation and analyzed with the Kruskal–Wallis test. Categorical variables were presented as percentages (%) and assessed using χ2 tests or Fisher’s exact tests, as appropriate. Further advanced statistical modeling was performed using R software (version 3.5.2). For variable selection, the least absolute shrinkage and selection operator (LASSO) regression was employed. This method was chosen because it effectively manages multicollinearity among predictors and facilitates the creation of sparse models through L1 regularization. The LASSO regression model was constructed using the Forward LR method and validated using 10-fold cross-validation. This approach was preferred over alternative methods, such as stepwise regression, which tend to overfit, especially in scenarios involving high-dimensional data sets. Ten-fold cross-validation was instrumental in optimizing the penalty parameter (λ), ensuring model generalizability. Additional statistical analyses included univariate and multivariate logistic regression, along with the generation of receiver operating characteristic (ROC) curves and calibration plots. All analyses adhered to a significance threshold set at P ≤ 0.05.
3 Results
3.1 General patient information
In this study, 755 patients who met the diagnostic criteria for ABP were initially identified. After applying the inclusion and exclusion criteria, 455 patients were selected for the final analysis (Figure 1). The final cohort consisted of 396 patients in the MAP group, with a mean age of 63.96 ± 16.17 years; 38 in the MSAP group, with a mean age of 65.74 ± 15.71 years; and 21 in the SAP group, with a mean age of 64.71 ± 17.36 years. Analysis of demographic data revealed no significant differences in age, body mass index (BMI), sex distribution, prevalence of hypertension, or incidence of diabetes mellitus across the three groups (all P > 0.05). Similarly, admission laboratory values, including blood amylase, blood lipase, and urinary amylase levels, showed no significant intergroup differences (all P > 0.05). However, hospitalization duration differed significantly among the groups (P < 0.05), specifically 32.10 ± 10.75 days in the SAP group, 25.47 ± 11.67 days in the MSAP group, and 12.30 ± 5.09 days in the MAP group. Notably, there were no patient deaths during the study period. Complete demographic and clinical data for the cohort are detailed in Table 1.
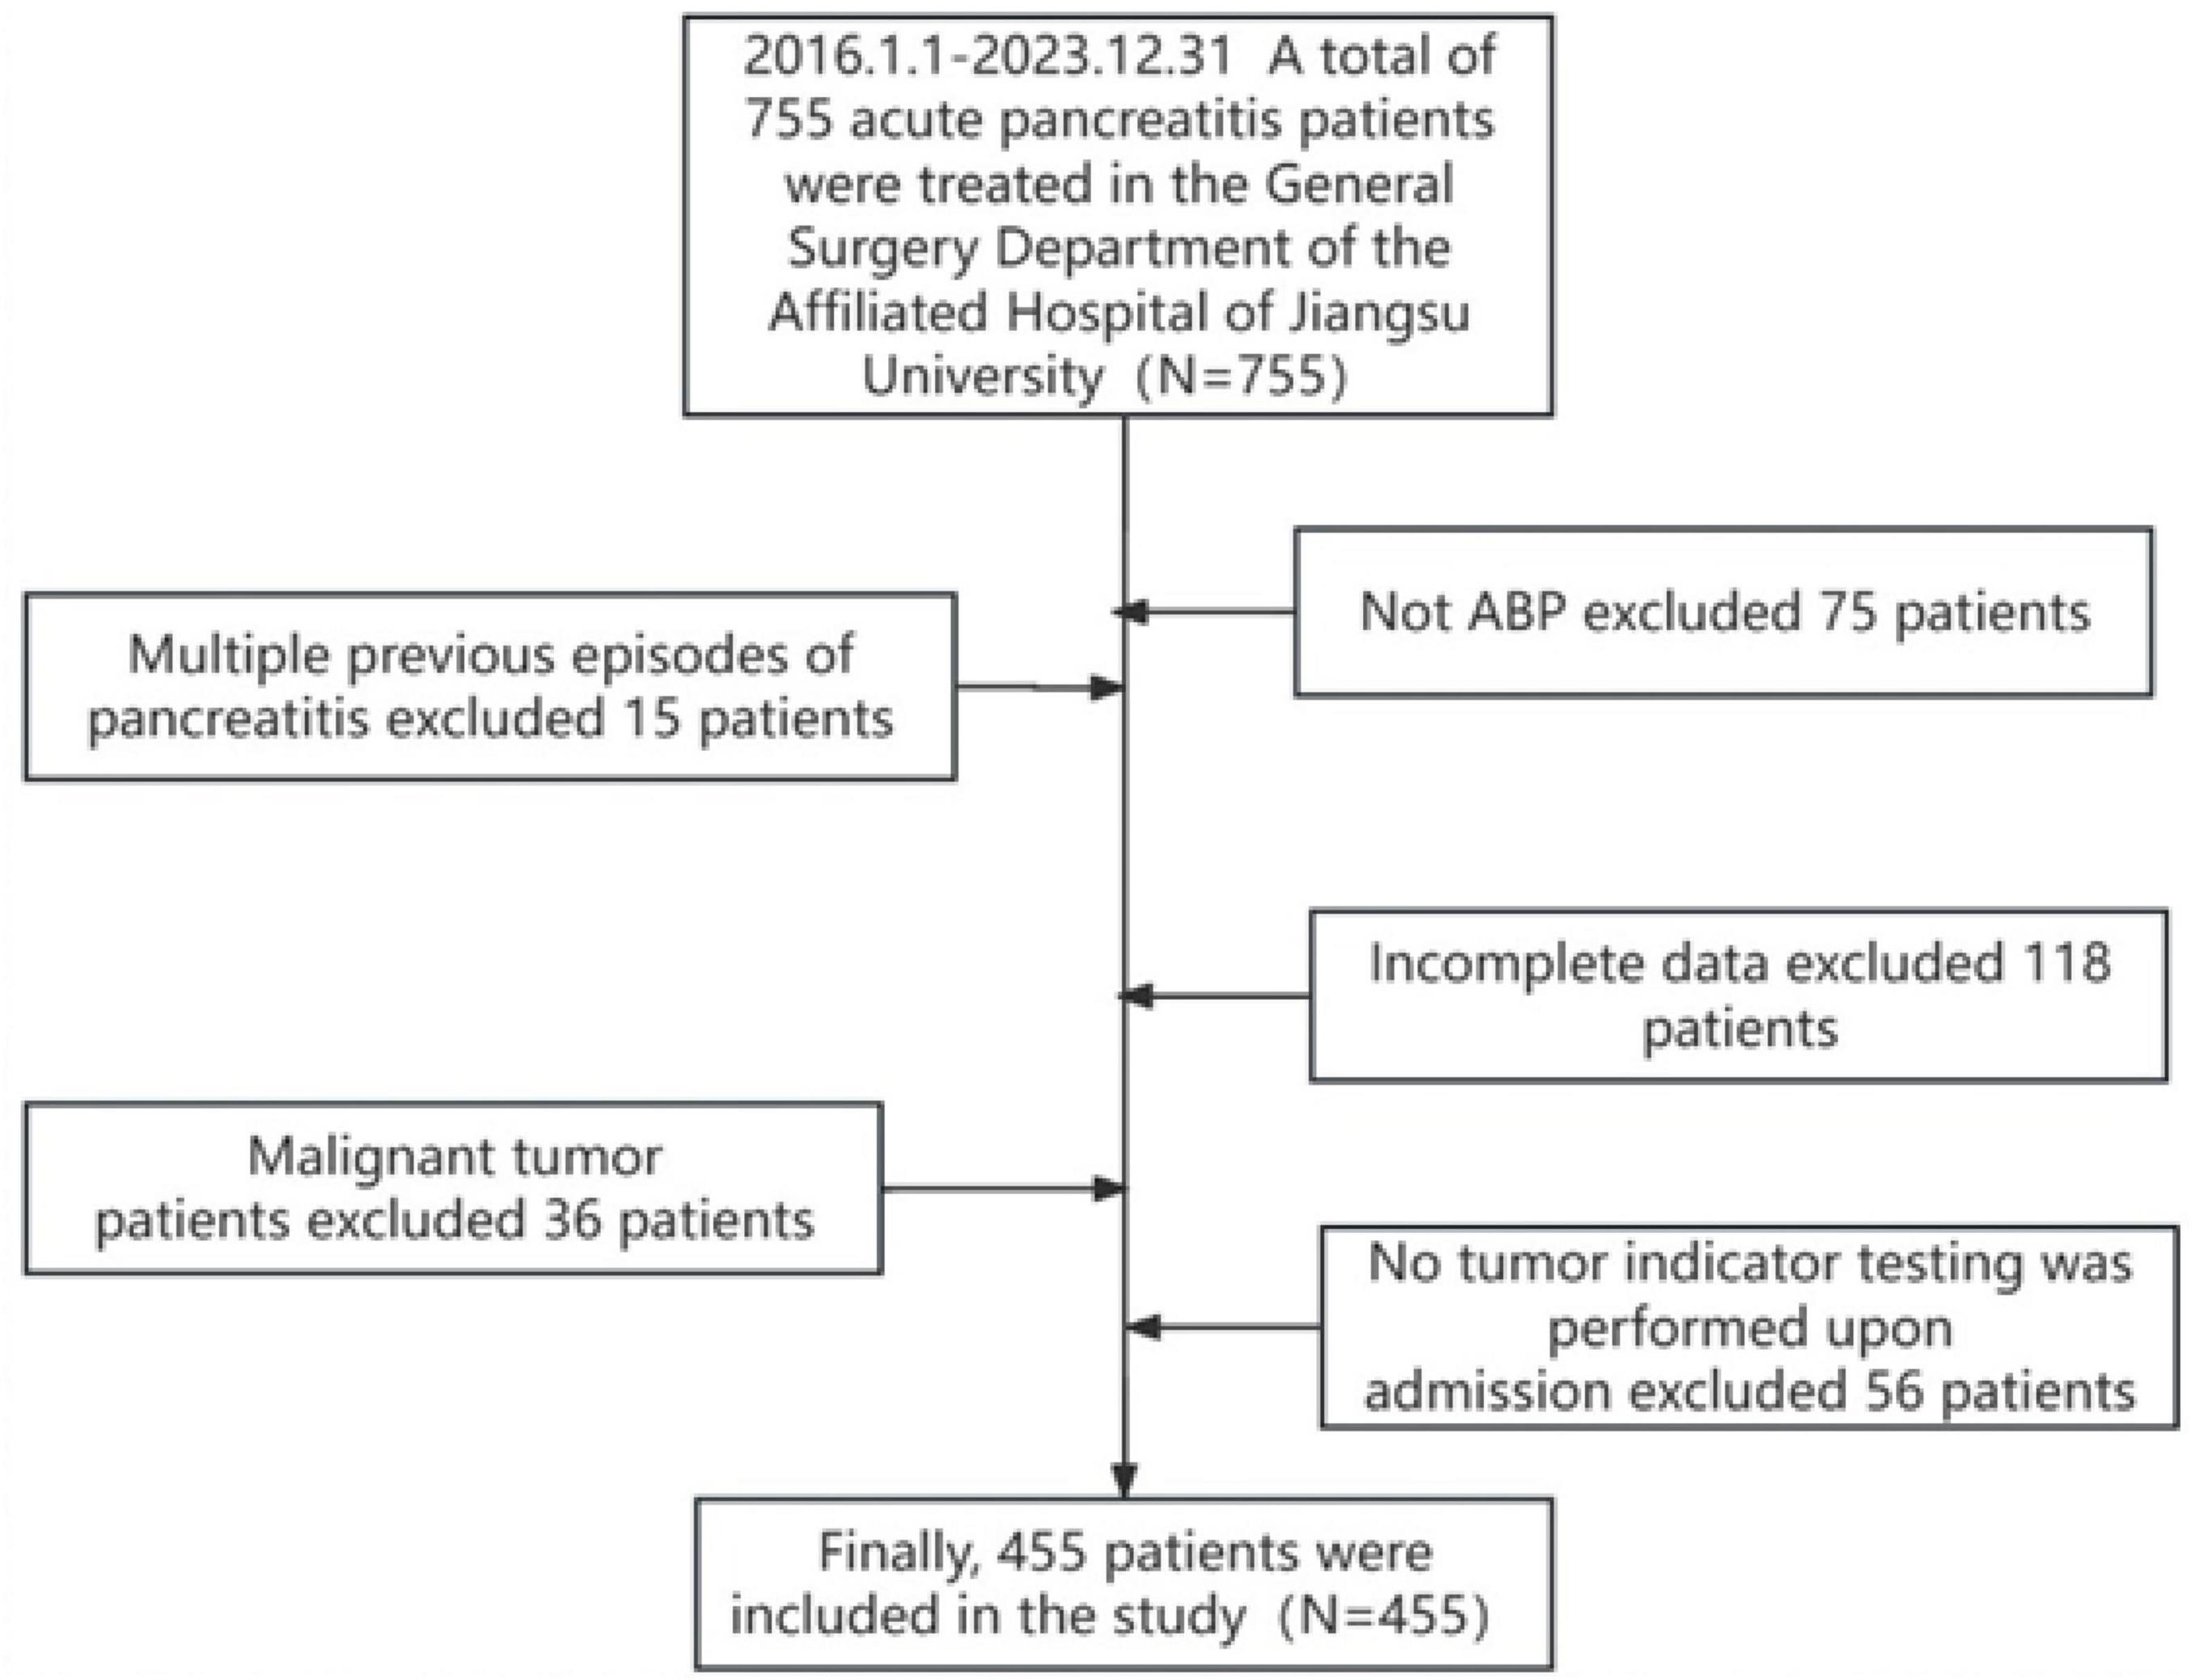
Figure 1. Patient screening flowchart.
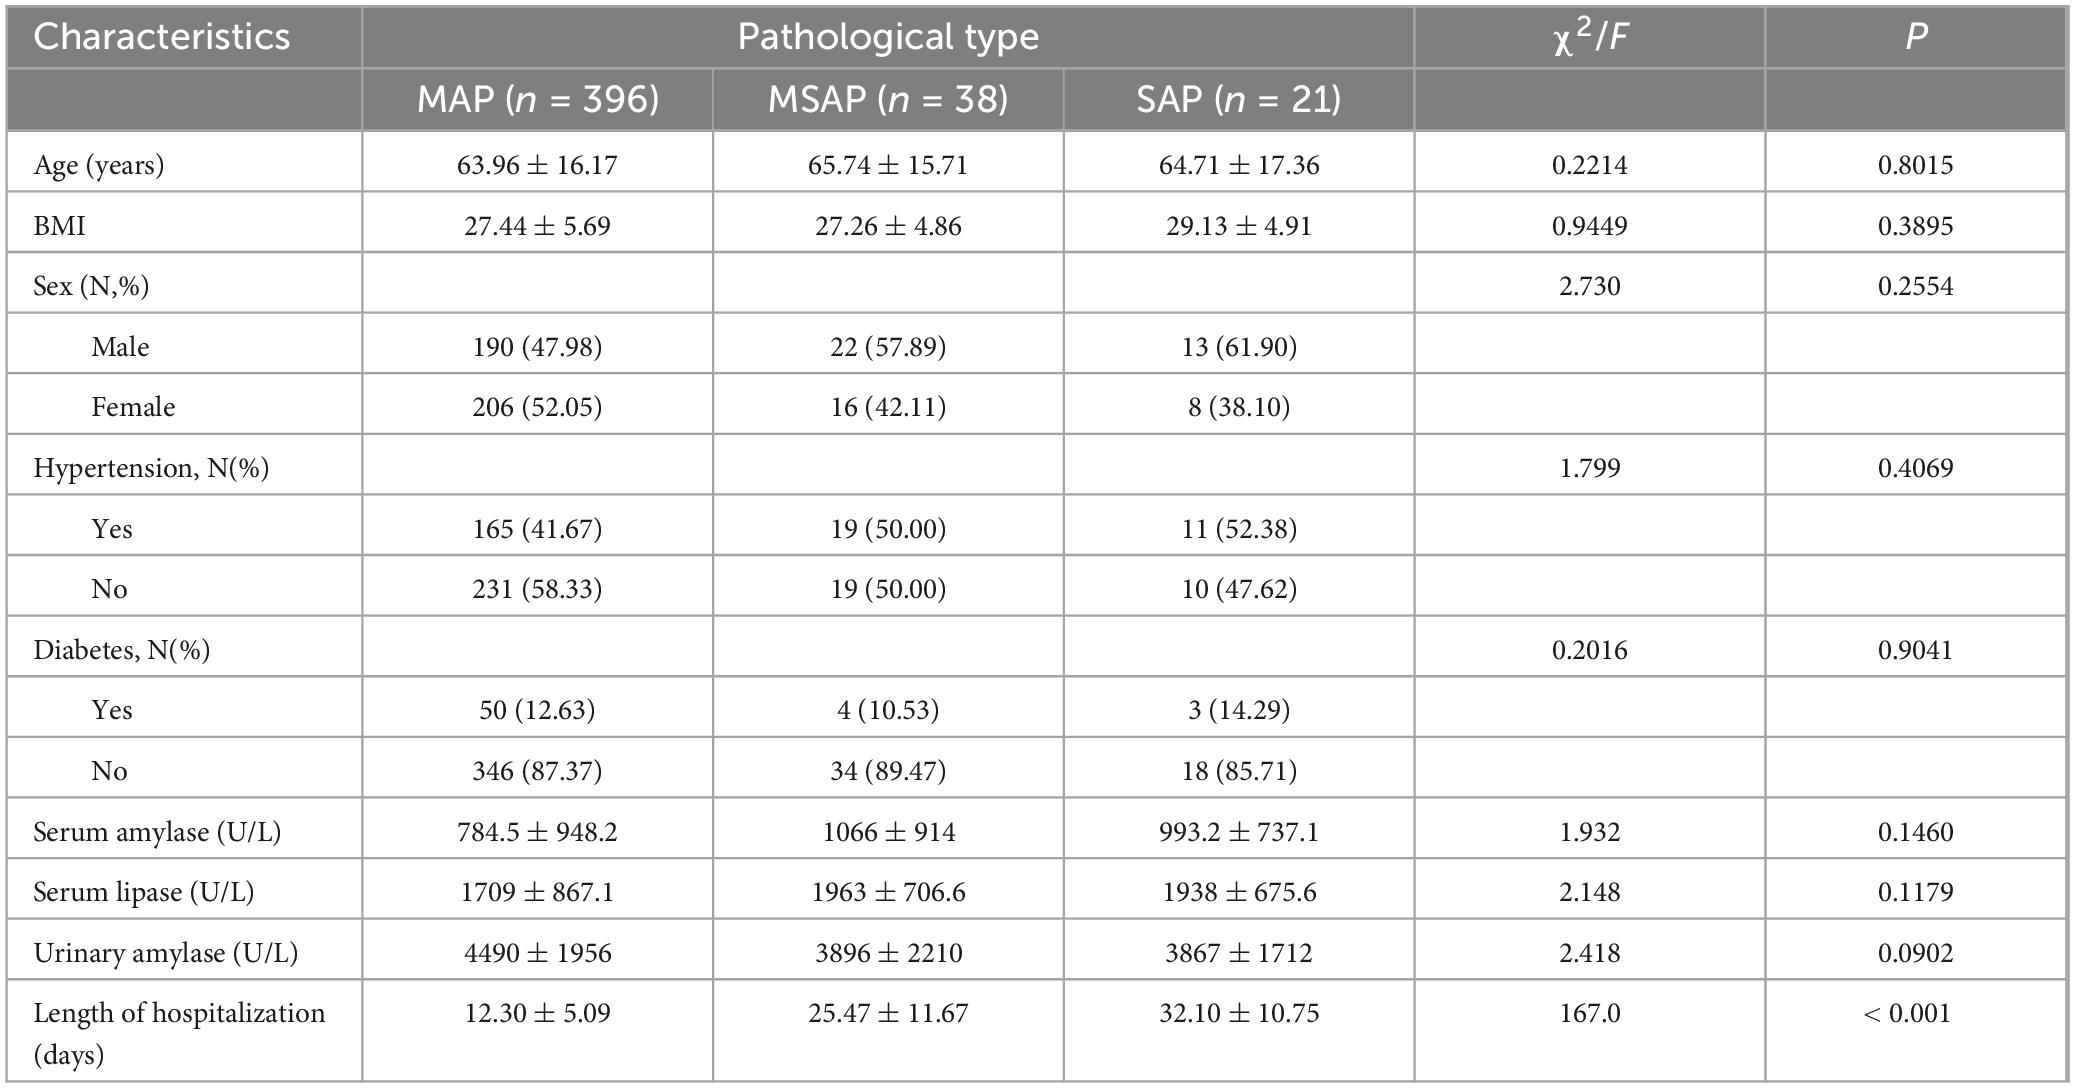
Table 1. General information of patients.
3.3 Comparison of inflammatory and tumor indicators in different types of pancreatitis
The comparative analysis of admission laboratory values indicated distinct expression patterns of inflammatory and tumor markers across the severity groups. There were no statistically significant differences in alpha-fetoprotein (AFP), carcinoembryonic antigen (CEA), or carbohydrate antigen CA724 levels among the three groups (all P > 0.05) (Table 2). However, significant differences were observed for carbohydrate antigen 50 (CA50), CA19-9, CA125, CA242, ferritin levels, WBC count, hs-CRP, total bilirubin, direct bilirubin, alanine aminotransferase, and aspartate aminotransferase across the MAP, MSAP, and SAP groups (all P < 0.05) (Table 2).
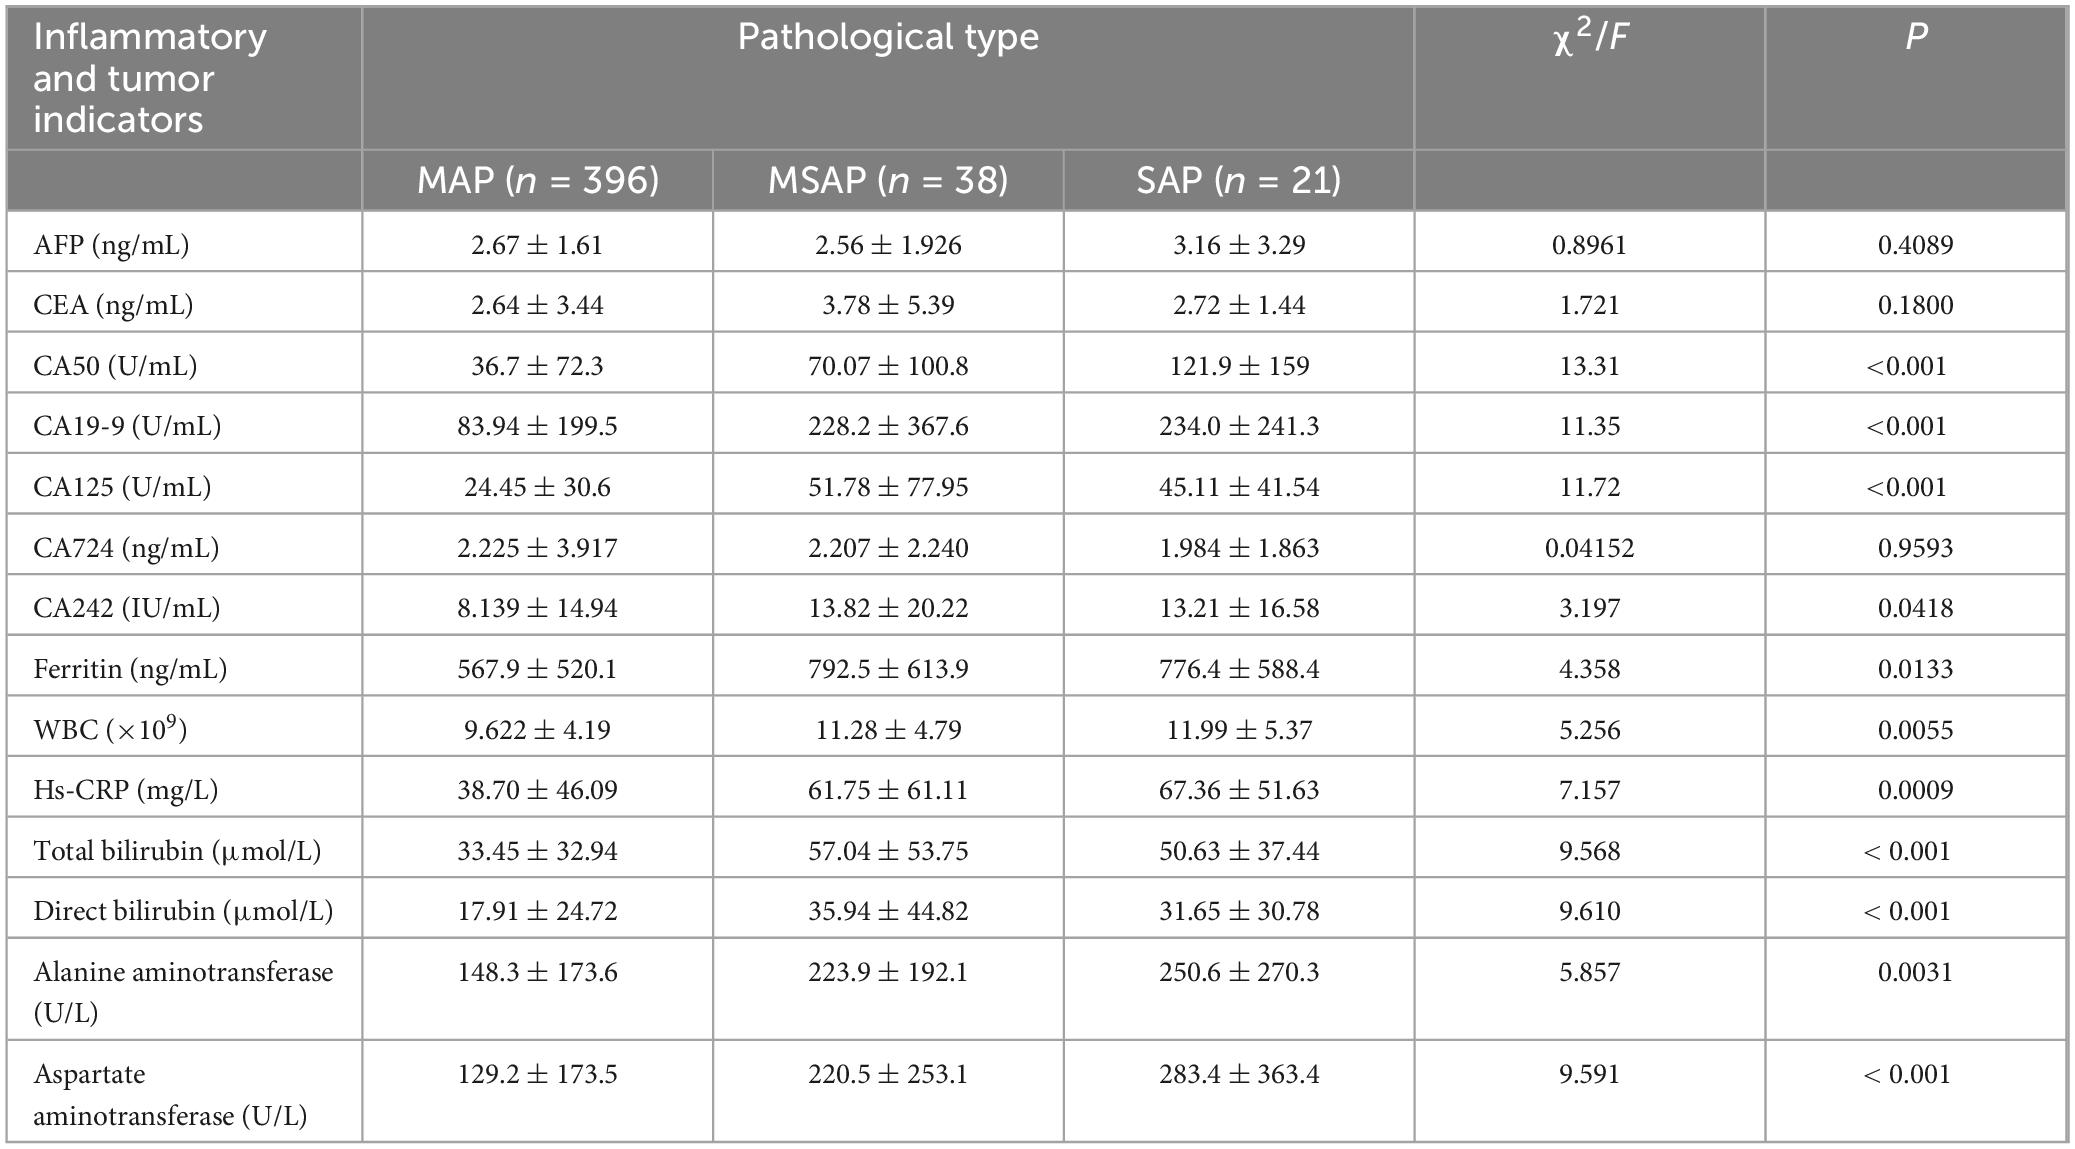
Table 2. Comparison of inflammatory and tumor indicators in different types of pancreatitis.
3.4 Construction of LASSO regression prediction models
A LASSO regression prediction model was developed to assess disease severity, using MAP status as the binary dependent variable. The model used LASSO regression to screen variables, ensuring the selection of the most relevant predictors while minimizing overfitting. This was followed by validation using 10-fold cross-validation to enhance the reliability of the model’s predictions. After the LASSO regression screening process, the variables selected as significant predictors included sex, WBC count, hs-CRP, CA50, CA19-9, CA125, urinary amylase, total bilirubin, aspartate aminotransferase, and hospitalization duration (Figure 2).
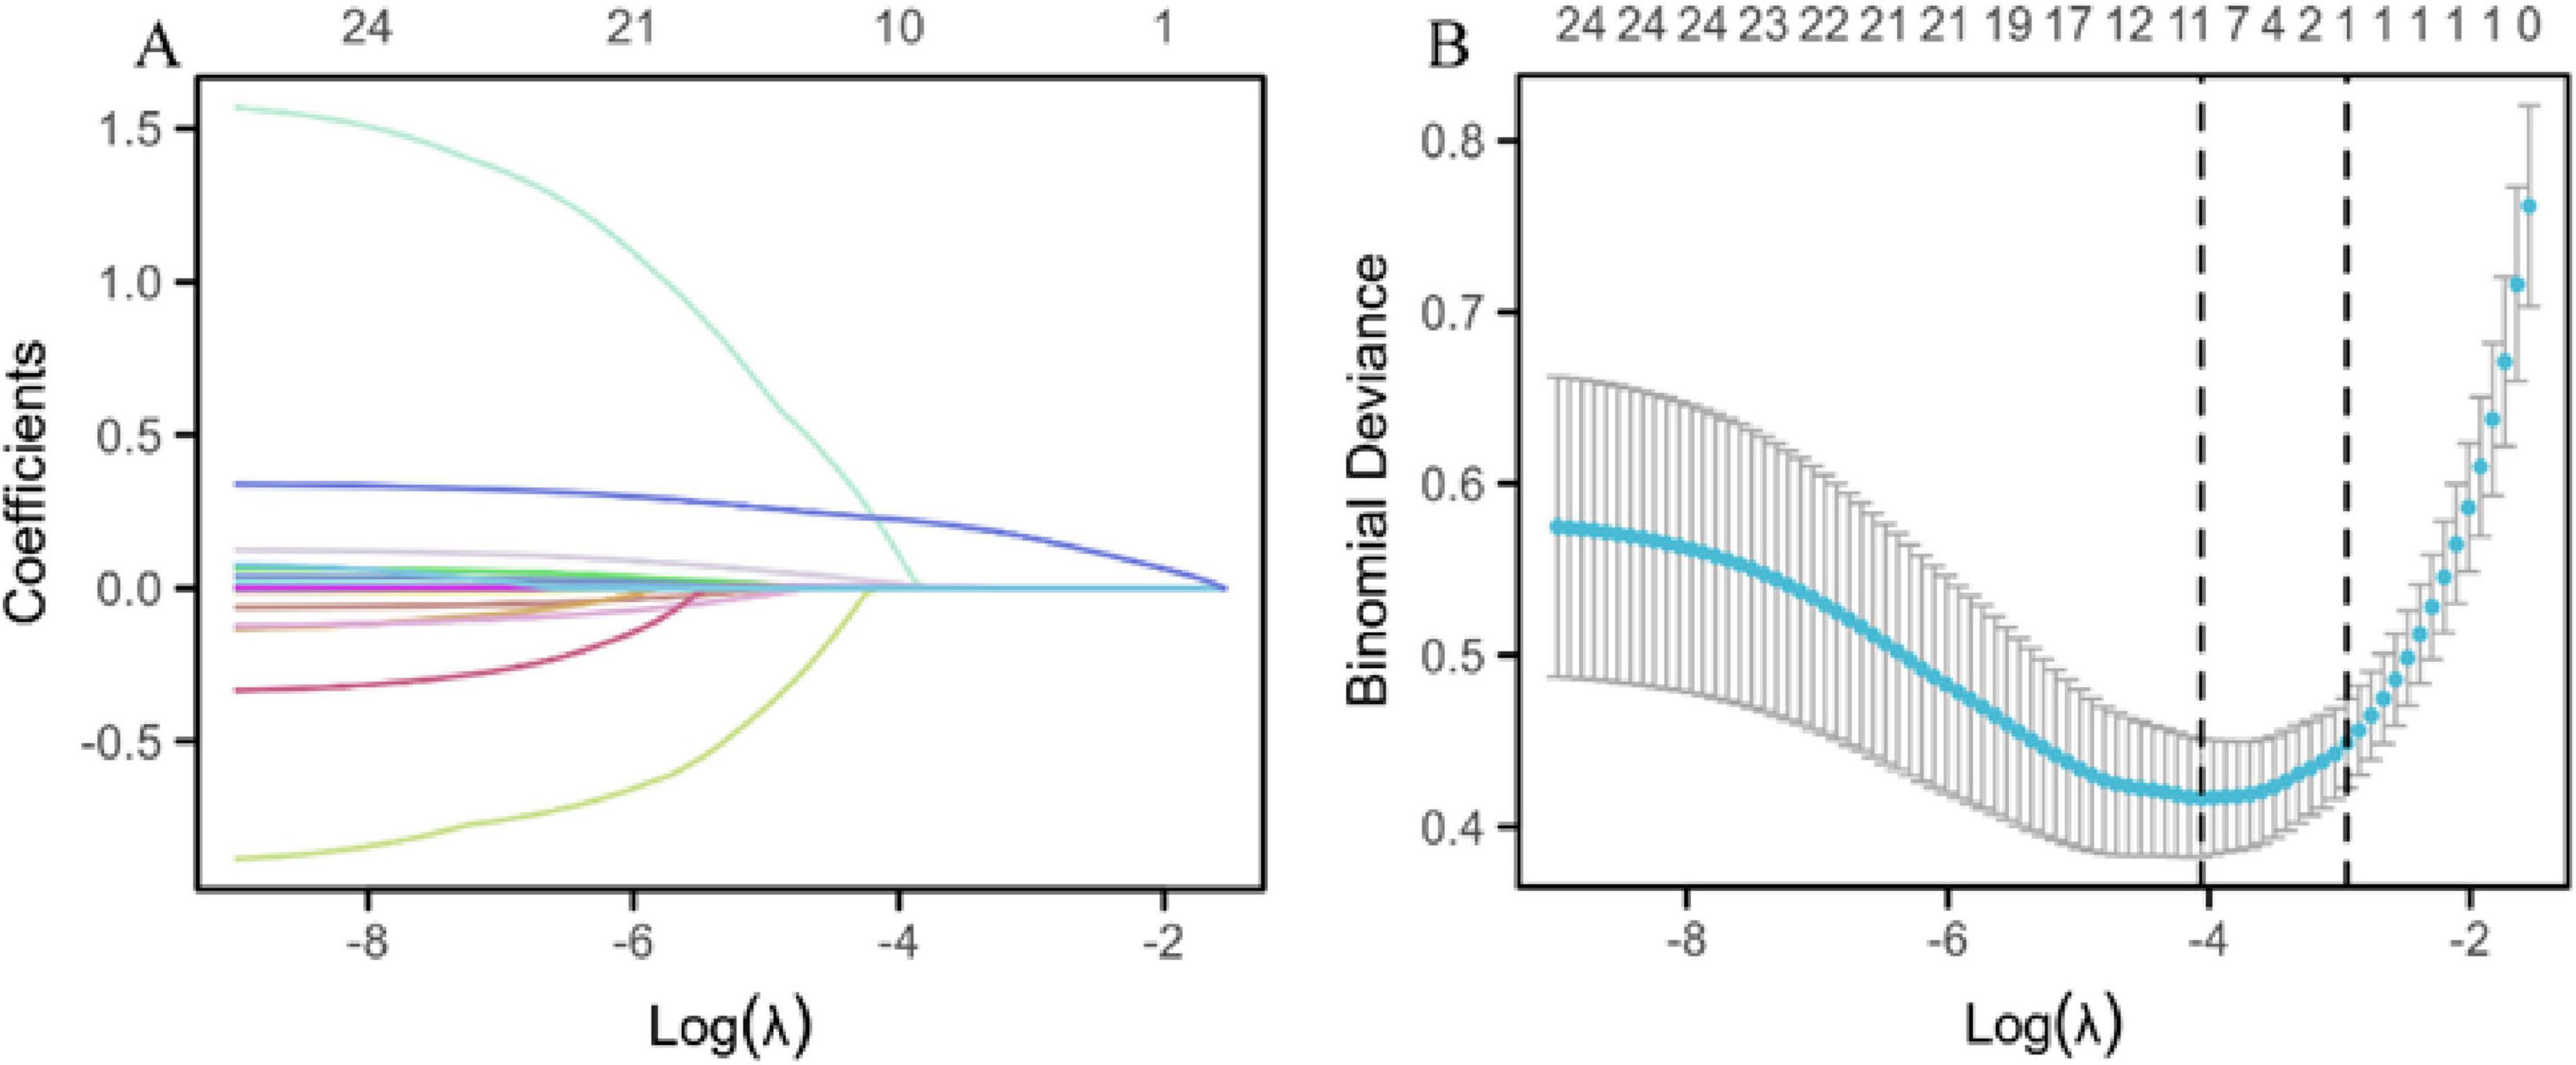
Figure 2. LASSO regression prediction model. (A) LASSO regression variable trajectories. The horizontal axis represents the logarithmic value of lambda [log(λ)], and the vertical axis represents the coefficient values of the variables. The upper horizontal axis shows the number of non-zero coefficient variables in the model, and each curve represents the trajectory of the coefficient of an individual variable. (B) Log(λ) values and model errors. The lower x-axis represents the log(λ) values, and the upper x-axis indicates the number of non-zero coefficient variables corresponding to each λ value. The y-axis represents the classification error rate (Class) or the -2 log-likelihood function value (Deviance) of the model under different metrics. Dots represent the mean likelihood deviation corresponding to each λ during the cross-validation process. Vertical lines (error bars) represent the standard error of the likelihood deviation at each λ. The left dashed line indicates the optimal lambda value (lambda.min), while the right dashed line indicates the lambda value (lambda.1se) within one standard error of the minimum.
3.5 Logistic regression analysis and ROC curves for variables
Univariate and multivariate logistic regression analyses were conducted using variables selected by LASSO regression. Univariate analysis identified significant risk factors for MSAP or SAP (all P < 0.05): WBC count (P = 0.002, 95% CI: 1.035–1.166), hs-CRP (P < 0.001, 95% CI: 1.004–1.014), CA50 (P < 0.001, 95% CI: 1.003–1.007), CA19-9 (P < 0.001, 95% CI: 1.001–1.003), CA125 (P < 0.001, 95% CI: 1.006–1.017), urinary amylase (P = 0.029, 95% CI: 1.000–1.000), total bilirubin (P < 0.001, 95% CI: 1.006–1.019), aspartate aminotransferase (P < 0.001, 95% CI: 1.001–1.003), and duration of hospitalization (P < 0.001, 95% CI: 1.265–1.463). Multivariate analysis demonstrated that the duration of hospitalization (P < 0.001, 95% CI: 1.240–1.437) was an independent risk factor for MSAP or SAP (Table 3). ROC curve analysis showed that all variables had an area under the curve (AUC) values > 0.5, indicating a good predictive value for distinguishing patients from non-MAP (Figure 3A). The overall model exhibited an AUC of 0.953 (95% CI: 0.921–0.984), indicating high accuracy (Figure 3B).
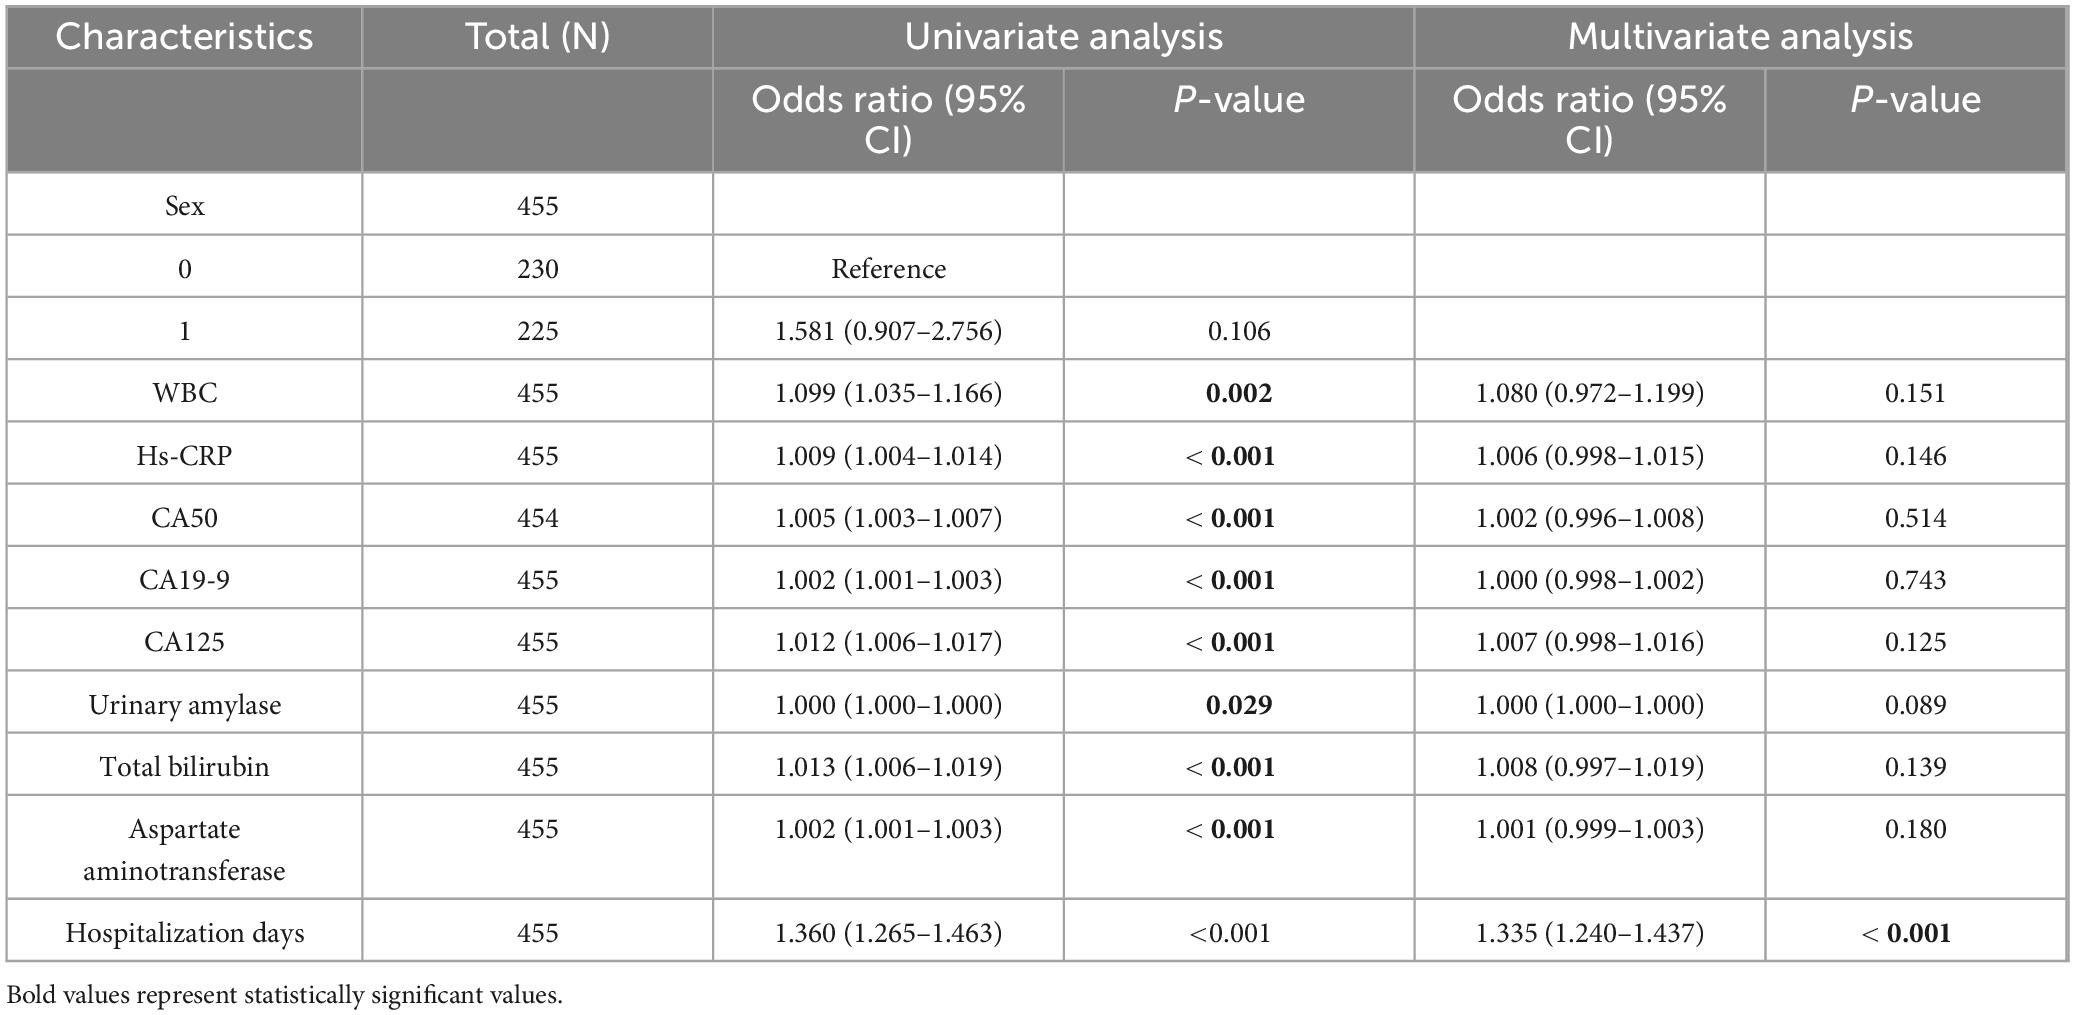
Table 3. One-way and multi-factor logistic regression analyses of variables selected by LASSO regression brushing.
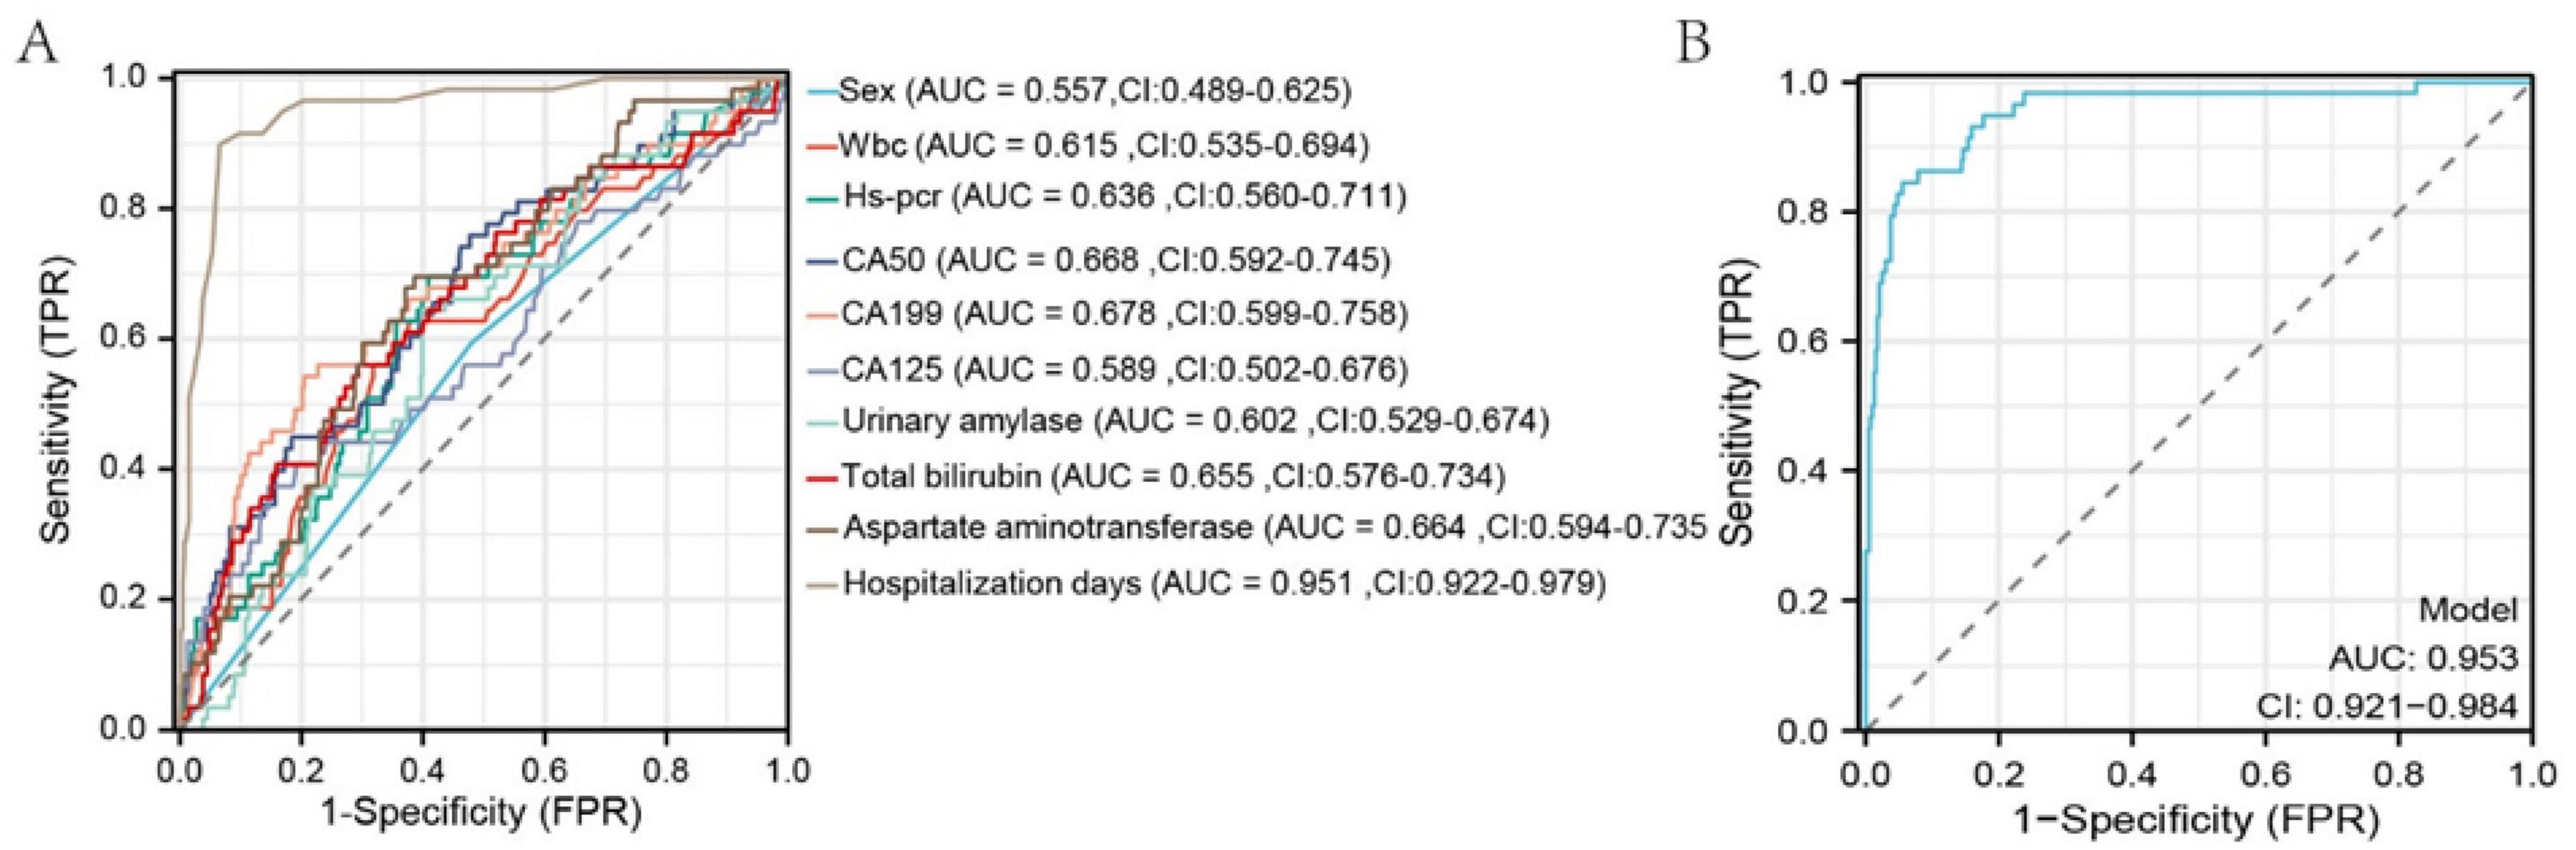
Figure 3. ROC curves of selected variables and the overall model after LASSO regression. The x-axis represents 1-specificity; the closer to zero, the higher the specificity. The y-axis represents sensitivity; the higher the value, the better the accuracy.
3.6 Construction of the column chart prediction model and diagnosis of the model Calibration
Based on the results from the LASSO-logistic regression analysis, we developed a risk prediction model for MAP status using the following variables: sex, WBC count, hs-CRP, CA50, CA19-9, CA125, urinary amylase, total bilirubin, aspartate aminotransferase, and duration of hospitalization (Figure 4). Model calibration was assessed through diagnostic validation, which yielded a concordance index (C-index) of 0.953. The likelihood ratio test resulted in a P < 0.001, and the Hosmer–Lemeshow goodness-of-fit test returned a P = 0.2396, indicating strong model significance and overall accuracy (Figure 5).
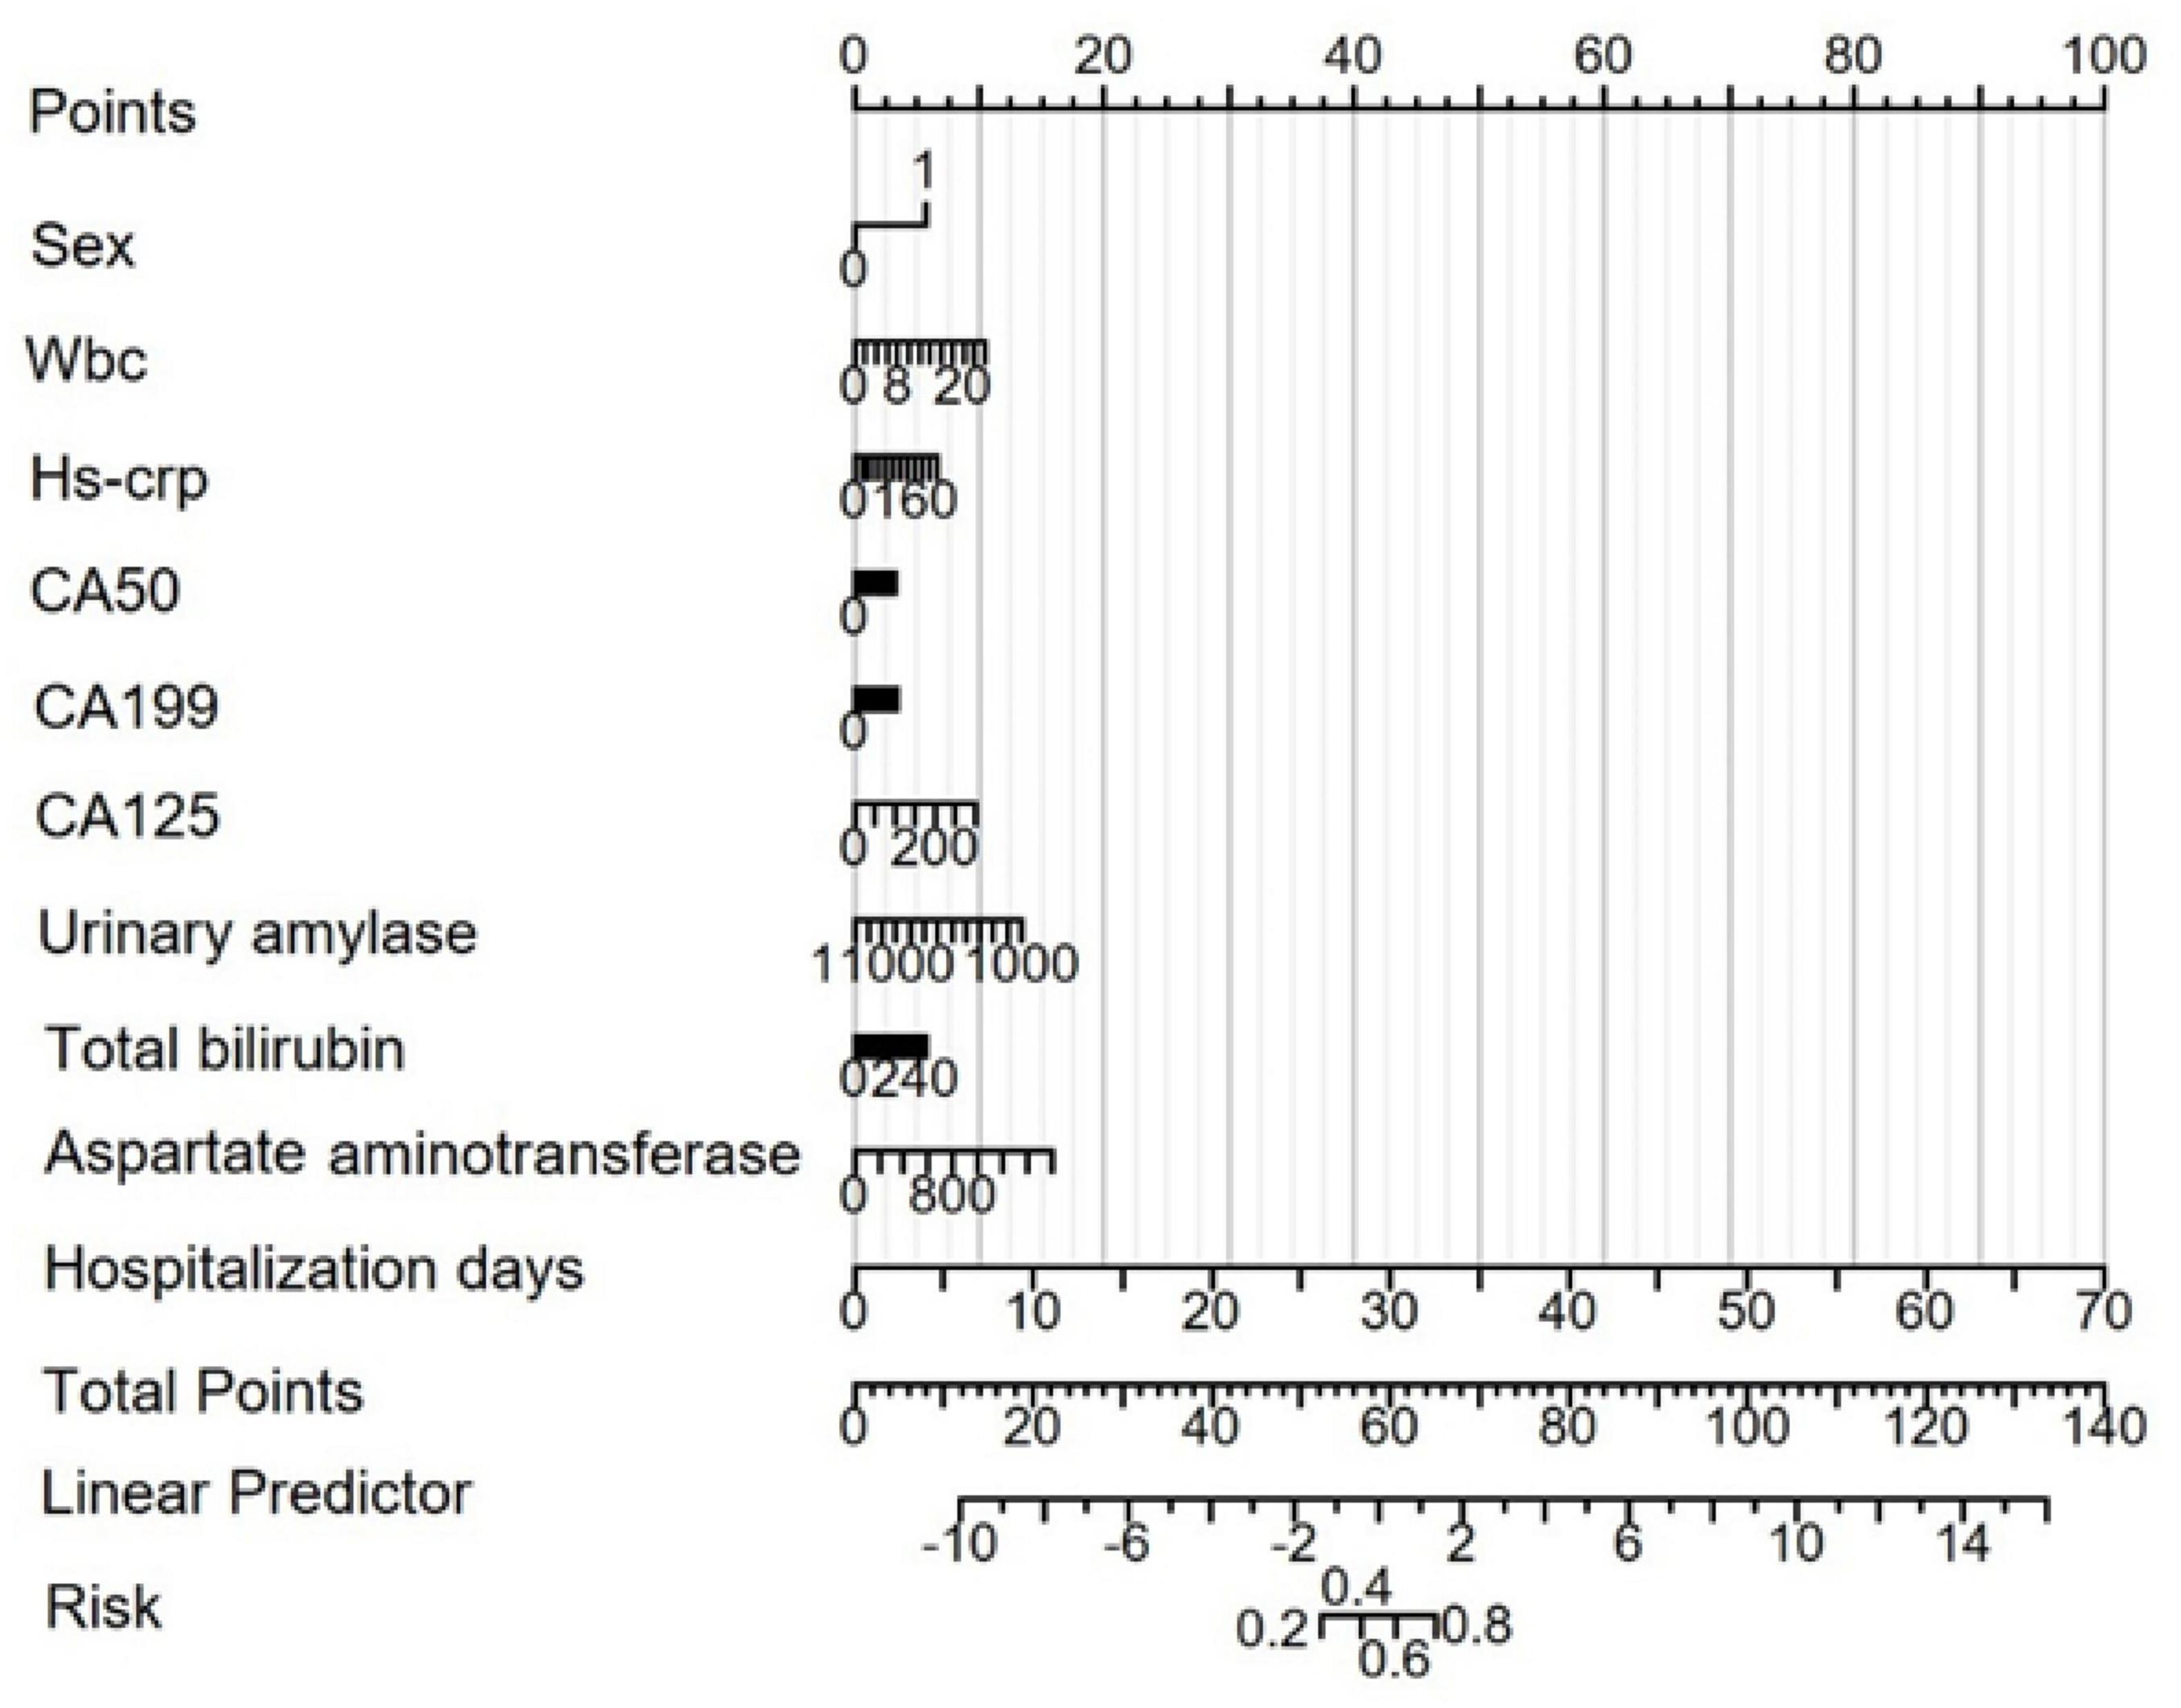
Figure 4. Risk prediction nomogram model for MAP status. Points: Individual scores corresponding to each predictor variable at different values. Total Points: The total score obtained by adding the scores for all variables. Linear Predictor: The linear prediction value based on the total points.
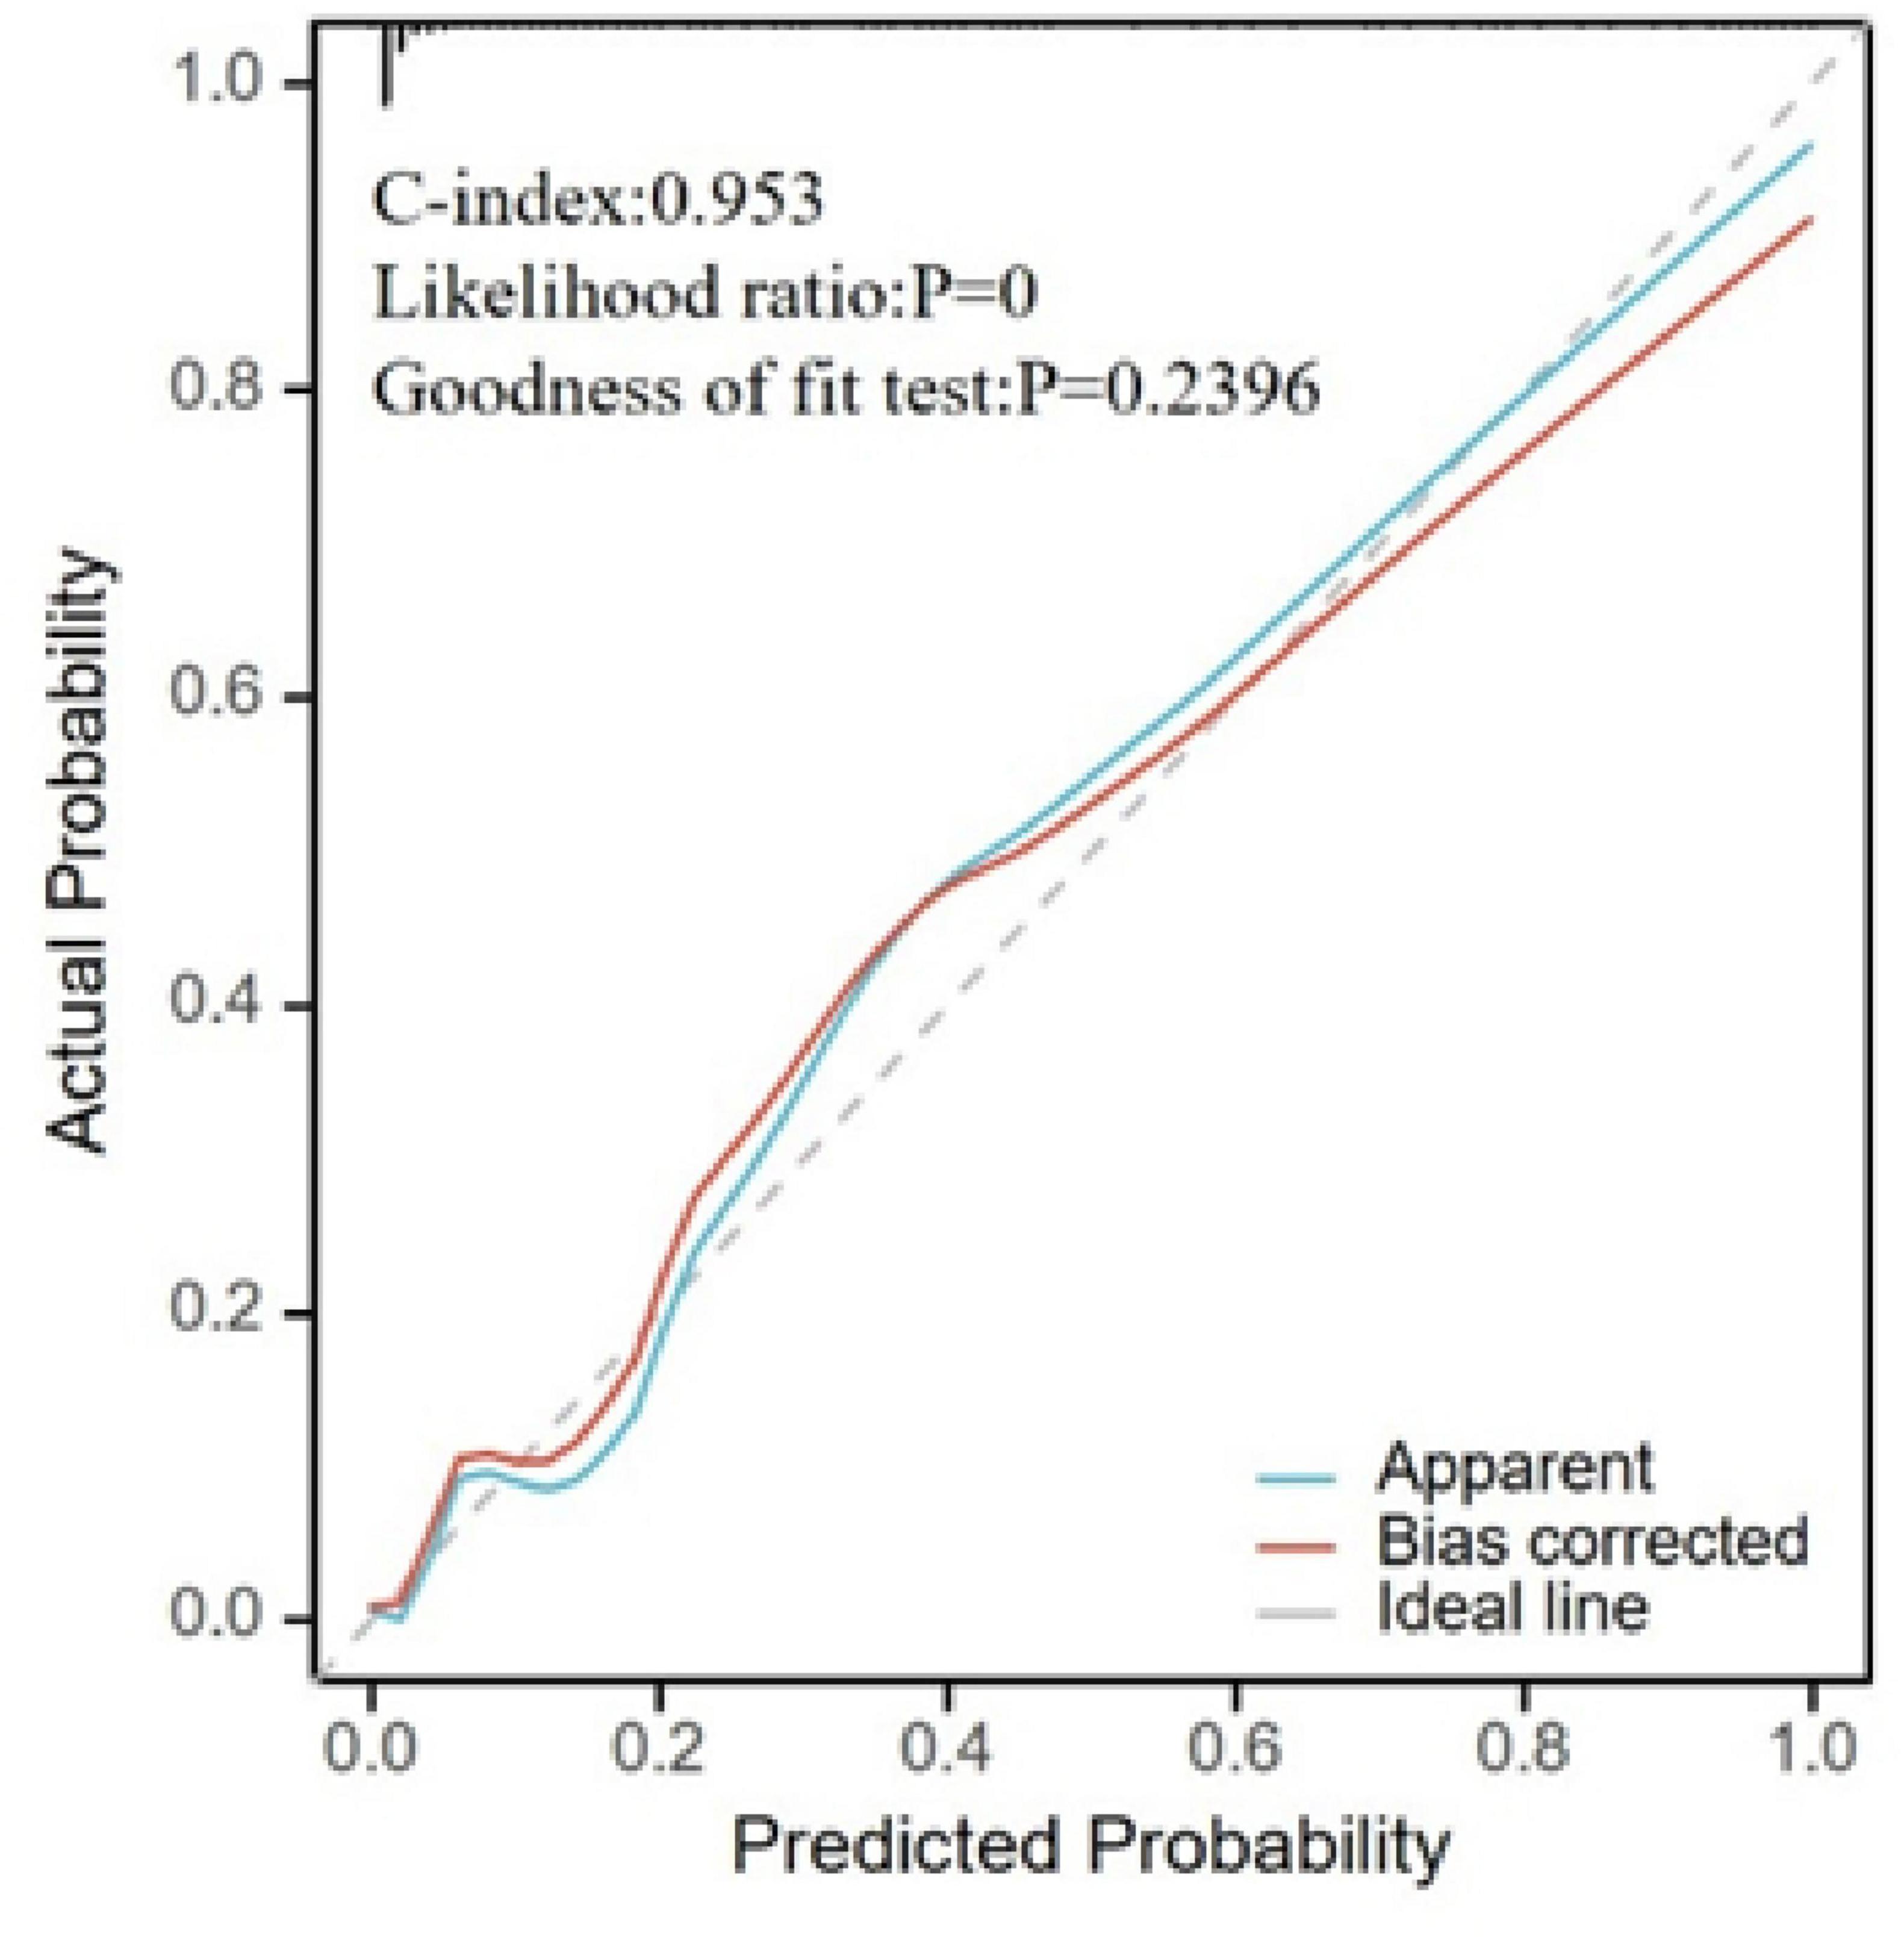
Figure 5. Calibration plot for model validation. The horizontal axis represents the survival probability predicted by the model, and the vertical axis represents the actual observed survival probability. The “Apparent” curve represents the raw predicted curve; the “Bias-corrected” curve represents the calibration curve after adjustment; the “Ideal” line represents perfect calibration.
4 Discussion
The aim of this study was to explore the clinical significance of elevated tumor markers in patients with biliary pancreatitis by examining clinical phenomena and to propose a clinical prediction model for MAP using machine learning. This model is intended to help clinicians adjust treatment plans.
In this study, our findings demonstrated significantly higher levels of CA50, CA19-9, CA125, CA724, CA242, ferritin, leukocyte count, hs-CRP, total bilirubin, direct bilirubin, alanine aminotransferase, and aspartate aminotransferase in SAP and MSAP cases compared to MAP cases. Although these markers are typically associated with gastrointestinal malignancies such as pancreatic, gastric, and colorectal cancers, recent studies confirm their elevation also occurs in benign conditions (17). For example, Song et al. noted that CA50 levels are elevated in patients with type 2 diabetes and atherosclerosis. Furthermore, trace amounts of CA19-9 are normally present in the epithelial cells of the salivary glands, prostate, pancreas, mammary glands, stomach, bile ducts, gallbladder, and bronchial tubes (18, 19), and elevated levels have been found in patients with conditions like choledocholithiasis and acute cholangitis (20). Notably, patients with AP and elevated CA19-9 face a significantly higher risk of developing pancreatic cancer within 5 years (21). CA125 is also known to be elevated in benign ovarian tumors (22), and slight increases in CA19-9/CA50 and CA19-9/CA242 ratios have been observed in xanthogranulomatous cholecystitis (23). Elevated serum ferritin levels have been reported in patients with hepatitis as well (24). While our study confirms the predictive value of tumor markers for assessing the severity of ABP, it also highlights the need to consider their potential for false positivity in inflammatory conditions. To minimize the impact of false positives, our LASSO regression model incorporated L1 regularization to eliminate multicollinear variables, focusing on markers associated with ABP severity, such as hospitalization duration and hs-CRP. Ten-fold cross-validation was used to optimize the model’s generalizability. The model achieved high specificity (AUC = 0.953); however, future studies should quantify false-positive rates across diverse clinical scenarios and incorporate complication-specific variables, such as findings from endoscopic retrograde cholangiopancreatography (ERCP) and characteristics of choledocholithiasis.
Assessing the severity of AP is crucial for guiding treatment strategies. Various methods are currently employed to predict AP severity. Studies have indicated that the combined sensitivities of the APACHE-II, BISAP, and Ranson scores are 0.67 (95% CI: 0.60–0.73), 0.59 (95% CI: 0.48–0.70), and 0.61 (95% CI: 0.40–0.79), respectively, suggesting that there is significant potential for improvement in their predictive accuracy (25). Additionally, some have utilized CT scans for predicting AP severity (26). In recent years, with advancements in artificial intelligence, several machine learning-based AP prediction models have been developed (27, 28). However, these models still require effective validation to ensure their reliability and accuracy in clinical settings.
In this study, LASSO regression was employed to screen variables with MAP status as the dependent variable, followed by logistic regression analysis on the identified variables. WBC count, hs-CRP, CA50, CA19-9, CA125, urinary amylase, total bilirubin, aspartate aminotransferase, and hospitalization duration were pinpointed as risk factors for MSAP or SAP. Multivariate logistic regression analysis confirmed hospitalization duration as an independent risk factor for MSAP or SAP (Table 3). The significant association between hospitalization duration and disease severity suggests that more severe cases require extended care due to complications and the need for tailored treatment approaches. However, it is important to note that hospitalization length can also be influenced by factors unrelated to disease severity, such as delays in discharge planning or specific treatment protocols, which were not explicitly analyzed in this study. Future studies should include complication-specific variables to elucidate this relationship more clearly. ROC curve analysis demonstrated that all variables had predictive value for distinguishing whether a patient was non-MAP (AUC > 0.5) (Figure 3A). The overall model exhibited high accuracy (AUC = 0.953). A risk prediction nomogram for MAP assessment was developed, and the model’s fit was evaluated using calibration metrics, revealing excellent performance (C-index = 0.953), significant results from the likelihood ratio test (P < 0.001), and a good fit (P = 0.240). These findings underscore the importance of admission tumor marker levels in the assessment of MAP, highlighting their significant clinical implications for patient management.
While traditional scoring systems offer general severity stratification for AP, our model provides a biliary pancreatitis-specific risk assessment by integrating tumor markers that are elevated during inflammatory states. This specificity allows for the earlier identification of patients at risk for progression to MSAP or SAP, enabling timely clinical interventions such as ERCP or intensive care monitoring. In contrast to conventional approaches, our model incorporates dynamic biomarkers along with hospitalization duration data, capturing the real-time inflammatory status and clinical progression of patients. This methodology addresses specific limitations of existing scoring systems, particularly the delayed predictive capacity of the APACHE-II and the subjective components of the BISAP scoring system. It is important to note that our model is not intended to replace these standard scoring systems but rather to complement them, enhancing risk stratification during the critical early phase of admission when traditional systems may be least effective. This integration offers a more nuanced approach to managing biliary pancreatitis, potentially improving patient outcomes by facilitating earlier and more targeted interventions.
This study is subject to a few limitations. First, the lack of long-term patient follow-up precluded the ability to assess clinical outcomes over time and the potential development of malignancy. Second, our analysis did not consider two potentially significant factors: the presence of concomitant choledocholithiasis and whether patients underwent ERCP procedures, both of which could significantly influence outcomes. Third, the retrospective single-center design spanning from 2016 to 2023 introduces inherent risks of selection bias, including issues such as missing data and the exclusion of patients who did not undergo admission tumor marker testing. Additionally, there may be potential confounding from unmeasured variables such as variations in treatment approaches and differences in physician practice patterns.
Regarding model validation, while our machine learning model demonstrated strong internal accuracy with an AUC of 0.953, its generalizability across diverse populations and healthcare settings has yet to be confirmed due to the lack of external validation. To overcome these limitations, it is crucial to conduct large-scale, prospective multicenter studies that validate the model in diverse populations. Such studies should incorporate real-time data collection to minimize bias. Additionally, external validation is needed, involving the assessment of the model using independent datasets from different hospitals. This step is essential to ensure that the model performs consistently and reliably in various clinical environments.
5 Conclusion
The elevation of tumor markers has demonstrated significant clinical importance in managing patients with biliary pancreatitis. We have developed a machine-learning-based clinical prediction model for MAP by effectively screening variables. This model has the potential to assist clinicians in refining their treatment plans, enabling more personalized and timely interventions for patients. This tool not only underscores the significance of tumor markers in predicting disease severity but also highlights the utility of advanced analytical techniques in enhancing patient management strategies.
Data availability statement
The raw data supporting the conclusions of this article will be made available by the authors, without undue reservation.
Ethics statement
The study design was approved by the Jiangsu University Affiliated Hospital (approval no: KY2025K0504). The studies were conducted in accordance with the local legislation and institutional requirements. Written informed consent for participation in this study was provided by the participants’ legal guardians/next of kin. Written informed consent was obtained from the individual(s) for the publication of any potentially identifiable images or data included in this article.
Author contributions
HH: Data curation, Writing – original draft, Writing – review & editing. ZL: Investigation, Resources, Writing – original draft. YL: Data curation, Investigation, Resources, Writing – original draft. LZ: Data curation, Funding acquisition, Investigation, Project administration, Writing – original draft. JC: Conceptualization, Funding acquisition, Validation, Writing – original draft. XF: Conceptualization, Funding acquisition, Project administration, Writing – original draft, Writing – review & editing.
Funding
The author(s) declare that financial support was received for the research and/or publication of this article. This work was supported by the Jiangsu Commission of Health (Grant no. LKZ2023012), Zhenjiang Gastrointestinal Tumor Clinical Medical Key Laboratory (Grant no. SS2023011), Social Development Project of Zhenjiang City (Grant no. SH2022061), and New Technology and New Programs of Jiangsu University Hospital (xjs2024201).
Conflict of interest
The authors declare that the research was conducted in the absence of any commercial or financial relationships that could be construed as a potential conflict of interest.
Generative AI statement
The authors declare that no Generative AI was used in the creation of this manuscript.
Publisher’s note
All claims expressed in this article are solely those of the authors and do not necessarily represent those of their affiliated organizations, or those of the publisher, the editors and the reviewers. Any product that may be evaluated in this article, or claim that may be made by its manufacturer, is not guaranteed or endorsed by the publisher.
Abbreviations
ABP, Acute biliary pancreatitis; AP, Acute pancreatitis; AUC, Area under the curve; BISAP, Bedside Index for Severity in Acute Pancreatitis; CT, Computed tomography; LASSO, Least absolute shrinkage and selection operator; MAP, Mild acute pancreatitis; MOF, Multiple organ failure; MSAP, Moderately severe acute pancreatitis; ROC, Receiver operating characteristic; SAP, Severe acute pancreatitis; WBC, White blood cell count.
References
1. Xiao AY, Tan ML, Wu LM, Asrani V, Windsor J, Yadav D, et al. Global incidence and mortality of pancreatic diseases: A systematic review, meta-analysis, and meta-regression of population-based cohort studies. Lancet Gastroenterol Hepatol. (2016) 1:45–55. doi: 10.1016/S2468-125330004-8
2. Petrov MS, Yadav D. Global epidemiology and holistic prevention of pancreatitis. Nat Rev Gastroenterol Hepatol. (2019) 16:175–84. doi: 10.1038/s41575-018-0087-5
3. Iannuzzi J, King J, Leong J, Quan J, Windsor J, Tanyingoh D, et al. Global incidence of acute pancreatitis is increasing over time: A systematic review and meta-analysis. Gastroenterology. (2022) 162:122–34. doi: 10.1053/j.gastro.2021.09.043
4. Zaman S, Gorelick F. Acute pancreatitis: Pathogenesis and emerging therapies. J Pancreatol. (2024) 7:10–20. doi: 10.1097/JP9.0000000000000168
5. Boxhoorn L, Voermans R, Bouwense S, Bruno M, Verdonk R, Boermeester M, et al. Acute pancreatitis. Lancet. (2020) 396:726–34. doi: 10.1016/S0140-673631310-6
6. Chatila A, Bilal M, Guturu P. Evaluation and management of acute pancreatitis. World J Clin Cases. (2019) 7:1006–20. doi: 10.12998/wjcc.v7.i9.1006
7. Mederos M, Reber H, Girgis M. Acute pancreatitis: A review. JAMA. (2021) 325:382–90. doi: 10.1001/jama.2020.20317
8. Wu B, Johannes R, Sun X, Tabak Y, Conwell D, Banks P. The early prediction of mortality in acute pancreatitis: A large population-based study. Gut. (2008) 57:1698–703. doi: 10.1136/gut.2008.152702
9. Luo X, Wang J, Wu Q, Peng P, Liao G, Liang C, et al. A modified Ranson score to predict disease severity, organ failure, pancreatic necrosis, and pancreatic infection in patients with acute pancreatitis. Front Med (Lausanne). (2023) 10:1145471. doi: 10.3389/fmed.2023.1145471
10. Silva-Vaz P, Abrantes AM, Castelo-Branco M, Gouveia A, Botelho MF, Tralhão JG. Multifactorial scores and biomarkers of prognosis of acute pancreatitis: Applications to research and practice. Int J Mol Sci. (2020) 21:338. doi: 10.3390/ijms21010338
11. Wang L, Zeng Y, Chen J, Luo Q, Wang R, Zhang R, et al. A simple new scoring system for predicting the mortality of severe acute pancreatitis: A retrospective clinical study. Medicine (Baltimore). (2020) 99:e20646. doi: 10.1097/MD.0000000000020646
12. Gao W, Yang H, Ma C. The value of BISAP score for predicting mortality and severity in acute pancreatitis: A systematic review and meta-analysis. PLoS One. (2015) 10:e0130412. doi: 10.1371/journal.pone.0130412
13. Pandey R, Pathak R, Jha A, Gnawali A, Koirala D. Comparison of acute physiology and chronic health evaluation II, bedside index for severity in acute pancreatitis and modified computed tomography severity index scores in predicting the outcome in acute pancreatitis in a tertiary care centre in Nepal. J Nepal Health Res Counc. (2023) 21:203–6. doi: 10.33314/jnhrc.v21i02.4379
14. Kawaguchi T, Araki Y, Kajiwara A, Nakao K, Sakakibara S, Sasaki Y, et al. A significant increase in the serum carbohydrate antigen 19-9 level accompanied by acute cholecystitis and choledocholithiasis: A case report and review of the literature. Intern Med. (2024) 63:1713–8. doi: 10.2169/internalmedicine.2597-23
15. Cao F, Li F, Zhao Y. Interpretation of the “Chinese guidelines for diagnosis and treatment of acute pancreatitis (2021)”. Chin J Pract Surg. (2021) 41:4. doi: 10.19538/j.cjps.issn1005-2208.2021.07.06
16. Banks P, Bollen T, Dervenis C, Gooszen H, Johnson C, Sarr M, et al. Classification of acute pancreatitis–2012: Revision of the Atlanta classification and definitions by international consensus. Gut. (2013) 62:102–11. doi: 10.1136/gutjnl-2012-302779
17. Shan M, Tian Q, Zhang L. Serum CA50 levels in patients with cancers and other diseases. Prog Mol Biol Transl Sci. (2019) 162:187–98. doi: 10.1016/bs.pmbts.2018.12.006
18. Doğan ÜB, Gümürdülü Y, Gölge N, Kara B. Relationship of CA 19-9 with choledocholithiasis and cholangitis. Turk J Gastroenterol. (2011) 22:171–7. doi: 10.4318/tjg.2011.0186
19. Chen Y, Gao S, Chen J, Wang G, Wang Z, Zhou B, et al. Serum CA242, CA199, CA125, CEA, and TSGF are biomarkers for the efficacy and prognosis of cryoablation in pancreatic cancer patients. Cell Biochem Biophys. (2015) 71:1287–91. doi: 10.1007/s12013-014-0345-2
20. Mei Y, Chen L, Peng C, Wang J, Zeng P, Wang G, et al. Diagnostic value of elevated serum carbohydrate antigen 199 level in acute cholangitis secondary to choledocholithiasis. World J Clin Cases. (2018) 6:441–6. doi: 10.12998/wjcc.v6.i11.441
21. Chung S, Chen K, Xirasagar S, Tsai M, Lin H. More than 9-times increased risk for pancreatic cancer among patients with acute pancreatitis in Chinese population. Pancreas. (2012) 41:142–6. doi: 10.1097/MPA.0b013e31822363c3
22. Yang L, Du L, Hou B, Niu X, Wang W, Shen W. Clinical value of combined multi-indicator tests in diagnosis of benign ovarian. Int J Gen Med. (2023) 16:2047–53. doi: 10.2147/IJGM.S410393
23. Li K, Xu Y, Qi R. Differential diagnosis and treatment strategy analysis of xanthogranulomatous cholecystitis and gallbladder cancer. Abdomin Surg. (2023) 36:287–94. doi: 10.3969/j.issn.1003-5591.2023.04.008
24. Hakimian D, Turvall E, Israel S, Ackerman Z. Lack of correlation between serum ferritin levels and patient outcome in israeli adults with hepatitis a infection. Isr Med Assoc J. (2019) 21:676–80.
25. Qian R, Zhuang J, Xie J, Cheng H, Ou H, Lu X, et al. Predictive value of machine learning for the severity of acute pancreatitis: A systematic review and meta-analysis. Heliyon. (2024) 10:e29603. doi: 10.1016/j.heliyon.2024.e29603
26. Han X, Hu M, Ji P, Liu Y. Construction and alidation of a severity prediction model for acute pancreatitis based on CT severity index: A retrospective case-control study. PLoS One. (2024) 19:e0303684. doi: 10.1371/journal.pone.0303684
27. Tarján D, Hegyi P. Acute pancreatitis severity prediction: It is time to use artificial intelligence. J Clin Med. (2022) 12:290. doi: 10.3390/jcm12010290
Keywords: elevated, tumor markers, biliary, pancreatitis, clinical significance
Citation: Han H, Li Z, Li Y, Zhang L, Chen J and Fan X (2025) Clinical significance of elevated tumor markers in patients with biliary pancreatitis. Front. Med. 12:1486963. doi: 10.3389/fmed.2025.1486963
Received: 14 November 2024; Accepted: 13 May 2025;
Published: 04 June 2025.
Edited by:
Ping Wang, Michigan State University, United StatesReviewed by:
Priyal Mehta, Saint Vincent Hospital, United StatesMuhammad Daniyal Waheed, Maroof International Hospital, Pakistan
Copyright © 2025 Han, Li, Li, Zhang, Chen and Fan. This is an open-access article distributed under the terms of the Creative Commons Attribution License (CC BY). The use, distribution or reproduction in other forums is permitted, provided the original author(s) and the copyright owner(s) are credited and that the original publication in this journal is cited, in accordance with accepted academic practice. No use, distribution or reproduction is permitted which does not comply with these terms.
*Correspondence: Xin Fan, ZHJmYW54aW5AMTYzLmNvbQ==