 Qianqian Gao1
 Hongbin Zhu2*
- 1Chaohu Hospital Affiliated with Anhui Medical University, Chaohu, China
- 2Department of Respiratory and Critical Care Medicine, Chaohu Hospital Affiliated with Anhui Medical University, Chaohu, China
Aim: To develop and validate a risk prediction model for estimating the likelihood of insomnia in patients with acute exacerbations of chronic obstructive pulmonary disease (AECOPD).
Methods: This prospective study enrolled 253 patients with AECOPD treated at the Department of Respiratory and Critical Care Medicine, Chaohu Hospital Affiliated with Anhui Medical University, between September 2022 and April 2024. Patients were randomly assigned to a training set and a testing set in a 7:3 ratio. Least Absolute Shrinkage and Selection Operator (LASSO) regression analysis was conducted in the training set to identify factors associated with insomnia in patients with AECOPD. A nomogram was constructed based on four identified variables to visualize the prediction model. Model validation involved the Hosmer-Lemeshow test, and its performance was assessed through receiver operating characteristic (ROC) curves, calibration curves, and decision curve analysis (DCA). Model interpretability was further enhanced using SHapley Additive exPlanations (SHAP).
Results: PSQI grade, marital status (widowed), white blood cell (WBC) count, and eosinophil percentage (EOS%) were identified as significant predictors of insomnia in patients with AECOPD. The nomogram based on these predictors exhibited excellent predictive performance, with areas under the ROC curve (AUCs) of 0.987 and 0.933 for the training and testing sets, respectively. The calibration curves and Hosmer-Lemeshow test demonstrated strong agreement between predicted and observed outcomes, while DCA confirmed the model’s superior clinical utility.
Conclusion: This study established a risk prediction model based on four variables to estimate the probability of insomnia in patients with AECOPD. The model exhibited excellent predictive accuracy and clinical applicability, offering valuable guidance for early identification and management of insomnia in this population.
1 Introduction
Chronic obstructive pulmonary disease (COPD) is a prevalent lung disorder characterized by airflow limitation and breathing difficulties. It has emerged as the third leading cause of death globally (1). In 2019, the prevalence of COPD among individuals aged 30–79 ranged from 7.6 to 10.6% (2), with the disease responsible for over 3 million deaths that year (3). The Global Burden of Disease Study reported that in 2022, COPD was the second leading cause of disability-adjusted life years and mortality worldwide, surpassed only by cardiovascular diseases. This significant health burden is expected to persist through 2050 (4).
The primary symptoms of COPD are dyspnea and chronic cough with sputum production, while insomnia is also a common comorbidity (5). Insomnia activates inflammatory pathways, triggering the release of pro-inflammatory cytokines such as TNF-α and IL-6 (6). Additionally, it contributes to oxidative stress by promoting free radical production and suppressing antioxidant mechanisms, leading to redox imbalance (7). These processes intensify systemic inflammation in COPD patients, further aggravating respiratory symptoms and diminishing sleep quality. Furthermore, airflow limitation and lung hyperinflation associated with COPD exacerbate hypoventilation during sleep, resulting in hypoxemia and hypercapnia, which increase the frequency of awakenings (8). Chronic hypoxia activates the sympathetic nervous system, causing an elevated heart rate, increased blood pressure, and psychological disturbances such as anxiety and worry, all of which further contribute to insomnia (9, 10). Insomnia in COPD patients is also linked to mental health disorders such as depression and anxiety. Additionally, common treatments for COPD—including corticosteroids (10), quinolone antibiotics (11), and the use of ventilatory support (12)—may adversely affect sleep quality.
Patients with COPD and comorbid insomnia frequently exhibit reduced sleep efficiency, poor sleep quality, and an increased tendency toward fatigue, attention deficits, and excessive daytime sleepiness (13). Insomnia may also contribute to a range of adverse outcomes, including heightened risks of anxiety, depression, and cognitive impairment, along with increased reliance on sedatives and the potential development of cardiovascular complications (14). Additionally, chronic hypoxia and sleep deprivation can intensify systemic inflammation, drive disease progression, and elevate the risk of acute exacerbations of COPD (AECOPD) and associated mortality (15).
Previous studies have primarily focused on exploring the associations between AECOPD and common hematological indicators, such as routine blood tests and liver and kidney function, while fewer have investigated patients’ psychological status or treatment-related factors (16, 17). In recent years, the application of emerging technologies like machine learning has underscored the significant role of psychological status and lifestyle factors in predicting insomnia (18). Additionally, by integrating various clinical and non-clinical features, some studies have successfully developed risk prediction models for acute exacerbations of AECOPD, offering new perspectives on understanding patients’ overall health (19). Building on previous research regarding insomnia in patients with AECOPD, this study integrates patients’ clinical characteristics and treatment methods—particularly the use of corticosteroids, quinolone antibiotics, and ventilatory support—to further explore the associated risk factors. A nomogram-based risk prediction model for insomnia was developed, providing clinicians with a quantitative and visually intuitive tool for the early identification of high-risk patients and the design of personalized interventions. This approach not only enhances treatment strategies but also reduces the disease burden, ultimately improving the patients’ overall quality of life.
2 Materials and methods
2.1 Study design and participants
We collected data from 253 patients experiencing AECOPD who were treated at Chaohu Hospital Affiliated with Anhui Medical University between September 2022 and April 2024.
Inclusion criteria included: (1) Diagnosis of COPD based on the Global Initiative for Chronic Obstructive Lung Disease 2023 Report: GOLD Executive Summary (20): Patients present with dyspnea, chronic cough, sputum production, a history of recurrent lower respiratory tract infections, and exposure to risk factors for the disease. Pulmonary function tests performed during either a previous or current hospitalization reveal FEV1/FVC < 70% following bronchodilator administration, with other diagnoses excluded, confirming the COPD diagnosis. (2) Hospitalization due to acute exacerbation: Symptoms have worsened rapidly, requiring modifications to the treatment plan.
Exclusion criteria included: (1) those with a diagnosed history of mental illness or severe organ failure. (2) Individuals who had used antidepressants, sedatives, or long-term sleep medications in the past month. (3) Patients with impaired consciousness or language function. (4) Individuals unable to complete the survey for any reason. (5) Patients with other conditions in the past month that significantly affected sleep quality, such as trauma or fractures. (6) Patients with incomplete clinical or pathological data.
This study was conducted in accordance with the Declaration of Helsinki and received approval from the Ethics Committee of Chaohu Hospital Affiliated to Anhui Medical University (Approval Number: KYXM-202209-009). In addition, informed consent has been obtained from all participating individuals.
2.2 Clinical baseline data
Clinical and pathological data were collected from patients, including age, gender, smoking history, marital status (widowed or not), education level, body mass index (BMI), comorbidities, number of hospitalizations in the past year, mMRC grade, and CAT score. The Pittsburgh Sleep Quality Index (PSQI) and Insomnia Severity Index (ISI) were used to assess sleep quality over the past month. Laboratory tests performed within 24 h of admission included routine blood tests, coagulation profile, liver and kidney function, and trace elements. Additionally, detailed information regarding medications, ventilator use, and any resuscitation measures taken during the hospitalization was recorded.
2.3 Assessment of sleep status
The Insomnia Severity Index (ISI) is used to assess sleep patterns and the impact of insomnia over a two-week period. The scale consists of seven questions, each rated from 0 to 4 (0 = none, 4 = very much or severe). A total score of ≤7 indicates no clinically significant insomnia, while a score > 7 suggests the presence of insomnia.
The Pittsburgh Sleep Quality Index (PSQI) is a scale used to evaluate nighttime sleep quality and sleep behaviors over the past month. It includes 19 items, with a total score ranging from 0 to 21. A higher score reflects poorer sleep quality: a score of ≤5 indicates excellent sleep quality, 6–10 indicates good sleep quality, 11–15 indicates fair sleep quality, and 16–21 indicates very poor sleep quality.
All patients completed the questionnaires on the first day of hospitalization before receiving any treatment. Reassessments were performed on the third day of treatment and on the final day of hospitalization. For the final data analysis, the assessment score on the last day of treatment was used.
2.4 Statistical analysis
Statistical analyses were conducted using SPSS version 25.0 and R software (version 4.4.1). Continuous variables with a normal distribution and homogeneity of variance are expressed as mean ± standard deviation (x- ± s) and were analyzed using independent sample t-tests. Data that did not follow a normal distribution or exhibited heterogeneous variances are presented as median (interquartile range) [M (P25–P75)] and were analyzed using non-parametric tests. Categorical variables are presented as frequency [n (%)] and were compared using the chi-square test. Patients were randomly divided into training and testing sets in a 7:3 ratio, and independent risk factors were selected using the Least Absolute Shrinkage and Selection Operator (LASSO) regression. The goodness-of-fit and validity of the risk model were assessed using the Hosmer-Lemeshow test. The nomogram model was developed using the “rms” package. The receiver operating characteristic (ROC) curve was plotted to calculate the area under the curve (AUC) for the predictive model, and its discrimination, calibration, and clinical utility were evaluated using the calibration curve and decision curve analysis (DCA). The model was interpreted using SHAP. All statistical analyses were two-tailed, and statistical significance was set at p < 0.05.
3 Results
3.1 Basic clinical and pathological information of all included patients
This study collected data from 253 patients with AECOPD, of which 19 were excluded due to incomplete medical records, leaving 234 patients for analysis. The patients were grouped based on their ISI scores, with those scoring >7 classified into the insomnia group (n = 130) and those scoring ≤7 as the control group (n = 104). The overall prevalence of insomnia in patients with AECOPD was 55.6%. A comparison of the baseline clinical and pathological data revealed significant differences between the insomnia and control groups in terms of education level, PSQI scores, CAT scores, mMRC grades, and the number of hospitalizations in the past year (p < 0.05), as shown in Table 1.
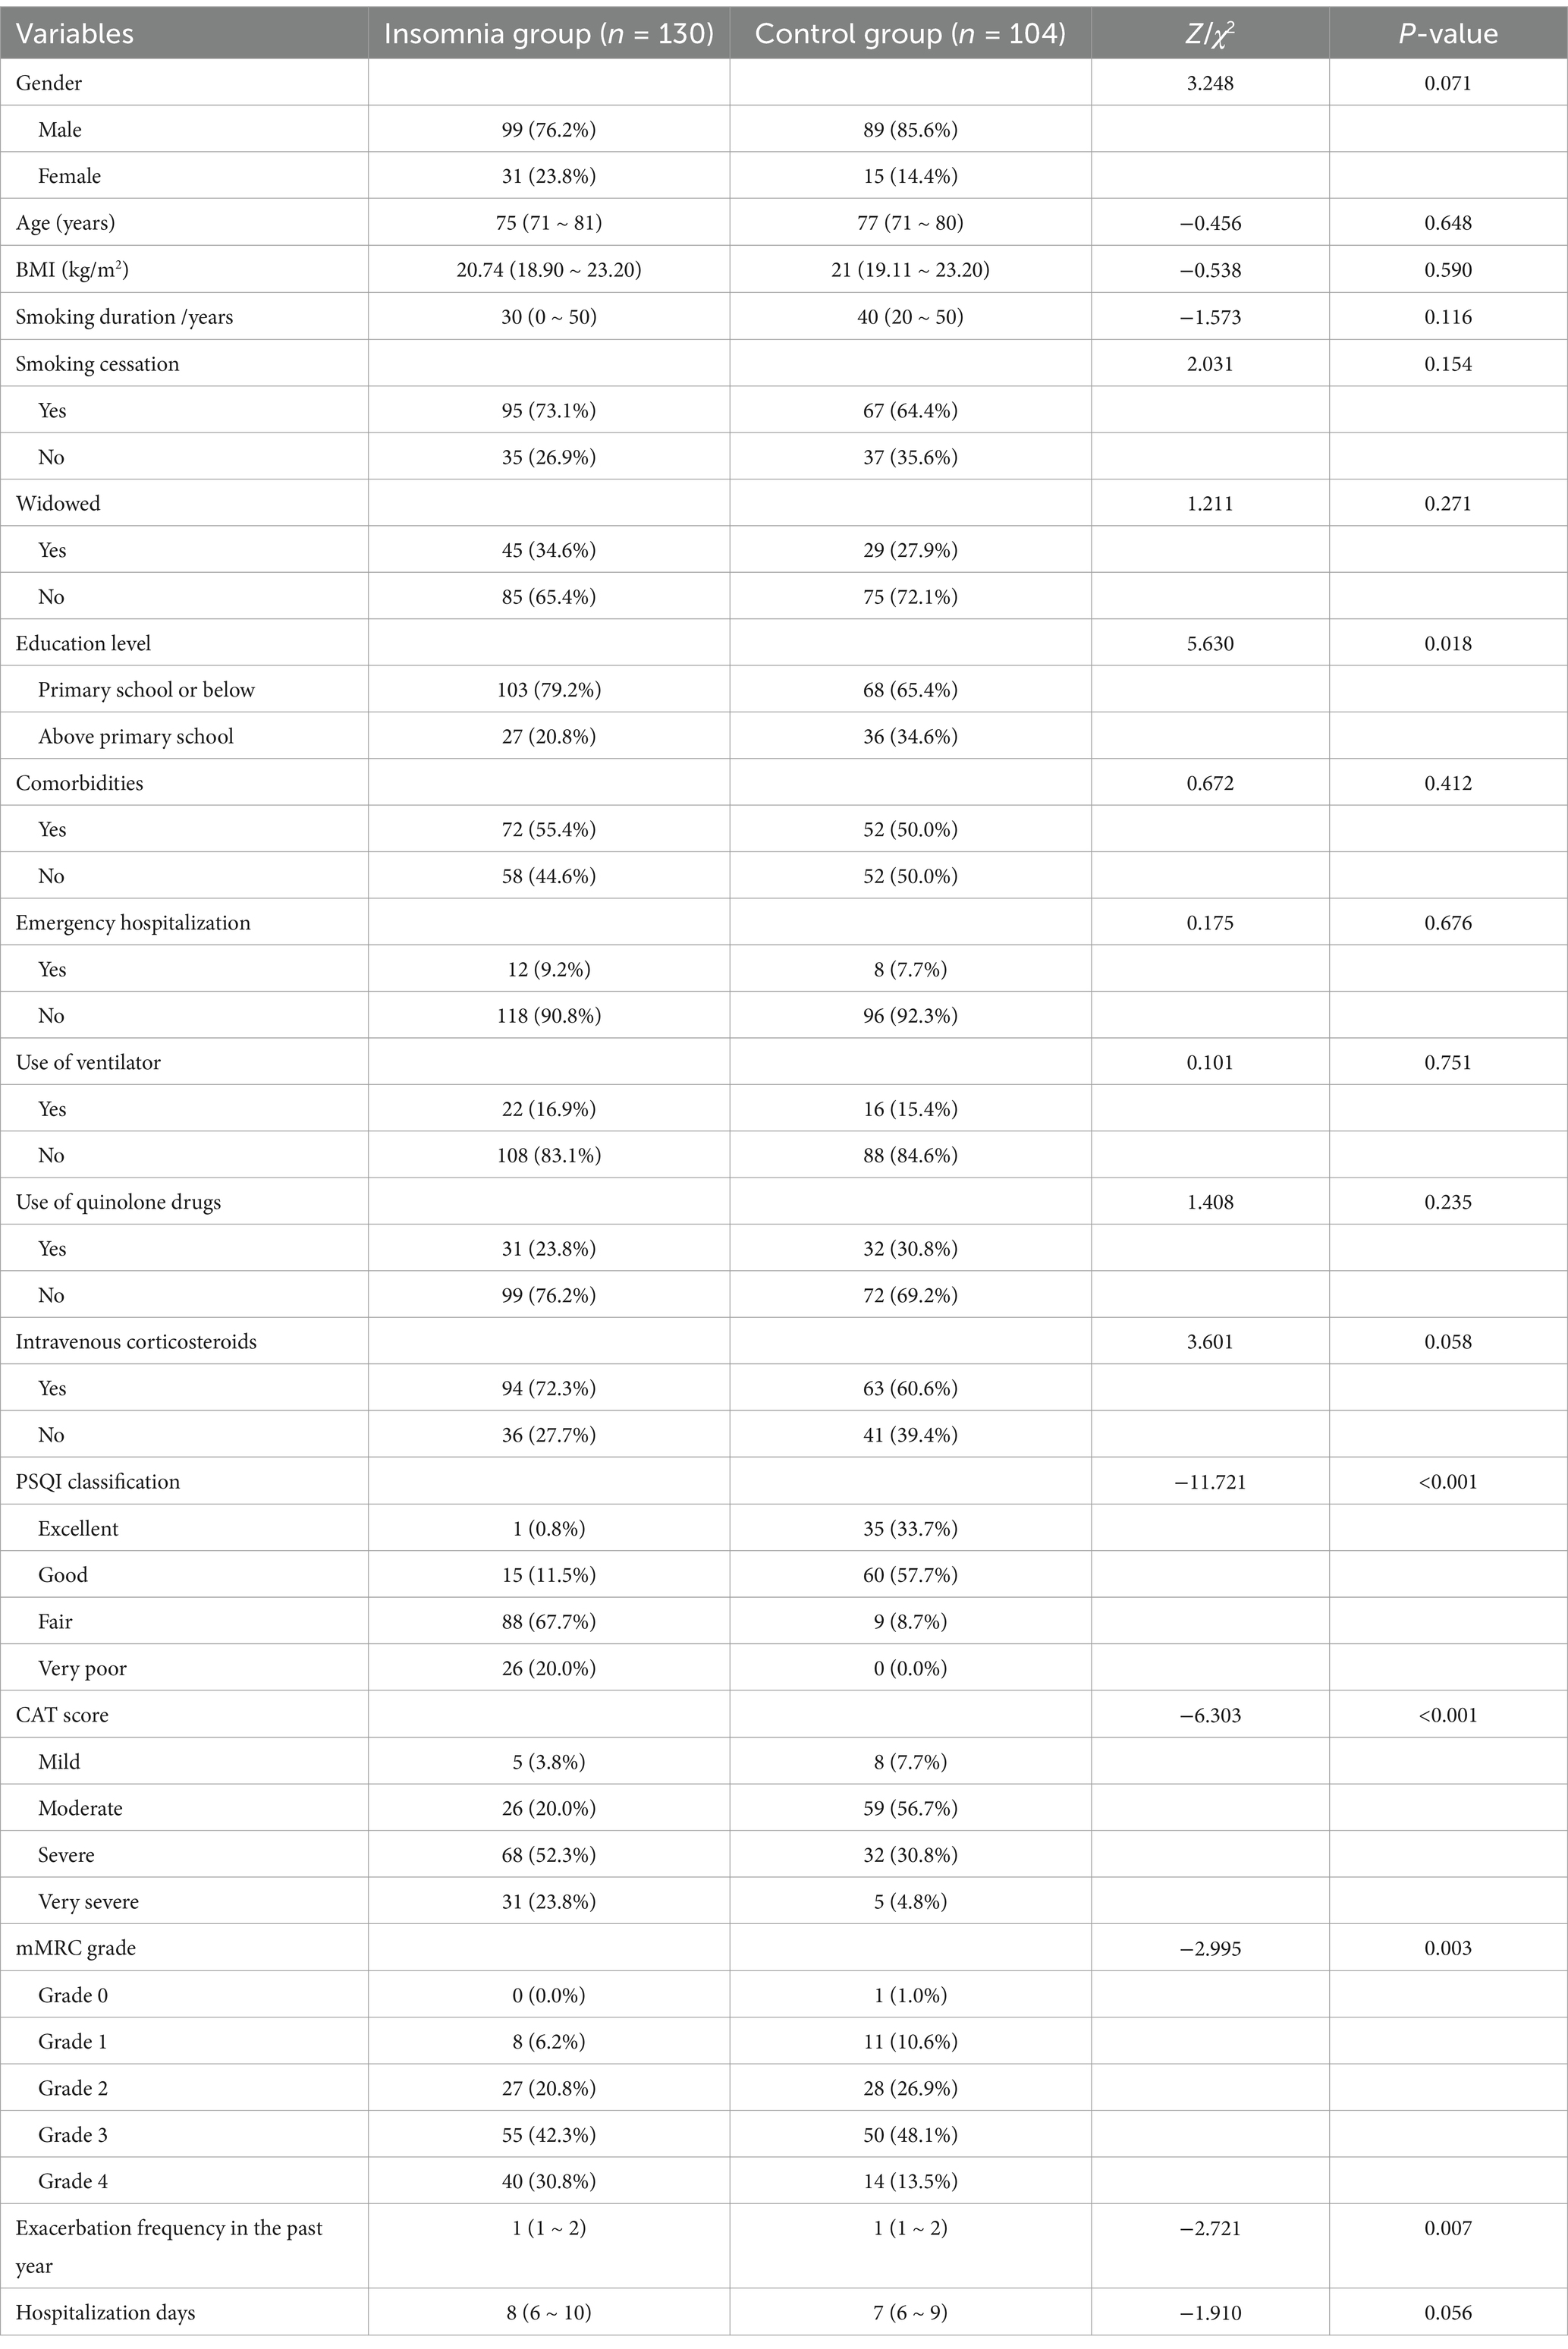
Table 1. Basic clinical and pathological information of all included patients.
3.2 Clinical and pathological data of the training and testing sets
All enrolled patients were randomly assigned to a training set and a testing set in a 7:3 ratio, and their clinical data were subjected to statistical analysis. The training set comprised 164 AECOPD patients, with 91 (55.5%) having comorbid insomnia. The testing set included 70 AECOPD patients, 39 (55.7%) of whom had comorbid insomnia. No significant differences were observed between the two groups regarding insomnia prevalence, laboratory results, or treatment measures (p > 0.05). Detailed data are provided in Table 2.
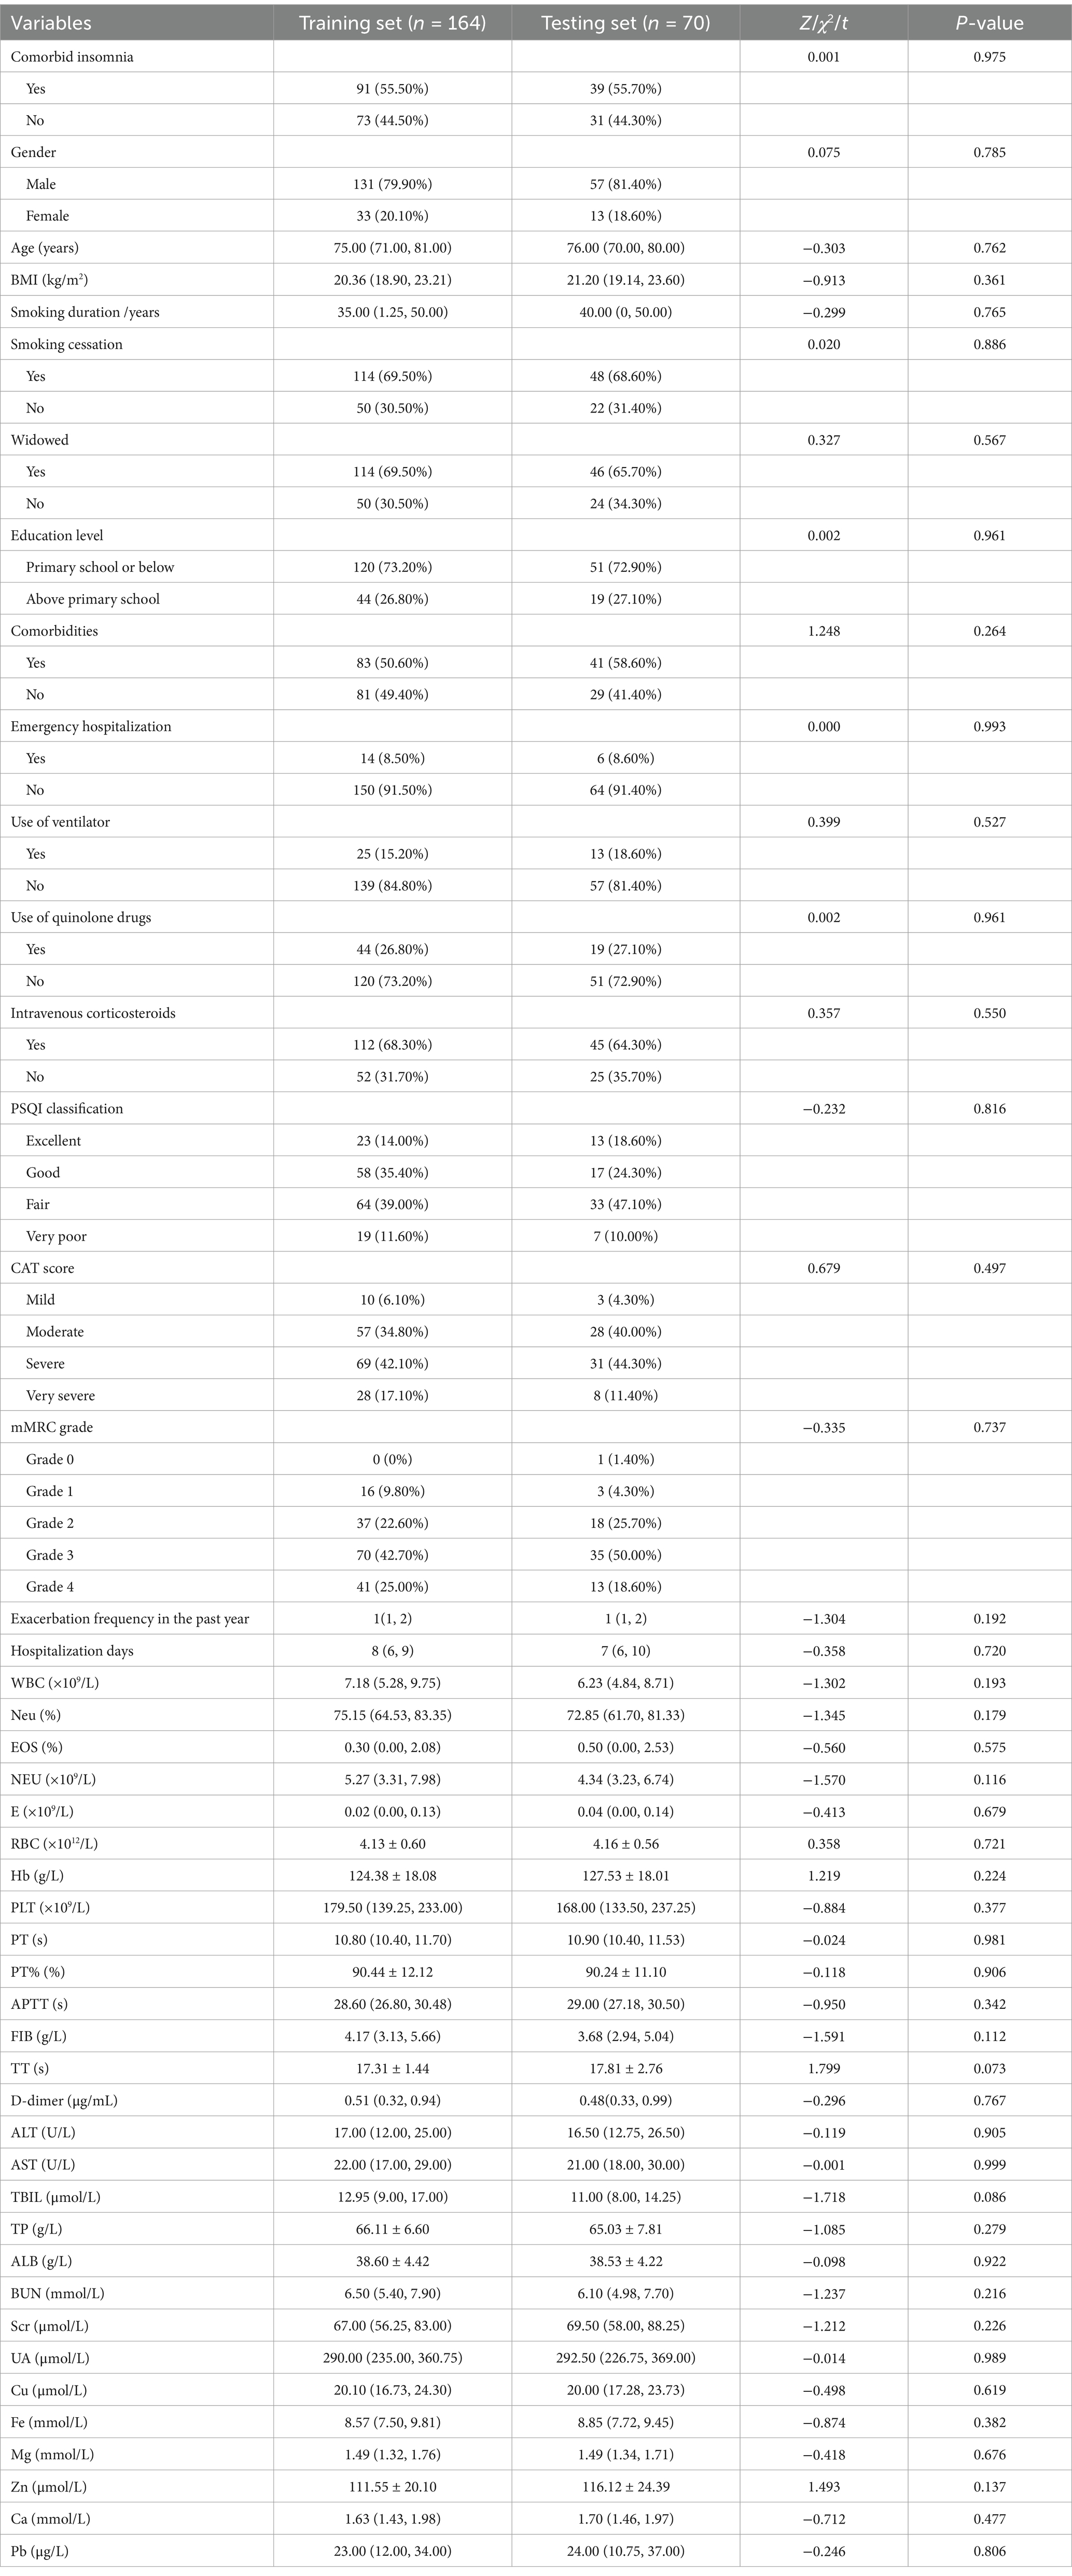
Table 2. Clinical and pathological data of the training and testing sets.
3.3 Selection of predictive factors
Patients were divided into a testing set and a training set using the R function “createDataPartition,” resulting in a testing set of 164 patients and a training set of 70 patients. The LASSO regression model was applied to the 164 patients in the training set to select features with non-zero coefficients. As the penalty coefficient varied, the number of variables in the model gradually decreased. Based on 20-fold cross-validation, the model exhibited excellent performance when the optimal λ value was 0.042 (Log λ = −5.322), as shown in Figure 1. At this stage, we identified four predictive factors for the development of the model: PSQI grading, marital status (whether widowed), white blood cell (WBC), and eosinophil percentage (EOS%).
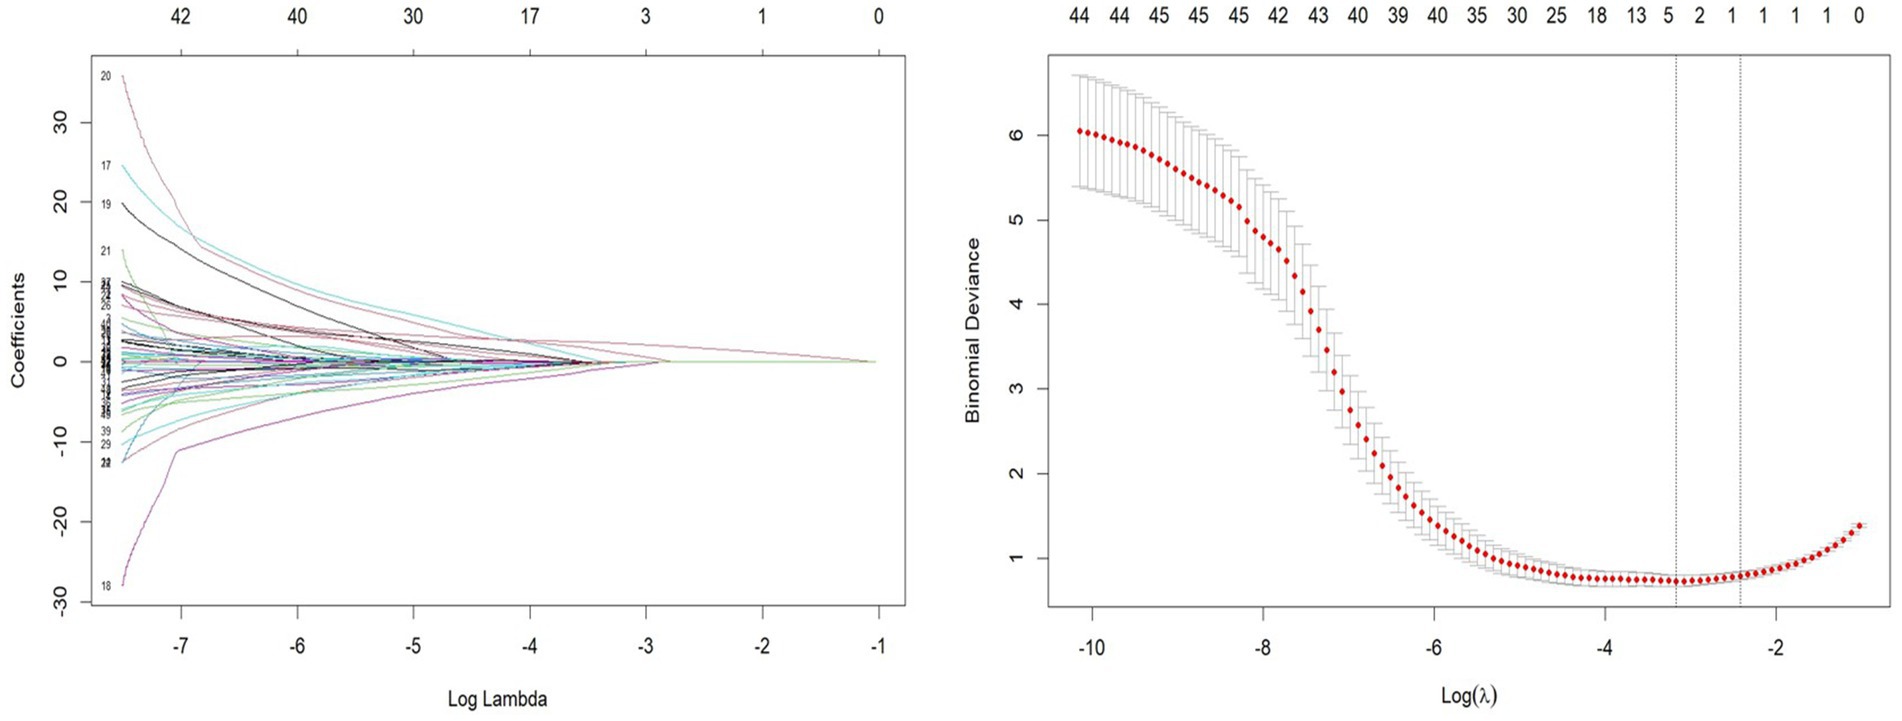
Figure 1. Least absolute shrinkage and selection operator (LASSO) regression path and cross-validation results.
3.4 Risk prediction model
Using LASSO regression analysis, this study developed a risk prediction model for insomnia in patients with AECOPD, which was visually represented with a nomogram (see Figure 2). The nomogram includes four predictive variables: PSQI grade, marital status, WBC, and EOS%. Each predictive factor’s score is mapped to the scoring axis at the top of the nomogram. By summing the scores of all variables, a total score is calculated. This total score is then matched to its corresponding position on the total score axis and extended vertically to the probability axis, providing the likelihood of insomnia in patients with AECOPD. For instance, a total score of 60 corresponds to an insomnia probability of over 50%, while a score of 80 indicates a probability exceeding 95%.
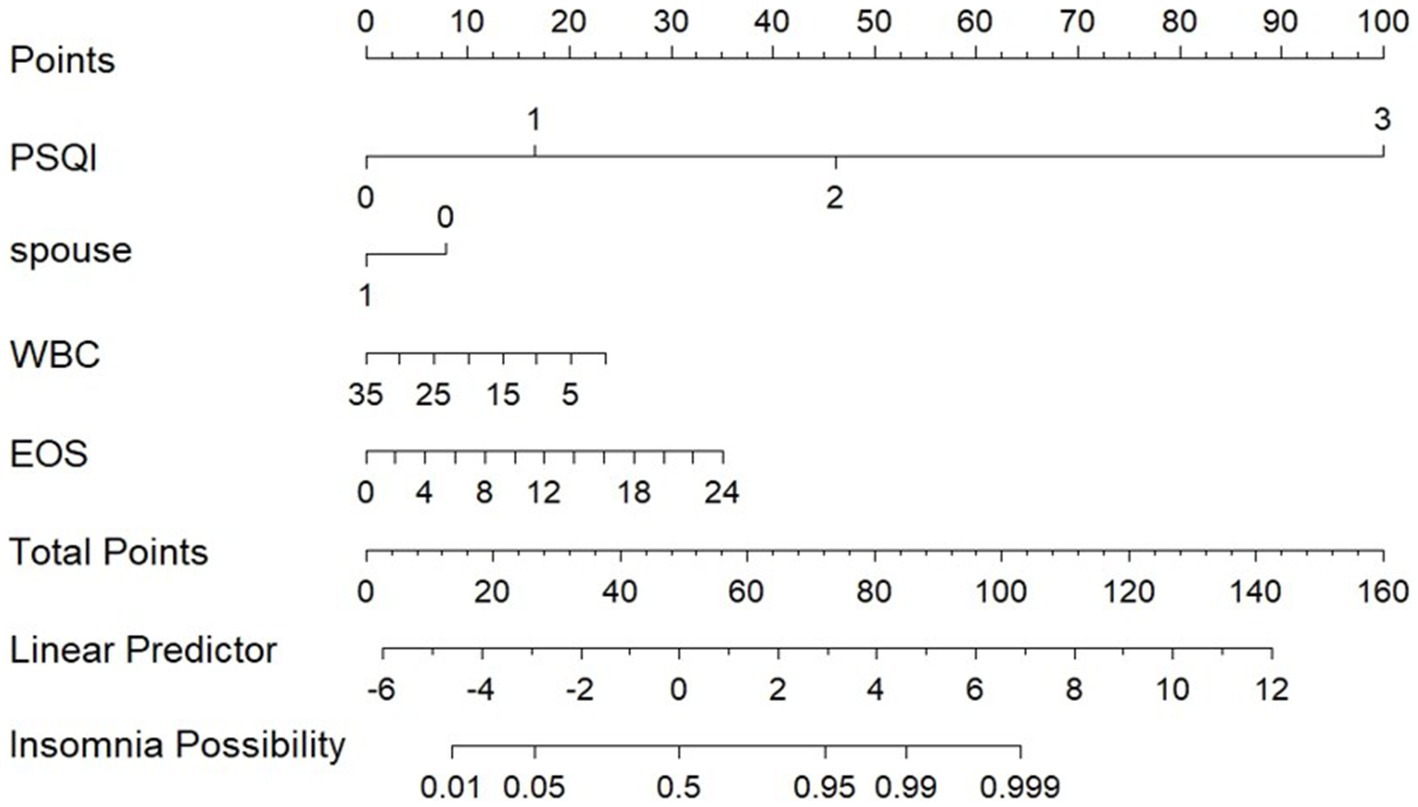
Figure 2. Predictive model of insomnia in patients with AECOPD.
3.5 Model validation and evaluation
This study utilized ROC analysis, calibration curves, and decision curve analysis (DCA) to assess the predictive efficiency of insomnia probability in patients with AECOPD. The results demonstrated that the nomogram exhibited excellent predictive performance. For the training set, the area under the curve (AUC) was 0.987 (95% CI, 0.976–0.998) (as shown in Figure 3A), while the AUC for the testing set was 0.933 (95% CI, 0.8671–1.000) (as shown in Figure 3B). These AUC values indicate the strong diagnostic capability of the nomogram in both datasets.
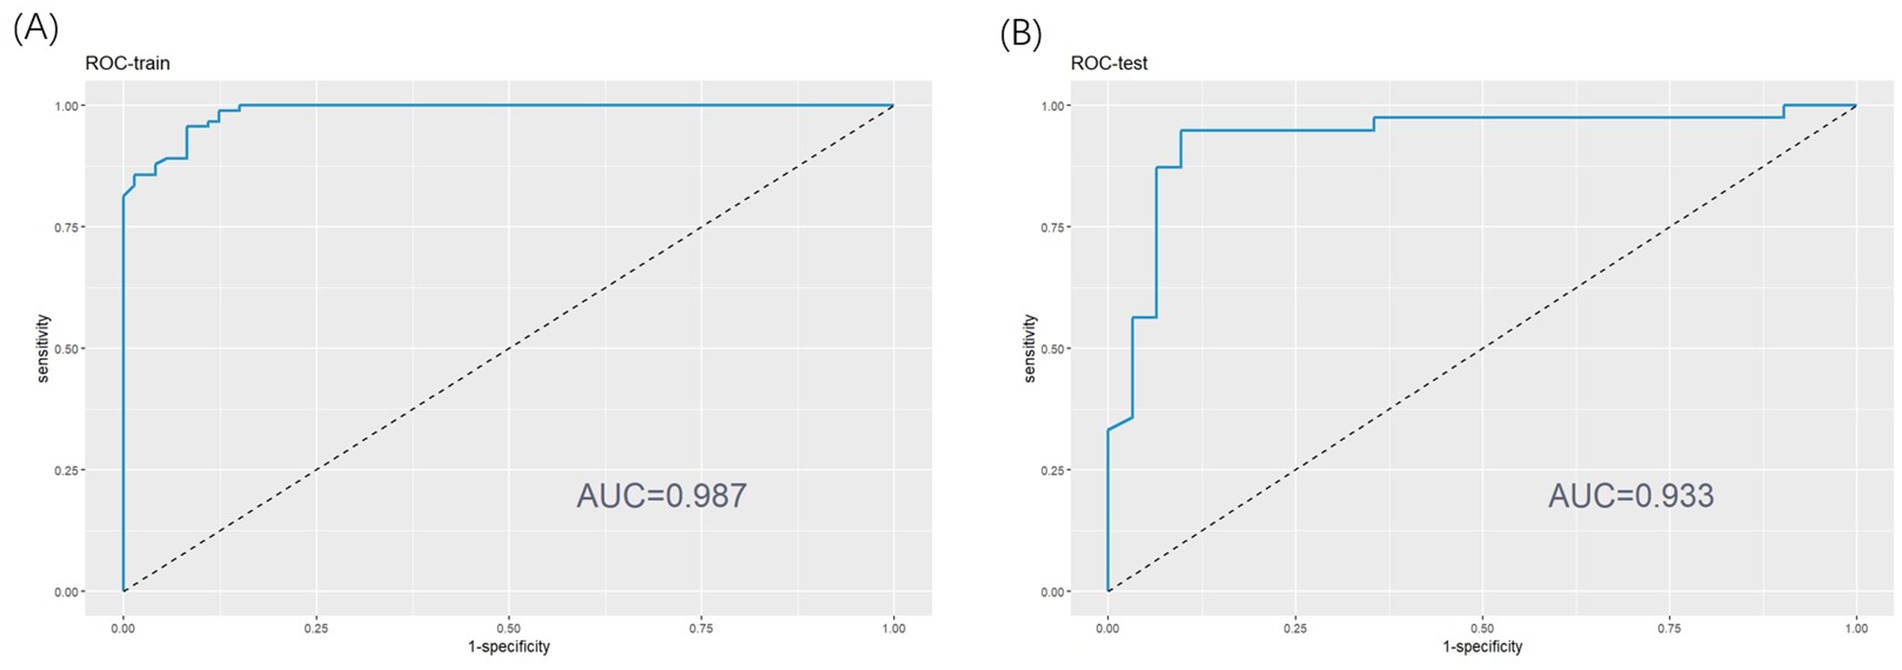
Figure 3. (A) Receiver operating characteristic (ROC) curve of training set. (B) ROC curve of test set.
The Hosmer-Lemeshow test confirmed that the model is consistent with the observed data (p > 0.05). In the calibration curve, the X-axis represents the predicted probability of insomnia in patients with AECOPD, while the Y-axis shows the actual observed probability. The diagonal line represents the ideal model (where predicted values equal observed values). The closer the calibration curve is to the diagonal, the more accurate the model’s predictions. As illustrated in Figures 4A,B, the calibration curve closely aligns with the ideal curve, indicating that the nomogram-based risk prediction model demonstrates strong predictive performance and high reliability.
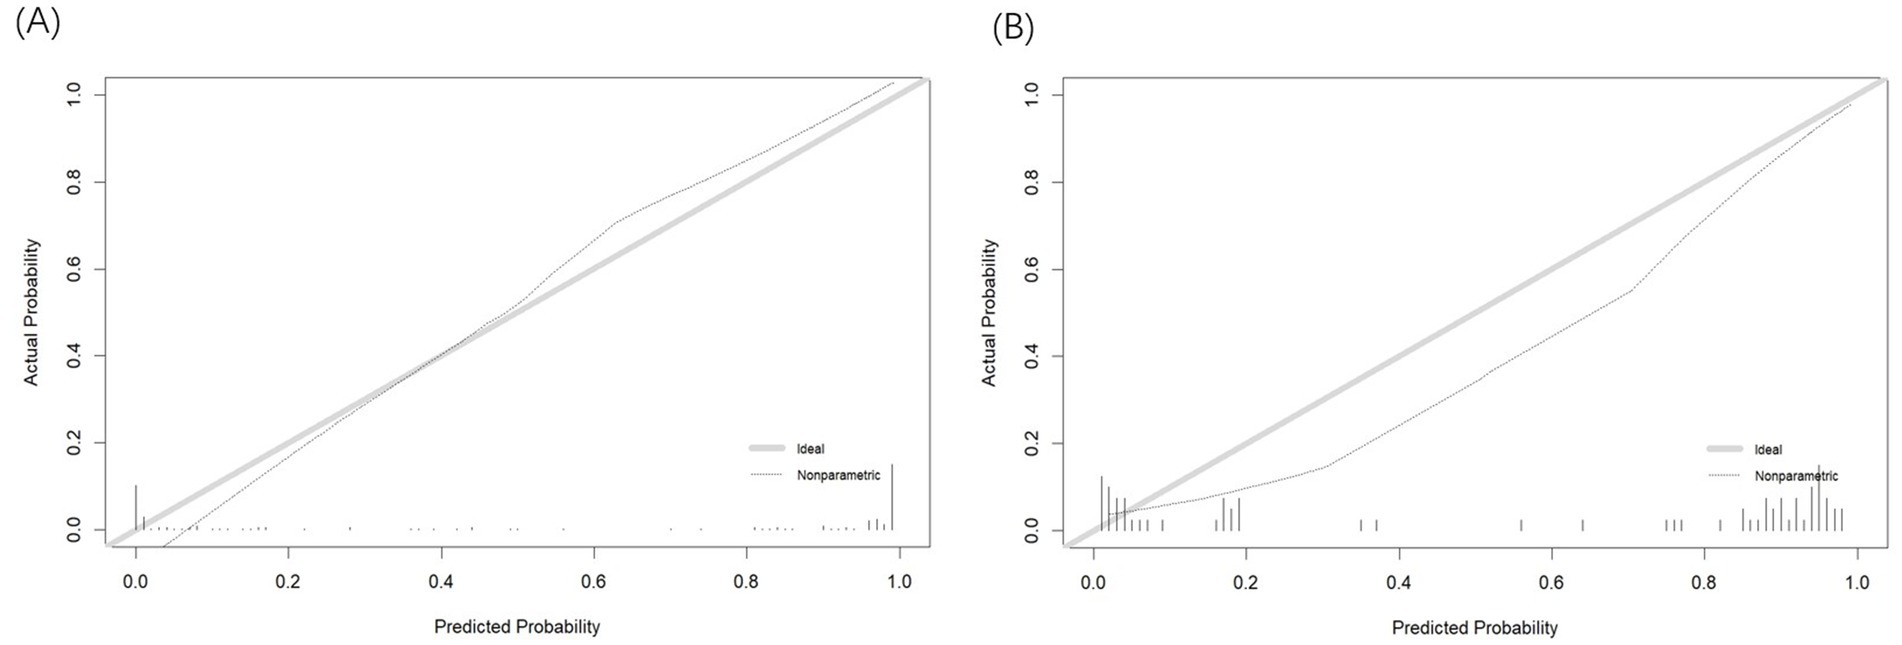
Figure 4. (A) Calibration curve of training set. (B) Calibration curve of test set.
This study also evaluated the clinical effectiveness of the model using Decision Curve Analysis (DCA). Figures 5A,B display the DCA curves for the training and validation sets, respectively. In these figures, the X-axis represents the threshold probability, and the Y-axis represents the net benefit. The green reference line shows the net benefit without any intervention, while the red curve represents the net benefit when all patients receive intervention. In the threshold probability range of 0.1–0.9, the blue curve consistently lies above the reference line, indicating that the prediction model delivers a significant net benefit across most threshold probabilities. This finding supports the model’s effectiveness and clinical applicability.
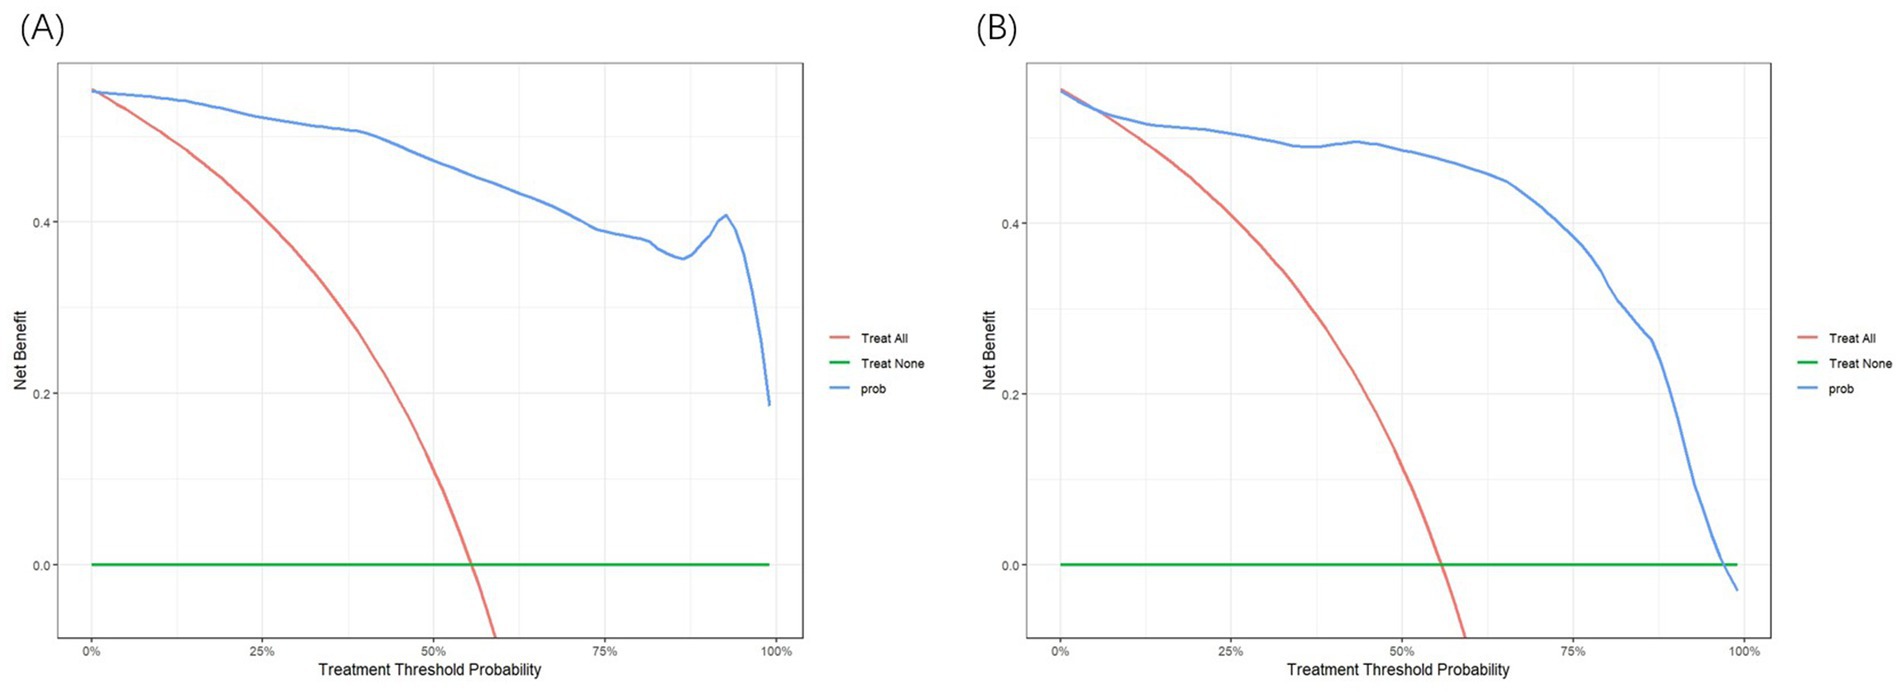
Figure 5. (A) Decision curve analysis (DCA) curve of training set. (B) DCA curve of test set.
3.6 SHAP interpretation of the model
Accurately identifying the key factors influencing insomnia is crucial for developing an effective prediction model. By comparing feature importance using statistical methods, the model’s predictive accuracy and interpretability can be optimized (21). In this study, SHAP was employed for a visual analysis of the importance and dependencies of the selected predictive factors. The results revealed that four variables—PSQI, marital status, WBC, and EOS%—significantly impacted the prediction of insomnia in patients with AECOPD. PSQI score emerged as the most important predictor. Its dependence chart showed a strong correlation between higher PSQI scores and an increased risk of insomnia, with substantial variability. WBC levels also notably influenced the risk of insomnia, with higher WBC levels associated with a greater likelihood of insomnia. Additionally, the variable importance chart highlighted that marital status (being widowed) played a significant role in the model, while WBC and EOS% also contributed to predicting insomnia. Specifically, higher PSQI scores and elevated WBC levels were positively correlated with an increased risk of insomnia, while changes in EOS% were also closely linked to the occurrence of insomnia (Figure 6).
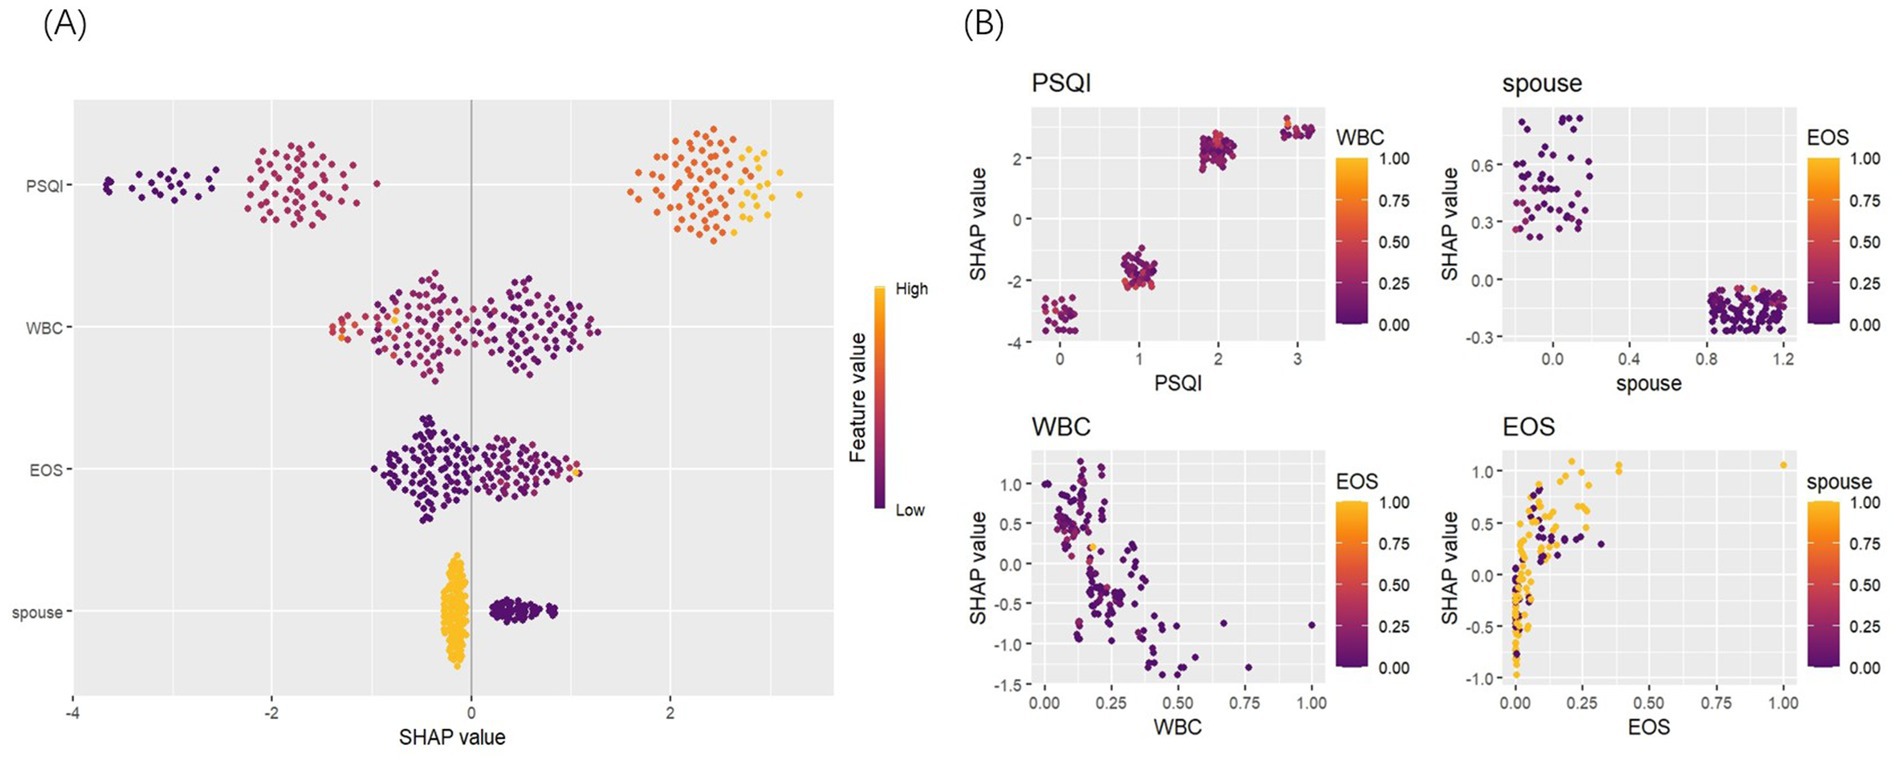
Figure 6. SHAP: (A) feature importance plot. (B) Partial dependence plot.
We used two examples to illustrate how each variable influences the prediction outcome for each sample. In Figure 7A, the model predicts a positive result for an AECOPD patient who actually developed insomnia. The longest red segment in the figure corresponds to the PSQI grade (Level 2), indicating that PSQI grade has the greatest positive contribution to this patient’s insomnia outcome. The second most significant positive influence on the outcome is the WBC level (5.8 * 10^9/L). In Figure 7B, the model predicts a negative result for a patient who did not develop insomnia. The variables with positive impacts include WBC (3.44 * 10^9/L) and EOS% (1.2%). The most influential variables on the outcome are PSQI grade (Level 1) and marital status (not widowed).
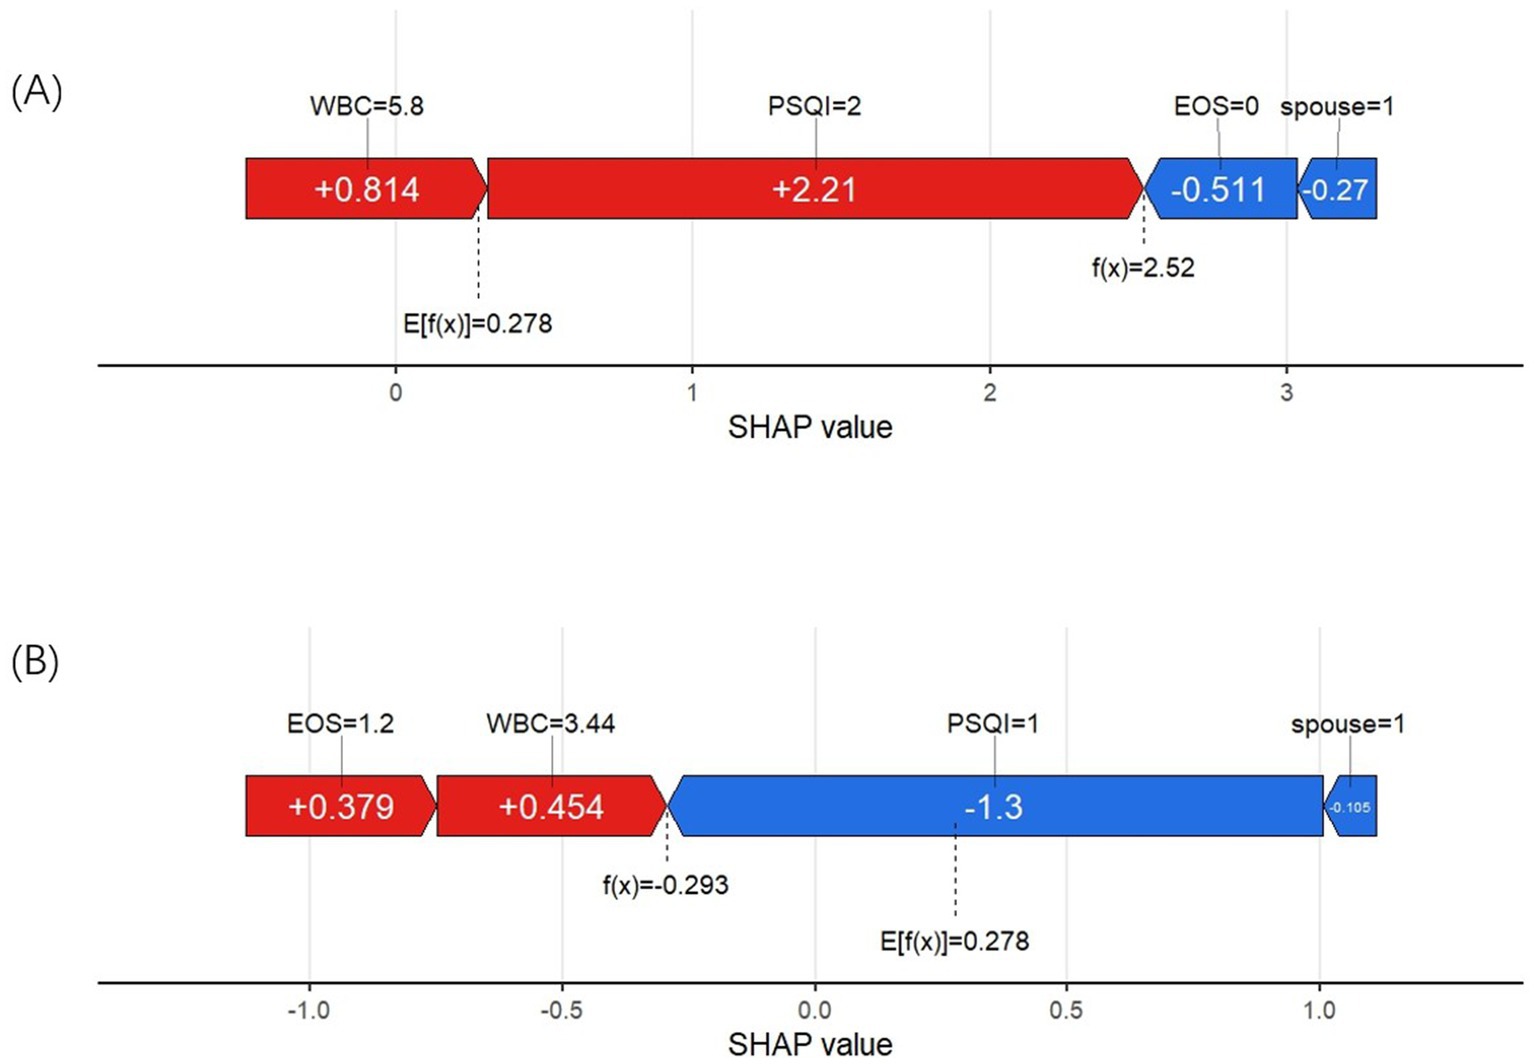
Figure 7. (A) SHAP force plot of a positive result cases. (B) SHAP force plot of a negative result case.
4 Discussion
With the increasing trend of aging, COPD has become more prevalent worldwide, presenting a significant public health challenge. It predominantly affects low- and middle-income countries, with a particularly high prevalence among the elderly population (22). COPD is not confined to the lungs; it is a systemic disease that often impacts the cardiovascular, endocrine, and hematologic systems. Moreover, COPD patients are frequently confronted with psychological disorders such as anxiety, depression, and insomnia (23, 24). Insomnia is widespread among COPD patients and is strongly linked to an increased risk of acute exacerbations (15). Comprehensive assessments and effective interventions for COPD patients with insomnia are crucial in reducing the likelihood of AECOPD and alleviating the associated disease burden.
As such, developing a reliable tool to identify and predict the risk of insomnia in these patients is essential. By using personalized predictive scoring, the model can pinpoint key factors influencing insomnia and provide a quantified risk assessment. Based on these results, clinicians can create more targeted treatment and intervention plans, such as offering psychological counseling to high-risk patients, implementing strategies to improve sleep quality, and closely monitoring systemic inflammation and other relevant indicators. This approach not only improves overall patient care but also enhances COPD treatment outcomes, reduces complications linked to insomnia, and ultimately improves patient prognosis and quality of life.
This study included 234 patients, and the results revealed that the insomnia group had significantly poorer sleep quality scores compared to the control group (p < 0.05). Significant differences were observed between the two groups in CAT scores, mMRC grades, and the number of hospitalizations over the past year (p < 0.05), with the insomnia group exhibiting more severe COPD symptoms, higher scores, and higher grades. LASSO regression identified four variables significantly associated with insomnia in patients with AECOPD: PSQI grade, marital status (widowed), WBC levels, and EOS%. Using the risk prediction model, the SHAP method was applied to interpret the results. The model was validated with ROC curves, calibration curves, and DCA. The validation results demonstrated strong discrimination and calibration abilities, highlighting the model’s high clinical applicability and its potential as an effective tool for identifying high-risk patients.
This study identified the PSQI score as a significant risk factor for insomnia in patients with AECOPD. The PSQI assesses various aspects of sleep, such as sleep latency, sleep efficiency, and the frequency of nocturnal awakenings, providing a comprehensive measure of sleep quality. Patients with AECOPD often experience nocturnal hypoxemia, which activates the sympathetic nervous system, leading to increased heart rate, elevated blood pressure, and disrupted sleep, all of which contribute to reduced overall sleep efficiency (9, 10). Additionally, AECOPD patients frequently face issues such as inadequate ventilation and ventilation-perfusion mismatch, especially when lying in a supine position. Airflow obstruction can cause lung hyperinflation, further increasing respiratory strain. This worsens oxygen exchange, resulting in decreased blood oxygen saturation and increased carbon dioxide retention. Elevated carbon dioxide levels may lead to hypercapnia, exacerbating dyspnea. These pathophysiological changes make patients more susceptible to sleep disturbances and frequent awakenings during the night, severely impairing sleep quality (12, 25). Furthermore, the decline in subjective sleep quality can intensify anxiety and depressive symptoms, creating a vicious cycle that perpetuates and worsens insomnia (26). Thus, the PSQI score serves not only as a crucial predictor of insomnia in AECOPD patients but also indicates that those with higher PSQI scores are more likely to experience insomnia symptoms.
The results of this study indicate that widowhood is a significant risk factor for insomnia in patients with AECOPD. In China, men typically have higher smoking rates, and smoking is one of the main risk factors for COPD, closely linked to the onset of the disease. On the other hand, women often bear a heavier household burden and are frequently exposed to cooking fumes, which may also increase the risk of developing AECOPD (27). Widowhood is often accompanied by psychological stress and emotional trauma, making individuals more susceptible to anxiety, depression, and other negative emotions. These emotional struggles can, in turn, exacerbate insomnia (13). Moreover, widowed individuals often face greater financial pressures and poorer living or working conditions, which may adversely affect the management of AECOPD and significantly increase the risk of insomnia.
The study results suggest that patients with AECOPD and higher WBC levels are more likely to experience insomnia symptoms than those with lower WBC levels. As an easily accessible marker, white blood cell count (WBC) may play a role in the development of insomnia in AECOPD patients through various mechanisms, including inflammation, immune modulation, and sleep disturbances. AECOPD patients are typically in a state of chronic inflammation, and insomnia is closely linked to the release of pro-inflammatory cytokines. Elevated inflammation levels may worsen sleep disturbances by activating the hypothalamic–pituitary–adrenal (HPA) axis and the sympathetic nervous system (28). Furthermore, increased endotoxin levels in the blood of AECOPD patients may stimulate the release of inflammatory markers such as interleukin-6 (IL-6) and tumor necrosis factor-alpha (TNF-α) (29, 30), amplifying the inflammatory response and further disrupting sleep quality. Oxidative stress is another critical mechanism at play. Persistent oxidative stress and inflammation can disrupt the regulation of the nervous system, thereby increasing the risk of insomnia (7, 31). This interaction between inflammation and insomnia may create a vicious cycle that negatively impacts the disease progression and quality of life of AECOPD patients. Therefore, for AECOPD patients with elevated WBC levels, close monitoring of their inflammatory status and sleep patterns is essential, with early interventions to reduce the risk of insomnia and improve clinical outcomes.
Furthermore, the study found that EOS% plays a significant role in predicting insomnia in patients with AECOPD. An elevated eosinophil percentage may influence the pathophysiological processes in AECOPD patients through multiple mechanisms. First, eosinophil-mediated Th2-type inflammatory responses (such as the release of IL-5 and IL-13) may enhance systemic inflammation levels (32), which could potentially cross the blood–brain barrier and interfere with the sleep-regulating function of the HPA axis (28). Second, an increase in EOS% not only reflects an increased systemic inflammatory burden but may also exacerbate airway inflammation, leading to airway hyperreactivity and nocturnal breathing difficulties, which significantly impair sleep quality. Additionally, during the acute phase of AECOPD, patients often experience symptoms such as nighttime dyspnea and coughing, which are closely associated with excessive mucus secretion caused by eosinophils, further contributing to sleep fragmentation and reduced sleep quality (33). Therefore, in clinical practice, it is important to monitor EOS% levels in AECOPD patients with insomnia, using it as a key indicator for identifying those at high risk for insomnia. Interventions targeting systemic inflammation could effectively improve sleep quality while potentially slowing the further progression of AECOPD.
PSQI score, marital status, WBC levels, and EOS% are closely associated with insomnia in various diseases. PSQI, an important tool for assessing sleep quality, is frequently linked to insomnia symptoms and psychological issues in patients with chronic conditions such as cardiovascular diseases, diabetes, and cancer (34, 35). Marital status, particularly widowhood, often leads to heightened feelings of loneliness, emotional trauma, and increased psychological stress, which can exacerbate insomnia, especially in the elderly and those with chronic illnesses. WBC levels, as an inflammation marker, are also elevated in conditions like rheumatoid arthritis (36), potentially interfering with sleep regulation through pro-inflammatory factors. Increased EOS% is associated with nocturnal symptoms in diseases like asthma (37), which can lead to sleep disturbances and worsen insomnia through inflammation and oxidative stress.
This study has several strengths. First, it incorporates a comprehensive analysis of various factors, including clinical characteristics, laboratory tests, and treatment measures, with a specific focus on the impact of corticosteroids, quinolone antibiotics, and mechanical ventilation on insomnia. This approach makes the study more thorough and insightful. Second, we developed, for the first time, a risk prediction model for insomnia in patients with AECOPD, which can assist clinicians in assessing the likelihood of insomnia and help in formulating more comprehensive clinical treatment plans to improve COPD symptoms and outcomes. Additionally, the four predictive factors identified in our study are easily accessible in practice, making the model practical and simplifying the assessment process, thereby offering significant clinical value. Finally, to validate the model, we employed ROC curves, calibration curves, DCA, and the Hosmer-Lemeshow goodness-of-fit test, and the results demonstrated the model’s excellent performance.
This study also has some limitations. First, as a single-center study, there may be regional and population-specific limitations, which could affect the generalizability of the results. In the future, we plan to include patients from different regions to further validate the model and improve the applicability of the findings. Additionally, we aim to expand the scope of the study to include patients with AECOPD and comorbidities such as anxiety, depression, and bipolar disorder, in order to explore more potential intervention strategies. We also plan to conduct a multicenter study to enhance the generalizability and reliability of the research. Moreover, future studies will focus on strengthening patient follow-up, assisting clinicians in implementing personalized interventions, including pharmacological treatments (e.g., sleep aids), cognitive behavioral therapy for insomnia (CBT-I), breathing exercises, pulmonary rehabilitation, and lifestyle changes (such as improving sleep environment, dietary, and exercise recommendations). Regular assessments and adjustments to treatment strategies will help improve the quality of life for COPD patients.
5 Conclusion
This study analyzed clinical, pathological, laboratory, and treatment-related data of patients with AECOPD and developed a risk prediction model for insomnia in these patients based on four predictive factors: PSQI score, marital status (widowed), WBC levels, and EOS%. A nomogram was also created to visualize the model. The application of this model will aid in identifying high-risk individuals for insomnia among patients with AECOPD, thereby optimizing clinical treatment decisions, enabling timely interventions, improving sleep quality, and enhancing the overall quality of life for these patients.
Data availability statement
The raw data supporting the conclusions of this article will be made available by the authors, without undue reservation.
Ethics statement
The studies involving humans were approved by the Ethics Committee of Chaohu Hospital Affiliated to Anhui Medical University. The studies were conducted in accordance with the local legislation and institutional requirements. The ethics committee/institutional review board waived the requirement of written informed consent for participation from the participants or the participants’ legal guardians/next of kin because this study did not involve any patient’s private information.
Author contributions
QG: Investigation, Writing – original draft. HZ: Supervision, Writing – review & editing.
Funding
The author(s) declare that financial support was received for the research and/or publication of this article. This study was funded by the Colleges and Universities of Anhui Provincial Department of Education (No. KJ2021A0336).
Conflict of interest
The authors declare that the research was conducted in the absence of any commercial or financial relationships that could be construed as a potential conflict of interest.
Generative AI statement
The author(s) declare that no Gen AI was used in the creation of this manuscript.
Publisher’s note
All claims expressed in this article are solely those of the authors and do not necessarily represent those of their affiliated organizations, or those of the publisher, the editors and the reviewers. Any product that may be evaluated in this article, or claim that may be made by its manufacturer, is not guaranteed or endorsed by the publisher.
References
1. Halpin, DMG. Mortality of patients with COPD. Expert Rev Respir Med. (2024) 18:381–95. doi: 10.1080/17476348.2024.2375416
2. Adeloye, D, Song, P, Zhu, Y, Campbell, H, Sheikh, A, and Rudan, I. NIHR RESPIRE global respiratory health unit. Global, regional, and national prevalence of, and risk factors for, chronic obstructive pulmonary disease (COPD) in 2019: a systematic review and modelling analysis. Lancet Respir Med. (2022) 10:447–58. doi: 10.1016/S2213-2600(21)00511-7
3. Safiri, S, Carson-Chahhoud, K, Noori, M, Nejadghaderi, SA, Sullman, MJM, Ahmadian Heris, J, et al. Burden of chronic obstructive pulmonary disease and its attributable risk factors in 204 countries and territories, 1990-2019: results from the global burden of disease study 2019. BMJ. (2022) 378:e069679. doi: 10.1136/bmj-2021-069679
4. GBD 2021 Forecasting Collaborators. Burden of disease scenarios for 204 countries and territories, 2022-2050: a forecasting analysis for the global burden of disease study 2021. Lancet. (2024) 403:2204–56. doi: 10.1016/S0140-6736(24)00685-8
5. Du, D, Zhang, G, Xu, D, Liu, L, Hu, X, Chen, L, et al. Prevalence and clinical characteristics of sleep disorders in chronic obstructive pulmonary disease: a systematic review and meta-analysis. Sleep Med. (2023) 112:282–90. doi: 10.1016/j.sleep.2023.10.034
6. Irwin, MR. Why sleep is important for health: a psychoneuroimmunology perspective. Annu Rev Psychol. (2015) 66:143–72. doi: 10.1146/annurev-psych-010213-115205
7. Guo, P, Li, R, Piao, TH, Wang, CL, Wu, XL, and Cai, HY. Pathological mechanism and targeted drugs of COPD. Int J Chron Obstruct Pulmon Dis. (2022) 17:1565–75. doi: 10.2147/COPD.S366126
8. McNicholas, WT, Verbraecken, J, and Marin, JM. Sleep disorders in COPD: the forgotten dimension. Eur Respir Rev. (2013) 22:365–75. doi: 10.1183/09059180.00003213
9. Budhiraja, R, Siddiqi, TA, and Quan, SF. Sleep disorders in chronic obstructive pulmonary disease: etiology, impact, and management. J Clin Sleep Med. (2015) 11:259–70. doi: 10.5664/jcsm.4540
10. Koulouris, N, Dimakou, K, Gourgoulianis, K, Tzanakis, N, Rapti, A, Gaga, M, et al. Self-perceived quality of sleep among COPD patients in Greece: the SLEPICO study. Sci Rep. (2022) 12:540. doi: 10.1038/s41598-021-04610-z
11. Kandasamy, A, and Srinath, D. Levofloxacin-induced acute anxiety and insomnia. J Neurosci Rural Pract. (2012) 3:212–4. doi: 10.4103/0976-3147.98256
12. McNicholas, WT, Hansson, D, Schiza, S, and Grote, L. Sleep in chronic respiratory disease: COPD and hypoventilation disorders. Eur Respir Rev. (2019) 28:190064. doi: 10.1183/16000617.0064-2019
13. Budhiraja, R, Parthasarathy, S, Budhiraja, P, Habib, MP, Wendel, C, and Quan, SF. Insomnia in patients with COPD. Sleep. (2012) 35:369–75. doi: 10.5665/sleep.1698
14. Ding, B, Small, M, Bergström, G, and Holmgren, U. A cross-sectional survey of night-time symptoms and impact of sleep disturbance on symptoms and health status in patients with COPD. Int J Chron Obstruct Pulmon Dis. (2017) 12:589–99. doi: 10.2147/COPD.S122485
15. Kim, SJ, Kwak, N, Choi, SM, Lee, J, Park, YS, Lee, CH, et al. Sleep duration and its associations with mortality and quality of life in chronic obstructive pulmonary disease: results from the 2007-2015 KNAHNES. Respiration. (2021) 100:1043–9. doi: 10.1159/000516381
16. Liao, QQ, Mo, YJ, Zhu, KW, Gao, F, Huang, B, Chen, P, et al. Platelet-to-lymphocyte ratio (PLR), neutrophil-to-lymphocyte ratio (NLR), monocyte-to-lymphocyte ratio (MLR), and eosinophil-to-lymphocyte ratio (ELR) as biomarkers in patients with acute exacerbation of chronic obstructive pulmonary disease (AECOPD). Int J Chron Obstruct Pulmon Dis. (2024) 19:501–18. doi: 10.2147/COPD.S447519
17. Zhou, Z, Wang, Y, Wang, Y, Yang, B, Xu, C, Wang, S, et al. A diagnostic nomogram for predicting Hypercapnic respiratory failure in patients with acute exacerbation of chronic obstructive pulmonary disease. Int J Chron Obstruct Pulmon Dis. (2024) 19:1079–91. doi: 10.2147/COPD.S454558
18. Huang, AA, and Huang, SY. Use of machine learning to identify risk factors for insomnia. PLoS One. (2023) 18:e0282622. doi: 10.1371/journal.pone.0282622
19. Annavarapu, S, Goldfarb, S, Gelb, M, Moretz, C, Renda, A, and Kaila, S. Development and validation of a predictive model to identify patients at risk of severe COPD exacerbations using administrative claims data. Int J Chron Obstruct Pulmon Dis. (2018) 13:2121–30. doi: 10.2147/COPD.S155773
20. Agustí, A, Celli, BR, Criner, GJ, Halpin, D, Anzueto, A, Barnes, P, et al. Global initiative for chronic obstructive lung disease 2023 report: GOLD executive summary. Eur Respir J. (2023) 61:2300239. doi: 10.1183/13993003.00239-2023
21. Huang, AA, and Huang, SY. Comparison of model feature importance statistics to identify covariates that contribute most to model accuracy in prediction of insomnia. PLoS One. (2024) 19:e0306359. doi: 10.1371/journal.pone.0306359
22. Yu, W, Lan, Y, Sun, D, Pei, P, Yang, L, Chen, Y, et al. Prevalence and risk factors for chronic obstructive pulmonary disease among adults aged 50 and above – 10 CKB study areas, China, 2020-2021. China CDC Wkly. (2024) 6:1126–31. doi: 10.46234/ccdcw2024.229
23. Long, J, Xu, P, Chen, J, Liao, J, Sun, D, Xiang, Z, et al. Inflammation and comorbidities of chronic obstructive pulmonary disease: the cytokines put on a mask! Cytokine. (2023) 172:156404. doi: 10.1016/j.cyto.2023.156404
24. Nobeschi, L, Zangirolami-Raimundo, J, Cordoni, PK, Squassoni, SD, Fiss, E, Pérez-Riera, AR, et al. Evaluation of sleep quality and daytime somnolence in patients with chronic obstructive pulmonary disease in pulmonary rehabilitation. BMC Pulm Med. (2020) 20:14. doi: 10.1186/s12890-020-1046-9
25. Latshang, TD, Tardent, RPM, Furian, M, Flueck, D, Segitz, SD, Mueller-Mottet, S, et al. Sleep and breathing disturbances in patients with chronic obstructive pulmonary disease traveling to altitude: a randomized trial. Sleep. (2019) 42:203. doi: 10.1093/sleep/zsy203
26. Aldabayan, YS. Mental health and sleep quality among patients with asthma and COPD. Front Med. (2023) 10:1181742. doi: 10.3389/fmed.2023.1181742
27. Ocakli, B, Acarturk, E, Aksoy, E, Gungor, S, Ciyiltepe, F, Oztas, S, et al. The impact of exposure to biomass smoke versus cigarette smoke on inflammatory markers and pulmonary function parameters in patients with chronic respiratory failure. Int J Chron Obstruct Pulmon Dis. (2018) 13:1261–7. doi: 10.2147/COPD.S162658
28. Elder, GJ, Wetherell, MA, Barclay, NL, and Ellis, JG. The cortisol awakening response--applications and implications for sleep medicine. Sleep Med Rev. (2014) 18:215–24. doi: 10.1016/j.smrv.2013.05.001
29. Cai, M, Deng, Y, and Hu, T. Prognostic value of leukocyte-based risk model for acute kidney injury prediction in critically ill acute exacerbation of chronic obstructive pulmonary disease patients. Int J Chron Obstruct Pulmon Dis. (2024) 19:619–32. doi: 10.2147/COPD.S444888
30. Ghosh, N, Choudhury, P, Kaushik, SR, Arya, R, Nanda, R, Bhattacharyya, P, et al. Metabolomic fingerprinting and systemic inflammatory profiling of asthma COPD overlap (ACO). Respir Res. (2020) 21:126. doi: 10.1186/s12931-020-01390-4
31. Zuo, L, and Wijegunawardana, D. Redox role of ROS and inflammation in pulmonary diseases. Adv Exp Med Biol. (2021) 1304:187–204. doi: 10.1007/978-3-030-68748-9_11
32. David, B, Bafadhel, M, Koenderman, L, and De Soyza, A. Eosinophilic inflammation in COPD: from an inflammatory marker to a treatable trait. Thorax. (2021) 76:188–95. doi: 10.1136/thoraxjnl-2020-215167
33. Hastie, AT, Martinez, FJ, Curtis, JL, Doerschuk, CM, Hansel, NN, Christenson, S, et al. Association of sputum and blood eosinophil concentrations with clinical measures of COPD severity: an analysis of the SPIROMICS cohort. Lancet Respir Med. (2017) 5:956–67. doi: 10.1016/S2213-2600(17)30432-0
34. Shinalieva, K, Kasenova, A, Akhmetzhanova, Z, Alzhanova, D, Eszhanova, L, and Bekenova, A. Association of Insomnia with anxiety and depression in type 2 diabetic patients: a cross-sectional study. Iran J Med Sci. (2023) 48:448–55. doi: 10.30476/ijms.2023.96017.2755
35. Chen, Q, Kan, M, Jiang, X, Bi, H, and Zhang, L. Efficacy and safety of non-pharmacological interventions for cancer-related insomnia: a study protocol for a systematic review and network meta-analysis. BMJ Open. (2024) 14:e086035. doi: 10.1136/bmjopen-2024-086035
36. You, JM, Zhang, YC, Fan, KY, Bai, SK, Zhang, ZY, Zhang, HY, et al. Genetic evidence for causal effects of leukocyte counts on risk for rheumatoid arthritis. Sci Rep. (2023) 13:20768. doi: 10.1038/s41598-023-46888-1
Keywords: COPD – Chronic obstructive pulmonary disease, Insomnia, Comorbidity, Nomogram, Prediction model
Citation: Gao Q and Zhu H (2025) Development and validation of a predictive model for acute exacerbation in chronic obstructive pulmonary disease patients with comorbid insomnia. Front. Med. 12:1511874. doi: 10.3389/fmed.2025.1511874
Edited by:
Dawei Yang, Fudan University, ChinaReviewed by:
Kefeng Zhai, Suzhou University, ChinaSamuel Huang, Virginia Commonwealth University, United States
Copyright © 2025 Gao and Zhu. This is an open-access article distributed under the terms of the Creative Commons Attribution License (CC BY). The use, distribution or reproduction in other forums is permitted, provided the original author(s) and the copyright owner(s) are credited and that the original publication in this journal is cited, in accordance with accepted academic practice. No use, distribution or reproduction is permitted which does not comply with these terms.
*Correspondence: Hongbin Zhu, emh1aG9uZ2Jpbjc4OEAxNjMuY29t