Abstract
Background:
Insulin resistance is one of the major pathophysiological features of type 2 diabetes mellitus. Studies have revealed the association between type 2 diabetes mellitus and low back pain. However, few studies explored the relationship between insulin resistance and low back pain directly. Therefore, this study selected HOMA-IR, TyG, TyG-BMI, TyG-WC, and TyG-WtHR as indicators of insulin resistance to comprehensively investigate the association between insulin resistance and low back pain.
Methods:
The data for this cross-sectional study were from NHANES. Multivariate logistic regression was used to assess the association of insulin resistance with low back pain, and the stability of the results was evaluated by stratified analysis.
Results:
A total of 6,126 adult participants were included in the study, including 3,657 non-LBP participants and 2,469 LBP patients. All of these five indices showed significant association with low back pain after full adjustment for all covariates (Model 3), HOMA-IR [OR = 1.052, 95% CI (1.018, 1.087), p = 0.003], TyG [OR = 1.431, 95% CI (1.013, 2.021), p = 0.042], TyG-BMI [OR = 1.003, 95% CI (1.002, 1.005), p < 0.0001], TyG-WC [OR = 1.001, 95% CI (1.001, 1.002), p < 0.0001], TyG-WtHR [OR = 1.268, 95% CI (1.155, 1.393), p < 0.0001]. The relationship between insulin resistance and low back pain is stable in most stratified populations (p-interaction >0.05).
Conclusion:
Insulin resistance is associated with an increased risk of low back pain. The HOMA-IR, TyG, TyG-WC, TyG-BMI, and TyG-WtHR all showed a stable correlation with low back pain. TyG-BMI, TyG-WC, and TyG-WtHR are more stable in their associations with low back pain than TyG alone.
1 Introduction
Low back pain (LBP) is characterized by pain, muscle tension, or stiffness located between the costal margin and the subgluteal folds, and may be accompanied by leg pain (sciatica) and neurological symptoms in the lower limbs (1–3). LBP can be classified as acute (lasting up to 6 weeks), subacute (lasting 6 weeks to 3 months), or chronic (lasting 3 months or longer) (1). Based on etiology, LBP is categorized as either specific or non-specific. Specific LBP arises from identifiable pathophysiological mechanisms, such as herniated nucleus pulposus, infection, osteoporosis, rheumatoid arthritis, fractures, or tumors. Non-specific LBP is defined as LBP without a clear underlying cause (3). It is the leading cause of disability worldwide, and most people experience LBP at least once in their lifetime. The prevalence of LBP increases with age, with 1–6% in children aged 7–10 years, 18% in adolescents, and a peak prevalence of 28–42% in those aged 40 to 69 years (3–5). In western countries, the reported lifetime prevalence of LBP ranges from 49% to 70%, and the point prevalence of LBP from 12% to 30% (3). In 2015, LBP caused about 60.1 million person-years lived with disability, up 54% from 1990 (6), greatly increasing the cost of health care and social support systems. As the population ages, the prevalence of LBP is expected to markedly rise in the upcoming decades. Therefore, it is significant for the early recognition and timely intervention of LBP.
Insulin resistance (IR) refers to a disease in which the effect of insulin on tissues is weakened due to various reasons, and it cannot effectively promote the absorption of glucose by surrounding tissues and inhibit the output of glucose from the liver, increasing blood sugar (7). IR is the core pathophysiological mechanism of metabolic syndrome (MetS) (8). Researches (9, 10) have suggested that MetS may play an important role in pain. In addition, IR is one of the major pathophysiological features of type 2 diabetes mellitus (T2DM) (11). Studies (12, 13) have shown the association between T2DM and LBP, with LBP being more common in people with T2DM. Several common risk factors have also been found in T2DM and LBP, such as obesity (14, 15) and low-grade systemic inflammation (16, 17). Based on these previous researches, we speculate that there is positive association between IR and LBP. However, few studies to explored the association between IR and LBP directly. Therefore, this cross-sectional study was conducted to investigate the association between them, and comprehensively evaluated the association between various IR indices (HOMA-IR, TyG, TyG-BMI, TyG-WC, and TyG-WtHR) and LBP, to promote the early identification and scientific management of LBP.
2 Methods
2.1 Data sources
National Health and Nutrition Examination Survey (NHANES) is a study conducted by the Centers for Disease Control and Prevention (CDC) to assess the health and nutritional status of the US population.1 NHANES gathers data through a combination of questionnaires, physical assessments, and laboratory analyses on representative samples to comprehensively assess and track the health status and nutritional habits of the US population. These data have important implications for studying the epidemiology of disease, developing public health policies, and guiding clinical practice. This study obtained data from NHANES (1999–2000, 2001–2002, 2003–2004, and 2009–2010), a total of 41,663 participants. The National Center for Health Statistics Research Ethics Review Board approved the NHANES, and all study participants provided written informed consent.
2.2 Assessment of LBP
The miscellaneous pain section of NHANES (1999–2000, 2001–2002, 2003–2004, and 2009–2010) provides personal interview data on LBP. In the three cycles of 1999–2000, 2001–2002, and 2003–2004, participants were asked, “During the past 3 months, did you have LBP?” In the 2009–2010 cycle, participants were asked, “Was there one time when you had pain, aching, or stiffness in your low back on almost every day for 3 or more months in a row?” The answer “yes” indicates the presence of LBP and the answer “no” indicates non-LBP.
2.3 Definition of IR surrogates
We extracted fasting triglyceride, fasting glucose, fasting insulin, waist circumference (WC), height, and weight from NHANES. The calculation formulas for IR surrogates are as follows. HOMA-IR = fasting insulin (μU/mL) × fasting glucose (mmol/L)/22.5 (18). TyG index = Ln [fasting triglycerides (mg/dL) × fasting glucose (mg/dL)/2] (19), TyG-BMI index = TyG × BMI (20), TyG-WC index = TyG × WC (cm) (20), TyG-WtHR index = TyG × WC (cm)/height (cm) (20).
2.4 Covariates
Potential covariates were identified based on the literature and clinical experience. This study selected age, sex, ethnicity, marital status, poverty income ratio (PIR), educational level, hypertension, smoking status, alcohol use, fasting total cholesterol (mg/dL), high density lipoprotein (HDL) cholesterol (mg/dL) and low density lipoprotein (LDL) cholesterol (mg/dL) as covariates. Ethnicity was classified into four groups: “non-Hispanic White,” “non-Hispanic Black,” “Mexican American,” and “other.” Marital status was classified into “married or living with a partner” and “other.” Poverty income ratio (PIR), a ratio of family income to poverty, was classified into “0–1.3 PIR,” “>1.3–3.5 PIR,” “>3.5 PIR.” Education level was classified into “Less Than 9th Grade,” “High School Grade or Equivalent” and “College Graduate or above.”
2.5 Study participants
Participants for this study were drawn from the NHANES (1999–2000, 2001–2002, 2003–2004, and 2009–2010). Exclusion criteria: (1) missing LBP data; (2) missing data on IR indices; (3) missing weight data or having a weight value of zero.
2.6 Statistical analysis
All data processing and statistical analysis were performed using the R software (version 4.3.2). For continuous variables, we used mean and standard deviation (SD) displays, and for categorical variables using number (n) and percentage (%) displays. According to the presence of LBP, we divided the participants into the non-LBP group and the LBP group. We used t-test to compare whether differences between non-LBP group and LBP group were significant for continuous variables, and the chi-square test was used to compare differences between non-LBP group and LBP group in categorical variables. We used multiple logistic regression models to assess the correlation between IR surrogates and LBP expressing the association with OR values and 95% confidence intervals (95% CI). Three models were constructed, in Model 1, no adjustment was made; Model 2 adjusted for the age, sex, ethnicity, marital status, PIR, and education level; Model 3 adjusted for the age, sex, ethnicity, marital status, PIR, education level, hypertension, smoke, alcohol user, fasting total cholesterol, HDL cholesterol, LDL cholesterol. p-value <0.05 was considered to be statistically significant.
3 Results
From NHANES (1999–2000, 2001–2002, 2003–2004, and 2009–2010) obtained 41,663 participants, 25,354 participants missing LBP data were excluded. Again excluding 9,688 participants missing the data of HOMA-IR, TyG, TyG-BMI, TyG-WC, and TyG-WtHR. Excluding 495 participants lacking weight information or the value of weight is zero. Finally, 6,126 participants were included in this study. The selection flowchart of subjects is presented in Figure 1.
Figure 1

Flowchart of the study. HOMA-IR, homeostatic model assessment of insulin resistance; TyG, triglyceride glucose; TyG-BMI, triglyceride glucose with body mass index; TyG-WC, triglyceride glucose with waist circumference; TyG-WtHR, triglyceride glucose with the ratio of waist circumference divided by height.
3.1 Characteristics of the study participants
Table 1 displays the weighted baseline characteristics of the 6,126 participants including 3,657 non-LBP participants and 2,469 LBP participants. The distribution of age and gender among the participants did not show any significant differences. Non-Hispanic White (74.88%), >3.5 PIR (38.49%), college graduate or above (48.68%), overweight or obese (68.23%) participants accounted for a higher portion among LBP group.
Table 1
| Variable | Non-LBP group (N = 3,657) | LBP group (N = 2,469) | p-value |
|---|---|---|---|
| Age | 45.26 (0.48) | 45.84 (0.46) | 0.22 |
| Sex | 0.11 | ||
| Female | 1,853 (50.60) | 1,352 (53.25) | |
| Male | 1,804 (49.40) | 1,117 (46.75) | |
| Ethnicity | 0.01 | ||
| Non-Hispanic White | 1797 (70.64) | 1,356 (74.88) | |
| Non-Hispanic Black | 662 (11.21) | 387 (9.27) | |
| Mexican American | 923 (7.98) | 511 (6.59) | |
| Other | 275 (10.18) | 215 (9.25) | |
| Marital status | 0.07 | ||
| Married or living with partner | 2,263 (65.32) | 1,543 (68.25) | |
| Other | 1,285 (34.68) | 842 (31.75) | |
| PIR | <0.0001 | ||
| 0–1.3 PIR | 847 (17.44) | 703 (24.05) | |
| >1.3–3.5 PIR | 1,309 (36.11) | 869 (37.46) | |
| >3.5 PIR | 1,196 (46.44) | 692 (38.49) | |
| Education level | <0.0001 | ||
| Less than 9th grade | 552 (6.36) | 373 (7.93) | |
| High school grade or equivalent | 1,358 (35.33) | 1,033 (43.39) | |
| College graduate or above | 1741 (58.31) | 1,060 (48.68) | |
| Smoke | <0.0001 | ||
| Never | 1967 (52.96) | 1,125 (43.76) | |
| Former | 979 (25.95) | 681 (26.60) | |
| Now | 708 (21.09) | 661 (29.64) | |
| Alcohol use | 0.001 | ||
| Never | 523 (11.95) | 279 (10.48) | |
| Former | 696 (16.61) | 495 (18.70) | |
| Mild | 1,159 (36.75) | 744 (31.85) | |
| Moderate | 457 (15.79) | 343 (16.21) | |
| Heavy | 651 (18.90) | 502 (22.76) | |
| Hypertension | <0.001 | ||
| No | 2,249 (67.45) | 1,406 (62.09) | |
| Yes | 1,406 (32.55) | 1,062 (37.91) | |
| Diabetes | 0.002 | ||
| No | 3,206 (94.03) | 2,112 (91.74) | |
| Yes | 281 (5.97) | 221 (8.26) | |
| BMI | <0.001 | ||
| Underweight | 51 (1.72) | 37 (2.01) | |
| Normal | 1,197 (35.28) | 660 (29.76) | |
| Overweight | 1,322 (34.73) | 882 (34.09) | |
| Obese | 1,087 (28.27) | 890 (34.14) | |
| HOMA-IR | 2.86 (0.06) | 3.36 (0.10) | <0.0001 |
| TyG | 8.67 (0.02) | 8.73 (0.01) | 0.01 |
| TyG-BMI | 241.23 (1.62) | 251.80 (1.69) | <0.0001 |
| TyG-WC | 830.42 (4.83) | 860.69 (4.29) | <0.0001 |
| TyG-WtHR | 4.90 (0.03) | 5.09 (0.02) | <0.0001 |
Weighted baseline characteristics of participants in the groups of non-LBP and LBP.
Continuous variables are presented as means with standard deviations (SD), while categorical variables are expressed as counts (n) and percentages (%). PIR, poverty income ratio; BMI, body mass index; HOMA-IR, homeostatic model assessment of IR; TyG, triglyceride glucose; TyG-BMI, triglyceride glucose with body mass index; TyG-WC, triglyceride glucose with waist circumference; TyG-WtHR, triglyceride glucose with the ratio of waist circumference divided by height.
3.2 Associations between IR surrogates and LBP
All of these five indices showed significant association with LBP in the Model 3, after full adjustment for all covariates, HOMA-IR [OR = 1.052, 95% CI (1.018, 1.087), p = 0.003], TyG [OR = 1.431, 95% CI (1.013, 2.021), p = 0.042], TyG-BMI [OR = 1.003, 95% CI (1.002, 1.005), p < 0.0001], TyG-WC [OR = 1.001, 95% CI (1.001, 1.002), p < 0.0001], TyG-WtHR [OR = 1.268, 95% CI (1.155, 1.393), p < 0.0001]. Furthermore, we discretized the five IR indices that were originally continuous variables into quartiles for a sensitivity analysis. Compared with quartile 1 (Q1), quartile 4 (Q4) was 46.8% higher (p = 0.002) in HOMA-IR, Q4 was 61.1% higher (p < 0.001) in TyG-BMI, Q4 was 91.4% higher (p < 0.001) in TyG-WC. Q4 was 67.0% higher than Q1 of the TyG-WtHR index (p < 0.001). Furthermore, the p for trend indicated the statistically significant nature of the upward trend observed for HOMA-IR, TyG-BMI, TyG-WC, and TyG-WtHR in the fully adjusted model, implying that LBP risk increases with increasing degree of IR. Table 2 provides the detailed results.
Table 2
| Character | Model 1 | Model 2 | Model 3 | |||
|---|---|---|---|---|---|---|
| OR (95% CI) | p | OR (95% CI) | p | OR (95% CI) | p | |
| HOMA-IR | 1.050 (1.027, 1.074) | <0.0001 | 1.045 (1.020, 1.071) | <0.001 | 1.052 (1.018, 1.087) | 0.003 |
| Q1 | ref | ref | ref | |||
| Q2 | 1.122 (0.968, 1.300) | 0.124 | 1.036 (0.872, 1.232) | 0.679 | 1.109 (0.921, 1.335) | 0.267 |
| Q3 | 1.144 (0.967, 1.354) | 0.115 | 1.070 (0.890, 1.287) | 0.465 | 1.118 (0.895, 1.397) | 0.316 |
| Q4 | 1.438 (1.218, 1.698) | <0.0001 | 1.334 (1.110, 1.603) | 0.003 | 1.468 (1.160, 1.859) | 0.002 |
| p for trend | <0.0001 | 0.003 | 0.005 | |||
| TyG | 1.150 (1.032, 1.281) | 0.012 | 1.064 (0.942, 1.201) | 0.311 | 1.431 (1.013, 2.021) | 0.042 |
| Q1 | ref | ref | ref | |||
| Q2 | 1.088 (0.916, 1.292) | 0.330 | 1.068 (0.893, 1.276) | 0.464 | 1.079 (0.886, 1.316) | 0.439 |
| Q3 | 1.284 (1.093, 1.507) | 0.003 | 1.197 (0.986, 1.452) | 0.068 | 1.297 (0.962, 1.749) | 0.086 |
| Q4 | 1.336 (1.085, 1.645) | 0.007 | 1.171 (0.933, 1.471) | 0.169 | 1.494 (0.925, 2.414) | 0.098 |
| p for trend | 0.003 | 0.107 | 0.077 | |||
| TyG-BMI | 1.003 (1.002, 1.004) | <0.0001 | 1.002 (1.001, 1.003) | <0.0001 | 1.003 (1.002, 1.005) | <0.0001 |
| Q1 | ref | ref | ref | |||
| Q2 | 1.127 (0.937, 1.354) | 0.199 | 1.108 (0.913, 1.344) | 0.291 | 1.138 (0.918, 1.411) | 0.229 |
| Q3 | 1.193 (0.983, 1.448) | 0.074 | 1.108 (0.902, 1.360) | 0.322 | 1.185 (0.896, 1.568) | 0.227 |
| Q4 | 1.511 (1.263, 1.807) | <0.0001 | 1.451 (1.200, 1.754) | <0.001 | 1.611 (1.235, 2.101) | <0.001 |
| p for trend | <0.0001 | <0.001 | 0.001 | |||
| TyG-WC | 1.001 (1.001, 1.001) | <0.0001 | 1.001 (1.000, 1.001) | <0.0001 | 1.001 (1.001, 1.002) | <0.0001 |
| Q1 | ref | ref | ref | |||
| Q2 | 1.276 (1.051, 1.548) | 0.014 | 1.250 (1.012, 1.543) | 1.323 (1.047, 1.673) | ||
| Q3 | 1.246 (1.033, 1.502) | 0.022 | 1.157 (0.944, 1.418) | 1.257 (0.970, 1.628) | ||
| Q4 | 1.648 (1.334, 2.037) | <0.0001 | 1.565 (1.249, 1.961) | 1.914 (1.388, 2.639) | ||
| p for trend | <0.0001 | <0.001 | <0.001 | |||
| TyG-WtHR | 1.205 (1.130, 1.285) | <0.0001 | 1.171 (1.091, 1.256) | <0.0001 | 1.268 (1.155, 1.393) | <0.0001 |
| Q1 | ref | ref | ref | |||
| Q2 | 1.064 (0.871, 1.298) | 0.538 | 1.045 (0.852, 1.281) | 0.670 | 1.085 (0.870, 1.354) | 0.457 |
| Q3 | 1.324 (1.123, 1.562) | 0.001 | 1.251 (1.041, 1.504) | 0.018 | 1.340 (1.046, 1.718) | 0.022 |
| Q4 | 1.536 (1.247, 1.892) | <0.001 | 1.428 (1.140, 1.788) | 0.003 | 1.670 (1.257, 2.220) | <0.001 |
| p for trend | <0.0001 | <0.001 | <0.001 | |||
The results of logistic regression analysis on the association between insulin resistance surrogates and LBP.
Model 1: No adjustment was made for any covariate. Model 2: Adjusted by age, sex, ethnicity, marital status, poverty income ratio, and education level. Model 3: Adjusted by age, sex, ethnicity, marital status, poverty income ratio, education level, hypertension, smoking, alcohol use, fast total cholesterol, HDL cholesterol, and HDL cholesterol.
3.3 Subgroup analysis
In addition, to further confirm the stability of the results, we performed stratified analyses for HOMA-IR, TyG, TyG-BMI, TyG-WC, and TyG-WtHR. The results demonstrated that the relationship between HOMA-IR, TyG, TyG-BMI, TyG-WC, and TyG-WtHR index and LBP was stable in most stratified populations (p-interaction >0.05). Detailed results of the stratified analysis are presented in Figures 2, 3. Moreover, the results of the logistic regression analysis stratified by gender are presented in Table 3. TyG did not show a significant correlation with LBP in the male population.
Figure 2
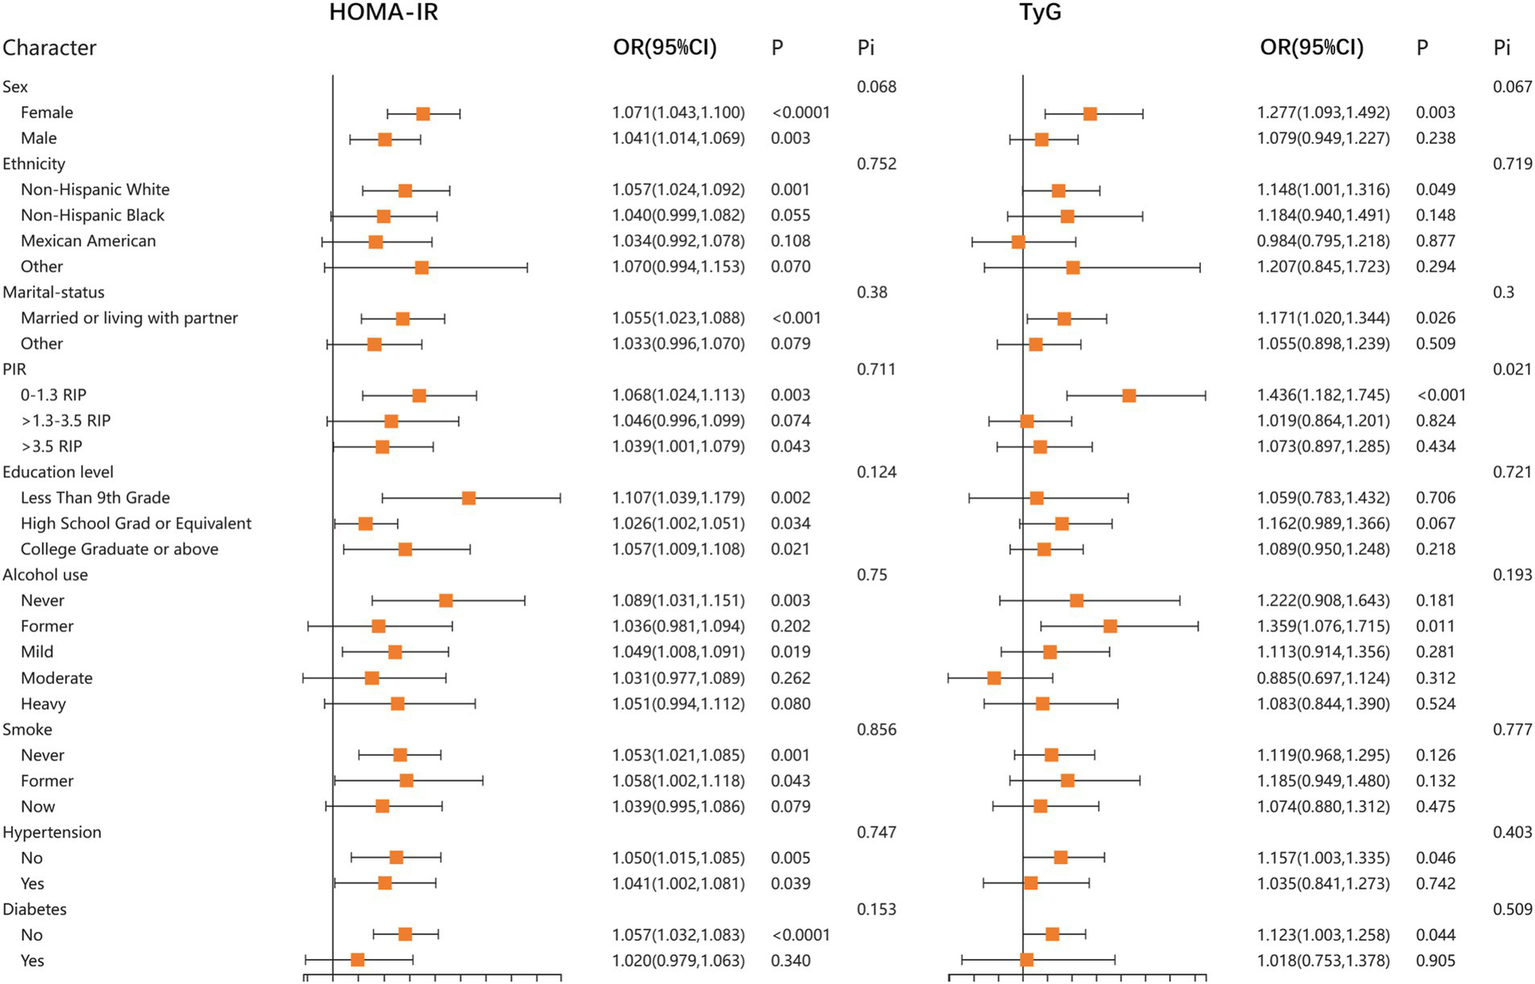
Stratified associations between HOMA-IR, TyG, and LBP according to baseline characteristics. HOMA-IR, homeostatic model assessment of insulin resistance; TyG, triglyceride glucose index; PIR, poverty income ratio; Pi, P for interaction.
Figure 3

Stratified associations between TyG-BMI, TyG-WC, TyG-WtHR, and LBP according to baseline characteristics. TyG-BMI, triglyceride glucose with body mass index; TyG-WC, triglyceride glucose with waist circumference; TyG-WtHR, triglyceride glucose with the ratio of waist circumference divided by height; PIR, poverty income ratio; Pi, P for interaction.
Table 3
| Characters | Sex | Number | Model 1 | Model 2 | Model 3 | |||
|---|---|---|---|---|---|---|---|---|
| OR (95% CI) | p | OR (95% CI) | p | OR (95% CI) | p | |||
| HOMA-IR | Female | 3,205 | 1.071 (1.043, 1.100) | <0.0001 | 1.063 (1.033, 1.093) | <0.0001 | 1.073 (1.037, 1.111) | <0.001 |
| Male | 2,921 | 1.041 (1.014, 1.069) | 0.003 | 1.034 (1.007, 1.062) | 0.016 | 1.038 (0.996, 1.082) | 0.077 | |
| TyG | Female | 3,205 | 1.277 (1.093, 1.492) | 0.003 | 1.145 (0.947, 1.385) | 0.157 | 1.322 (0.845, 2.070) | 0.215 |
| Male | 2,921 | 1.079 (0.949, 1.227) | 0.238 | 1.005 (0.876, 1.154) | 0.937 | 1.553 (0.906, 2.663) | 0.106 | |
| TyG-BMI | Female | 3,205 | 1.003 (1.002, 1.004) | <0.0001 | 1.003 (1.002, 1.004) | <0.0001 | 1.003 (1.001, 1.005) | <0.001 |
| Male | 2,921 | 1.002 (1.001, 1.004) | 0.010 | 1.002 (1.000, 1.003) | 0.070 | 1.003 (1.001, 1.005) | 0.008 | |
| TyG-WC | Female | 3,205 | 1.001 (1.001, 1.002) | <0.0001 | 1.001 (1.001, 1.002) | <0.001 | 1.002 (1.001, 1.002) | <0.001 |
| Male | 2,921 | 1.001 (1.000, 1.002) | 0.003 | 1.001 (1.000, 1.001) | 0.042 | 1.001 (1.000, 1.002) | 0.004 | |
| TyG-WtHR | Female | 3,205 | 1.235 (1.131, 1.348) | <0.0001 | 1.205 (1.089, 1.334) | <0.001 | 1.258 (1.086, 1.456) | 0.003 |
| Male | 2,921 | 1.171 (1.055, 1.299) | 0.004 | 1.114 (0.996, 1.246) | 0.059 | 1.250 (1.077, 1.450) | 0.004 | |
The results of logistic regression analysis on the association between IR surrogates and LBP stratified by gender.
Model 1: No adjustment was made for any covariate. Model 2: Adjusted by age, ethnicity, marital status, poverty income ratio, and education level. Model 3: Adjusted by age, ethnicity, marital status, poverty income ratio, education level, hypertension, smoking, alcohol use, fast total cholesterol, HDL cholesterol, and LDL cholesterol. The red color represents a significant p-value (p<0.05).
4 Discussion
In this study, data from four NHANES (1999–2000, 2001–2002, 2003–2004, and 2009–2010) cycles were utilized to assess the associations between HOMA-IR, TyG, TyG-BMI, TyG-WC, TyG-WtHR, and LBP. After adjusting for all the covariates, there was still a stable positive correlation between HOMA-IR, TyG, TyG-BMI, TyG-WC, TyG-WtHR, and LBP. Further stratified analysis also indicated that these results were stable in most of the subgroups. To the best of our knowledge, this is the first study using NHANES data to investigate the relationship between IR and LBP.
Currently, the internationally accepted gold standard for evaluating IR is hyperinsulinemic euglycemic clamp (HEC) (21). The principle is that glucose and insulin are infused simultaneously to maintain blood glucose levels within the range of 4.4 to 5.0 mmol/L. During this state, the infusion rate of exogenous glucose matches the peripheral tissue glucose utilization rate. IR severity is assessed by quantifying the rate of insulin-mediated glucose metabolism (22). Although the measurement results of this method are stable and reproducible, however, its widespread adoption in clinical practice is hindered by its considerable technical complexity, lengthy duration, and substantial cost implications (23). To find a simple, practical and reliable tool to assess body insulin sensitivity, HOMA-IR based on fasting insulin (FINS) and fasting blood glucose (FPG) levels has emerged (18). The index can be calculated only by obtaining FINS and FPG. It has the characteristics of simple operation, cheap price and almost no damage to patients, so it is widely used in practice. However, the determination of FINS is not a routine laboratory test in clinical practice, so the triglyceride-glucose (TyG) index, calculated by fasting triglycerides and fasting glucose level, was also developed (19). A study (24) showed that TyG links IR even more closely than HOMA-IR with IR. In addition, some other IR substitution indices deriving TyG, such as TyG-BMI, TyG-WC, and TyG-WtHR, also show a closer relationship with IR than HOMA-IR, and even have a stronger ability to predict IR or IR-related diseases than TyG (25, 26).
The results of this study revealed that HOMA-IR, TyG, TyG-BMI, TyG-WC, and TyG-WtHR index are all associated with higher risk of LBP and that TyG-BMI, TyG-WC, and TyG-WtHR index have even more stable associations with LBP than TyG alone. Our conclusions are consistent with the previous studies to some extent. Cross-sectional studies from Japan noted a significant association between LBP and metabolic syndrome, however, there were significant gender differences in this relationship, with a significantly higher prevalence of metabolic syndrome in women with non-LBP, but the relationship was not significant in the male group (27, 28). Another study reached the same conclusion that patients with LBP had a higher prevalence of metabolic syndrome (29). This is consistent with our study, although most IR indicators showed significant association with LBP, the correlation was more stable in the female population than male population, especially TyG. In addition, their study also found that LBP patients with metabolic syndrome have higher BMI and waist circumference relative to LBP patients without metabolic syndrome. These results are partly in agreement with the present study, where the index of TyG combining various obesity-related indices showed a more stable correlation with LBP than the TyG index alone.
Despite the etiology of LBP is complex and varied, intervertebral disc degeneration is one of the main contributing causes of LBP, accounting for about 26%–42% of patients with LBP (30). A previous Mendelian randomization analysis from our team found that triglycerides was able to mediate T2D to promote intervertebral disc degeneration (31). It is already an established fact that obesity is a risk factor for Intervertebral disc degeneration (32, 33). Obesity can also develop into IR and chronic low-grade systemic inflammation through lipotoxicity, promoting the development of LBP (34). Similar conclusions have been found in several previous studies showing that TyG-BMI, TyG-WC, and TyG-WtHR are more robust in their associations with IR or IR-related diseases than TyG alone. A cross-sectional study (20) using NHANES data found that TyG-WC had a better ability to identify IR than TyG alone. In addition, the research of Dang et al. (25) showed that TyG-WC and TyG-WtHR have a higher accuracy in cardiovascular disease mortality prediction compared to TyG and TyG-BMI, and that is expected to be a more effective indicator for identifying patients at early risk of cardiovascular disease. The higher predictive power of TyG-BMI, TyG-WC, and TyG-WTHR for LBP may be attributed to the following reasons. First, these indicators combine triglyceride of fasting, fasting glucose and obesity-related indicators, able to consider the effect of both risk factors, IR and BMI, on LBP. Second, waist circumference and waist height ratio are the indicators of abdominal obesity, patients with abdominal obesity have a higher risk of IR than ordinary obese patients, therefore, TyG-WC and TyG-WtHR can demonstrate a more stable correlation with IR or IR-related diseases.
This study has some of the following advantages. First, we obtained widely representative large-scale survey data from NHANES, which improves the stability and generalizability of our results. Second, we comprehensively evaluated the association of IR with LBP using five IR surrogates. Finally, stratified analyses were performed to assess the stability of the results. However, we also have some inevitable shortcomings. First, the LBP data used for analysis were derived from retrospective questionnaires that inevitably cause recall bias. Second, the design of this study was a cross-sectional study, which prevented us from further exploring the causal relationship between LBP and IR. Prospective studies are needed to establish a causal relationship and to determine whether improving IR can reduce LBP incidence or severity. Finally, we have to acknowledge that NHANES data primarily represent the US population, and its generalizability to non-US populations may be limited. Further validation in other populations are needed.
5 Conclusion
IR is associated with an increased risk of LBP. Compared to TyG alone, TyG-WC, TyG-BMI and TyG-WtHR showed a more stable correlation with LBP. Future research should explore whether targeting IR through lifestyle modifications, pharmacological interventions, or combined approaches could help alleviate LBP symptoms.
Statements
Data availability statement
The original contributions presented in the study are included in the article/supplementary material, further inquiries can be directed to the corresponding authors.
Ethics statement
Ethical review and approval was not required for the study involving human participants in accordance with the local legislation and institutional requirements. Written informed consent from the patients/participants OR patients/participants legal guardian/next of kin was not required to participate in this study in accordance with the national legislation and the institutional requirements.
Author contributions
ZQ: Writing – review & editing, Conceptualization, Data curation, Formal analysis, Methodology, Resources, Software, Validation, Visualization, Writing – original draft. DC: Conceptualization, Data curation, Methodology, Software, Writing – original draft, Writing – review & editing, Investigation. HC: Methodology, Software, Writing – original draft, Writing – review & editing, Formal analysis. WL: Writing – review & editing, Project administration, Supervision. YH: Writing – review & editing, Project administration, Supervision. GR: Funding acquisition, Project administration, Supervision, Writing – review & editing.
Funding
The author(s) declare that financial support was received for the research and/or publication of this article. This research was funded by the Xiamen Science and Technology Plan Project (3502Z20224ZD1003).
Acknowledgments
The authors thank Zhang Jing (Second Department of Infectious Disease, Shanghai Fifth People’s Hospital, Fudan University) for his work on the NHANES database. His outstanding work, nhanesR package and webpage, makes it easier for us to explore NHANES database.
Conflict of interest
The authors declare that the research was conducted in the absence of any commercial or financial relationships that could be construed as a potential conflict of interest.
Generative AI statement
The authors declare that no Gen AI was used in the creation of this manuscript.
Publisher’s note
All claims expressed in this article are solely those of the authors and do not necessarily represent those of their affiliated organizations, or those of the publisher, the editors and the reviewers. Any product that may be evaluated in this article, or claim that may be made by its manufacturer, is not guaranteed or endorsed by the publisher.
Abbreviations
CDC, Centers for Disease Control and Prevention; FINS, Fasting insulin; FPG, Fasting blood glucose; HEC, Hyperinsulinemic euglycemic clamp; HDL, High density lipoprotein; LDL, Low density lipoprotein; LBP, Low back pain; MetS, Metabolic syndrome; NHANES, National Health and Nutrition Examination Survey; OR, Odds ratio; PIR, Poverty income ratio; SD, Standard deviation; TyG, Triglyceride-glucose; WC, Waist circumference.
Footnotes
References
1.
Koes BW Tulder MW Thomas S . Diagnosis and treatment of low back pain. BMJ. (2006) 332:1430–4. doi: 10.1136/bmj.332.7555.1430
2.
Lv Z Cui J Zhang J . Smoking, alcohol and coffee consumption and risk of low back pain: a Mendelian randomization study. Eur Spine J. (2022) 31:2913–9. doi: 10.1007/s00586-022-07389-3
3.
Knezevic NN Candido KD Vlaeyen JWS Van Zundert J Cohen SP . Low back pain. Lancet. (2021) 398:78–92. doi: 10.1016/S0140-6736(21)00733-9
4.
Hoy D Bain C Williams G March L Brooks P Blyth F et al . A systematic review of the global prevalence of low back pain. Arthritis Rheum. (2012) 64:2028–37. doi: 10.1002/art.34347
5.
Taimela S Kujala UM Salminen JJ Viljanen T . The prevalence of low back pain among children and adolescents. A nationwide, cohort-based questionnaire survey in Finland. Spine. (1997) 22:1132–6. doi: 10.1097/00007632-199705150-00013
6.
Hartvigsen J Hancock MJ Kongsted A Louw Q Ferreira ML Genevay S et al . What low back pain is and why we need to pay attention. Lancet. (2018) 391:2356–67. doi: 10.1016/S0140-6736(18)30480-X
7.
Lebovitz HE . Insulin resistance: definition and consequences. Exp Clin Endocrinol Diabetes. (2001) 109:S135–48. doi: 10.1055/s-2001-18576
8.
Roberts CK Hevener AL Barnard RJ . Metabolic syndrome and insulin resistance: underlying causes and modification by exercise training. Compr Physiol. (2013) 3:1–58. doi: 10.1002/cphy.c110062
9.
Binvignat M Sellam J Berenbaum F Felson DT . The role of obesity and adipose tissue dysfunction in osteoarthritis pain. Nat Rev Rheumatol. (2024) 20:565–84. doi: 10.1038/s41584-024-01143-3
10.
Valdes AM . Metabolic syndrome and osteoarthritis pain: common molecular mechanisms and potential therapeutic implications. Osteoarthr Cartil. (2020) 28:7–9. doi: 10.1016/j.joca.2019.06.015
11.
Groop L . Pathogenesis of type 2 diabetes: the relative contribution of insulin resistance and impaired insulin secretion. Int J Clin Pract Suppl. (2000):3–13. PMID:
12.
Jacob L Rathmann W Koyanagi A Haro JM Kostev K . Association between type 2 diabetes and chronic low back pain in general practices in Germany. BMJ Open Diabetes Res Care. (2021) 9:e002426. doi: 10.1136/bmjdrc-2021-002426
13.
Qiu Y Wei X Tao Y Song B Wang M Yin Z et al . Causal association of leisure sedentary behavior and cervical spondylosis, sciatica, intervertebral disk disorders, and low back pain: a Mendelian randomization study. Front Public Health. (2024) 12:1284594. doi: 10.3389/fpubh.2024.1284594
14.
Shai I Jiang R Manson JE Stampfer MJ Willett WC Colditz GA et al . Ethnicity, obesity, and risk of type 2 diabetes in women: a 20-year follow-up study. Diabetes Care. (2006) 29:1585–90. doi: 10.2337/dc06-0057
15.
Shiri R Karppinen J Leino-Arjas P Solovieva S Viikari-Juntura E . The association between obesity and low back pain: a meta-analysis. Am J Epidemiol. (2010) 171:135–54. doi: 10.1093/aje/kwp356
16.
Lim YZ Wang Y Cicuttini FM Hughes HJ Chou L Urquhart DM et al . Association between inflammatory biomarkers and nonspecific low back pain: a systematic review. Clin J Pain. (2020) 36:379–89. doi: 10.1097/AJP.0000000000000810
17.
Pitsavos C Tampourlou M Panagiotakos DB Skoumas Y Chrysohoou C Nomikos T et al . Association between low-grade systemic inflammation and type 2 diabetes mellitus among men and women from the ATTICA study. Rev Diabet Stud. (2007) 4:98–104. doi: 10.1900/RDS.2007.4.98
18.
Matthews DR Hosker JP Rudenski AS Naylor BA Treacher DF Turner RC . Homeostasis model assessment: insulin resistance and beta-cell function from fasting plasma glucose and insulin concentrations in man. Diabetologia. (1985) 28:412–9. doi: 10.1007/BF00280883
19.
Nayak VKR Satheesh P Shenoy MT Kalra S . Triglyceride glucose (TyG) index: a surrogate biomarker of insulin resistance. J Pak Med Assoc. (2022) 72:986–8. doi: 10.47391/JPMA.22-63
20.
Yan S Wang D Jia Y . Comparison of insulin resistance-associated parameters in US adults: a cross-sectional study. Hormones. (2023) 22:331–41. doi: 10.1007/s42000-023-00448-4
21.
Tahapary DL Pratisthita LB Fitri NA Marcella C Wafa S Kurniawan F et al . Challenges in the diagnosis of insulin resistance: focusing on the role of HOMA-IR and tryglyceride/glucose index. Diabetes Metab Syndr. (2022) 16:102581. doi: 10.1016/j.dsx.2022.102581
22.
DeFronzo RA Tobin JD Andres R . Glucose clamp technique: a method for quantifying insulin secretion and resistance. Am J Phys. (1979) 237:E214–23. doi: 10.1152/ajpendo.1979.237.3.E214
23.
Chinese Diabetes Society Insulin Resistance Study Group . Expert guidance on insulin resistance assessment methods and applications. Chin J Diabetes. (2018) 10:377–85. doi: 10.3760/cma.j.issn.1674-5809.2018.06.001
24.
Vasques ACJ Novaes FS da Saúde de Oliveira M Souza JRM Yamanaka A Pareja JC et al . TyG index performs better than HOMA in a Brazilian population: a hyperglycemic clamp validated study. Diabetes Res Clin Pract. (2011) 93:e98–e100. doi: 10.1016/j.diabres.2011.05.030
25.
Dang K Wang X Hu J Zhang Y Cheng L Qi X et al . The association between triglyceride-glucose index and its combination with obesity indicators and cardiovascular disease: NHANES 2003–2018. Cardiovasc Diabetol. (2024) 23:8. doi: 10.1186/s12933-023-02115-9
26.
Er L-K Wu S Chou H-H Hsu L-A Teng M-S Sun Y-C et al . Triglyceride glucose-body mass index is a simple and clinically useful surrogate marker for insulin resistance in nondiabetic individuals. PLoS One. (2016) 11:e0149731. doi: 10.1371/journal.pone.0149731
27.
Yoshimoto T Ochiai H Shirasawa T Nagahama S Uehara A Sai S et al . Sex differences in the association of metabolic syndrome with low back pain among middle-aged Japanese adults: a large-scale cross-sectional study. Biol Sex Differ. (2019) 10:33. doi: 10.1186/s13293-019-0249-3
28.
Ono R Yamazaki S Takegami M Otani K Sekiguchi M Onishi Y et al . Gender difference in association between low back pain and metabolic syndrome: locomotive syndrome and health outcome in Aizu cohort study (LOHAS). Spine. (2012) 37:1130–7. doi: 10.1097/BRS.0b013e31824231b8
29.
Duruöz MT Turan Y Gürgan A Deveci H . Evaluation of metabolic syndrome in patients with chronic low back pain. Rheumatol Int. (2012) 32:663–7. doi: 10.1007/s00296-010-1693-x
30.
Peng B-G . Pathophysiology, diagnosis, and treatment of discogenic low back pain. World J Orthop. (2013) 4:42–52. doi: 10.5312/wjo.v4.i2.42
31.
Chen D-Q Xu W-B Chen X Xiao K-Y Que Z-Q Sun N-K et al . Genetically predicted triglycerides mediate the relationship between type 2 diabetes mellitus and intervertebral disc degeneration. Lipids Health Dis. (2023) 22:195. doi: 10.1186/s12944-023-01963-4
32.
Zhou J Mi J Peng Y Han H Liu Z . Causal associations of obesity with the intervertebral degeneration, low back pain, and sciatica: a two-sample Mendelian randomization study. Front Endocrinol. (2021) 12:740200. doi: 10.3389/fendo.2021.740200
33.
Segar AH Baroncini A Urban JPG Fairbank J Judge A McCall I . Obesity increases the odds of intervertebral disc herniation and spinal stenosis; an MRI study of 1634 low back pain patients. Eur Spine J. (2024) 33:915–23. doi: 10.1007/s00586-024-08154-4
34.
Ahmed B Sultana R Greene MW . Adipose tissue and insulin resistance in obese. Biomed Pharmacother. (2021) 137:111315. doi: 10.1016/j.biopha.2021.111315
Summary
Keywords
insulin resistance, National Health and Nutrition Examination Survey, triglyceride-glucose index, cross sectional study, low back pain
Citation
Que Z, Chen D, Cai H, Lan W, Huang Y and Rui G (2025) Associations between insulin resistance and low back pain risk in US adults: a cross-sectional study. Front. Med. 12:1538754. doi: 10.3389/fmed.2025.1538754
Received
03 December 2024
Accepted
09 April 2025
Published
28 April 2025
Volume
12 - 2025
Edited by
Marios Kyriazis, National Gerontology Centre, Cyprus
Reviewed by
Wencai Liu, Shanghai Jiao Tong University, China
Tengda Huang, Sichuan University, China
Anemut Tilahun, Debre Tabor University, Ethiopia
Updates
Copyright
© 2025 Que, Chen, Cai, Lan, Huang and Rui.
This is an open-access article distributed under the terms of the Creative Commons Attribution License (CC BY). The use, distribution or reproduction in other forums is permitted, provided the original author(s) and the copyright owner(s) are credited and that the original publication in this journal is cited, in accordance with accepted academic practice. No use, distribution or reproduction is permitted which does not comply with these terms.
*Correspondence: Gang Rui, reigang@163.com; Yuxuan Huang, 1215923754@qq.com; Weibin Lan, oldboy2004@163.com
†These authors have contributed equally to this work
Disclaimer
All claims expressed in this article are solely those of the authors and do not necessarily represent those of their affiliated organizations, or those of the publisher, the editors and the reviewers. Any product that may be evaluated in this article or claim that may be made by its manufacturer is not guaranteed or endorsed by the publisher.