Abstract
Background:
Early Vascular Aging (EVA) is a significant risk factor for cardiovascular disease in patients with type 2 diabetes mellitus (T2DM). This study aimed to explore the risk factors for EVA in patients with T2DM in China and develop nomograms for EVA in patients with T2DM.
Methods:
We retrospectively analyzed data from 1,543 patients with T2DM. The patients were divided into non-EVA and EVA groups based on ankle-brachial pulse wave velocity (PWV).
Results:
(1) The risk factors for EVA in male included longer diabetic duration (OR = 1.09 95 CI% 1.06–1.11), high blood pressure (OR = 2.06, 95 CI% 1.51–2.81), smoking (OR = 1.96 95 CI% 1.17–3.27), diabetic nephropathy (DN; OR = 1.60 95 CI% 1.10–2.32), and diabetic retinopathy (DR; OR = 2.93 95 CI% 2.00–4.29). The risk factors for EVA in females included longer duration of diabetes (OR = 1.04 95 CI% 1.01–1.07), smoking (OR = 2.02, 95 CI% 1.13, 3.59), high blood pressure (OR = 1.91, 95 CI% 1.22–2.79), diabetic nephropathy (OR = 1.61 95 CI% 1.02–2.52), and diabetic retinopathy (OR = 3.61 95 CI% 2.24–5.74). (2) The results showed that the nomogram-based risk prediction model achieved an area under the curve of 0.73 for men and 0.74 for women. The overall predictive accuracy of the nomogram for EVA in men was 67.85%, and its specificity and sensitivity were 73.74 and 62.33%, respectively. The overall predictive accuracy of the nomogram for EVA in females was 69.29%, and its specificity and sensitivity were 66.55 and 71.93%, respectively.
Conclusions:
The nomogram-based risk prediction model for EVA in T2DM patients showed good discriminative ability and predictive accuracy. It provides clinicians with a reliable tool to estimate the risk of EVA in T2DM patients, allowing for early interventions and reduction of cardiovascular diseases in high-risk populations.
1 Introduction
Vascular aging is an age-related degenerative disease of the cardiovascular system that occurs with age. It is often accompanied by elastic arterial stiffness, decreased compliance, weakened vascular endothelial cell (VEC) function, vascular repair, and neogenesis. Vascular aging can be classified into physiological and pathological types.
The former is physiological degeneration that occurs after maturity, and the latter is mostly caused by diseases such as type 2 diabetes mellitus (T2DM) and atherosclerosis. Both diseases significantly increase the risk of cardiovascular diseases (1). Early vascular aging (EVA) refers to premature vascular aging, in which the actual vascular age differs from the biological vascular age. The vascular state is an accelerated vascular aging state that cannot be explained by aging. EVA is characterized by vascular stiffness, endothelial dysfunction, impaired vasodilation, and chronic inflammation. The pulse wave velocity (PWV) is commonly used to evaluate the degree of vascular sclerosis in patients with diabetes. The diagnostic criterion for EVA is a PWV value, after adjusting for age, that is two standard deviations higher than the normal reference value of the healthy population (2).
T2DM is associated with early onset vascular senescence, which can damage the function of intimal vascular endothelial cells (VEC) and vascular adventitial fibroblasts (VAFs), and cause vascular aging (3). Most of these injuries are related to glucose and lipid homeostasis, inflammatory reactions, oxidative stress, autophagy pathways, angiotensin II (Ang II), and other factors.
Our previous study showed that with increasing age, the degree of vascular sclerosis, blood pressure, blood glucose, and high blood lipid levels can accelerate the speed of vascular sclerosis and cause changes in the vascular physiological state earlier than their physiological age (4). Maintaining normal vascular aging is crucial for vascular health and delaying the occurrence of cardiovascular diseases, which can be prevented and treated by improving lifestyle or drug use, thereby increasing the incidence and mortality of vascular-related diseases (5). EVA is a significant risk factor for cardiovascular disease in patients with T2DM. Accelerated vascular aging process in T2DM patients contributes to increased morbidity and mortality due to cardiovascular events. Therefore, establishing an accurate risk prediction and simple-to-use model for EVA is crucial for identifying high-risk patients and implementing early interventions.
Currently, there are few studies on the relationship between T2DM and EVA in China, and no studies have identified the risk factors for EVA and established related prediction models in T2DM patients.
This study explored the incidence and risk factors of EVA in patients with T2DM and established a nomogram-based model according to the related risk factors to provide new evidence for the early identification and intervention of EVA in patients with T2DM.
2 Materials and methods
We followed the methods described in our study before (6).
2.1 Ethics statement
This study has been approved by the Ethics Committee of Peking University International Hospital. The ethical approval number for this study is 2021-KY-0051-02.
2.2 Research subjects
This study retrospectively included 1,823 T2DM patients from January 2017 to August 2021 at Peking University International Hospital. According to the inclusion and exclusion criteria, 1,523 patients, including 983 males and 560 females, were enrolled in the study, with an average age of 55.59 ± 13.12 years.
All patients met the diagnostic criteria for diabetes set by the World Health Organization (WHO) in 1999 (7). The exclusion criteria were as follows: (1) patients with type 1 diabetes, gestational diabetes, and other special types of diabetes; (2) suffering from diseases such as parathyroid dysfunction, thyroid dysfunction, and adrenal dysfunction; (3) suffering from severe liver and kidney dysfunction; and (4) suffering from atherosclerosis, malignant tumor, and blood system disease.
2.3 General conditions and clinical data
Data from 1,543 patients were retrospectively analyzed, and their general conditions, including sex, age, diabetes duration, height, weight, systolic blood pressure (SBP), diastolic blood pressure (DBP), history of smoking and drinking, history of high blood pressure (HBP), history of diabetic retinopathy (DR), and history of diabetic nephropathy (DN) were recorded. The body mass index (BMI) was calculated as follows: BMI (kg/m2) = weight (kg) / body height2 (m2).
2.4 Laboratory biochemical indices
All participants fasted for more than 8 h, and the blood biochemical indices were measured the following morning of the next day, including C-reactive protein (CRP), glycosylated hemoglobin (HbA1c), fasting blood glucose (FBG), triglyceride (TG), total cholesterol (TC), high-density lipoprotein cholesterol (HDL-C), low-density lipoprotein cholesterol (LDL-C), serum creatinine (sCr), uric acid (UA), aspartate aminotransferase (AST), alanine aminotransferase (ALT), and albumin (ALB). The glomerular filtration rate (eGFR) was calculated according to the sCr. Postprandial blood glucose (PBG) levels were measured 2 h after the first meal bite. Biochemical indices were tested using a Beckman Coulter U5811 (USA). HbA1c was determined by high-performance liquid chromatography using the detection instrument model of the Japan Dongcao G8 glycosylated hemoglobin analyzer.
The glomerular filtration rate (eGFR) was calculated based on the sCr values of the study participants as follows:
Male:
-
sCr ≤ 0.9 mg/dl: eGFR CKD-EPI-ASIA = 141 × (sCr/0.9) – 0.411 × 0.993 age × 1.057
-
sCr > 0.9 mg/dl: eGFR CKD-EPI-ASIA = 141 × (sCr/0.9) – 1.209 × 0.993 age × 1.057
Female:
-
sCr ≤ 0.7 mg/dl: eGFR CKD-EPI-ASIA = 141 × (sCr/0.7) – 0.329 × 0.993 age × 1.049
-
sCr > 0.7 mg/dl: eGFR CKD-EPI-ASIA = 141 × (sCr/0.7) – 1.209 × 0.993 age × 1.049
2.5 EVA diagnosis
We use a BP-203 III automatic atherosclerosis analyzer (Omron, Tokyo, Japan) to measure ankle-brachial index (ABI) and PWV values. The left and right ABI were calculated as the systolic ankle pressure divided by the systolic brachial pressure. ABI and PWV values were measured and assessed by the same group of physicians in the Department of Endocrinology to avoid potential interexaminer differences.
The diagnostic criterion for EVA is the condition in which the PWV value after adjusting for age is two standard deviations higher than the normal reference value of the healthy population (2). Patients were divided into non-EVA and EVA groups based on PWV values.
2.6 Statistical methods
Data analyses were performed using the SPSS software (version 21.0; SPSS Inc., Chicago, IL, USA). The t-test and Wilcoxon test were used to compare data between the two groups for normally and non-normally distributed data, respectively. The χ2 test was used for comparisons between the two groups. Unconditional multivariable logistic regression analysis was used to calculate odds ratios (ORs) and corresponding 95% confidence intervals (95% CIs). Differences were considered statistically significant at p < 0.05. We used multiple imputations to supplement the missing values of the variables.
We use packages R (https://www.R-project.org) and EmpowerStats (https://www.empowerstats.com, X&Y Solutions, Inc., Boston, MA) to establish the nomogram. Receiver operating characteristic (ROC) curves were used to evaluate the discriminatory ability of the nomogram, and the area under the ROC curve (AUC) was calculated using 500 bootstrap resamplings.
3 Results
3.1 Comparison of general conditions and biochemical indexes between the two groups
The incidence of EVA in T2DM patients was 51.33%. Compared to the non-EVA group, the EVA group had a significantly higher incidence of HBP (χ2 = 55.29, p < 0.05). Compared with the non-EVA group, the patients in the EVA group were older and had a longer diabetes duration, with statistically significant differences (t = −6.57, p < 0.05; t = −10.61, p < 0.05). Compared with the non-EVA group, patients in the EVA group had significantly higher PBG levels and lower eGFR levels, with statistically significant differences (t = −2.00, p < 0.05; t = 5.22, p < 0.05). PWV levels in the EVA group were higher than those in the non-EVA group, and ABI was significantly lower in the EVA group than in the non-EVA group (t = −27.29, p < 0.05; t = 3.87, p < 0.05). The CIMT levels in the EVA group were higher than those in the non-EVA group; however, the difference was not statistically significant (p > 0.05). The incidence of DR and DN in the EVA group was significantly higher than that in the non-EVA group (χ2 = 44.28, p < 0.05; χ2 = 96.30, p < 0.05, respectively). The proportion of smokers in the EVA group was significantly higher than that in the non-EVA group (χ2 = 21.02, p < 0.05). There were no significant differences in sex, drinking status, BMI, FBG, HbA1c, AST, ALT, ALB, TC, TG, LDL-C, HDL-C, UA levels, and medications between the two groups (p > 0.05; Table 1).
Table 1
| Index | Non-EVA group (n = 751) | EVA group (n = 792) | t (χ2) | p-value |
|---|---|---|---|---|
| Age (years) | 53.39 ± 13.55 | 57.76 ± 12.67 | −6.57 | < 0.001 |
| Sex | ||||
| Male | 476 (63.38%) | 507 (64.02%) | 0.07 | 0.80 |
| Female | 275 (36.62%) | 285 (35.98%) | ||
| Duration (years) | 7.71 ± 7.83 | 11.74 ± 7.61 | −10.61 | < 0.001 |
| BMI (kg/m2) | 25.71 ± 2.83 | 25.71 ± 3.46 | 0.01 | 0.99 |
| SBP (mmHg) | 127.74 ± 17.99 | 137.068 ± 16.86 | −10.84 | < 0.001 |
| DBP (mmHg) | 77.94 ± 11.51 | 80.84 ± 10.73 | −5.15 | < 0.001 |
| HBP (%) | 219 (29.16%) | 377 (47.60%) | 55.29 | < 0.001 |
| Smoking (%) | 125 (16.64%) | 263 (33.21%) | 21.02 | < 0.001 |
| Drinking (%) | 112 (14.91%) | 122 (15.40%) | 0.82 | 0.77 |
| CRP (mg/L) | 5.64 ± 1.32 | 6.05 ± 0.98 | −0.99 | 0.32 |
| FBG | 8.97 ± 3.31 | 9.15 ± 3.39 | −1.05 | 0.29 |
| PBG | 12.58 ± 5.50 | 13.11 ± 4.57 | −2.00 | 0.01 |
| TC (mmol/L) | 4.42 ± 1.17 | 4.32 ± 1.22 | 1.64 | 0.10 |
| TG (mmol/L) | 2.03 ± 1.38 | 1.96 ± 1.39 | 1.07 | 0.29 |
| LDL-C (mmol/L) | 2.57 ± 0.94 | 2.54 ± 0.91 | 0.45 | 0.65 |
| HDL-C (mmol/L) | 1.01 ± 0.30 | 1.03 ± 0.29 | −1.17 | 0.24 |
| eGFR (ml/min/1.73 m2) | 100.26 ± 19.59 | 95.03 ± 19.15 | 5.22 | < 0.001 |
| UA (mmol/L) | 344.50 ± 97.83 | 349.17 ± 89.70 | −0.96 | 0.33 |
| AST | 23.42 ± 26.08 | 22.53 ± 23.24 | 1.10 | 0.25 |
| ALT | 26.65 ± 19.67 | 24.88 ± 15.37 | 1.83 | 0.19 |
| ALB | 44.73 ± 29.67 | 41.53 ± 29.02 | 1.36 | 0.17 |
| HbA1c (%) | 8.78 ± 1.97 | 8.83 ± 2.03 | −0.49 | 0.62 |
| PWV | 1,401.15 ± 398.01 | 1,846.78 ± 380.00 | −27.29 | < 0.001 |
| ABI | 1.15 ± 0.12 | 1.13 ± 0.13 | 3.87 | < 0.001 |
| CIMT | 1.09 ± 0.54 | 1.18 ± 0.54 | −1.77 | 0.08 |
| Complications | ||||
| DN (%) | 123 (16.38%) | 244 (30.81%) | 44.28 | < 0.001 |
| DR (%) | 97 (12.92%) | 271 (34.22%) | 96.30 | < 0.001 |
| Medicine | ||||
| Metformin | 491 (65.38%) | 502 (63.38%) | 4.32 | 0.65 |
| Sulfonylureas | 103 (13.72%) | 114 (14.39%) | 3.23 | 0.78 |
| Insulin | 234 (31.16%) | 297 (37.50%) | 5.44 | 0.43 |
| SGLT-2 inhibitors | 372 (49.53%) | 352 (44.44%) | 4.83 | 0.50 |
| GLP-1 receptor agonists | 293 (39.01%) | 297 (37.5%) | 6.32 | 0.16 |
| Thiazolidinedione | 79 (10.52%) | 101 (12.75%) | 4.71 | 0.38 |
Comparison of general conditions and biochemical indexes between the two groups.
BMI, body mass index; SBP, systolic blood pressure; DBP, diastolic blood pressure; HBP, high blood pressure; CRP, C-reactive protein; FBG, fasting blood glucose; PBG, postprandial blood glucose; HbA1c, glycosylated hemoglobin; TC, total cholesterol; TG, triglyceride; LDL-C, low-density lipoprotein cholesterol; HDL-C, high-density lipoprotein cholesterol; AST, aspartate aminotransferase; ALT, alanine aminotransferase; ALB, albumin; UA, uric acid; eGFR, estimated glomerular filtration rate; PWV, pulse wave velocity; ABI, ankle-brachial index; CIMT, carotid intima-media thickness; DN, diabetic nephropathy; DR, diabetic retinopathy; SGLT-2, sodium-dependent glucose transporters 2; GLP-1, glucagon-like peptide-1.
3.2 Multivariable logistic regression analysis of risk factors for EVA occurrence in T2DM patients
Multivariate logistic regression analysis was performed with EVA as the dependent variable and baseline characteristics (age, duration, BMI, HBP, smoking, HbA1c, TC, TG, DN, and DR) as independent variables. The risk factors for EVA in male included: longer diabetic duration (OR = 1.09 95 CI% 1.06–1.11), HBP (OR = 2.06, 95 CI% 1.51–2.81), smoking (OR = 1.96 95 CI% 1.17–3.27), DN (OR = 1.60 95 CI% 1.10–2.32), and DR (OR = 2.93 95 CI% 2.00–4.29).
Multivariate logistic regression analysis was performed with EVA as the dependent variable and baseline characteristics (age, duration, BMI, smoking, HBP, HbA1c, TC, TG, DN, and DR) as independent variables. The risk factors for EVA in female included longer diabetic duration (OR = 1.04 95 CI% 1.01–1.07), smoking (OR = 2.02, 95 CI% 1.13, 3.59), HBP (OR = 1.91, 95 CI% 1.22–2.79), DN (OR = 1.61 95 CI% 1.02–2.52), and DR (OR = 3.61 95 CI% 2.24–5.74; Table 2).
Table 2
| Index | Crude OR | 95% CI | p-value | Adjust OR | 95% CI | p-value |
|---|---|---|---|---|---|---|
| Male | ||||||
| Age | 1.03 | 1.02, 1.04 | < 0.001 | 1.01 | 1.00, 1.02 | 0.20 |
| Duration | 1.06 | 1.03, 1.09 | < 0.001 | 1.09 | 1.06, 1.11 | < 0.001 |
| HBP | 2.51 | 1.81, 3.48 | < 0.001 | 2.06 | 1.51, 2.81 | < 0.001 |
| BMI | 1.00 | 0.97, 1.04 | 0.79 | 1.03 | 0.99, 1.06 | 0.14 |
| Smoking | 2.51 | 1.81, 3.48 | < 0.001 | 1.96 | 1.17, 3.27 | < 0.001 |
| TC | 0.86 | 0.77, 0.95 | < 0.001 | 0.94 | 0.84, 1.06 | 0.30 |
| TG | 0.91 | 0.83, 0.99 | < 0.001 | 0.96 | 0.87, 1.06 | 0.44 |
| HbA1c | 0.98 | 0.91, 1.06 | 0.65 | 1.01 | 0.94, 1.08 | 0.83 |
| DR | 3.71 | 2.29, 4.39 | < 0.001 | 2.93 | 2.00, 4.29 | < 0.001 |
| DN | 2.32 | 1.69, 3.18 | < 0.001 | 1.60 | 1.10, 2.32 | 0.01 |
| Female | ||||||
| Age | 0.99 | 0.96, 1.01 | 0.36 | 1.01 | 0.95, 1.06 | 0.43 |
| Duration | 1.07 | 1.04, 1.09 | < 0.001 | 1.04 | 1.01, 1.07 | < 0.001 |
| HBP | 2.20 | 1.55, 3.12 | < 0.001 | 1.91 | 1.22, 2.79 | < 0.001 |
| BMI | 0.99 | 0.95, 1.04 | 0.64 | 1.00 | 0.95, 1.05 | 0.88 |
| Smoking | 2.47 | 1.72, 3.57 | < 0.001 | 2.02 | 1.13, 3.59 | < 0.001 |
| TC | 1.05 | 0.88, 1.25 | 0.58 | 1.14 | 0.98, 1.32 | 0.09 |
| TG | 1.02 | 0.86, 1.21 | 0.82 | 1.10 | 0.97, 1.26 | 0.15 |
| HbA1c | 1.07 | 0.98, 1.17 | 0.11 | 1.04 | 0.94, 1.14 | 0.46 |
| DR | 4.11 | 2.68, 6.31 | < 0.001 | 3.61 | 2.24, 5.74 | < 0.001 |
| DN | 2.20 | 1.49, 3.25 | < 0.001 | 1.61 | 1.02, 2.52 | 0.004 |
Univariate logistic regression analysis of EVA.
BMI, body mass index; HBP, high blood pressure; HbA1c, glycosylated hemoglobin; TC, total cholesterol; TG, triglyceride; DN, diabetic nephropathy; DR, diabetic retinopathy.
3.3 Predictive nomograms model for EVA and predictive accuracy of nomograms
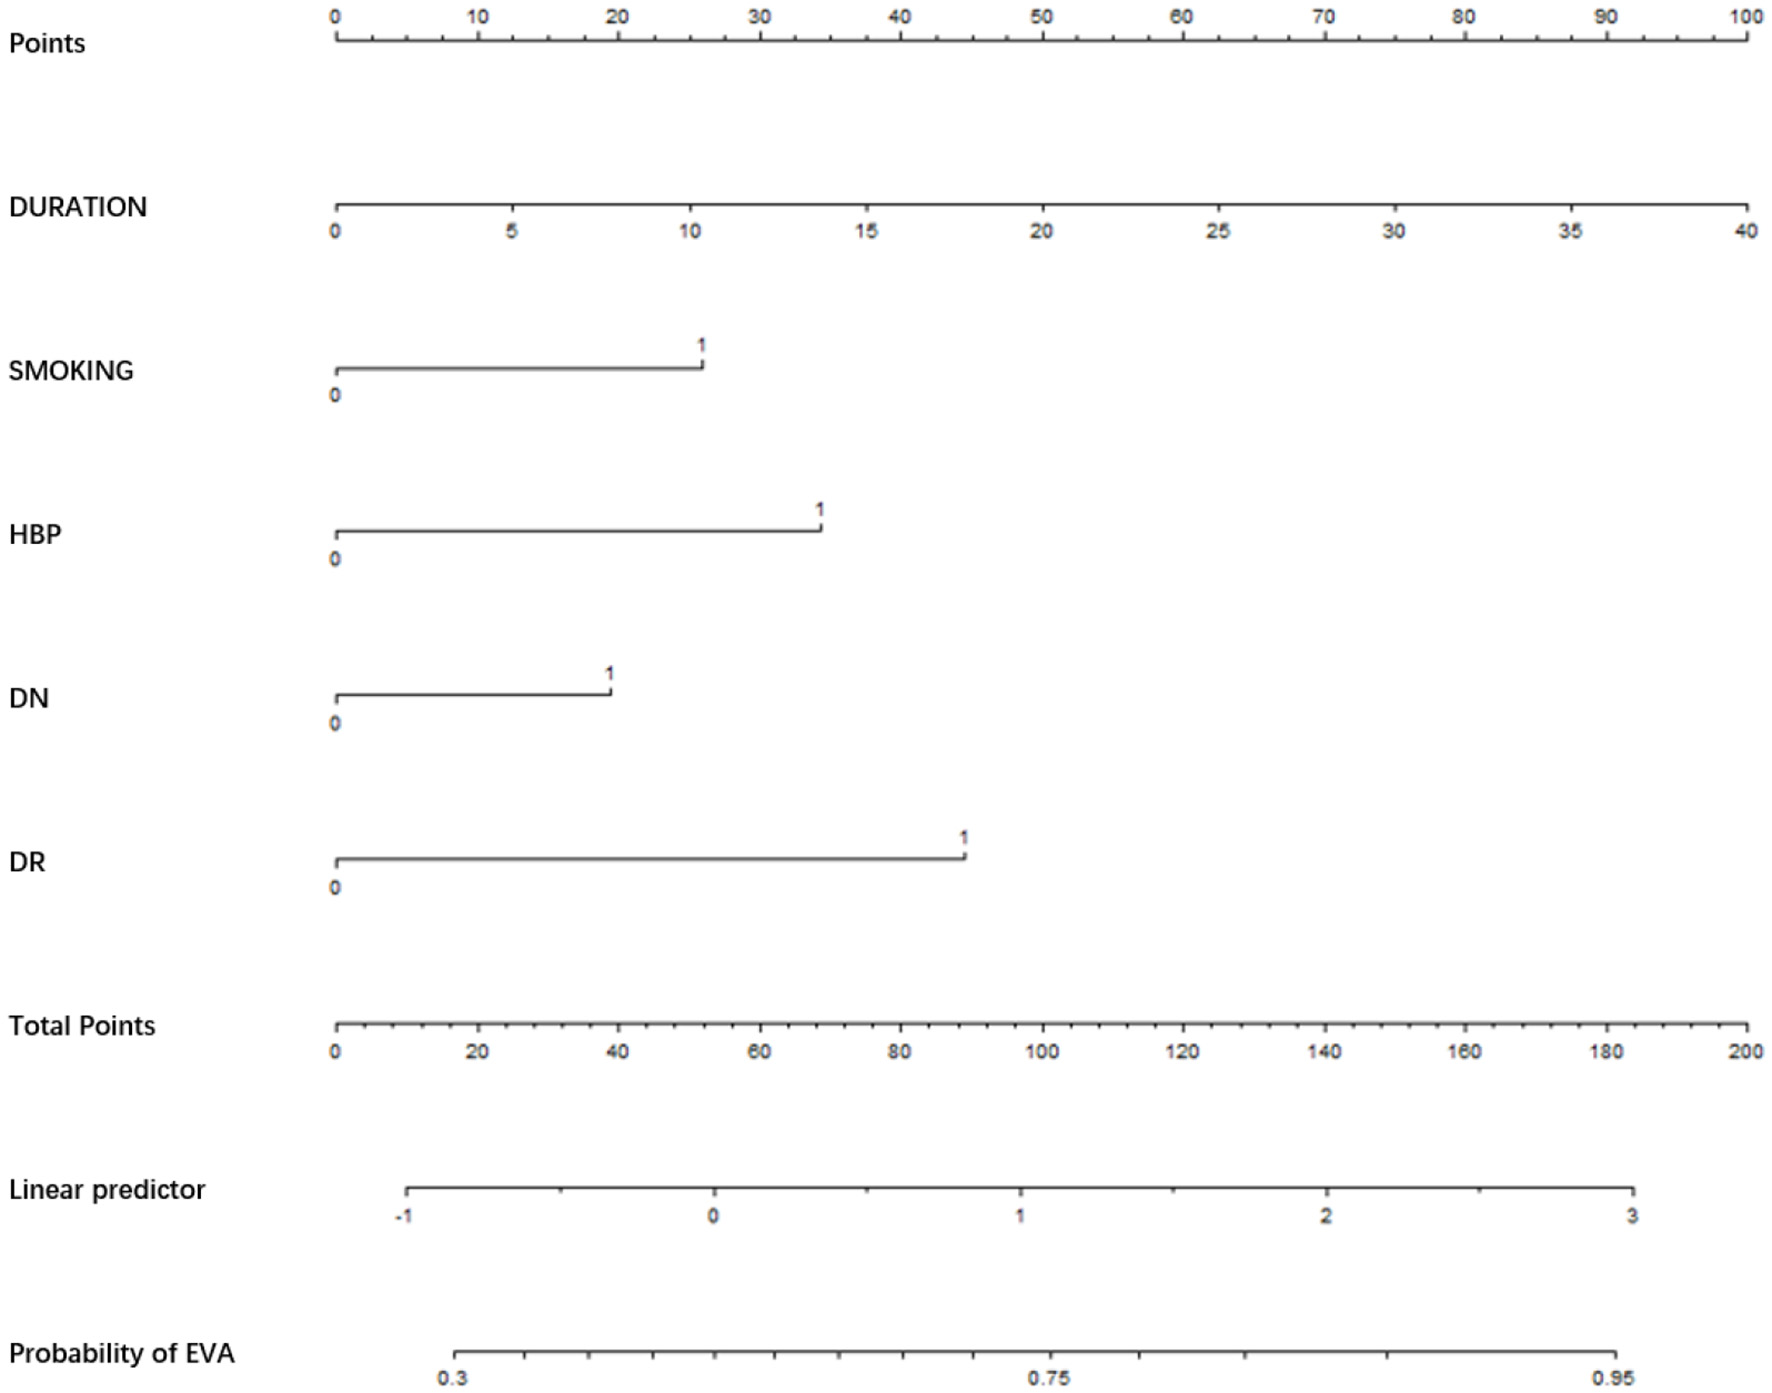
We used the risk factors for EVA obtained from the multivariable logistic regression analysis as variables in the prediction nomogram of EVA. Nomograms for evaluating the risk of EVA in males and females were developed for T2DM patients based on risk factors identified by multivariable logistic regression analysis (Figures 1–3).
Figure 1

Nomogram for EVA in patients with T2DM. Instructions: to estimate an individual's EVA risk for female with T2DM, his/her value on each variable axis. Draw a verticle line from that value to the top that Points scale for determining how many points are assigned by that variable valule. Then, the points from each variable value are summed. Locate the sum on the Total Points sacle and vertically project in onto the bottom axis, then obtaining a personalized EVA risk of T2DM.
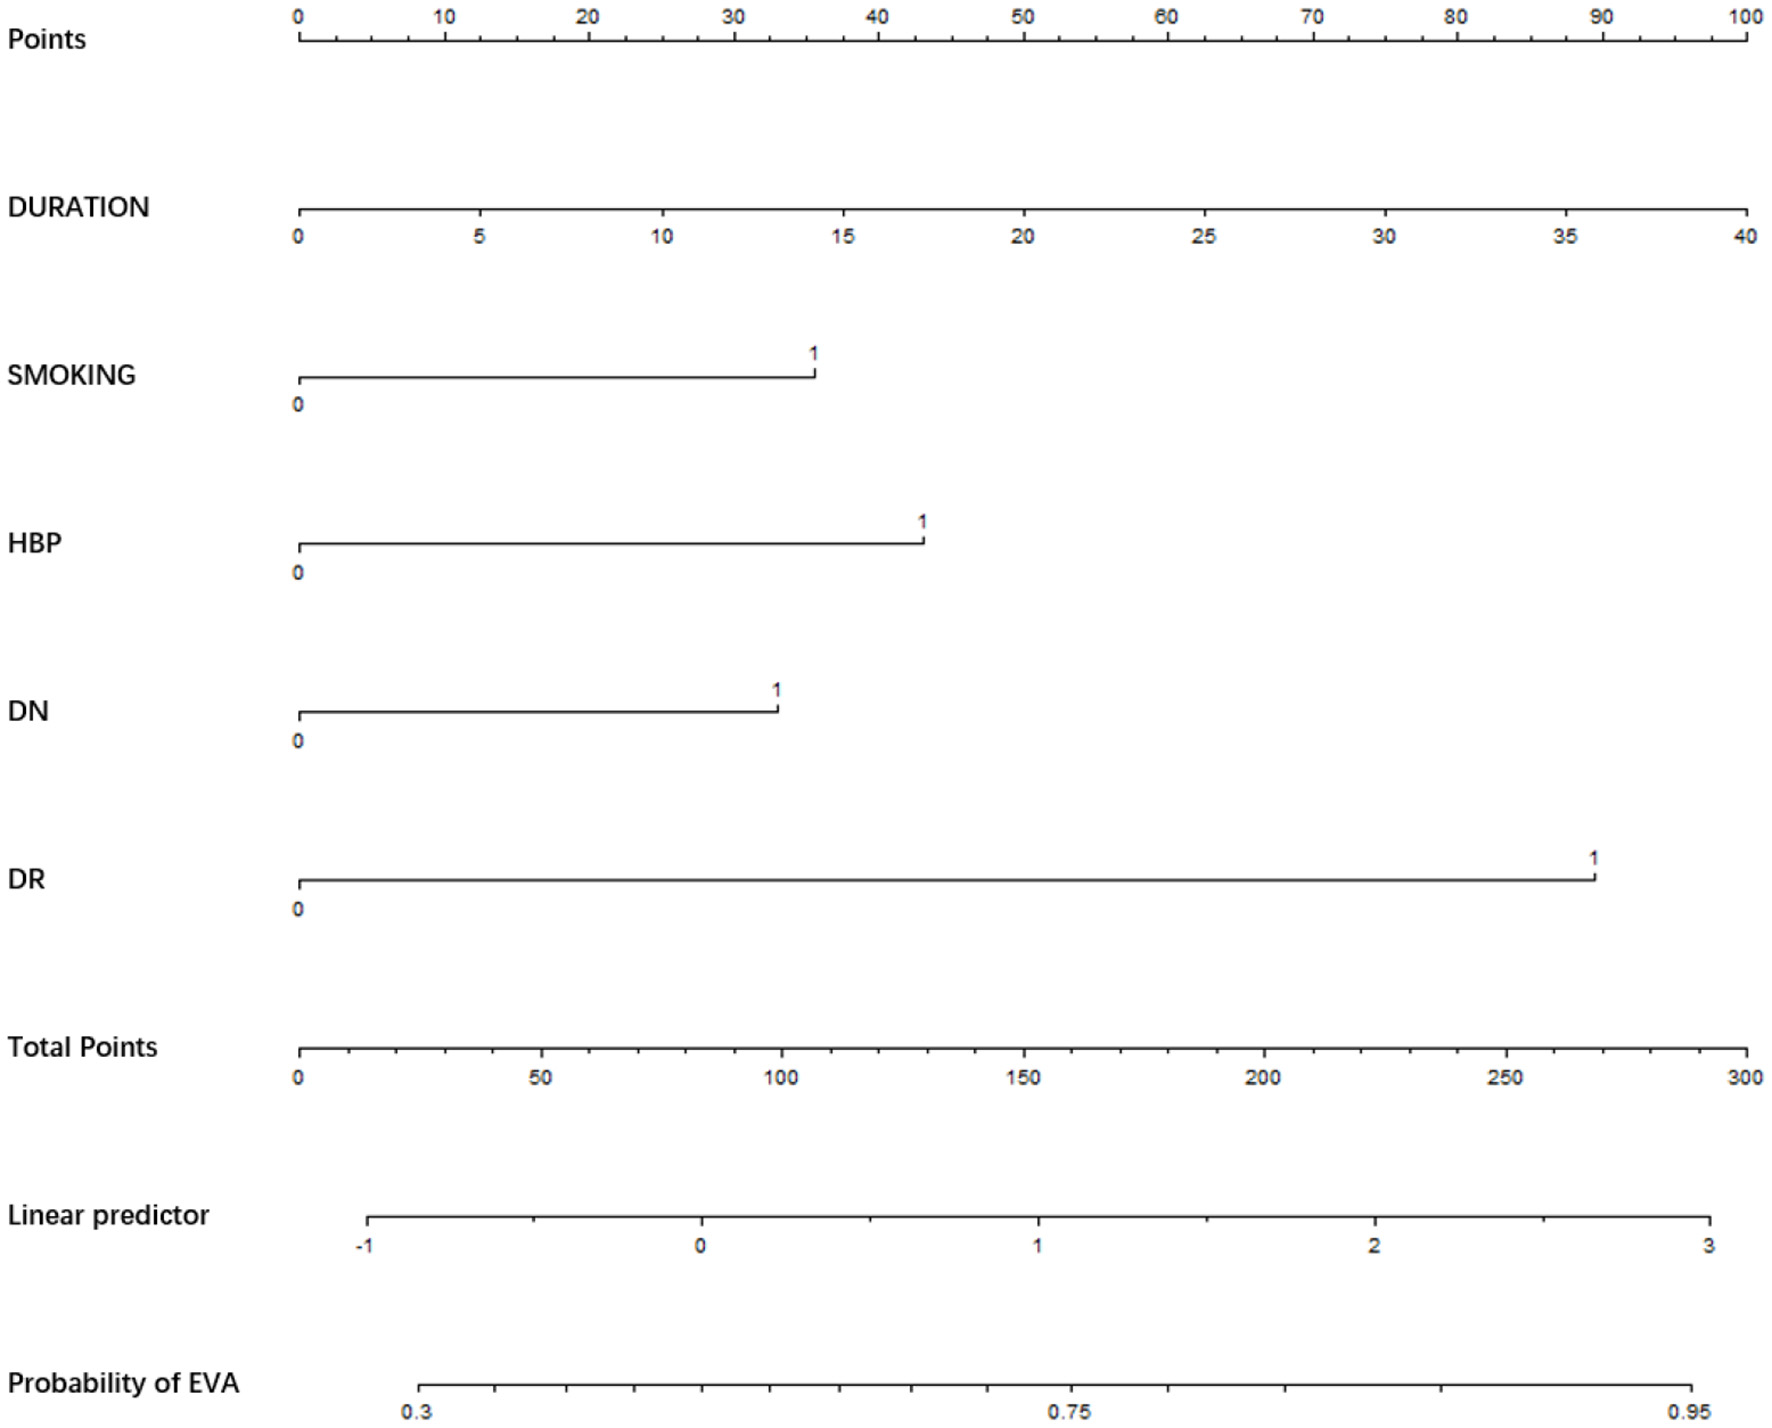
Figure 2
Nomogram for EVA in male with T2DM. Instructions: to estimate an individual's EVA risk for male with T2DM, his value on each variable axis. Draw a verticle line from that value to the top that Points scale for determining how many points are assigned by that variable valule. Then, the points from each variable value are summed. Locate the sum on the Total Points sacle and vertically project in onto the bottom axis, then obtaining a personalized EVA risk of T2DM.
Figure 3
Nomogram for EVA in female with T2DM. Instructions: to estimate an individual's EVA risk for female with T2DM, her value on each variable axis. Draw a verticle line from that value to the top that Points scale for determining how many points are assigned by that variable valule. Then, the points from each variable value are summed. Locate the sum on the Total Points sacle and vertically project in onto the bottom axis, then obtaining a personalized EVA risk of T2DM.
The area under the curve (AUC) of the model was 0.732. The overall predictive accuracy of the nomogram for EVA was 68.374%, and the specificity and sensitivity were 69.07% and 68.37%, respectively. The AUC of the nomogram for EVA in male is 0.73 and in female is 0.74. The overall predictive accuracy of the nomogram for EVA in men was 67.85%, with a specificity and sensitivity of 73.74% and 62.33%, respectively. The overall predictive accuracy of the nomogram for EVA in females was 69.29%, with a specificity and sensitivity of 66.55% and 71.93%, respectively (Figures 4–6).
Figure 4
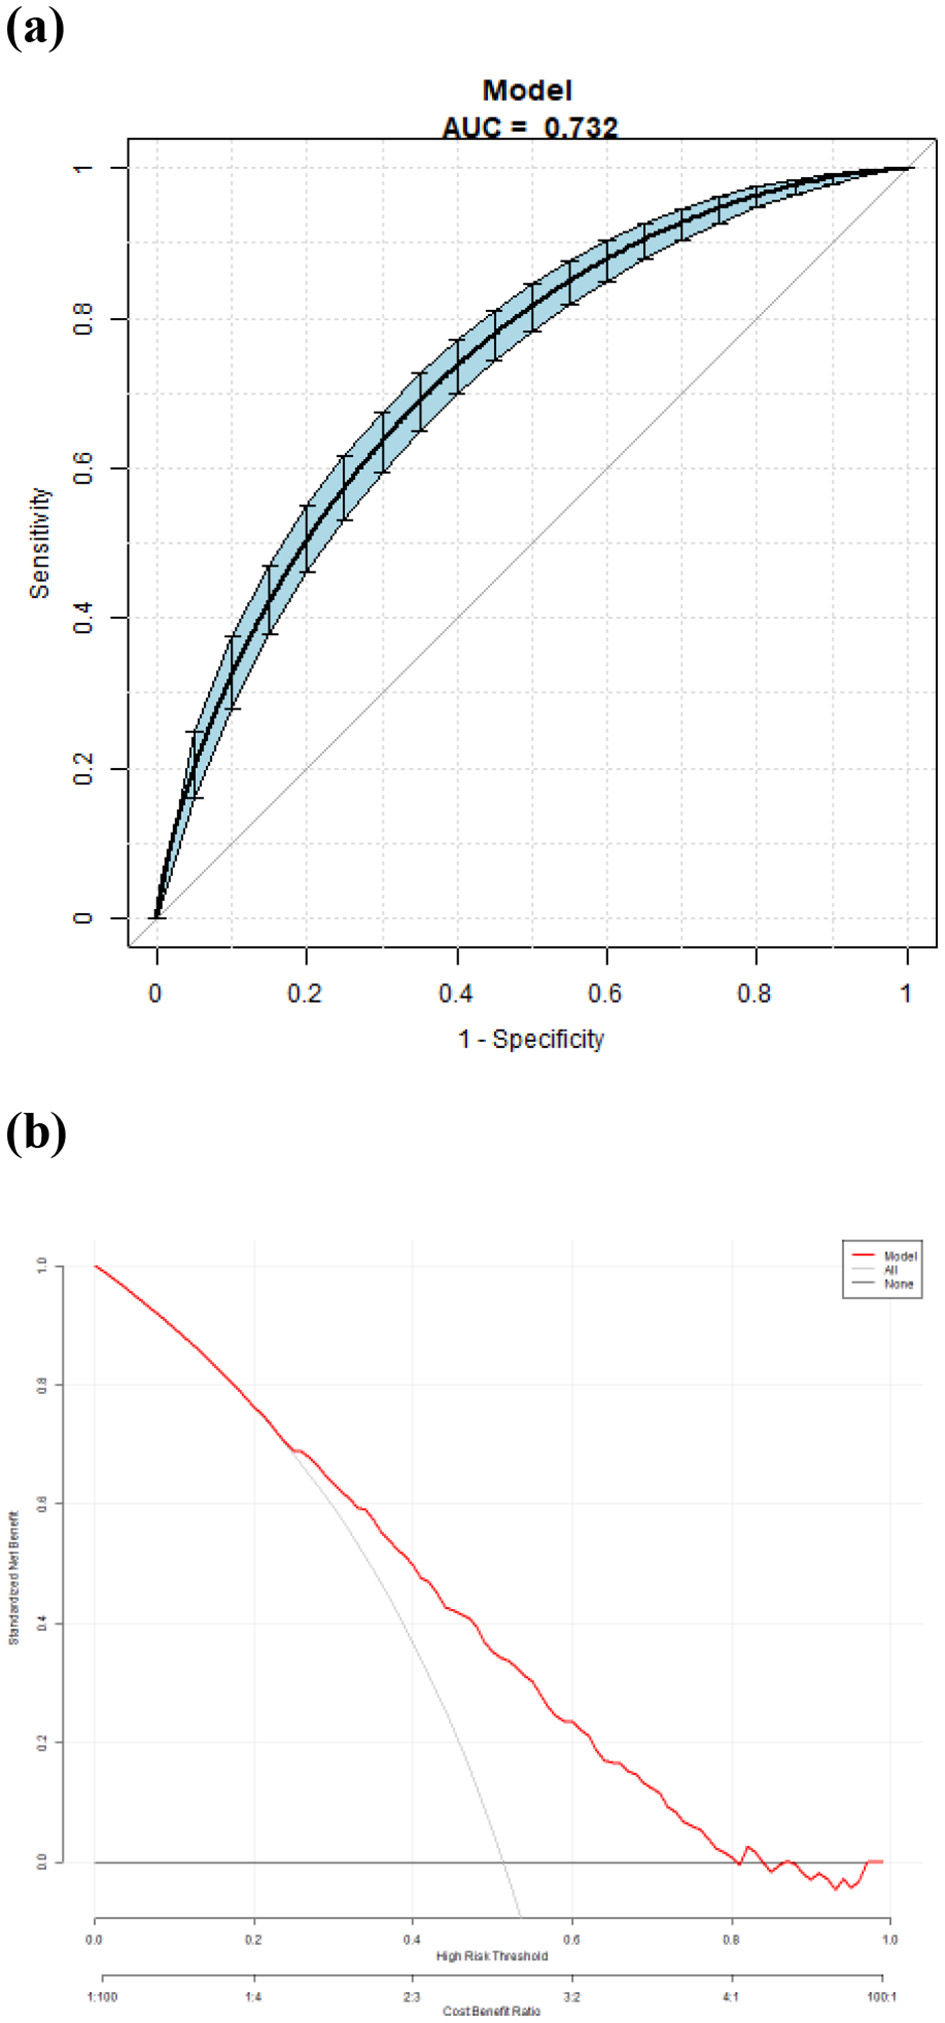
(a) Receiver operating characteristic (ROC) curves for the accuracy of the EVA nomogram with T2DM. The AUC of the Model is 0.732. The overall predictive accuracy of the nomogram for EVA was 68.374%, and the specificity and sensitivity were 69.07% and 68.37%, respectively. (b) Decision curve analysis (DCA) for the EVA nomogram with T2DM.
Figure 5

(a) Receiver operating characteristic (ROC) curves for the accuracy of the EVA nomogram in male with T2DM. The AUC of the Model is 0.732. The overall predictive accuracy of the nomogram for EVA was 67.85%, and the specificity and sensitivity were 73.74% and 62.33%, respectively. (b) Decision curve analysis (DCA) for the EVA nomogram in male with T2DM.
Figure 6

(a) Receiver operating characteristic (ROC) curves for the accuracy of the EVA nomogram in female with T2DM. The AUC of the Model is 0.741. The overall predictive accuracy of the nomogram for EVA was 69.29%, and the specificity and sensitivity were 66.55% and 71.93%, respectively. (b) Decision curve analysis (DCA) for the EVA nomogram in female with T2DM.
4 Discussion
Individuals with T2DM are at a higher risk of cardiovascular events than those in the general population. Several studies have investigated the association between EVA and T2DM (8–11). These studies have consistently demonstrated that T2DM patients have a higher prevalence and severity of EVA than those without T2DM. Several studies have attempted to develop risk prediction models for EVA in T2DM patients. These models aim to identify high-risk patients and provide clinicians with tools for early interventions (12, 13). However, the above research results only identified the risk factors for EVA and did not establish a simple and practical prediction model for each individual. The mechanism of EVA in patients with T2DM includes the following aspects: (1) inflammatory reaction (14): the balance of advanced glycation end products (AGEs) in T2DM patients is broken and accumulated in large quantities, which can block the insulin pathway and promote inflammatory reactions (15). Simultaneously, elastin rupture, collagen deposition, vasodilation, and inner diameter of arterial muscle cells can lead to a decrease in vascular elasticity and hardness, while inflammatory reactions and oxidative stress can cause autophagy to hinder angiogenesis, leading to aggravation of vascular aging (16). (2) Inhibited autophagy pathway (17). Autophagy is one of the main pathways to promote the clearance of AGEs, and blocking this pathway can lead to the accumulation of AGEs and the production of inflammatory cytokines, which can lead to endothelial injury of endothelial functional cells in T2DM patients and aggravate vascular aging (18). (3) Ang II: T2DM can promote the use of Ang II in muscle cells to upregulate the expression of DNA methyltransferase, leading to thickening of the blood vessel wall (19). Although both mechanistic and clinical studies have confirmed that T2DM patients are prone to EVA, there is still a lack of a simple and practical clinical model at home and abroad to demonstrate the prediction of EVA occurrence probability in T2DM patients. There is a need for a specific risk prediction model for EVA in T2DM patients. This study aimed to develop a nomogram-based risk prediction model for EVA in T2DM patients.
In our study, diabetes duration was identified as a significant predictor. This suggests that the longer an individual lives with T2DM, the higher the risk of EVA. This finding highlights the importance of early diagnosis and intervention in T2DM patients to prevent or delay the occurrence of EVA. Additionally, HBP was identified as an important predictor of EVA in patients with T2DM. Elevated blood pressure is a known risk factor for cardiovascular disease and has been associated with vascular aging. Our study emphasizes the need for monitoring and managing blood pressure in T2DM patients to identify the risk of EVA. In our study, smoking was a risk factor for EVA in both male and female patients; smoking increased free radicals (such as peroxides) in the body, thereby decreasing vascular endothelial diastolic function, resulting in arterial contraction. This promotes arterial stenosis, accelerates arteriosclerosis, aggravates limb ischemia, and ultimately leads to EVA (20). DN and DR are the most common microvascular complications. Proteinuria is an independent risk factor for diabetes and cardiovascular mortality. Systemic endothelial dysfunction is a common underlying factor of DN and vascular aging (21). Our study revealed an association between DN and EVA. The risk of EVA was 1.60 times higher in males and 1.61 times higher in females. Therefore, it is recommended that patients with T2DM actively monitor their urinary microalbumin levels. If the levels of urinary microalbumin are found to be abnormal, it is necessary to regularly check the vascular condition to take active care and obtain preventive treatment. Several studies have shown a strong association between DR and macrovascular diseases, such as cardiovascular disease in T2DM patients (22, 23). Multivariable logistic regression analysis showed that DR was an independent risk factor for EVA in both men and women, with OR of 2.93 and 3.91, respectively. This may be because the pathogenesis of these two diseases shares common risk factors (24). There was no significant difference in BMI between the EVA and non-EVA groups in our study. BMI was not an independent factor influencing the EVA. Similar results have been found in different populations in China and Germany (25–27). Some studies suggest that a high BMI may be a protective factor for arteriosclerosis in males aged 35–55 years (27). This finding may be related to the obesity paradox. Obesity has many adverse effects on the body, but it also has some benefits. Although obesity may be an important factor in arterial remodeling, leading to changes in hemodynamics and arterial structure affecting normal vascular function, the vascular endothelial function of obese individuals may still be normal (26). Simultaneously, obese patients have higher nutritional reserves to cope with acute stress events and metabolic needs. Adipose tissue produces beneficial cytokines. Individuals with insulin-induced obesity have good metabolic characteristics. The interaction between these risks and benefits may lead to uncertainty regarding the correlation between BMI and vascular aging. Therefore, the association between obesity and vascular aging remains to be elucidated. Whether vascular aging is one of the decisive mechanisms of the obesity paradox remains to be confirmed in future multicenter prospective studies. In addition, we did not observe a significant correlation between dyslipidemia and poor blood glucose control with vascular aging. Our study participants were outpatients and inpatients with T2DM whose blood glucose and lipid levels were generally poorly controlled, which may have led to bias in the study results and did not represent whether there was a close relationship between blood glucose and lipid levels with EVA. Currently, as a widely used statistical tool in clinical practice, the nomogram can directly calculate and display the contribution of various variables to the results, which may help evaluate their importance and impact and can also be used for the prediction of many diseases in clinical practice (24). The nomogram is a graphical representation that assigns a score to each predictor based on its contribution to EVA risk. The scores for each predictor were summed to obtain a total score that could be used to estimate an individual's risk of developing EVA. In this study, we developed a nomogram-based risk prediction model for EVA in patients with T2DM. In our study, the results of the risk prediction model demonstrated that diabetic duration, HBP, smoking, DN and DR were important predictors for EVA in patients with T2DM. Nomograms were constructed based on these predictors. To validate the nomogram-based risk prediction model, the performance of the model was assessed using various statistical metrics, such as sensitivity, specificity, accuracy and ROC. The results showed that the nomogram-based risk prediction model achieved a high AUC of 0.73 for male and 0.74 for female. The sensitivity and specificity of the model were 62.33% and 73.74%, respectively, in males and 71.93% and 66.55%, respectively, in females. Therefore, nomograms with AUC greater than 0.7 have good predictive ability. There is no predictive model for EVA in T2DM patients in the past. This study is also the first to use the risk factors of EVA as a predictive index, which is presented through a simple-to-use nomogram and has a certain degree of accuracy. This can provide a more comprehensive clinical approach for the early detection and intervention of EVA in T2DM patients.
This study had some limitations. First, this was a single-center cross-sectional study, and a prospective study with a larger sample size should be conducted at multiple centers in the future. Second, we used an internal cohort for validation. In the future, external cohort validation may be used to better reveal the predictive ability of the nomogram model. Finally, to better reveal the risk factors for EVA in T2DM patients, we will include more T2DM participants with stable blood glucose levels to avoid bias caused by blood glucose and blood lipid levels. In addition, this was a retrospective study, and we included as many factors as possible that had already been obtained. We also supplemented the medication history and inflammatory indicators; however, there were no data on physical activity and dietary habits. In future studies, we will supplement relevant data and explore additional risk factors and markers to improve the predictive performance of the model.
5 Conclusion
In conclusion, this study found that the incidence of EVA in T2DM patients was 51.33%. In both men and women, the risk factors of EVA in patients with T2DM included age, duration, BMI, HBP, smoking, HbA1c, TC, TG, DN, and DR.
The nomogram-based risk prediction models exhibited good discriminative ability and calibration performance, indicating the reliability of estimating the risk of EVA in T2DM patients. These models provide clinicians with a reliable tool for identifying high-risk patients and implementing early interventions to reduce the burden of cardiovascular diseases.
Statements
Data availability statement
The data analyzed in this study is subject to the following licenses/restrictions: The datasets generated during this study are available from the corresponding author upon reasonable request. Requests to access these datasets should be directed to: zhaoxin2012@aliyun.com.
Ethics statement
The studies involving humans were approved by Ethics Committee of Peking University International Hospital. The studies were conducted in accordance with the local legislation and institutional requirements. The ethics committee/institutional review board waived the requirement of written informed consent for participation from the participants or the participants' legal guardians/next of kin because as the study involved retrospective analysis of clinical data, the requirement for written informed consent was waived.
Author contributions
XZhao: Conceptualization, Methodology, Writing – original draft. JS: Data curation, Writing – original draft. SX: Formal analysis, Writing – original draft. XZhan: Writing – review & editing.
Funding
The author(s) declare that no financial support was received for the research and/or publication of this article.
Conflict of interest
The authors declare that the research was conducted in the absence of any commercial or financial relationships that could be construed as a potential conflict of interest.
Generative AI statement
The author(s) declare that no Gen AI was used in the creation of this manuscript.
Any alternative text (alt text) provided alongside figures in this article has been generated by Frontiers with the support of artificial intelligence and reasonable efforts have been made to ensure accuracy, including review by the authors wherever possible. If you identify any issues, please contact us.
Publisher’s note
All claims expressed in this article are solely those of the authors and do not necessarily represent those of their affiliated organizations, or those of the publisher, the editors and the reviewers. Any product that may be evaluated in this article, or claim that may be made by its manufacturer, is not guaranteed or endorsed by the publisher.
Abbreviations
EVA, Early Vascular Aging; PWV, pulse wave velocity; VEC, vascular endothelial cells; VAFs, vascular adventitial fibroblasts; Ang II, angiotensin II; OGTT, oral glucose tolerance test; BMI, body mass index; SBP, systolic blood pressure; DBP, diastolic blood pressure; HBP, high blood pressure; FBG, fasting blood glucose; PBG, postprandial blood glucose; HbA1c, glycosylated hemoglobin; TC, total cholesterol; TG, triglyceride; LDL-C, low-density lipoprotein cholesterol; HDL-C, high-density lipoprotein cholesterol; AST, aspartate aminotransferase; ALT, alanine aminotransferase; ALB, albumin; UA, uric acid; eGFR, estimated glomerular filtration rate; ABI, ankle-brachial index; CIMT, carotid intima-media thickness; DN, diabetic nephropathy; DR, diabetic retinopathy; HPLC, high-performance liquid chromatography; ROC, receiver operating characteristic; AUC, area under the curve; ORs, odds ratios; T2DM, type 2 diabetes mellitus; AGEs, advanced glycation end products; NF-κ B, nuclear factor-κB; IL-6, interleukin-6; TNF-α, tumor necrosis factor-α; MCP-1, monocyte chemoattractant protein-1; ROS, reactive oxygen species; NO, nitric oxide; MMP-9, matrix metalloproteinase-9; TGF-β, transforming growth factor-β.
References
1.
Nilsson PM . Early vascular aging (EVA): consequences and prevention. Vasc Health Risk Manag. (2008) 547–52. 10.2147/VHRM.S1094
2.
Cunha PG Boutouyrie P Nilsson PM Laurent S . Early vascular ageing(EVA): definitions and clinical applicability. Curr Hypertens Rev. (2017) 13:8–15. 10.2174/1573402113666170413094319
3.
Lacolley P Regnault V Avolio AP . Smooth muscle cell and arterial aging: basic and clinical aspects. Cardiovasc Res. (2018) 114:513–28. 10.1093/cvr/cvy009
4.
Zhao X Zhang X Ran X Xu Z Ji L . Simple-to-use nomogram for evaluating the incident risk of moderate-to-severe LEAD in adults with type 2 diabetes: a cross-sectional study in a Chinese population. Sci Rep. (2020) 10:3182. 10.1038/s41598-019-55101-1
5.
Nilsson PM . Early vascular aging in hypertension. Front Cardiovasc Med. (2020) 7:6. 10.3389/fcvm.2020.00006
6.
Zhao X Sun J Xin S Zhang X . Predictive effects of FT3/FT4 on diabetic kidney disease: an exploratory study on hospitalized euthyroid patients with T2DM in China. Biomedicines. (2023) 11:2211. 10.3390/biomedicines11082211
7.
World Health Organization . Definition, Diagnosis and Classification of Diabetes Mellitus and its Complications. Report of a WHO Consultation. Part 1:Diagnosis and Classification of Diabetes Mellitus. Geneva, Switzerland: WHO (1999). p. 4–7.
8.
Ninomiya T Zoungas S Neal B Woodward M Patel A Perkovic V et al . Efficacy and safety of routine blood pressure lowering in older patients with diabetes: results from the ADVANCE trial. J Hypertens. (2010) 28:1141–9. 10.1097/HJH.0b013e328338a89c
9.
Maloberti A Meani P Varrenti M Giupponi L Stucchi M Vallerio P et al . Structural and functional abnormalities of carotid artery and their relation with EVA phenomenon. High Blood Press Cardiovasc Prev. (2015) 22:373–9. 10.1007/s40292-015-0100-9
10.
Zhao X Yu X Xin S Zhang W Zhang X Ji L . Correlation between OSAHS and early peripheral atherosclerosis indices in patients with type 2 diabetes mellitus in China: a cross-sectional inpatient study. J Diabetes Res. (2021) 2021:6630020. 10.1155/2021/6630020
11.
Liu S Liu JJ Gurung RL Chan C Yeo D Ang K et al . Clinical determinants of diabetes progression in multiethnic Asians with type 2 diabetes-a 3-year prospective cohort study. Ann Acad Med Singap. (2019) 48:217–23. 10.47102/annals-acadmedsg.V48N7p217
12.
Penlioglou T Stoian AP Papans N . Diabetes, vascular aging and stroke: old dogs, new tricks?J Clin Med. (2021) 10:4620. 10.3390/jcm10194620
13.
Ryder JR Northrop E Rudser KD Kelly AS Gao Z Khoury PR et al . Accelerated early vascular aging among adolescents with obesity and/or type 2 diabetes mellitus. J Am Heart Assoc. (2020) 9:e014891. 10.1161/JAHA.119.014891
14.
Poznyak A Grechko AV Poggio P Myasoedova VA Alfieri V Orekhov AN . The diabetes mellitus -atherosclerosis connection:the role of lipid and glucose metabolism and chronic inflammation. Int J Mol Sci. (2020) 21:1835. 10.3390/ijms21051835
15.
Bhardwaj R Singh BP Sandhu N Singh N Kaur R Rokana N et al . Probiotic mediated NF-κB regulation for prospective management of type 2 diabetes. Mol Biol Rep. (2020) 47:2301–13. 10.1007/s11033-020-05254-4
16.
Yin Y Zhou Z Liu W Chang Q Sun G Dai Y . Vascular endothelial cells senescence is associated with NOD -like receptor family pyrin domain-containing 3(NLRP3) inflammasome activation via reactive oxygen species (ROS)/thioredoxin -interacting protein (TXNIP) pathway. Int J Biochem Cell Biol. (2017) 84:22–34. 10.1016/j.biocel.2017.01.001
17.
Aki T Unuma K Noritake K Hirayama N Funakoshi T Uemura K . Formation of high molecular weight p62 by CORM-3. PLoS ONE. (2019) 14:e0210474. 10.1371/journal.pone.0210474
18.
Phadwal K Feng D Zhu D MacRae VE . Autophagy as a novel therapeutic target in vascular calcification. Pharmacol Ther. (2020) 206:107430. 10.1016/j.pharmthera.2019.107430
19.
Wang X Khalil RA . Matrix metalloproteinases, vascular remodeling, and vascular disease. Adv Pharmacol. (2018) 81:241–330. 10.1016/bs.apha.2017.08.002
20.
Nativel M Potier L Alexandre L Baillet-Blanco L Ducasse E Velho G et al . Lower extremity arterial disease in patients with diabetes: a contemporary narrative review. Cardiovasc Diabetol. (2018) 17:138. 10.1186/s12933-018-0781-1
21.
Kramer CK Rodrigues TC Canani LH Gross JL Azevedo MJ . Diabetic retinopathy predicts all-cause mortality and cardiovascular events in both type 1 and 2 diabetes: meta-analysis of observational studies. Diabetes Care. (2011) 34:1238–44. 10.2337/dc11-0079
22.
Gerstein HC Ambrosius WT Danis R Ismail-Beigi F Cushman W Calles J et al . Diabetic retinopathy, its progression, and incident cardiovascular events in the ACCORD trial. Diabetes Care. (2013) 36:1266–71. 10.2337/dc12-1311
23.
Tang J Li T Li P Ma Y Liu M Shan Q et al . Early assessment of the risk factors for diabetic retinopathy can reduce the risk of peripheral arterial and cardiovascular diseases in type 2 diabetes. Ophthalmic Res. (2018) 59:221–7. 10.1159/000479931
24.
Roy S Tonkiss J Roy S . Aging increases retinal vascular lesions characteristic of early diabetic retinopathy. Biogerontology. (2010) 11:447–55. 10.1007/s10522-010-9263-x
25.
Baier D Teren A Wirkner K Loeffler M Scholz M . Parameters of pulse wave velocity: determinants and reference values assessed in the population-based study LIFE-Adult. Clin Res Cardiol. (2018) 107:1050–61. 10.1007/s00392-018-1278-3
26.
Tang B Luo F Zhao J Ma J Tan I Butlin M et al . Relationship between body mass index and arterial stiffness in a health assessment Chinese population. Medicine. (2020) 99:e18793. 10.1097/MD.0000000000018793
27.
Huang J Chen Z Yuan J Zhang C Chen H Wu W et al . Association between body mass index (BMI) and Brachial-Ankle Pulse Wave Velocity (baPWV) in males with hypertension: a community-based cross-section study in North China. Med Sci Monit Int Med J Exp Clin Res. (2019) 25:5241–57. 10.12659/MSM.914881
Summary
Keywords
type 2 diabetes mellitus, early vascular aging, nomograms, pulse wave velocity, receiver operating characteristic
Citation
Zhao X, Sun J, Xin S and Zhang X (2025) Risk prediction model of early vascular aging based on nomogram in patients with type 2 diabetes mellitus: a cross-sectional study in a Chinese population. Front. Med. 12:1541259. doi: 10.3389/fmed.2025.1541259
Received
17 February 2025
Accepted
29 August 2025
Published
30 September 2025
Volume
12 - 2025
Edited by
Tlili Barhoumi, King Abdullah International Medical Research Center (KAIMRC), Saudi Arabia
Reviewed by
Alexander E. Berezin, Paracelsus Medical University, Austria
Bo Jiang, Rice University, United States
Saurabh Mishra, Cleveland Clinic, United States
Haskly Mokoena, University of Limpopo, South Africa
Updates
Copyright
© 2025 Zhao, Sun, Xin and Zhang.
This is an open-access article distributed under the terms of the Creative Commons Attribution License (CC BY). The use, distribution or reproduction in other forums is permitted, provided the original author(s) and the copyright owner(s) are credited and that the original publication in this journal is cited, in accordance with accepted academic practice. No use, distribution or reproduction is permitted which does not comply with these terms.
*Correspondence: Xiaomei Zhang z.x.mei@163.com
Disclaimer
All claims expressed in this article are solely those of the authors and do not necessarily represent those of their affiliated organizations, or those of the publisher, the editors and the reviewers. Any product that may be evaluated in this article or claim that may be made by its manufacturer is not guaranteed or endorsed by the publisher.