 Shiran Cai
 Liqun Lin
 Yanyan Cai
 Chenhao Wang2
 Yufen Lin
 Jingping Zhou
 Fei Zhou
 Meiya Chen
- 1Department of Gastroenterology, The National Key Clinical Specialty, Zhongshan Hospital of Xiamen University, School of Medicine, Xiamen University, Xiamen, Fujian, China
- 2The Graduate School of Fujian Medical University, Fuzhou, China
- 3Department of Gastroenterology, The Second Afliated Hospital of Fujian Medical Uiversity, Quanzhou, Fujian, China
- 4Department of Clinical Nutrition, Zhongshan Hospital of Xiamen University, School of Medicine, Xiamen University, Xiamen, Fujian, China
- 5Department of Oncology, Cancer Hospital, Fudan University (Xiamen Branch), Xiamen, Fujian, China
- 6Institute for Microbial Ecology, School of Medicine, Xiamen University, Xiamen, Fujian, China
- 7Department of Digestive Disease, School of Medicine, Xiamen University, Xiamen, Fujian, China
- 8Xiamen Key Laboratory of Intestinal Microbiome and Human Health, Zhongshan Hospital of Xiamen University, School of Medicine, Xiamen University, Xiamen, Fujian, China
Background: Acute-on-chronic liver failure is characterized by acute hepatic decompensation and high short-term mortality, thereby necessitating prompt prognostic assessment. Although phase angle (PhA) has been established as a biomarker in chronic diseases, its prognostic significance in ACLF remains unclear.
Methods: In this study, we evaluated PhA in 78 ACLF patients and compared the results with those of two control groups: 45 patients with chronic hepatitis B infection but normal liver function, and 51 patients with abnormal liver function who did not meet the ACLF criteria. Upon hospital admission, comprehensive laboratory parameters were obtained, and PhA measurements were conducted to explore the associations among PhA, organ dysfunction indices, and established prognostic scoring systems for predicting 90-days outcomes in ACLF patients.
Results: Our analysis demonstrated that ACLF patients exhibited significantly lower PhA values compared with both control groups. Notably, non-survivors within 90 days had substantially lower PhA levels than survivors. Additionally, patients with complications, including hepatic encephalopathy, ascites, gastrointestinal bleeding, and infection, showed markedly lower PhA values than those without such complications. Moreover, the combination of PhA with the Chronic Liver Failure - Sequential Organ Failure Assessment (CLIF-SOFA) score enhanced the predictive accuracy of 90-days mortality in ACLF patients.
Conclusion: Phase angle serves as a valuable biomarker for evaluating ACLF severity and predicting short-term mortality, potentially offering a novel approach to risk stratification in ACLF management.
Introduction
Chronic liver diseases may induce systemic inflammation through multiple pathways, including pathogen invasion and tissue injury. This inflammatory cascade can precipitate acute-on-chronic liver failure (ACLF), a critical syndrome defined by rapid hepatic decompensation and progressive extrahepatic organ failure. ACLF accounts for the majority of liver-related mortality in patients with chronic hepatitis, cirrhosis, and hepatocellular carcinoma (1, 2). Despite its potentially reversible nature, ACLF carries high short-term mortality due to the frequent development of multiorgan dysfunction (3, 4). The initial 7-days period post-onset (termed the “golden window”) (5) represents a pivotal therapeutic opportunity for early diagnosis and intervention to modify disease progression. Timely evaluation of inflammatory status is therefore paramount for prognostic improvement in ACLF.
The phase angle (PhA), derived non-invasively through bioelectrical impedance analysis, correlates with early-phase inflammation and oxidative stress. PhA values exhibit an inverse relationship with the severity of these pathological processes (6). As a composite marker reflecting cellular integrity, membrane stability, and hydration status (7), reduced PhA indicates compromised cellular structure and increased apoptosis (7, 8). Existing evidence demonstrates PhA alterations across various chronic conditions (9–11), yet its clinical significance in ACLF remains undetermined. This study was designed to systematically evaluate the association between PhA and ACLF severity, with particular focus on its potential prognostic utility.
Materials and methods
Study participants
This retrospective study collected data from ACLF patients who were hospitalized at our institution from December 1, 2020 to March 1, 2023. The study was approved by the Medical Ethics Committee of Zhongshan Hospital affiliated with Xiamen University (approval number: 2023 - 145). Before initiating any research procedures, we obtained written informed consent from all subjects and their guardians. All methods were executed in strict compliance with the relevant guidelines and regulations.
The inclusion criteria were based on the 2019 diagnostic criteria for ACLF established by the Asia-Pacific Association for the Study of the Liver (APASL) (5). These criteria included patients with chronic hepatic diseases, encompassing those with hepatitis without cirrhosis, those with cirrhosis, and those with primary liver cancer. Additionally, the criteria required serum bilirubin levels ≥ 5 mg/dL, an international normalized ratio (INR) ≥ 1.5, prothrombin activity (PTA) ≤ 40%, and complications such as infection, ascites, and hepatic encephalopathy (HE). Patients with pacemakers, amputations, aneurysm clips, or metal implants were excluded due to potential interference with bioelectrical impedance analysis results. The control group comprised 96 patients: 45 in Control Group 1 had chronic liver disease with normal liver function, and 51 in Control Group 2 had abnormal liver function but did not meet the criteria for liver failure.
Data collection
Clinical and demographic data, including age, sex, body mass index (BMI), etiology, complications, laboratory parameters, and prognostic scores, were collected. Ascites was assessed and graded by ultrasound. Hepatic encephalopathy was diagnosed according to neuropsychiatric symptoms, blood markers, and neurological signs.
Bioelectrical impedance analysis
Phase angle was measured using the InBody S10 body composition analyzer and calculated using the formula PhA (°) = arctan (Xc/R) × (180°/π), where Xc is reactance and R is resistance at 50 kHz bioelectrical impedance analysis (BIA). Before measurement, participants were required to fast for ≥ 2 h, refrain from vigorous physical activity and intravenous infusion, and completely empty their bladder and bowels. They rested in a supine position for ≥ 10 min before testing.
For the measurement procedure, subjects assumed a supine position with full exposure of the skin on both hands and ankles. The feet were positioned 10–15 cm apart, and the hands were placed palm-up alongside the body with fingers extended and arms abducted at 15°. The skin at electrode contact sites was cleaned with alcohol swabs. Four electrodes were placed on the distal metacarpals (left/right hands) and metatarsals (left/right ankles). During measurement, subjects were instructed to avoid contact with any extraneous metal objects.
Statistical analysis
Continuous variables following a normal distribution were expressed as mean ± standard deviation, while non-normally distributed continuous variables were reported as medians (interquartile ranges). Continuous variables were compared between two groups using either Student’s t-test or the Mann-Whitney U test, as appropriate. For continuous variables involving two or more groups, comparisons were performed using either one-way analysis of variance (ANOVA) or the Kruskal-Wallis test, as appropriate. Categorical data were analyzed using either the χ2 test or Fisher’s exact test. Correlations between variables were assessed using Pearson’s or Spearman’s correlation analysis, depending on data distribution. The optimal cutoff value for predicting 90-days mortality was determined through receiver operating characteristic (ROC) curve analysis, with an area under the curve (AUC) > 0.5 considered indicative of diagnostic value. Statistical significance was set at P < 0.05. All analyses were performed using SPSS 26.0 (SPSS Inc., Chicago, Illinois, USA) and GraphPad Prism (version 8.0.2).
Results
Patient characteristics
The study included 78 patients with ACLF, including 58 males (74.36%). Control group 1 consisted of 45 patients (30 males, 66.67%), while control group 2 comprised 51 patients (40 males, 78.43%). The groups had comparable sex and age distributions. Ascites severity, assessed by ultrasonography, was graded as: Grade 1 (mild) - detectable only by ultrasound with maximal fluid depth < 3 cm; Grade 2 (moderate) – 3–10 cm of intraperitoneal fluid; and Grade 3 (severe) - fluid collections > 10 cm deep. Clinical indicators, complications, prognostic scores, and PhA were compared between groups (Table 1). The ACLF group showed lower PhA values [4.55° (3.70°–5.45°)] compared to control group 1 [5.90° (5.50°–6.30°); P < 0.001] and control group 2 [5.30° (4.60°–6.00°); P < 0.001].
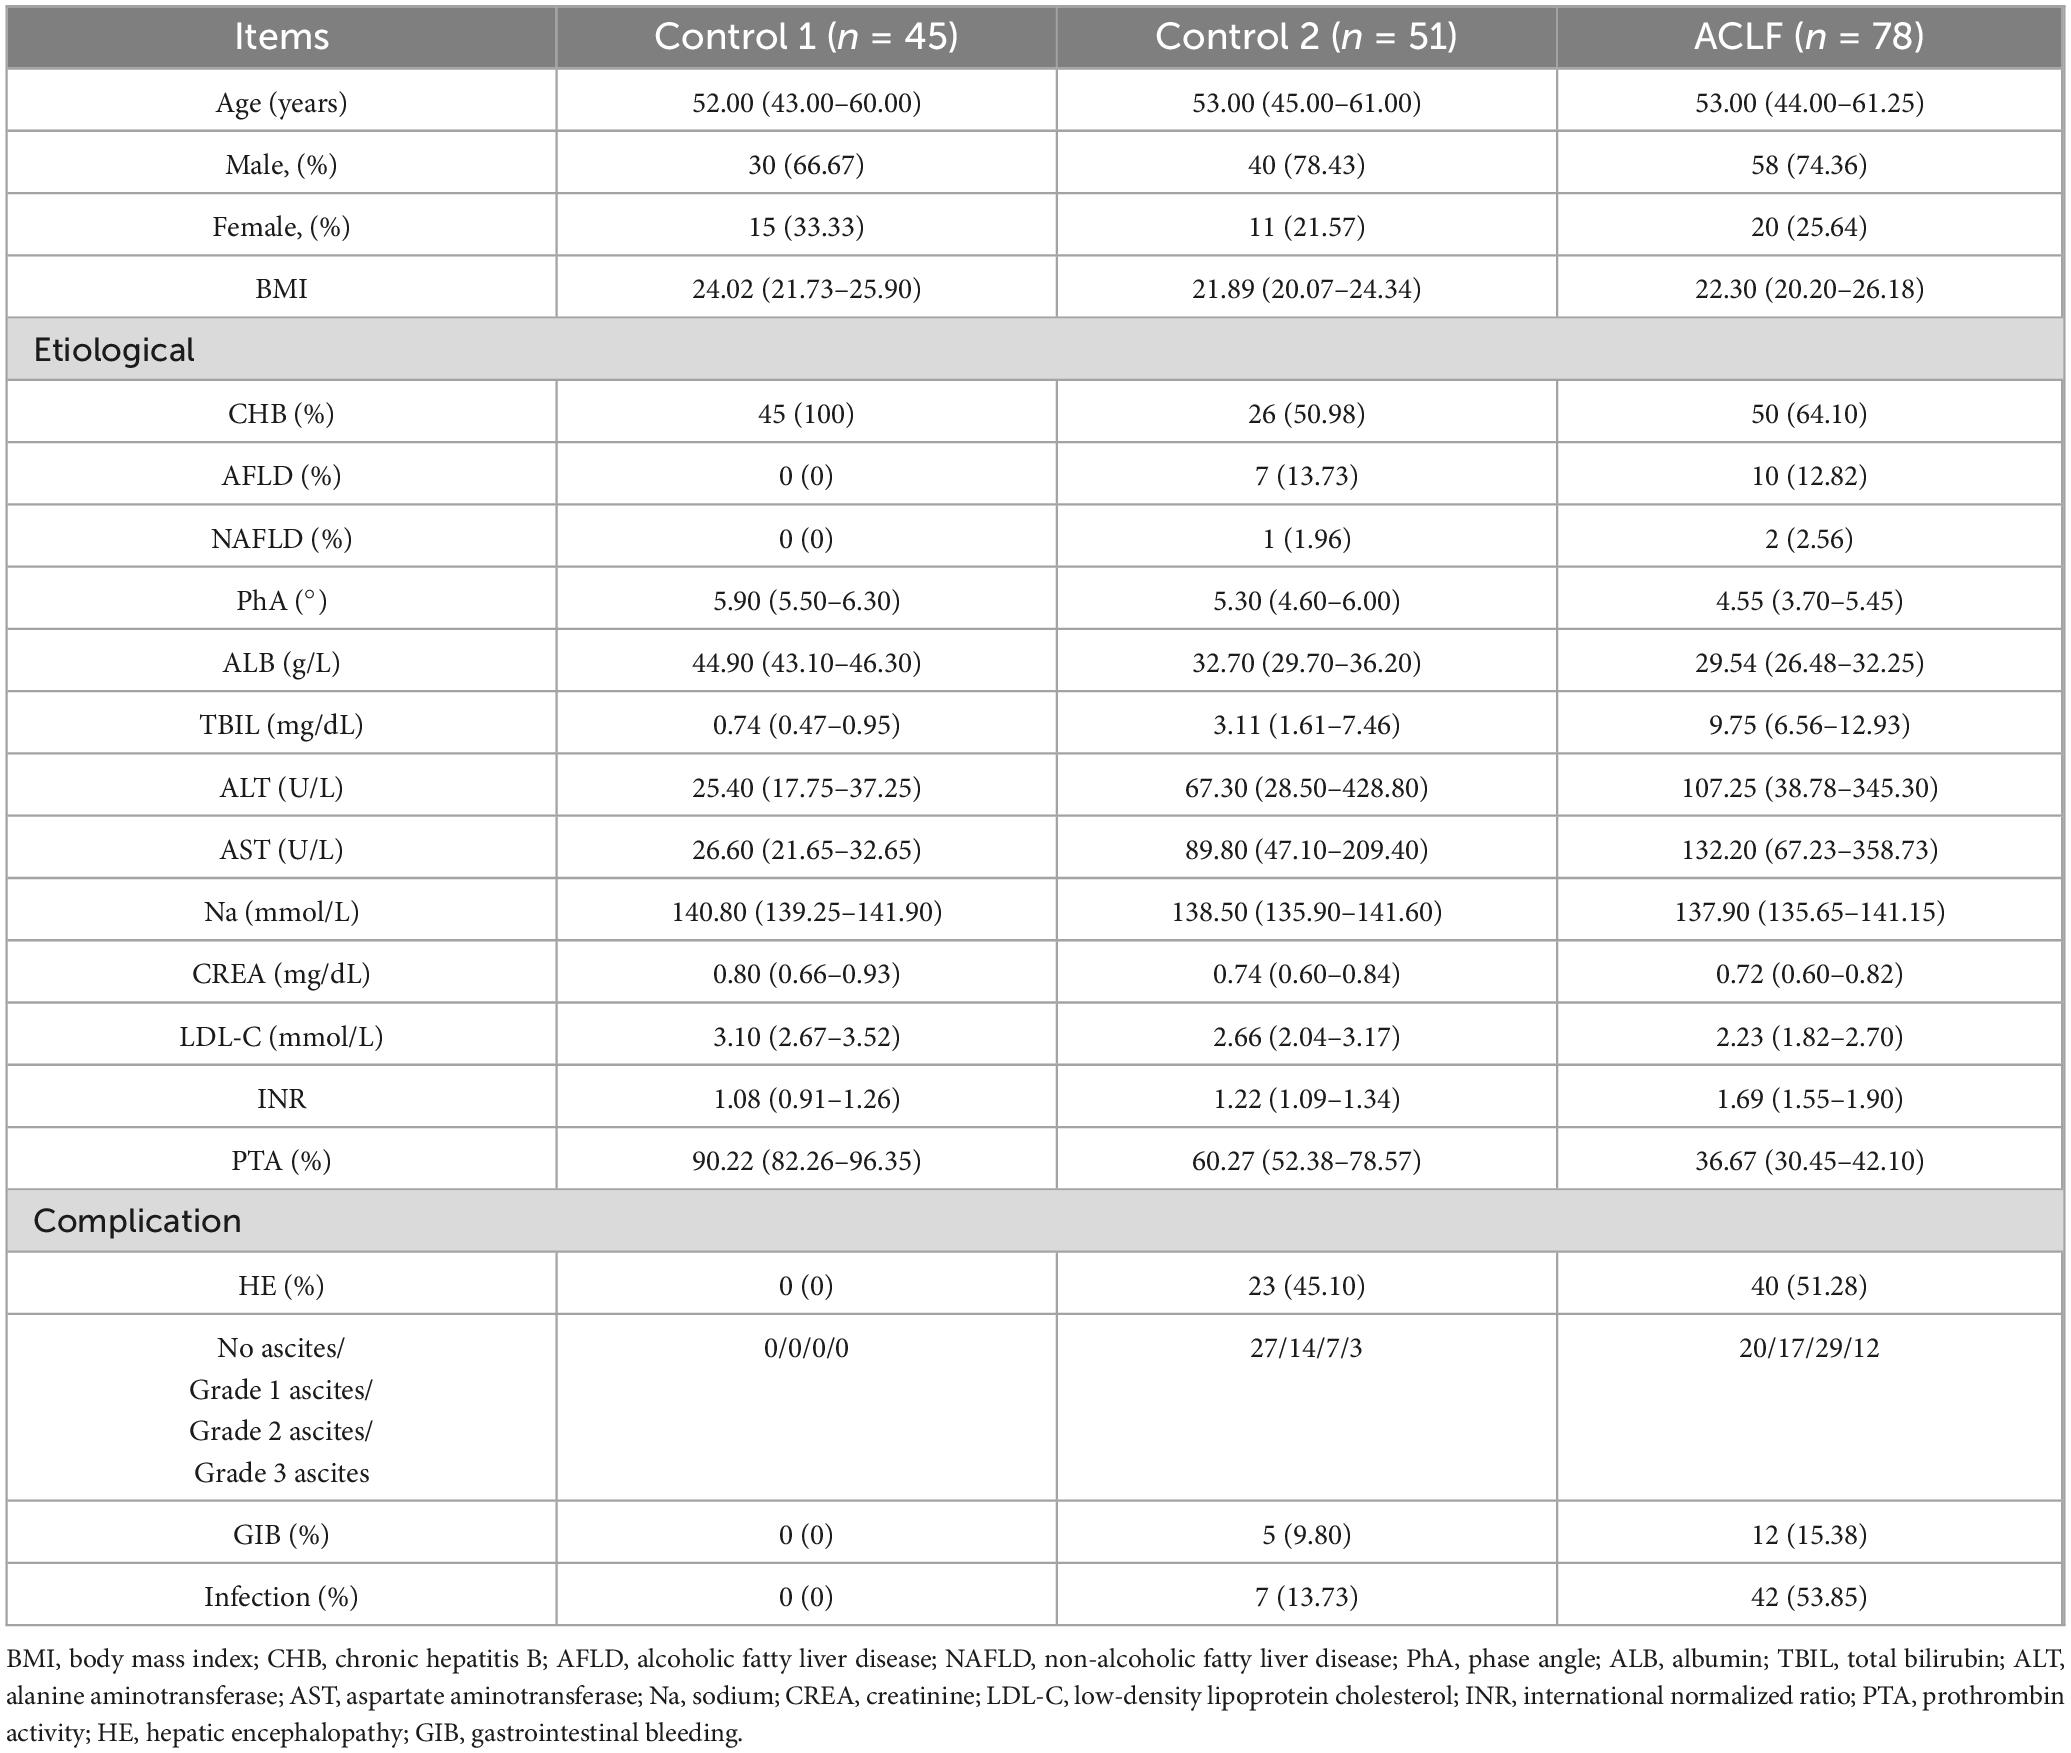
Table 1. Physical characteristics and biochemical measurements of Acute-on-chronic liver failure (ACLF) patients and the controls.
Correlation analysis between ACLF severity and PhA
Initial analysis revealed significant differences in PhA values among ACLF subtypes. Patients with cirrhotic ACLF exhibited lower PhA values than non-cirrhotic cases, while those with decompensated cirrhosis showed reduced PhA compared to compensated cirrhosis (Figure 1a; P < 0.001).
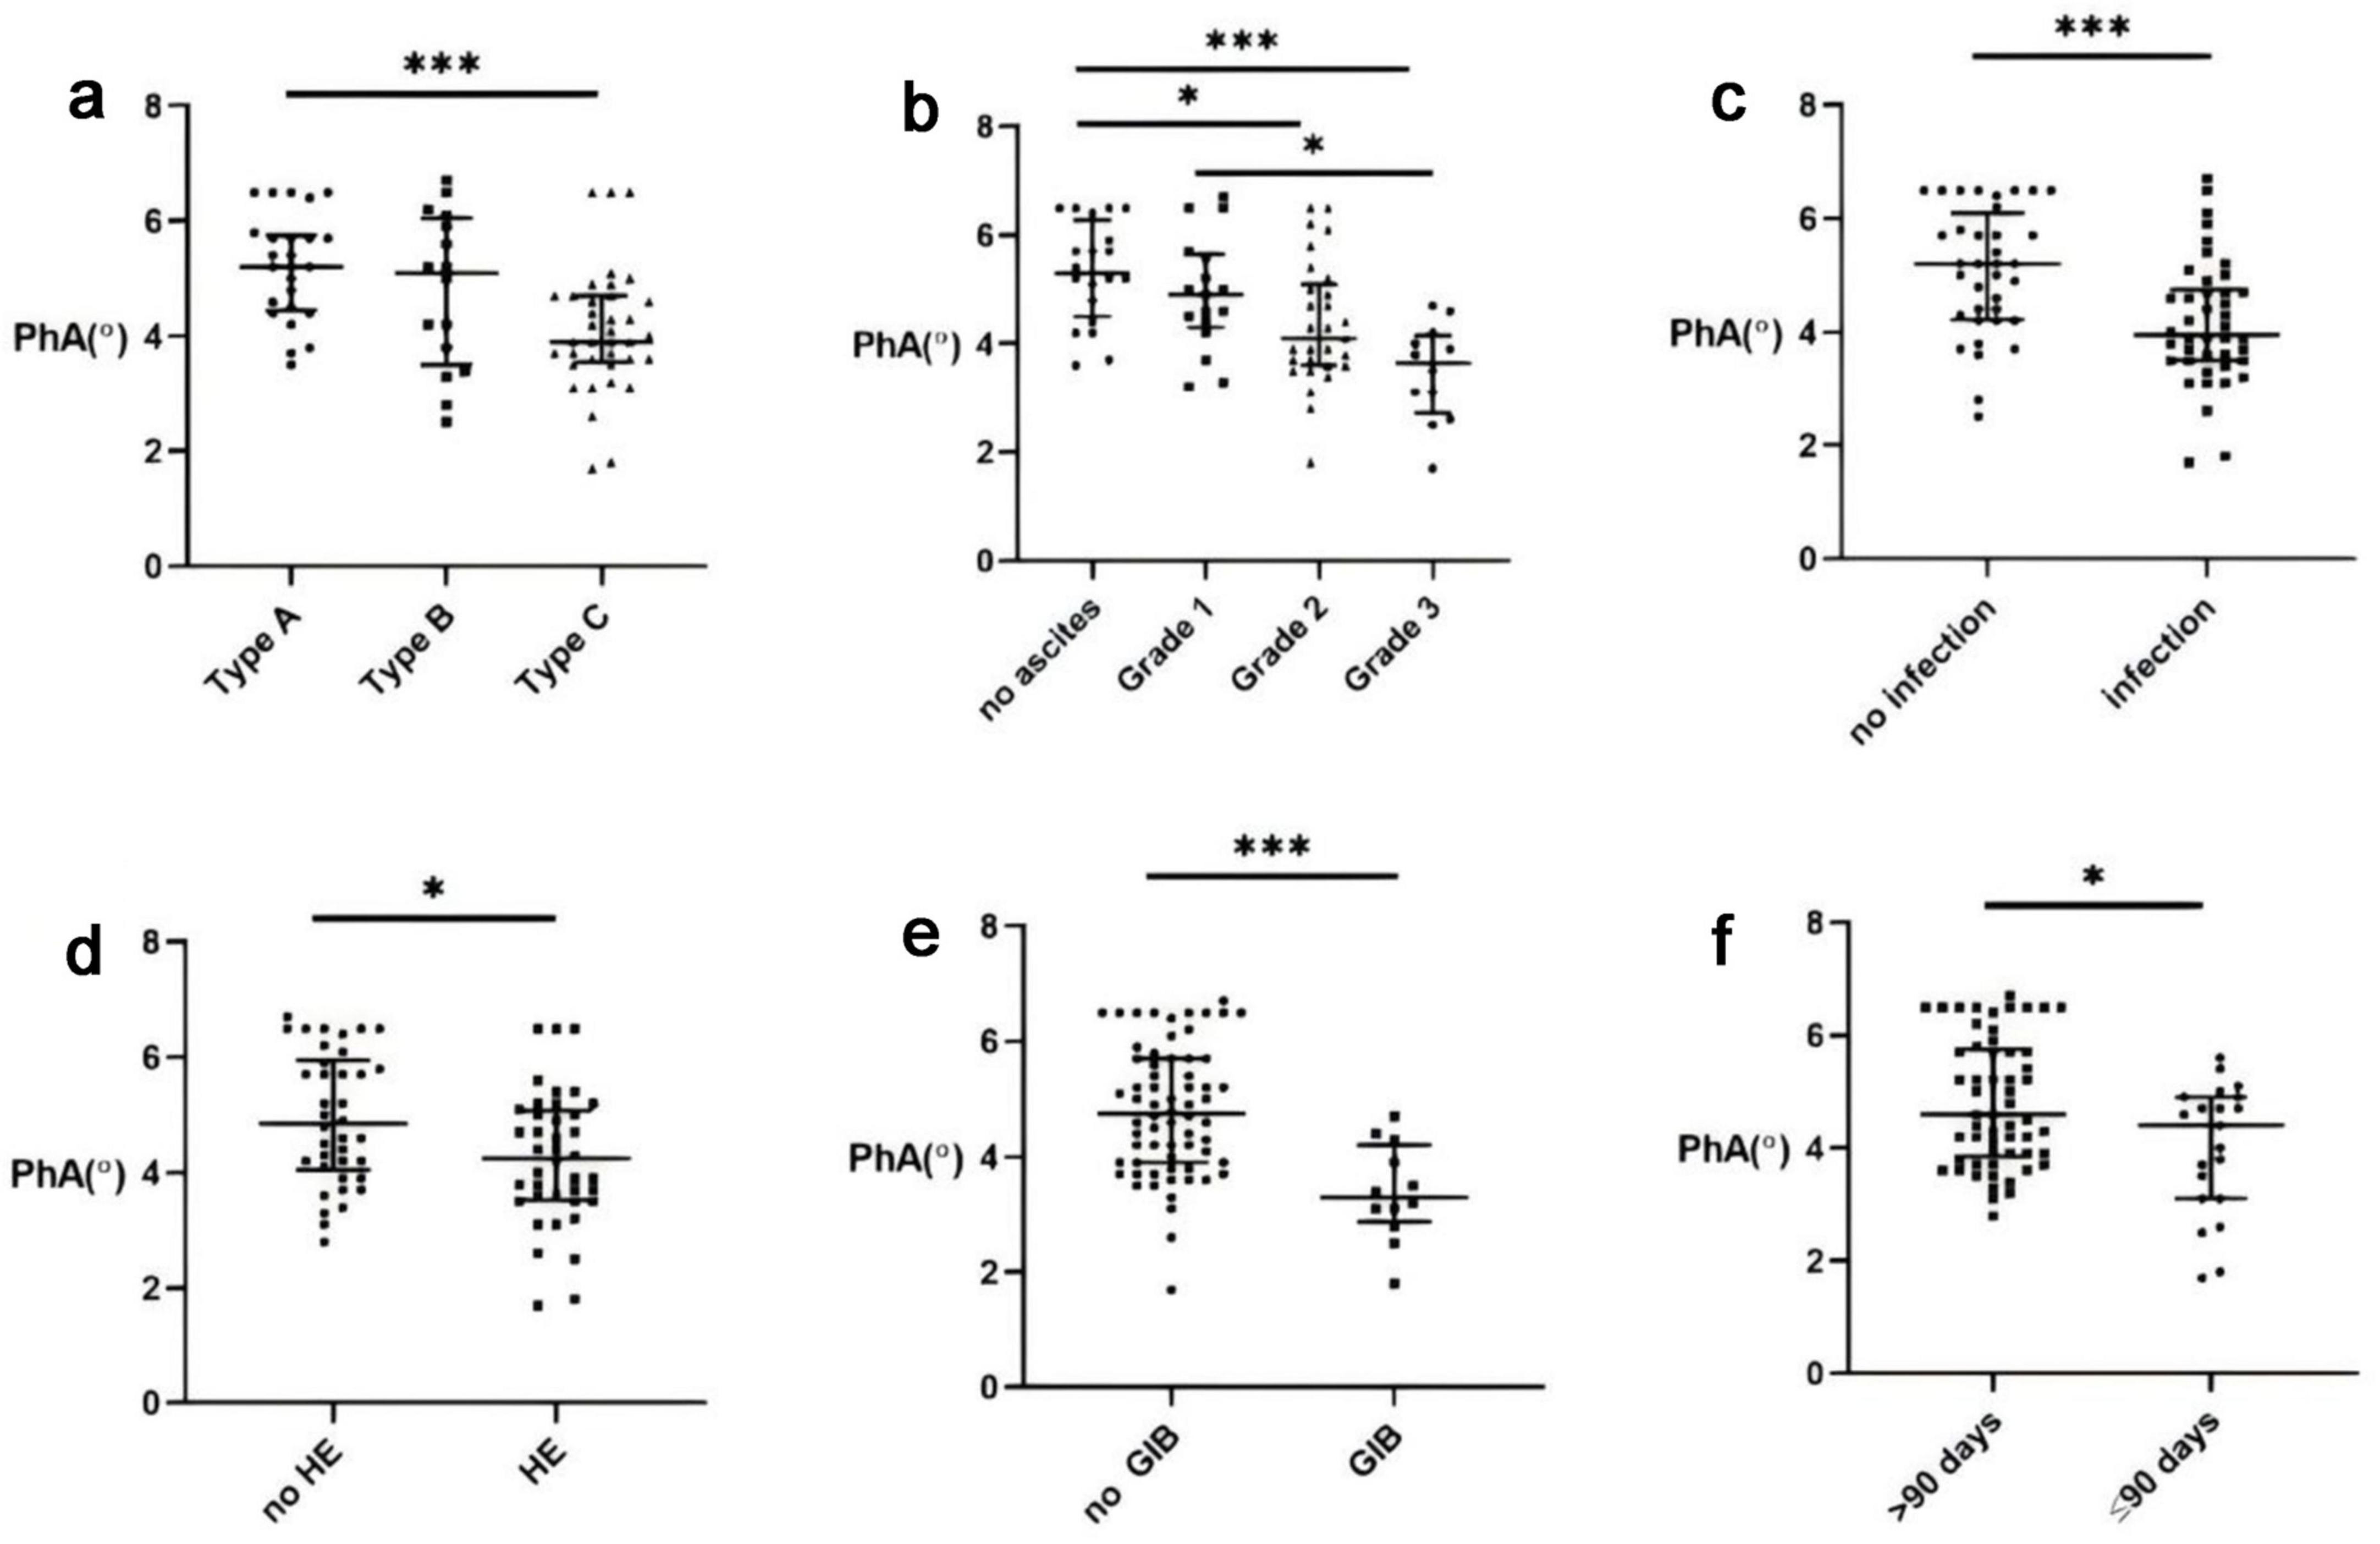
Figure 1. Correlation between Phase angle (PhA) and Acute-on-chronic liver failure (ACLF). (a) PhA levels in different types of ACLF. (b) ACLF PhA levels and ascites. (c) ACLF PhA levels and infection. (d) ACLF PhA levels and hepatic encephalopathy (HE). (e) ACLF PhA levels and gastrointestinal bleeding (GIB). (f) ACLF PhA levels and the 90-days survival rate.*, P < 0.05; ***, P < 0.001.
Acute-on-chronic liver failure severity demonstrated an inverse relationship with PhA, with advanced stages showing progressively lower values. The presence of complications - including infection, hepatic encephalopathy, or gastrointestinal bleeding generally exhibited reduced PhA levels (Figures 1c–e; P < 0.05). Similarly, patients with ascites had markedly lower PhA than those without, with values declining corresponding to ascites severity (Figure 1b; P < 0.001).
Correlation analysis revealed negative associations between PhA and the prognostic scores: Child-Pugh (r = −0.449, P < 0.001; Figure 2a), Improved Model for End-Stage Liver Disease (iMELD) (r = −0.279, P = 0.013; Figure 2b), Chronic Liver Failure - Sequential Organ Failure Assessment (CLIF-SOFA) (r = −0.269, P = 0.017; Figure 2c), and Chronic Liver Failure Consortium Acute - on - Chronic Liver Failure Score (CLIF-C ACLF) scores (r = −0.336, P = 0.003; Figure 2d).
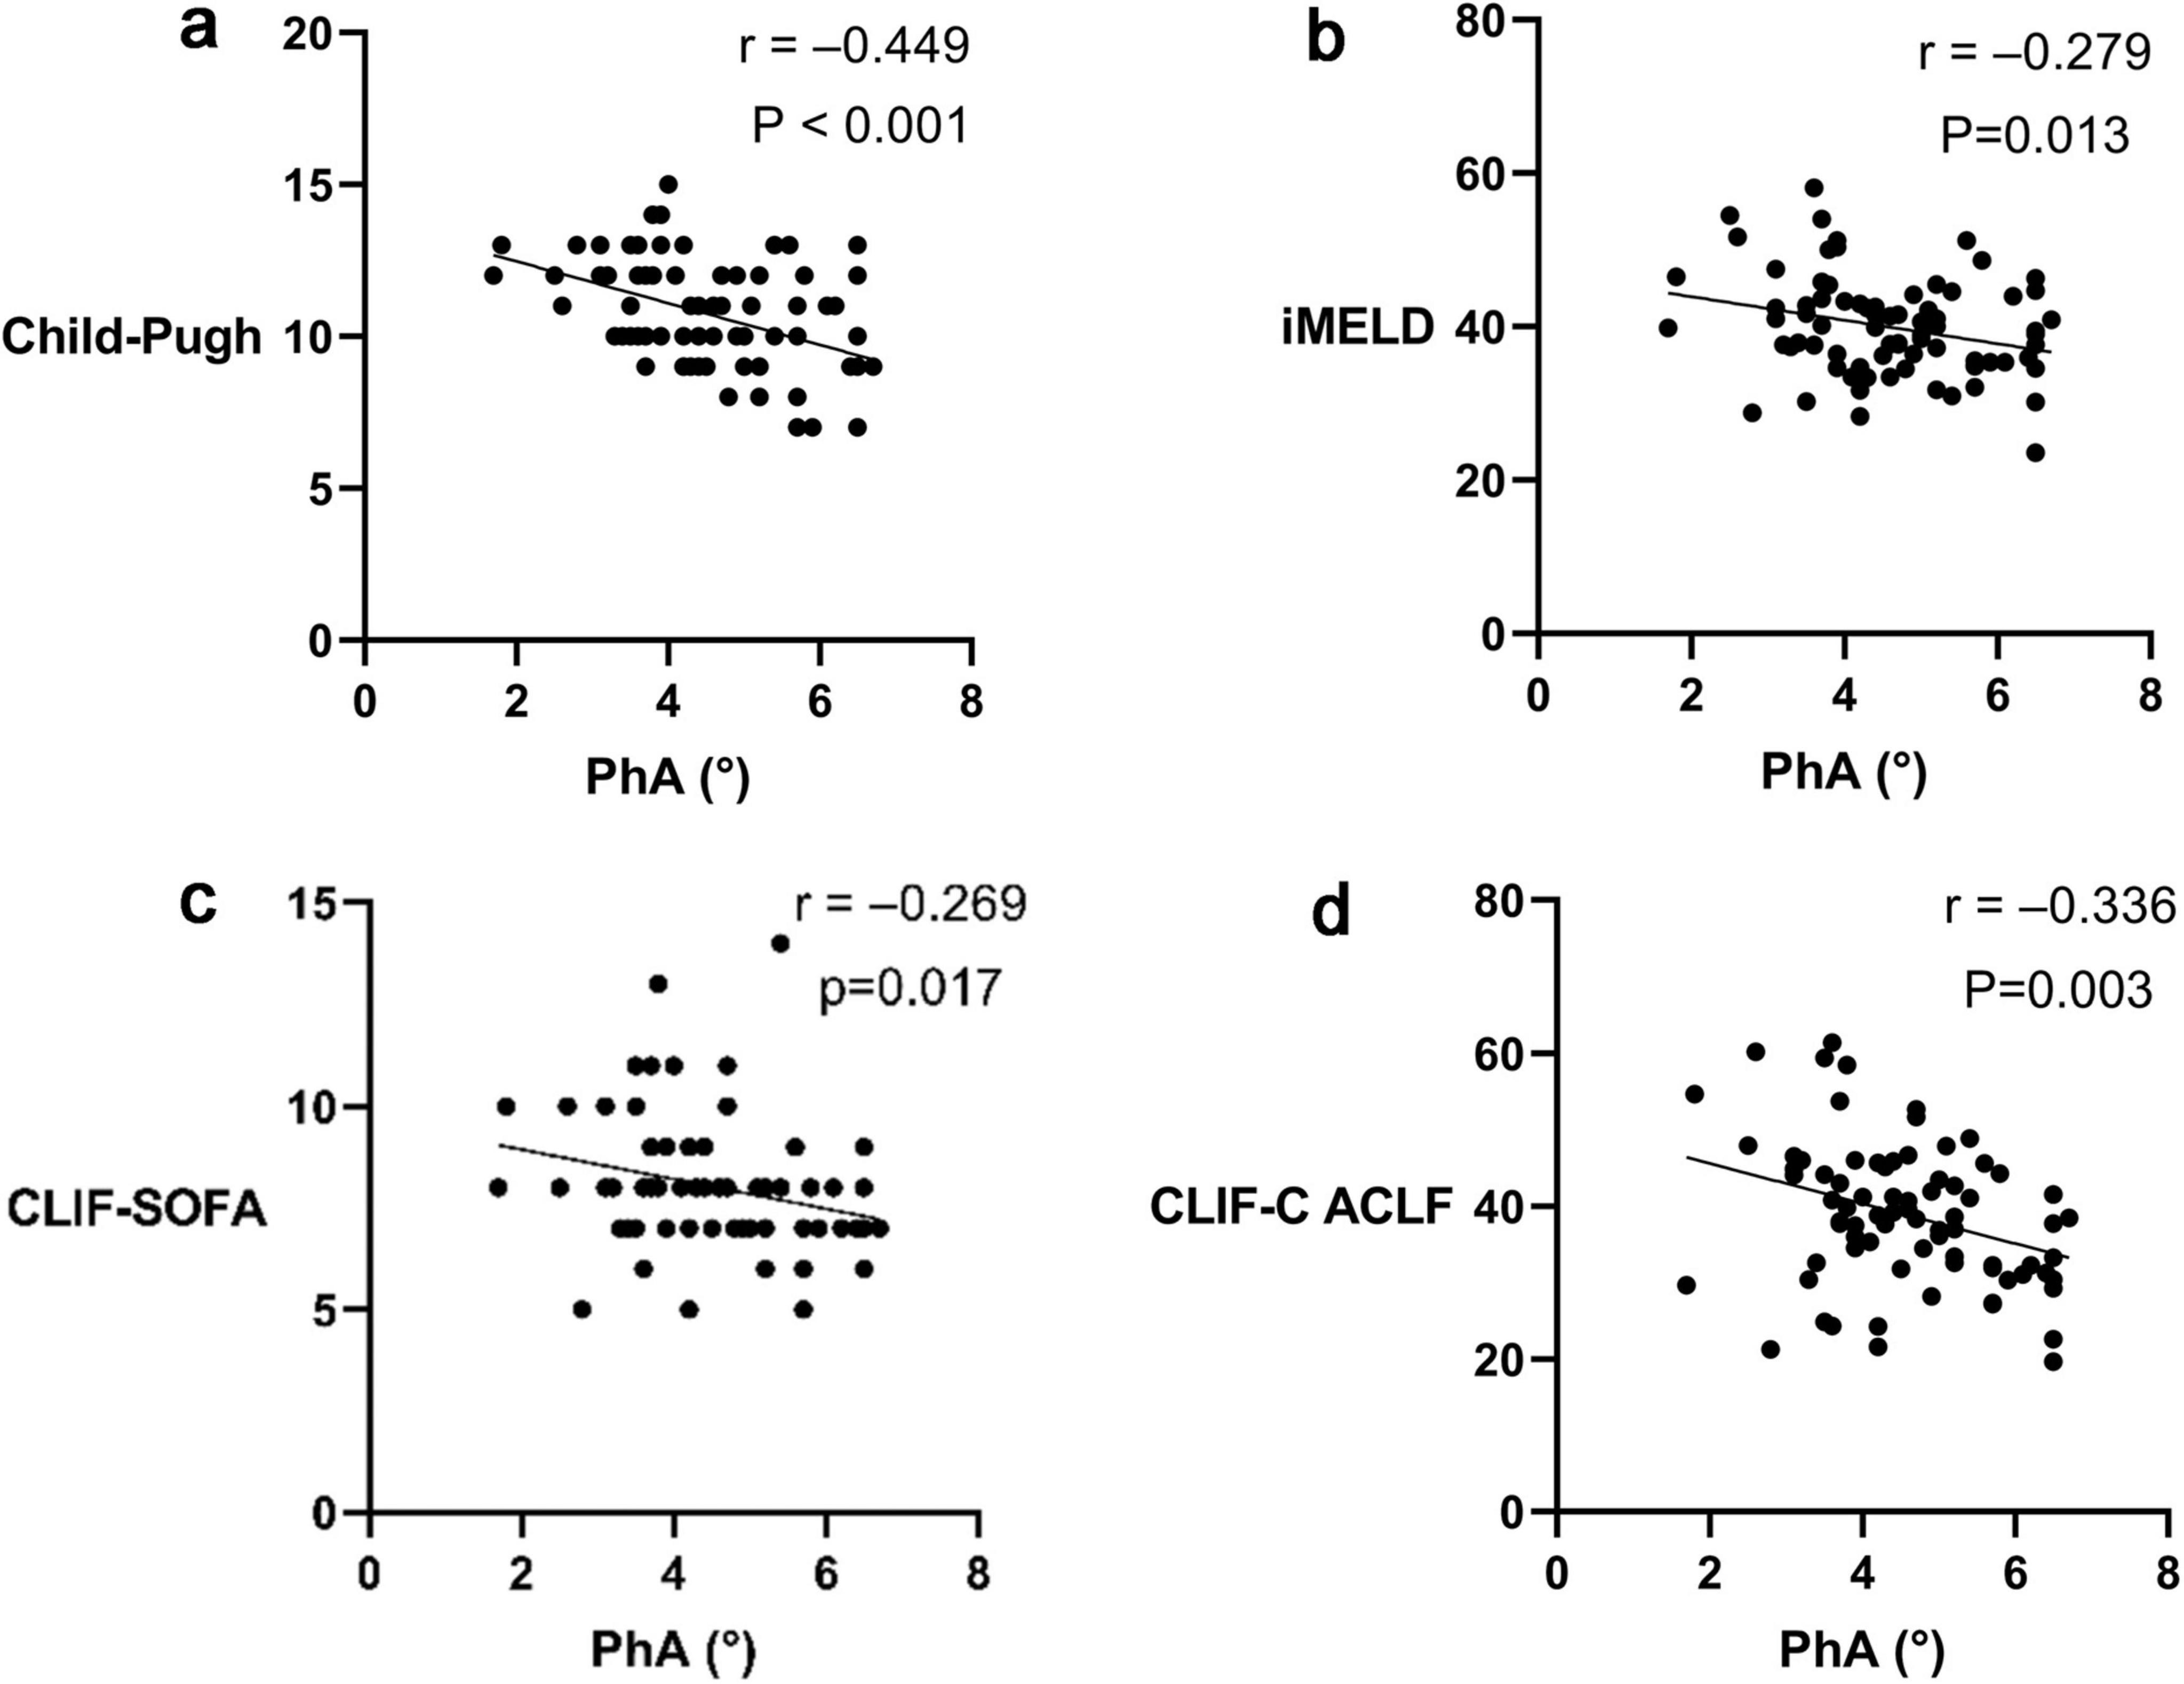
Figure 2. Correlation between Phase angle (PhA) and prognostic scores of Acute-on-chronic liver failure (ACLF). (a) Correlation between PhA and the Child-Pugh score. (b) Correlation between PhA and the Improved Model for End-Stage Liver Disease (iMELD) score. (c) Correlation between PhA and the Chronic Liver Failure - Sequential Organ Failure Assessment (CLIF-SOFA) score. (d) Correlation between PhA and the Chronic Liver Failure Consortium Acute - on - Chronic Liver Failure Score (CLIF-C ACLF) score.
Comparison between ACLF survivors and non-survivors
Patients with ACLF were stratified by 90-days survival into survivors (n = 57) and non-survivors (n = 21). No significant differences were observed in sex ratio, mean age, BMI, or the number of hepatocellular carcinoma cases between the two groups (Table 2).
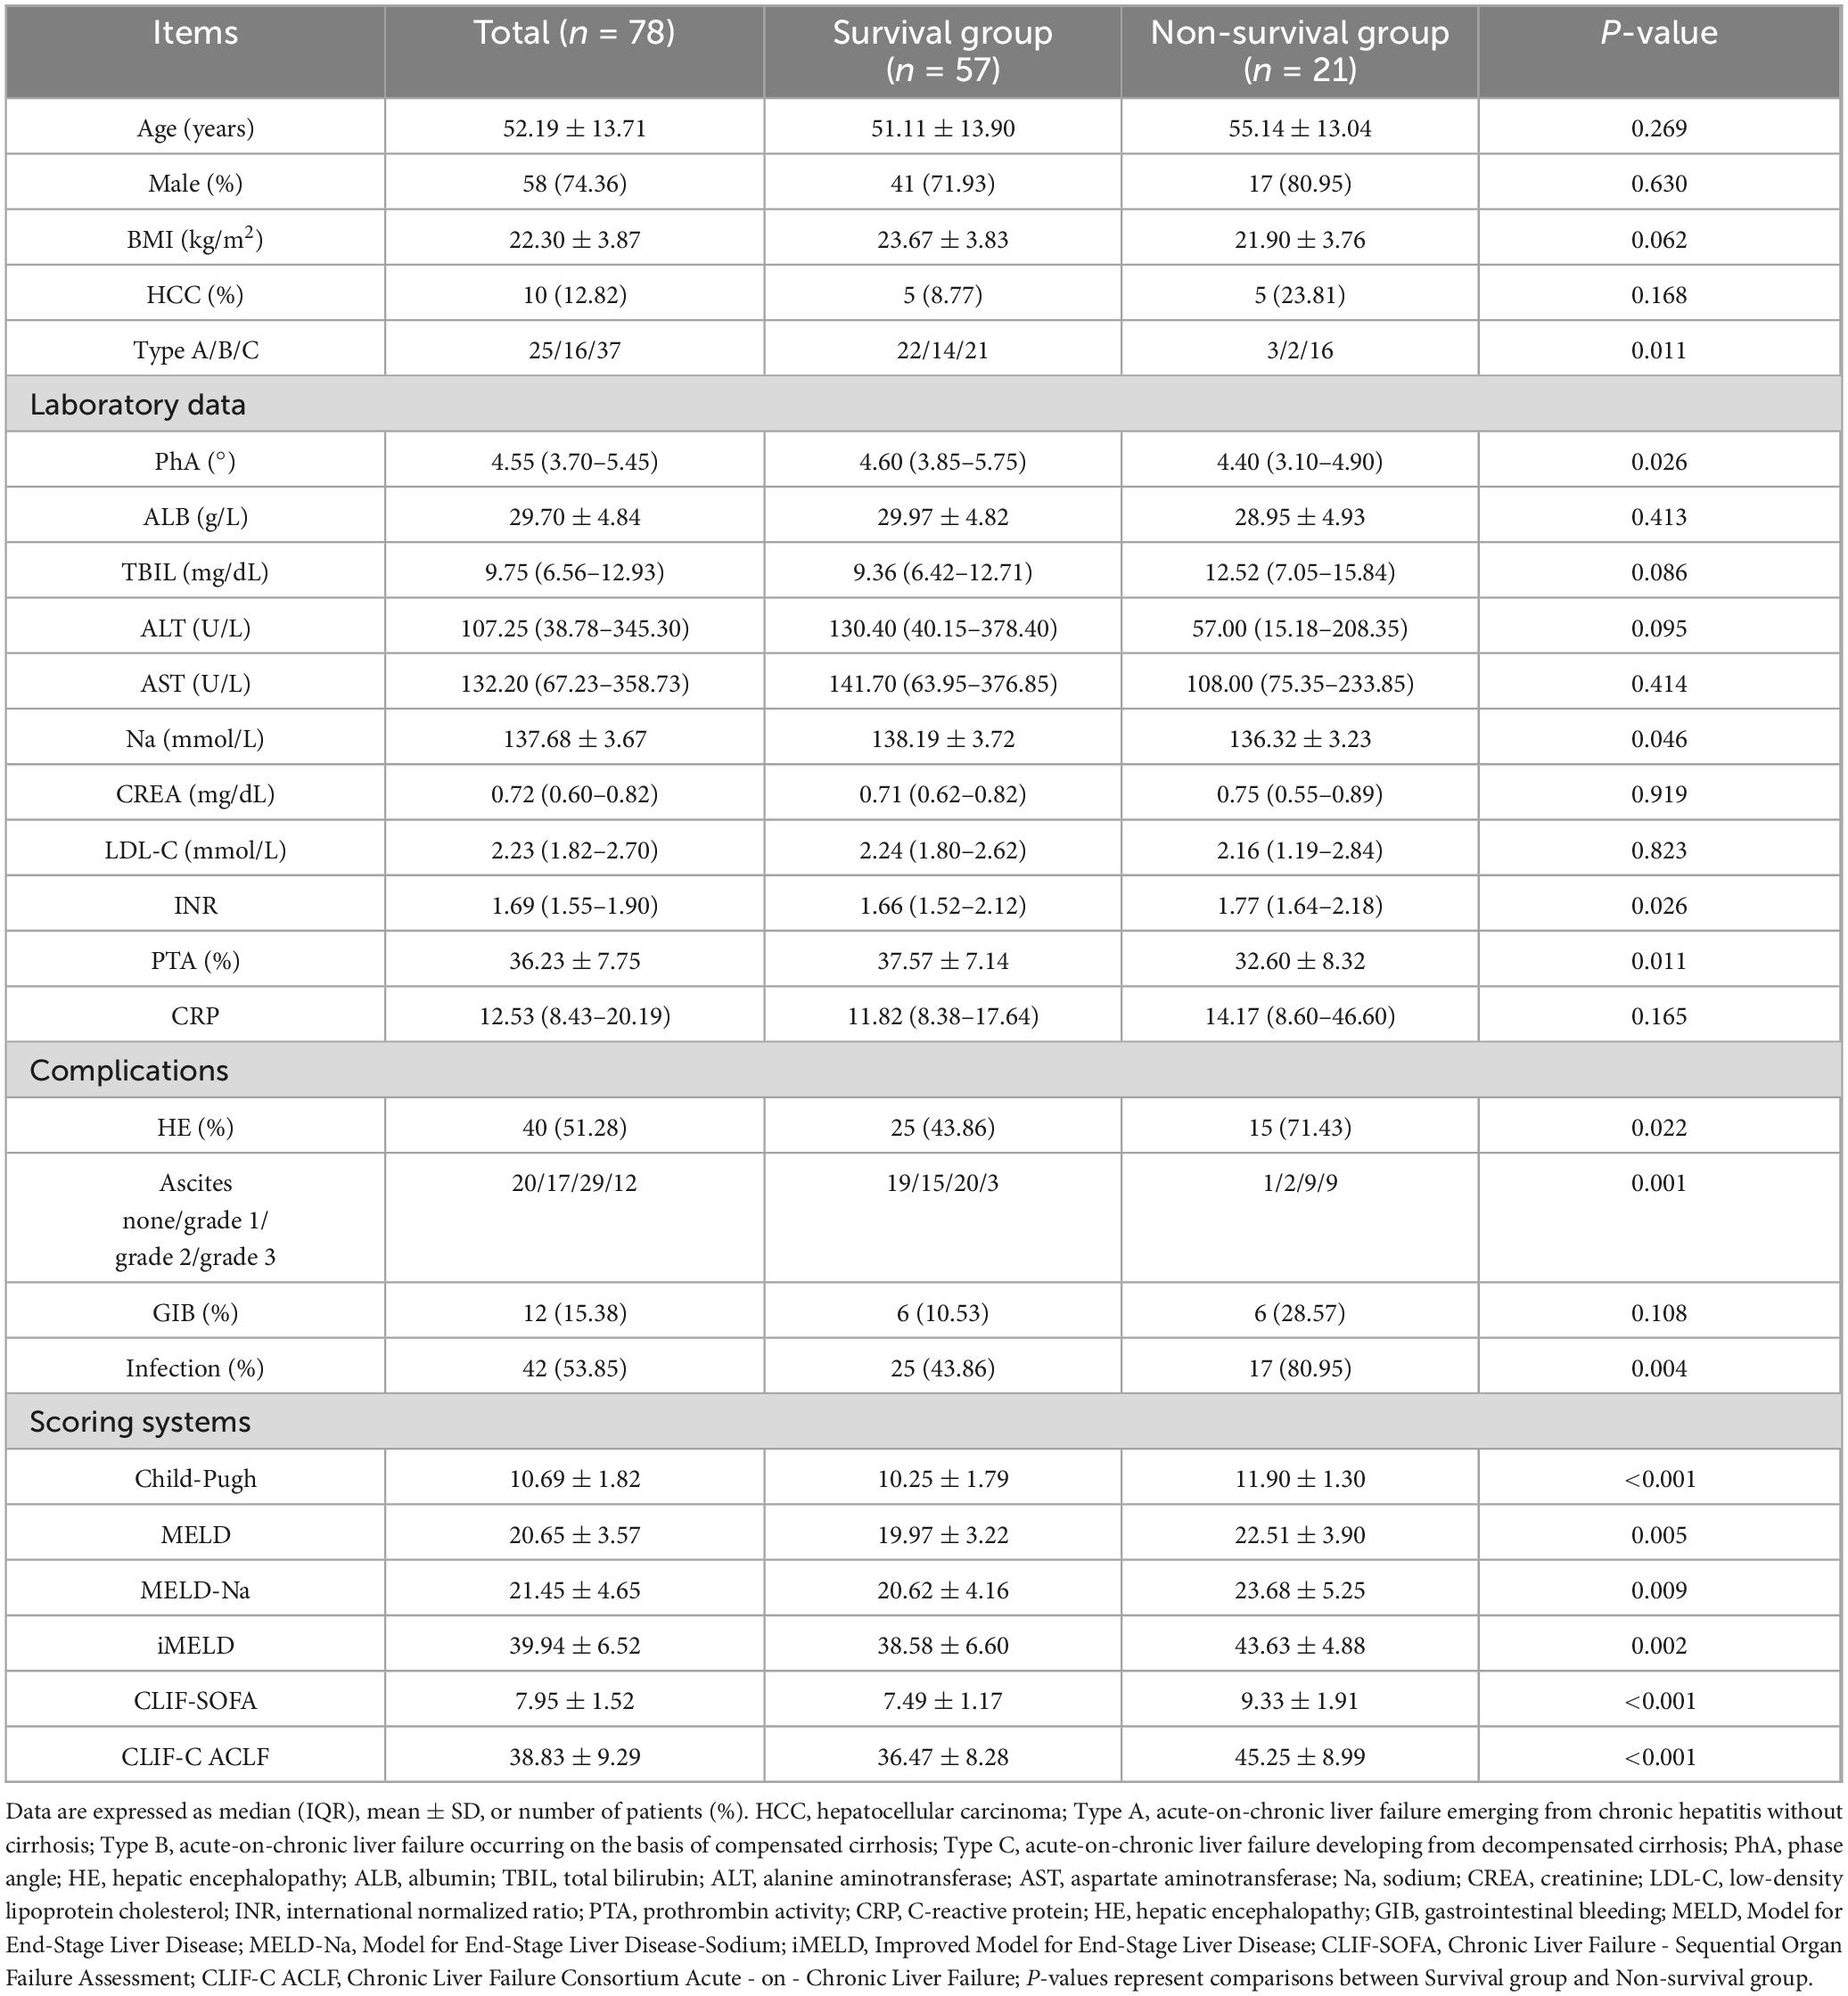
Table 2. Analysis of clinical and demographic characteristics between survivors and non-survivors in Acute-on-chronic liver failure (ACLF) (n = 78).
The median PhA in the overall ACLF cohort was 4.55° (3.70°–5.45°). Notably, non-survivors demonstrated lower PhA values [4.40° (3.10°–4.90°)] compared to survivors [4.60° (3.85°–5.75°); P = 0.026] (Table 2).
The incidence of hepatic encephalopathy, ascites, and infection was significantly higher in non-survivors (all P < 0.05). Laboratory analyses revealed non-survivors had significantly higher INR values, lower serum sodium levels, and lower prothrombin time activity compared to survivors (all P < 0.05).
Furthermore, non-survivors exhibited significantly elevated scores across all prognostic models, including Child-Pugh, Model for End-Stage Liver Disease (MELD), Model for End-Stage Liver Disease with Sodium (MELD-Na), iMELD, and the CLIF-SOFA (all P < 0.05) (Table 2).
New prognostic model development
Receiver operating characteristic curve analysis demonstrated that phase angle (PhA) alone had moderate predictive value for 90-days mortality in ACLF patients (AUC = 0.665), with a cutoff value of 5.15°, specificity of 90.48%, but limited sensitivity (42.11%) (Table 3). To enhance predictive performance, we developed a composite score combining PhA with the CLIF-SOFA score (Table 4). The novel CLIF-SOFA-PhA model showed improved predictive accuracy (AUC = 0.815; 95% CI: 0.699–0.930) with optimal cutoff at 8.50 (sensitivity 71.43%, specificity 80.70%) (Table 3).
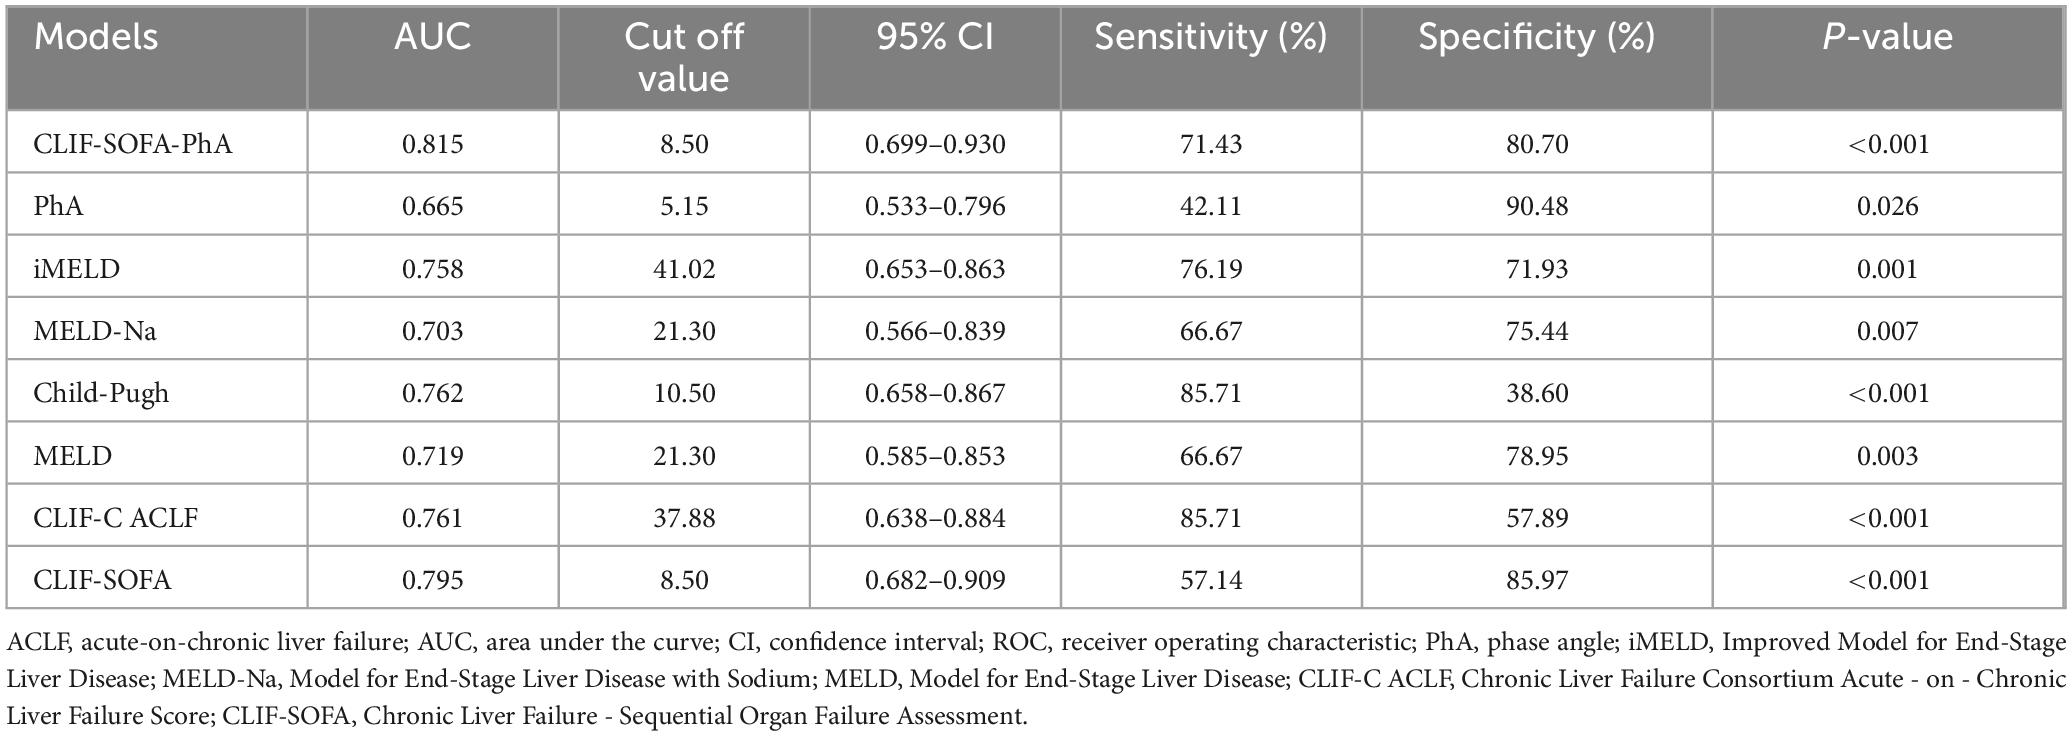
Table 3. Receiver operating characteristic (ROC) curve for prediction of 90-days mortality.
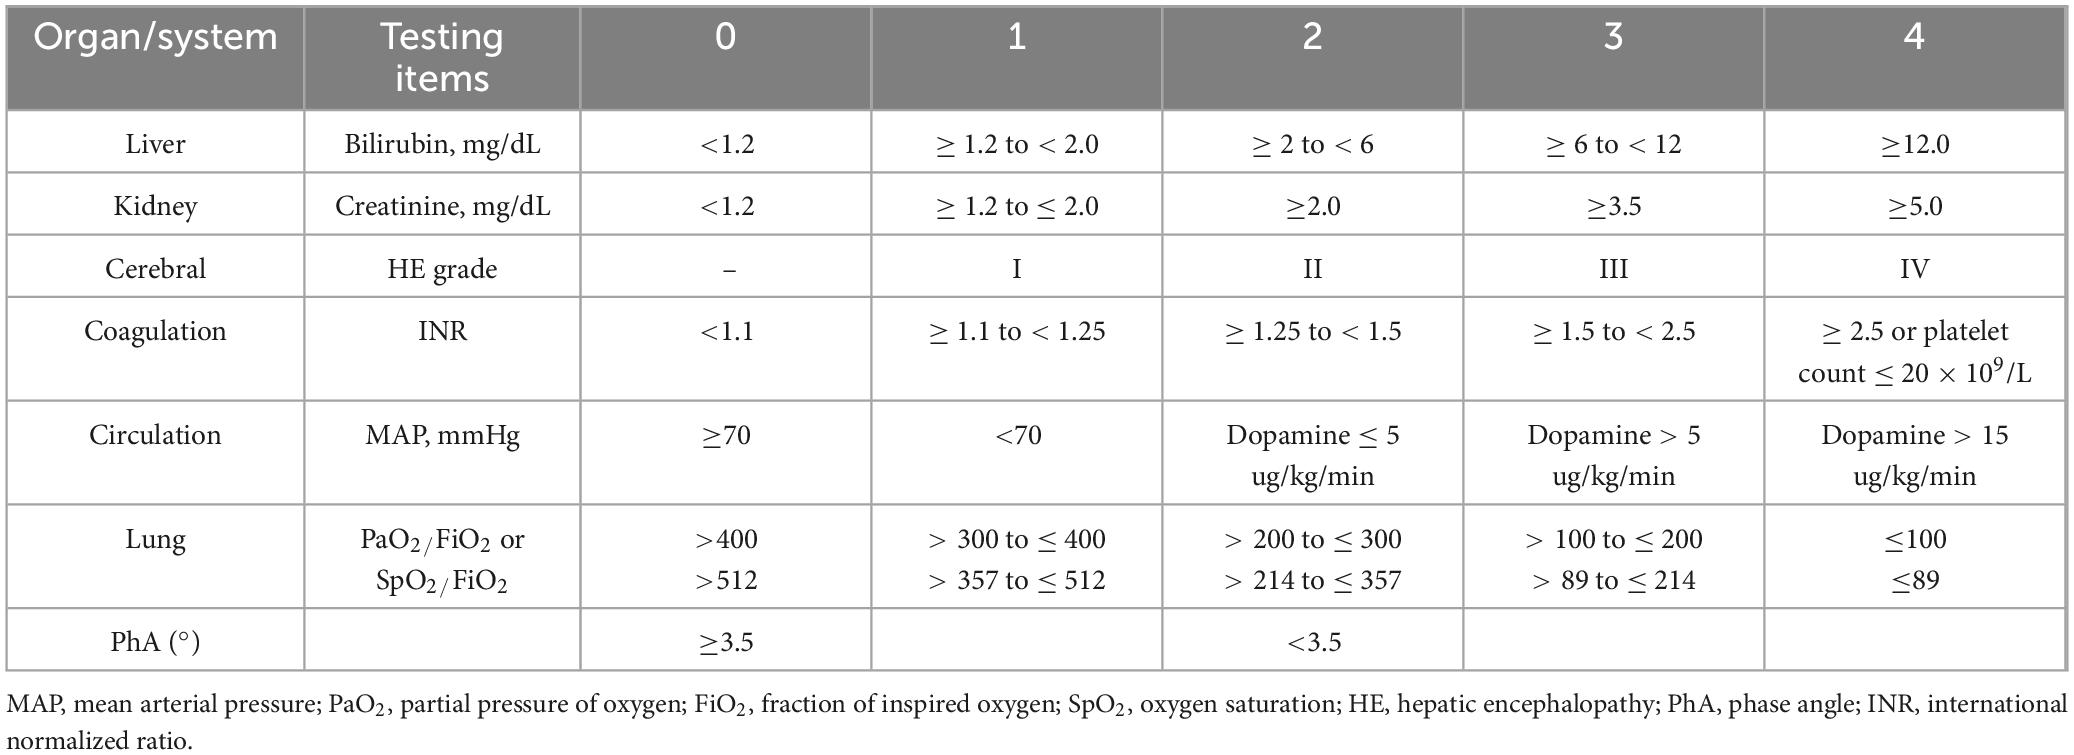
Table 4. A new prognostic score for Acute-on-chronic liver failure (ACLF): CLIF-SOFA-PhA.
Comparative analysis showed that the new CLIF-SOFA-PhA model achieved higher predictive accuracy than existing scoring systems, including MELD-Na (AUC = 0.703; 95% CI: 0.566–0.839), MELD (AUC = 0.719; 95% CI: 0.585–0.853), iMELD (AUC = 0.758; 95% CI: 0.653–0.863), Child-Pugh (AUC = 0.762; 95% CI: 0.658–0.867), CLIF-C ACLF (AUC = 0.761; 95% CI: 0.638–0.884) and CLIF-SOFA (AUC = 0.795; 95% CI: 0.682–0.909) for predicting 90-days mortality in ACLF patients (Table 3).
Discussion
The liver, as the body’s primary anabolic organ, plays a central role in maintaining nutritional homeostasis and modulating inflammatory responses. Accumulating evidence supports the clinical utility of PhA as a prognostic indicator in hepatic disorders. In overweight populations, PhA shows consistent association with non-alcoholic fatty liver disease (NAFLD) risk, with NAFLD patients demonstrating reduced PhA values (12). For chronic hepatitis C infection, PhA serves as a predictor of fibrosis progression (13). In cirrhotic patients, PhA values ≤ 4.9°correlate with increased hepatic encephalopathy risk (14), while values ≤ 5.52° show predictive value for 6-months mortality in decompensated cirrhosis (15). While these established associations highlight PhA’s clinical relevance across multiple liver diseases, its potential role in ACLF remains poorly characterized, representing an important area for further investigation.
Our study demonstrates that PhA, a readily measurable biomarker reflecting inflammatory status, serves as a valuable indicator for assessing disease severity and predicting 90-days survival in ACLF.
Initial measurements revealed PhA values of 5.90° (5.50°–6.30°) in patients with chronic liver disease and normal liver function, consistent with previous reports (16). However, these prior studies did not investigate PhA changes during progression from chronic liver disease to ACLF, nor its prognostic value in ACLF.
Our findings provide novel insights into this relationship. We observed a progressive decline in PhA values corresponding to worsening liver function: decreasing to 5.30° (4.60°–6.00°) in chronic liver disease with abnormal function, and further declining to 4.55° (3.70°–5.45°) upon progression to liver failure. These changes likely reflect alterations in cellular integrity and tissue composition associated with disease progression.
Subgroup analysis showed that ACLF patients with cirrhosis had lower PhA values than non-cirrhotic cases, with decompensated cirrhosis patients exhibiting more pronounced reductions compared to compensated cases (Figure 1). These differences may relate not only to liver disease severity but also to the frequent occurrence of sarcopenia in cirrhosis (17). A 2021 study by Ruiz-Margáin A et al. reported that PhA effectively identifies sarcopenia in cirrhosis with diagnostic accuracy comparable to skeletal muscle index (SMI) (18).
Additional analyses demonstrated an inverse relationship between PhA and ACLF severity. Patients with complications exhibited significantly lower PhA values than those without (Figure 1). This observation aligns with PhA’s potential role as an inflammatory biomarker, reflecting both systemic inflammatory activity and cellular dysfunction. The physiological basis involves characteristic bioelectrical changes during inflammation: reduced cell membrane capacitance decreases capacitive reactance (Xc), while expanded extracellular water content lowers resistance (R). Since PhA represents the Xc/R ratio, and given Xc’s greater relative decline, the net effect is reduced PhA values that correlate with inflammatory burden and cellular damage extent (6).
Consequently, PhA is regarded as a predictive indicator of disease severity (19), and it is believed that the strength of the inflammatory response determines ACLF severity (20).
Comparative analysis of ACLF survivors and non-survivors indicated an association between reduced PhA values and more advanced disease severity, with lower measurements tending to correlate with poorer outcomes. These findings are consistent with previous reports establishing PhA as a potential prognostic marker for short-term mortality. For instance, Cornejo-Pareja et al. compared the PhA values in 127 COVID-19 patients between survivors and non-survivors and found a significant difference (survivors: 4.5° (3.5°–5.5°), non-survivors: 2.8° (2.08°–3.68°), P < 0.001) (21). Similarly, Bernal-Ceballos et al. reported that acute heart failure patients with admission PhA values below 4.8° experienced higher 90-days mortality rates (22).
Several clinical scoring systems are currently available for assessing ACLF severity and prognosis, including the Child-Pugh, MELD, MELD-Na, iMELD, and CLIF-SOFA scores, though each has notable limitations (23). Previous research by Pagano et al. identified PhA as a potential prognostic marker in chronic liver diseases, particularly cirrhosis and hepatocellular carcinoma, with values below 5.1° associated with reduced 15-months survival in liver cancer patients (24). Additionally, lower PhA is associated with malnutrition and prolonged hospitalizations in critically ill patients in the intensive care unit (25).
In contrast to commonly used severity scoring systems in the intensive care unit, such as the Acute Physiology and Chronic Health Evaluation (APACHE), Sequential Organ Failure Assessment (SOFA), and Simplified Acute Physiology Score (SAPS), PhA demonstrates a stronger predictive ability for mortality among critically ill patients (19). The prognostic utility of PhA in chronic liver disease and critical illness may derive from its reflection of underlying inflammatory and oxidative stress pathways (6, 26).
Building upon existing evidence, we examined whether PhA might predict 90-days survival in ACLF patients. Our analysis showed that PhA alone yielded an AUC of 0.665 (95% CI: 0.533–0.796) for predicting 90-days mortality, with 42.11% sensitivity and 90.48% specificity. While PhA demonstrated limited sensitivity for mortality prediction, its high specificity may be clinically useful. For patients with ambiguous biochemical markers, maintained PhA values could suggest more favorable short-term outcomes.
The CLIF-SOFA scoring system evaluates the functional status of major organs and aggregates scores to predict mortality within 28 and 90 days in ACLF patients. Developed primarily for Western populations with alcohol- or HCV-related cirrhosis, its application may be less optimal for HBV-predominant Asian-Pacific cases. Hence, the CLIF-SOFA scoring system requires further optimization for the Asia-Pacific region. In our data, CLIF-SOFA also demonstrated high prognostic value (AUC = 0.795); however, the system lacks inflammation-related parameters relevant to the early phases of the disease. In ACLF, inflammatory responses play a crucial role, and the onset of an inflammatory storm occurs before organ function impairment. Incorporating easily detectable and accurate inflammation-related indicators into the CLIF-SOFA scoring system could enhance the early prediction of ACLF prognosis.
Our study observed differences in PhA values between ACLF survivors and non-survivors. In comparison, C-reactive protein (CRP) levels showed less pronounced variation between groups. This may be attributed to CRP’s hepatic origin - in liver failure, compromised synthetic function appears to reduce CRP production. As documented in previous studies (27, 28), even during sepsis-associated fulminant liver failure with marked inflammatory stimulation, CRP levels tend to remain low. These findings indicate PhA may offer advantages over CRP in monitoring inflammatory responses in ACLF.
To improve prognostic accuracy, we developed a novel CLIF-SOFA-PhA composite score. ROC analysis demonstrated improved performance (AUC = 0.815, sensitivity 71.43%, specificity 80.70%) compared to existing scores [MELD (AUC = 0.719), MELD-Na (AUC = 0.703), iMELD (AUC = 0.758), Child-Pugh (AUC = 0.762), CLIF-C ACLF (AUC = 0.761), and CLIF-SOFA (AUC = 0.795)], indicating that combining organ failure and inflammatory immune response indicators may improve prediction of 90-days mortality in ACLF.
Our research had certain limitations. First, it was a single-center retrospective analysis with a limited sample size, therefore, validation work needs to be conducted in a larger patient population in the future. Second, the study population was based on Chinese individuals, with most cases involving chronic hepatitis B or hepatitis B-associated cirrhosis. Whether these findings apply to other ethnic backgrounds and etiologies of ACLF remains to be validated. Moreover, PhA may undergo dynamic changes during the rapid evolution of ACLF.
Therefore, future research should thoroughly address these limitations by collecting larger-scale data, including different ethnic groups, and observing the variations of PhA during the progression of ACLF. This will further enhance our understanding of the disease and assist in refining clinical treatment decisions.
Data availability statement
The original contributions presented in this study are included in this article/supplementary material, further inquiries can be directed to the corresponding author.
Ethics statement
The studies involving humans were approved by Ethics Committee of Zhongshan Hospital Affiliated to Xiamen University. The studies were conducted in accordance with the local legislation and institutional requirements. The participants provided their written informed consent to participate in this study. Written informed consent was obtained from the individual(s) for the publication of any potentially identifiable images or data included in this article.
Author contributions
SC: Data curation, Methodology, Writing – original draft. LL: Conceptualization, Writing – original draft. YC: Methodology, Writing – original draft. CW: Data curation, Writing – original draft. YL: Data curation, Writing – original draft. JZ: Methodology, Writing – original draft. FZ: Data curation, Writing – original draft. MC: Conceptualization, Writing – original draft, Writing – review and editing.
Funding
The author(s) declare that financial support was received for the research and/or publication of this article. This project was supported by the First Batch of Major Science and Technology Projects of Xiamen City in 2023 by the Science and Technology Bureau of Xiamen City, Fujian Province, China (Project Number: 3502Z20231032).
Acknowledgments
We thank Dr. Chenxi Xie for his guidance on the data analysis.
Conflict of interest
The authors declare that the research was conducted in the absence of any commercial or financial relationships that could be construed as a potential conflict of interest.
Generative AI statement
The authors declare that no Generative AI was used in the creation of this manuscript.
Correction note
A correction has been made to this article. Details can be found at: 10.3389/fmed.2025.1695643.
Publisher’s note
All claims expressed in this article are solely those of the authors and do not necessarily represent those of their affiliated organizations, or those of the publisher, the editors and the reviewers. Any product that may be evaluated in this article, or claim that may be made by its manufacturer, is not guaranteed or endorsed by the publisher.
References
1. Arroyo V, Moreau R, Jalan R. Acute-on-chronic liver failure. N Engl J Med. (2020) 382:2137–45. doi: 10.1056/NEJMra1914900
2. Mezzano G, Juanola A, Cardenas A, Mezey E, Hamilton J, Pose E, et al. Global burden of disease: Acute-on-chronic liver failure, a systematic review and meta-analysis. Gut. (2022) 71:148–55. doi: 10.1136/gutjnl-2020-322161
3. Arroyo V, Moreau R, Kamath P, Jalan R, Ginès P, Nevens F, et al. Acute-on-chronic liver failure in cirrhosis. Nat Rev Dis Primers. (2016) 2:16041. doi: 10.1038/nrdp.2016.41
4. Moreau R, Jalan R, Gines P, Pavesi M, Angeli P, Cordoba J, et al. Acute-on-chronic liver failure is a distinct syndrome that develops in patients with acute decompensation of cirrhosis. Gastroenterology. (2013) 144:1426–37.e1-9. doi: 10.1053/j.gastro.2013.02.042
5. Sarin S, Choudhury A, Sharma M, Maiwall R, Al Mahtab M, Rahman S, et al. Acute-on-chronic liver failure: Consensus recommendations of the asian pacific association for the study of the liver (Apasl): An update. Hepatol Int. (2019) 13:353–90. doi: 10.1007/s12072-019-09946-3
6. da Silva B, Orsso C, Gonzalez M, Sicchieri J, Mialich M, Jordao A, et al. Phase angle and cellular health: Inflammation and oxidative damage. Rev Endocr Metab Disord. (2023) 24:543–62. doi: 10.1007/s11154-022-09775-0
7. Lim S, Lim J. Phase angle as a predictor of functional outcomes in patients undergoing in-hospital rehabilitation after hip fracture surgery. Arch Gerontol Geriatr. (2020) 89:104060. doi: 10.1016/j.archger.2020.104060
8. Allison R, Ray Lewis A, Liedtke R, Buchmeyer N, Frank H. Early identification of hypovolemia using total body resistance measurements in long-term care facility residents. Gend Med. (2005) 2:19–34. doi: 10.1016/s1550-8579(05)80006-3
9. De Benedetto F, Marinari S, De Blasio F. Phase angle in assessment and monitoring treatment of individuals with respiratory disease. Rev Endocr Metab Disord. (2023) 24:491–502. doi: 10.1007/s11154-023-09786-5
10. Ceolin J, de Borba E, Mundstock E, de Oliveira J, Mattiello R, Bodanese L. Phase angle of bioimpedance as a marker of inflammation in cardiovascular diseases: A systematic review. Nutrition. (2023) 112:112064. doi: 10.1016/j.nut.2023.112064
11. Low S, Pek S, Moh A, Khoo J, Ang K, Tang W, et al. Association between lower phase angle and chronic kidney disease progression in type 2 diabetes patients. Ann Acad Med Singap. (2023) 52:125–34. doi: 10.47102/annals-acadmedsg.2022350
12. Chen G, Lv Y, Ni W, Shi Q, Xiang X, Li S, et al. Associations between phase angle values obtained by bioelectrical impedance analysis and nonalcoholic fatty liver disease in an overweight population. Can J Gastroenterol Hepatol. (2020) 2020:8888405. doi: 10.1155/2020/8888405
13. Dorna Mde S, Santos L, Gondo F, Augusti L, de Campos Franzoni L, Sassaki L, et al. Phase angle is associated with advanced fibrosis in patients chronically Infected with Hepatitis C virus. Life Sci. (2016) 154:30–3. doi: 10.1016/j.lfs.2016.02.061
14. Ruiz-Margáin A, Macías-Rodríguez R, Ampuero J, Cubero F, Chi-Cervera L, Ríos-Torres S, et al. Low phase angle is associated with the development of hepatic encephalopathy in patients with cirrhosis. World J Gastroenterol. (2016) 22:10064–70. doi: 10.3748/wjg.v22.i45.10064
15. Saueressig C, Glasenapp J, Luft V, Alves F, Ferreira P, Hammes T, et al. Phase angle is an independent predictor of 6-month mortality in patients with decompensated cirrhosis: A prospective cohort study. Nutr Clin Pract. (2020) 35:1061–9. doi: 10.1002/ncp.10584
16. Peres W, Lento D, Baluz K, Ramalho A. Phase angle as a nutritional evaluation tool in all stages of chronic liver disease. Nutr Hosp. (2012) 27:2072–8. doi: 10.3305/nh.2012.27.6.6015
17. Casirati A, Crotti S, Raffaele A, Caccialanza R, Cereda E. The use of phase angle in patients with digestive and liver diseases. Rev Endocr Metab Disord. (2023) 24:503–24. doi: 10.1007/s11154-023-09785-6
18. Ruiz-Margáin A, Xie J, Román-Calleja B, Pauly M, White M, Chapa-Ibargüengoitia M, et al. Phase angle from bioelectrical impedance for the assessment of sarcopenia in cirrhosis with or without ascites. Clin Gastroenterol Hepatol. (2021) 19:1941–9.e2. doi: 10.1016/j.cgh.2020.08.066
19. Lee Y, Lee J, Kang D, Hong J, Lee J. Bioelectrical impedance analysis values as markers to predict severity in critically Ill patients. J Crit Care. (2017) 40:103–7. doi: 10.1016/j.jcrc.2017.03.013
20. Clària J, Arroyo V, Moreau R. Roles of systemic inflammatory and metabolic responses in the pathophysiology of acute-on-chronic liver failure. JHEP Rep. (2023) 5:100807. doi: 10.1016/j.jhepr.2023.100807
21. Cornejo-Pareja I, Vegas-Aguilar I, García-Almeida J, Bellido-Guerrero D, Talluri A, Lukaski H, et al. Phase angle and standardized phase angle from bioelectrical impedance measurements as a prognostic factor for mortality at 90 days in patients with Covid-19: A longitudinal cohort study. Clin Nutr. (2022) 41:3106–14. doi: 10.1016/j.clnu.2021.02.017
22. Bernal-Ceballos F, Castillo-Martínez L, Reyes-Paz Y, Villanueva-Juárez J, Hernández-Gilsoul T. Clinical application of phase angle and biva Z-score analyses in patients admitted to an emergency department with acute heart failure. J Vis Exp. (2023). doi: 10.3791/65660
23. Zaccherini G, Weiss E, Moreau R. Acute-on-chronic liver failure: Definitions, pathophysiology and principles of treatment. JHEP Rep. (2021) 3:100176. doi: 10.1016/j.jhepr.2020.100176
24. Pagano A, Sicchieri J, Schiavoni I, Barbeiro D, Manca C, da Silva B, et al. Phase angle as a severity indicator for liver diseases. Nutrition. (2020) 70:110607. doi: 10.1016/j.nut.2019.110607
25. Jansen A, Gattermann T, da Silva Fink J, Saldanha MF, Dias Nascimento Rocha C, de Souza Moreira TH, et al. Low standardized phase angle predicts prolonged hospitalization in critically Ill patients. Clin Nutr ESPEN. (2019) 34:68–72. doi: 10.1016/j.clnesp.2019.08.011
26. da Silva B, Gonzalez M, Cereda E, Prado C. Exploring the potential role of phase angle as a marker of oxidative stress: A narrative review. Nutrition. (2022) 93:111493. doi: 10.1016/j.nut.2021.111493
27. Silvestre J, Coelho L, Póvoa P. Impact of fulminant Hepatic failure in c-reactive protein? J Crit Care. (2010) 25:657.e7–12. doi: 10.1016/j.jcrc.2010.02.004
Keywords: acute-on-chronic liver failure, phase angle, prognosis, inflammation, bioelectrical impedance analysis
Citation: Cai S, Lin L, Cai Y, Wang C, Lin Y, Zhou J, Zhou F and Chen M (2025) Phase angle associates with severity and mortality in acute-on-chronic liver failure. Front. Med. 12:1541795. doi: 10.3389/fmed.2025.1541795
Received: 08 December 2024; Accepted: 16 May 2025;
Published: 21 July 2025;
Corrected: 14 October 2025.
Edited by:
Juan Carlos Cutrin, University of Turin, ItalyReviewed by:
Jin-Shui Pan, The First Affiliated Hospital of Fujian Medical University, ChinaYuehong Huang, Fujian Medical University Union Hospital, China
Xian-Ming Liang, Beijing University of Chinese Medicine, China
Copyright © 2025 Cai, Lin, Cai, Wang, Lin, Zhou, Zhou and Chen. This is an open-access article distributed under the terms of the Creative Commons Attribution License (CC BY). The use, distribution or reproduction in other forums is permitted, provided the original author(s) and the copyright owner(s) are credited and that the original publication in this journal is cited, in accordance with accepted academic practice. No use, distribution or reproduction is permitted which does not comply with these terms.
*Correspondence: Meiya Chen, bWVpeWFfY2hlbkAxMjYuY29t
†These authors have contributed equally to this work