Abstract
Background:
The lactate/albumin ratio (LAR) was related to adverse outcomes in heart failure, myocardial infarction, and acute pancreatitis. However, it remains unevaluated whether LAR has prognosis significance in sepsis-associated acute kidney injury (SA-AKI) patients. Therefore, this research was performed to clarify the potential predictive utility of LAR for 28-day mortality in SA-AKI patients.
Methods:
Participants diagnosed with SA-AKI were selected from the Medical Information Mart for Intensive Care (MIMIC-IV) database and then placed into four groups in accordance with LAR quartiles. The endpoint was all-cause mortality within 28 days. The Kaplan–Meier curves were conducted to estimate the cumulative survival rates in the four groups. The correlation between LAR and the endpoint was elucidated by constructing Cox proportional hazards analysis, restricted cubic splines (RCS), and subgroup analysis.
Results:
Of the 3,895 patients with SA-AKI, 58.59% were men. The mortality rate from all causes within 28 days was 28.55%. The Kaplan–Meier curves showed that participants having elevated LAR exhibited significantly decreased survival rates. Cox proportional hazards models showed that higher LAR was related to higher 28-day death rate in SA-AKI patients (HR: 1.224, 95% CI: 1.160–1.291, p < 0.001). In addition, RCS analyses revealed that LAR was non-linearly correlated with the risk of 28-day death.
Conclusion:
LAR was independently related to an elevated risk of mortality within 28 days in SA-AKI patients. More prospective research studies are necessitated for further confirmation of these findings.
Introduction
Sepsis represents a life-threatening circumstance that stems from the host’s abnormal reaction in the face of infection, leading to organ dysfunction with abnormal signs and laboratory evidence (1). The kidney is frequently affected, leading to the occurrence of sepsis-associated acute kidney injury (SA-AKI). Approximately 30–50% of acute kidney injury (AKI) that occur in the intensive care unit (ICU) are notably caused by sepsis (2–6). SA-AKI usually can contribute to prolonged hospital stays, elevated morbidity, and increased economic burdens for patients (7–11). However, due to the diverse and intricate underlying mechanisms of SA-AKI (12, 13), it is still a huge challenge to forecast SA-AKI patients’ clinical outcomes. Therefore, it is crucial to find valuable predictors to reduce adverse outcomes among patients with SA-AKI.
Lactate, which is produced during anaerobic metabolism as a secondary or by-product, can accurately reflect the extent of cellular hypoxia and tissue hypoperfusion (14). However, lactate may be elevated in individuals with hepatic dysfunction and diabetes, or those taking metformin (15, 16), which may make prediction solely based on lactate levels potentially unreliable.
In addition, serum albumin, which is considered as an important protein, plays a significant part in maintaining the balance of blood colloid osmotic pressure, endothelial stability, and immune regulation. Several research studies already revealed that albumin can forecast poor outcomes among patients with sepsis (17) or AKI (18). However, nutritional condition, inflammatory infection, and liver or kidney disease may influence albumin levels. Thus, depending merely on albumin levels in forecasting outcomes can also have limited value.
Previous studies already revealed that lactate/albumin ratio (LAR) is related to adverse outcomes in acute myocardial infarction, acute pancreatitis, and heart failure (19–24). Nevertheless, the link between LAR and SA-AKI patients’ prognosis is still not definite. Consequently, the research was performed to investigate the potential link between LAR in SA-AKI patients and 28-day mortality from all causes.
Methods
Study population
The data we analyzed were sourced from a freely accessible MIMIC-IV database, which encompasses the clinical records regarding patients hospitalized in ICU of the Beth Israel Deaconess Medical Center during the period from 2008 to 2019. It documents detailed records on patients’ demographics, vital signs, laboratory measures, medication treatment, disease diagnosis, medication management, and other comprehensive information (25). Because of the anonymization of patients’ health data in the database, ethics approval and informed consent were exempted. Our study confirmed compliance with the Declaration of Helsinki and MIMICIV’s data usage agreements. To get data access, we participated in the training course of the National Institutes of Health and successfully completed the exams of the Collaborative Institutional Training Initiative. Subsequently, we got the authorization to make use of the database and extract relevant data.
Patients admitted to the ICU with sepsis and developing AKI within 48 h were incorporated into this research. Sepsis was determined as an increase in the sequential organ failure assessment (SOFA) scale score by 2 points, accompanied by a confirmed or suspected infection (1). The definition of AKI conformed to the Kidney Disease: Improving Global Outcomes criteria, which both takes into account the highest serum creatinine value and urine output (26). The minimum value of SCr within the 7-day period preceding ICU admission was adopted as the baseline SCr. In case of the absence of SCr prior to admission, the initial SCr of the patient after ICU admission was regarded as the relevant one. Only measurement from the first ICU admission was employed for research in case of multiple admissions. First, we excluded participants with ICU duration shorter than 48 h to ensure adequate observation of SA-AKI progression and minimize potential confounding from incomplete disease manifestation or early discharge. Subsequently, we further excluded those participants in the following order: (1) participants with multiple ICU/hospital admissions with SA-AKI, using only the first admission examination; (2) participants lacking lactate and albumin data. In total, 3,895 participants were finally incorporated into the research (Figure 1).
Figure 1

Patient selection process.
We chose the initial blood lactate/serum albumin ratio upon admission within 24 h as the primary research variable to reduce the impact of subsequent clinical interventions. The variables relevant to this study were all obtained by structured query language. These variables included demographic details such as age, sex, and race, vital signs such as oxygen saturation (SpO2), systolic blood pressure (SBP), diastolic blood pressure (DBP), mean blood pressure (MBP), respiratory rate (RR), and heart rate (HR), laboratory examination data such as platelet, hemoglobin, white blood cell (WBC), hematocrit, sodium, potassium, calcium, anion gap, chloride, blood urea nitrogen (BUN), glucose, base excess, bicarbonate, and serum creatinine (SCr). Also encompassed were comorbidities such as liver disease, congestive heart failure (CHF), chronic pulmonary disease, malignancy, diabetes, myocardial infarction (MI), renal disease, disease severity scores upon admission such as the SOFA score and charlson comorbidity index (CCI), AKI stage, and the utilization of renal replacement therapy (RRT). All laboratory indicators were sourced from the initial ICU examination. The follow-up process commenced immediately upon the patients’ admission and continued until the time of their death. Variables missing over 20% of values, such as lymphocytes, monocytes, neutrophils, lactate dehydrogenase, globulin, height, and weight, were excluded. For those missing less than 20%, multiple imputation was utilized by the missForest package of R software to fill in the missing values (27).
Primary outcome
The mortality from all causes within 28 days was the primary outcome.
Statistical analysis
Based on the distribution status, normally distributed continuous variables were described in the form of mean ± standard deviation (SD) and analyzed using t-tests or ANOVA, while non-normally distributed continuous variables were described in the form of median with interquartile range (IQR) and evaluated through Mann–Whitney U tests or Kruskal–Wallis tests. For categorical variables, proportions were reported.
Kaplan–Meier (KM) survival curves were performed to calculate the cumulative survival rates in the four groups, with differences examined via the log-rank test. A univariate Cox analysis was conducted to determine possible confounders. The multivariate Cox proportional hazards regression model encompassed variables with clinical significance or p < 0.05 in the univariate analysis. Model 1 employed the unadjusted reference. In Model 2, adjustments for age, sex, and ethnicity were made. Model 3, building upon Model 2, accounted for factors such as HR, SpO2, SBP, DBP, hemoglobin, WBC, platelet, SCr, glucose, potassium, sodium, BUN, MI, CHF, malignancy, renal disease, diabetes, liver disease, RRT, SOFA score, and CCI. LAR was examined by employing restricted cubic splines (RCS) to explore its non-linear association with 28-day mortality. Receiver operating characteristic (ROC) analysis was utilized to assess the diagnostic capacity, sensitivity, and specificity of lactate, albumin, LAR, SOFA, and CCI for mortality with AUC calculated for each index. Finally, subgroup analysis was conducted to assess potential moderating effects according to age (≥ 65 or < 65 years), sex, ethnicity, MI, CHF, liver disease, diabetes, renal disease, and RRT.
R software (version 4.3.3) and SPSS software (version 26.0) were used to analyze the data, and a p-value of < 0.05 was considered significant for two-sided tests.
Results
Baseline characteristics
There were 3,895 participants with SA-AKI in total that were ultimately included. The patients’ median age at baseline was 66 (IQR: 54–77) years. There were 2,282 (58.59%) males. The median LAR of all included participants was 0.69 (0.44, 1.18), and the mortality rate within 28 days was 28.55%.
Table 1 exhibits the participants’ baseline characteristics that were grouped into four groups in accordance with LAR quartiles. The median value of LAR in each quartile was 0.34 (IQR: 0.28–0.39), 0.55 (IQR: 0.50–0.62), 0.88 (IQR: 0.78–1.01), and 1.81 (IQR: 1.45–2.50), respectively. In comparison with the lower group, those with higher LAR were younger and more prone to have liver disease and renal disease, had higher disease severity scores at admission and higher usage rate of RRT and had higher HR, RR, WBC, glucose, SCr, BUN, anion gap, base excess, potassium, and lactate and lower SBP, DBP, MBP, and SpO2. In addition, as LAR increased, the risk of mortality within 28 days increased (19.30% versus 26.41% versus 29.09% versus 39.38%, p < 0.001).
Table 1
| Variables | Overall | Q1 | Q2 | Q3 | Q4 | p-value |
|---|---|---|---|---|---|---|
| Demographics | ||||||
| Age (years) | 66 (54, 77) | 66 (54, 77) | 67 (56, 79) | 66 (54, 78) | 64 (53, 75) | <0.001 |
| Sex (%) | 0.379 | |||||
| Female | 1,613 (41.41) | 419 (43.02) | 385 (39.57) | 413 (42.45) | 396 (40.62) | |
| Male | 2,282 (58.59) | 555 (56.98) | 588 (60.43) | 560 (57.55) | 579 (59.38) | |
| Ethnicity (%) | 0.009 | |||||
| White | 2,385 (61.23) | 640 (65.71) | 579 (59.51) | 600 (61.66) | 566 (58.05) | |
| Black | 336 (8.63) | 64 (6.57) | 97 (9.97) | 80 (8.22) | 95 (9.74) | |
| Other | 1,174 (30.14) | 270 (27.72) | 297 (30.52) | 293 (30.11) | 314 (32.21) | |
| Vital signs | ||||||
| Heart rate (beats/min) | 89 (77, 102) | 84 (73, 95) | 87 (76, 99) | 91 (78, 103) | 95 (83, 110) | <0.001 |
| Respiratory rate (beats/min) | 20.1 (17.5, 23.5) | 19.5 (17.2, 22.3) | 19.6 (17.3, 22.9) | 20.3 (17.5, 23.8) | 21.1 (18.3, 24.7) | <0.001 |
| Oxygen saturation (%) | 97.37 (95.77, 98.74) | 97.08 (95.57, 98.67) | 97.36 (95.77, 98.64) | 97.58 (95.96, 98.82) | 97.45 (95.80, 98.84) | 0.012 |
| Systolic blood pressure (mmHg) | 111 (103, 121) | 115 (107, 127) | 112 (104, 123) | 110 (103, 119) | 108 (101, 115) | <0.001 |
| Diastolic blood pressure (mmHg) | 61 (54, 67) | 61 (55, 69) | 61 (55, 68) | 60 (54, 67) | 60 (53, 66) | <0.001 |
| Mean blood pressure (mmHg) | 75 (70, 82) | 76 (70, 84) | 76 (71, 83) | 75 (69, 82) | 74 (69, 80) | <0.001 |
| Laboratory tests | ||||||
| Lactate (mmol/L) | 2.10 (1.40, 3.43) | 1.10 (0.90, 1.30) | 1.75 (1.50, 2.03) | 2.60 (2.20, 3.17) | 4.99 (3.86, 6.67) | <0.001 |
| Albumin (g/dL) | 3.10 (2.60, 3.60) | 3.40 (3.00, 3.80) | 3.20 (2.70, 3.65) | 3.00 (2.55, 3.40) | 2.65 (2.20, 3.10) | <0.001 |
| Lactate/albumin ratio | 0.69 (0.44, 1.18) | 0.34 (0.28, 0.39) | 0.55 (0.50, 0.62) | 0.88 (0.78, 1.01) | 1.82 (1.45, 2.50) | <0.001 |
| Hematocrit (%) | 32 (28, 37) | 32 (28, 37) | 33 (29, 38) | 32 (28, 37) | 31 (27, 35) | <0.001 |
| Hemoglobin (g/dL) | 10.55 (9.12, 12.20) | 10.70 (9.20, 12.15) | 10.90 (9.43, 12.64) | 10.53 (9.11, 12.10) | 10.10 (8.93, 11.70) | <0.001 |
| Platelet (k/uL) | 177 (116, 245) | 203 (153, 268) | 188 (139, 259) | 166 (107, 239) | 135 (91, 208) | <0.001 |
| White blood cell (k/uL) | 13 (9, 17) | 11 (9, 15) | 13 (10, 17) | 13 (9, 18) | 14 (9, 19) | <0.001 |
| Glucose (mg/dL) | 143 (116, 186) | 128 (109, 162) | 142 (117, 182) | 152 (121, 194) | 156 (122, 209) | <0.001 |
| Serum creatinine (mg/dL) | 1.28 (0.87, 2.16) | 1.08 (0.75, 2.13) | 1.20 (0.85, 2.10) | 1.29 (0.90, 2.03) | 1.60 (1.07, 2.40) | <0.001 |
| Blood urea nitrogen (mg/dL) | 26 (17, 43) | 23 (15, 42) | 26 (17, 44) | 27 (18, 42) | 27 (18, 43) | <0.001 |
| Anion gap (mEq/L) | 15.7 (13.2, 18.7) | 14.5 (12.6, 16.8) | 15.0 (13.0, 17.5) | 15.5 (13.0, 18.3) | 18.1 (15.3, 21.8) | <0.001 |
| Base excess (mmol/L) | −2.3 (−6.0, 0.0) | 0.0 (−3.0, 2.0) | −1.1 (−4.3, 0.9) | −2.7 (−5.6, −0.1) | −6.0 (−9.3, −2.9) | <0.001 |
| Bicarbonate (mEq/L) | 21.3 (18.2, 24.3) | 23.4 (20.5, 26.0) | 22.0 (19.5, 25.0) | 21.0 (18.3, 23.6) | 18.6 (16.0, 21.5) | <0.001 |
| Chloride (mEq/L) | 104 (100, 108) | 104 (100, 108) | 104 (100, 108) | 105 (100, 108) | 105 (100, 109) | 0.007 |
| Sodium (mEq/L) | 138.6 (135.5, 141.3) | 138.8 (136.0, 141.5) | 138.6 (135.5, 141.0) | 138.3 (135.0, 141.0) | 139.0 (135.4, 142.0) | 0.003 |
| Potassium (mEq/L) | 4.20 (3.87, 4.70) | 4.15 (3.83, 4.60) | 4.17 (3.85, 4.60) | 4.27 (3.90, 4.77) | 4.30 (3.90, 4.84) | <0.001 |
| Calcium (mg/dl) | 8.10 (7.60, 8.60) | 8.30 (7.87, 8.70) | 8.17 (7.65, 8.63) | 8.00 (7.57, 8.55) | 7.94 (7.43, 8.54) | <0.001 |
| Scoring systems | ||||||
| CCI | 6.0 (4.0, 8.0) | 6.0 (4.0, 8.0) | 6.0 (4.0, 8.0) | 6.0 (4.0, 8.0) | 6.0 (4.0, 8.0) | 0.030 |
| SOFA | 4.0 (2.5, 6.0) | 3.0 (2.0, 4.0) | 4.0 (2.0, 5.0) | 4.0 (3.0, 6.0) | 5.0 (3.0, 7.0) | <0.001 |
| Comorbidities (%) | ||||||
| Myocardial infarction | 750 (19.26) | 183 (18.79) | 195 (20.04) | 186 (19.12) | 186 (19.08) | 0.907 |
| Congestive heart failure | 1,263 (32.43) | 365 (37.47) | 338 (34.74) | 297 (30.52) | 263 (26.97) | <0.001 |
| Chronic pulmonary disease | 1,056 (27.11) | 332 (34.09) | 281 (28.88) | 252 (25.90) | 191 (19.59) | <0.001 |
| Renal disease | 903 (23.18) | 256 (26.28) | 225 (23.12) | 221 (22.71) | 201 (20.62) | 0.029 |
| Malignancy | 552 (14.17) | 116 (11.91) | 106 (10.89) | 156 (16.03) | 174 (17.85) | <0.001 |
| Liver disease | 1,052 (27.01) | 141 (14.48) | 210 (21.58) | 296 (30.42) | 405 (41.54) | <0.001 |
| Diabetes | 1,214 (31.17) | 316 (32.44) | 306 (31.45) | 301 (30.94) | 291 (29.85) | 0.661 |
| Interventions | ||||||
| RRT use (%) | 675 (17.33) | 113 (11.60) | 120 (12.33) | 148 (15.21) | 294 (30.15) | <0.001 |
| AKI stage (%) | ||||||
| 1 | 811 (20.82) | 234 (24.02) | 227 (23.33) | 203 (20.86) | 147 (15.08) | |
| 2 | 1703 (43.72) | 491 (50.41) | 439 (45.12) | 435 (44.71) | 338 (34.67) | |
| 3 | 1,381 (35.46) | 249 (25.56) | 307 (31.55) | 335 (34.43) | 490 (50.26) | |
| LOS | ||||||
| Hospital LOS | 13 (7, 21) | 12 (7, 19) | 12 (7, 20) | 13 (8, 21) | 14 (7, 24) | 0.003 |
| ICU LOS | 6 (3, 11) | 5 (3, 10) | 6 (4, 10) | 6 (3, 10) | 7 (4, 12) | <0.001 |
| Outcome | ||||||
| 28-day mortality (%) | 1,112 (28.55) | 188 (19.30) | 257 (26.41) | 283 (29.09) | 384 (39.38) | <0.001 |
Baseline characteristics of 3,895 participants by LAR quartiles.
CCI (Charlson comorbidity index), RRT (renal replacement therapy), SOFA (sequential organ failure assessment), AKI (acute kidney injury), LOS (length of stay).
Table 2 exhibits the detailed baseline characteristics between the survival and non-survival groups. The participants in non-survival group were older (p < 0.001) and had higher incidence of CHF, liver disease, malignancy, higher disease severity scores at admission, and higher usage rate of RRT (p < 0.05). As for clinical laboratory data, non-survival group had higher HR, RR, WBC, glucose, SCr, BUN, anion gap, base excess, potassium, lactate (p < 0.05), LAR (0.85 [0.52, 1.58] vs. 0.64 [0.42, 1.06], p < 0.001) and lower SpO2, SBP, DBP, MBP, hemoglobin, platelet, albumin, and bicarbonate (p < 0.05).
Table 2
| Variables | Overall (n = 3,895) | Survival group (n = 2,783) | Non-survival group (n = 1,112) | p-value |
|---|---|---|---|---|
| Demographics | ||||
| Age (years) | 66 (54, 77) | 64 (53, 75) | 70 (57, 81) | <0.001 |
| Sex (%) | 0.773 | |||
| Female | 1,613 (41.41) | 1,148 (41.25) | 465 (41.82) | |
| Male | 2,282 (58.59) | 1,635 (58.75) | 647 (58.18) | |
| Ethnicity (%) | <0.001 | |||
| White | 2,385 (61.23) | 1776 (63.82) | 609 (54.77) | |
| Black | 336 (8.63) | 254 (9.13) | 82 (7.37) | |
| Other | 1,174 (30.14) | 753 (27.06) | 421 (37.86) | |
| Vital signs | ||||
| Heart rate (beats/min) | 89 (77, 102) | 88 (77, 101) | 91 (77, 104) | 0.029 |
| Respiratory rate (beats/min) | 20.1 (17.5, 23.5) | 19.8 (17.3, 23.1) | 20.8 (18.1, 24.3) | <0.001 |
| Oxygen saturation (%) | 97.37 (95.77, 98.74) | 97.42 (95.92, 98.76) | 97.24 (95.35, 98.68) | 0.003 |
| Systolic blood pressure (mmHg) | 111 (103, 121) | 112 (104, 122) | 110 (102, 119) | <0.001 |
| Diastolic blood pressure (mmHg) | 61 (55, 67) | 61 (55, 68) | 60 (53, 67) | 0.002 |
| Mean blood pressure (mmHg) | 75 (70, 82) | 76 (70, 82) | 74 (68, 81) | <0.001 |
| Laboratory tests | ||||
| Lactate (mmol/L) | 2.10 (1.40, 3.43) | 1.97 (1.30, 3.20) | 2.45 (1.60, 4.23) | <0.001 |
| Albumin (g/dL) | 3.10 (2.60, 3.60) | 3.10 (2.65, 3.60) | 3.00 (2.45, 3.50) | <0.001 |
| Lactate/albumin ratio | 0.69 (0.44, 1.18) | 0.64 (0.42, 1.06) | 0.85 (0.52, 1.58) | <0.001 |
| Hematocrit (%) | 32 (28, 37) | 32 (28, 37) | 32 (27, 37) | 0.095 |
| Hemoglobin (g/dL) | 10.55 (9.12, 12.20) | 10.63 (9.24, 12.30) | 10.33 (8.90, 12.02) | <0.001 |
| Platelet (k/Ul) | 177 (116, 245) | 178 (120, 246) | 173 (106, 245) | 0.023 |
| White blood cell (k/uL) | 13 (9, 17) | 12 (9, 17) | 14 (10, 19) | <0.001 |
| Glucose (mmol/L) | 143 (116, 186) | 141 (116, 183) | 148 (117, 192) | 0.014 |
| Serum creatinine (mg/dL) | 1.28 (0.87, 2.16) | 1.20 (0.85, 2.05) | 1.50 (0.97, 2.37) | <0.001 |
| Blood urea nitrogen (mg/dL) | 26 (17, 43) | 24 (16, 39) | 31 (20, 50) | <0.001 |
| Anion gap (mEq/L) | 15.7 (13.2, 18.7) | 15.3 (13.0, 18.0) | 16.7 (14.0, 20.0) | <0.001 |
| Base excess (mmol/L) | −2.3 (−6.0, 0.0) | −2.0 (−5.5, 0.2) | −3.4 (−7.5, 0.0) | <0.001 |
| Bicarbonate (mEq/L) | 21.3 (18.2, 24.3) | 21.6 (18.7, 24.5) | 20.4 (17.2, 23.7) | <0.001 |
| Chloride (mEq/L) | 104 (100, 108) | 104 (101, 108) | 104 (99, 108) | 0.194 |
| Sodium (mg/dL) | 138.6 (135.5, 141.3) | 138.5 (135.8, 141.0) | 139.0 (135.0, 142.5) | 0.053 |
| Potassium (mg/dL) | 4.20 (3.87, 4.70) | 4.20 (3.85, 4.66) | 4.28 (3.88, 4.80) | 0.001 |
| Calcium (mg/dL) | 8.10 (7.60, 8.60) | 8.10 (7.63, 8.60) | 8.13 (7.56, 8.65) | 0.963 |
| Scoring systems | ||||
| CCI | 6.0 (4.0, 8.0) | 6.0 (4.0, 8.0) | 7.0 (5.0, 9.0) | <0.001 |
| SOFA | 4.0 (2.5, 6.0) | 4.0 (2.0, 5.0) | 4.0 (3.0, 6.0) | <0.001 |
| Comorbidities (%) | ||||
| Myocardial infarction | 750 (19.26) | 515 (18.50) | 235 (21.13) | 0.067 |
| Congestive heart failure | 1,263 (32.43) | 876 (31.48) | 387 (34.80) | 0.049 |
| Chronic pulmonary disease | 1,056 (27.11) | 752 (27.02) | 304 (27.34) | 0.872 |
| Liver disease | 1,052 (27.01) | 691 (24.83) | 361 (32.46) | <0.001 |
| Diabetes | 1,214 (31.17) | 890 (31.98) | 324 (29.14) | 0.091 |
| Renal disease | 903 (23.18) | 634 (22.78) | 269 (24.19) | 0.368 |
| Malignancy | 552 (14.17) | 333 (11.97) | 219 (19.69) | <0.001 |
| Interventions | ||||
| RRT use (%) | 675 (17.33) | 413 (14.84) | 262 (23.56) | <0.001 |
| AKI stage (%) | ||||
| 1 | 811 (20.82) | 640 (23.00) | 171 (15.38) | |
| 2 | 1703 (43.72) | 1,295 (46.53) | 408 (36.70) | |
| 3 | 1,381 (35.46) | 848 (30.47) | 533 (47.93) | |
Baseline characteristics of 3,895 participants between two groups.
CCI (Charlson comorbidity index), RRT (renal replacement therapy), SOFA (sequential organ failure assessment), AKI (acute kidney injury).
Kaplan–Meier survival curves
Figure 2 exhibits the cumulative survival rates in the four groups in accordance with LAR quartiles. Participants possessing a higher LAR showed a considerably poorer survival rate in comparison with those having a lower LAR (log-rank p < 0.001).
Figure 2
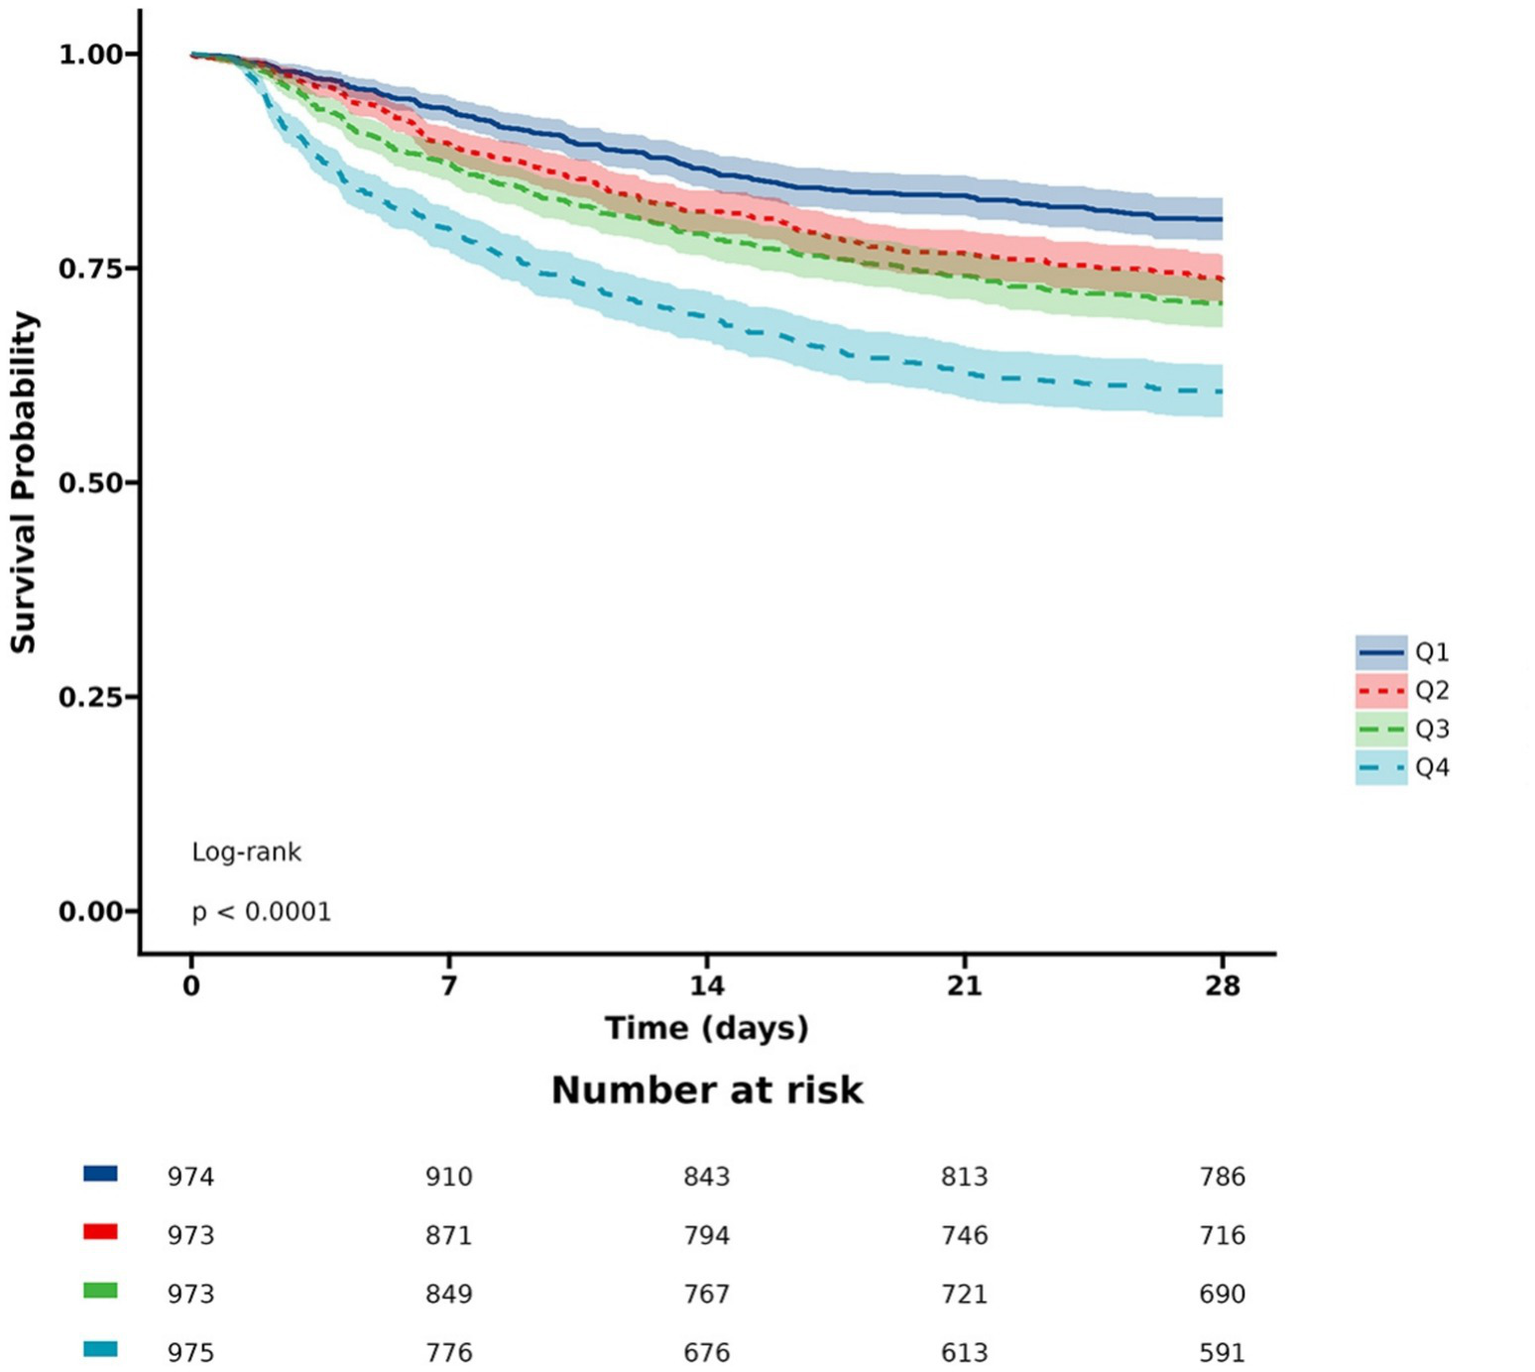
KM curves for 28-day mortality. LAR: Q1 (0.08–0.44), Q2 (0.44–0.69), Q3 (0.69–1.18), and Q4 (1.18–10.15).
The correlation between LAR and primary outcome
Subsequent to the univariate Cox regression analysis (detailed in Supplementary Table S1), three disparate multivariate models were constructed and applied to estimate the relation between LAR and the primary outcome. The analysis manifested that when LAR was regarded as a continuous variable, it had a strong relation with mortality risk within 28 days in three models (Model 1: HR: 1.327, 95% CI: 1.270–1.387, p < 0.001, Model 2: HR: 1.320, 95% CI: 1.264–1.379, p < 0.001, Model 3: HR: 1.224, 95% CI: 1.160–1.291, p < 0.001). When LAR was regarded as a nominal variable, the patients in the highest quartile demonstrated the highest 28-day death rate in the three established models (Model 1: HR: 2.412, 95% CI: 2.026–2.872, p < 0.001, Model 2: HR: 2.459, 95% CI: 2.064–2.929, p < 0.001, Model 3: HR: 1.837, 95% CI: 1.513–2.232, p < 0.001) (Table 3).
Table 3
| Categories | Model 1 | Model 2 | Model 3 | |||
|---|---|---|---|---|---|---|
| HR (95% CI) | p-value | HR (95% CI) | p-value | HR (95% CI) | p-value | |
| LAR as continuous | 1.327 (1.270, 1.387) | <0.001 | 1.320 (1.264, 1.379) | <0.001 | 1.224 (1.160, 1.291) | <0.001 |
| Quartile | ||||||
| Q1 | Ref (1) | Ref (1) | Ref (1) | |||
| Q2 | 1.425 (1.181, 1.720) | <0.001 | 1.364 (1.130, 1.648) | 0.001 | 1.245 (1.029, 1.508) | 0.025 |
| Q3 | 1.616 (1.344, 1.943) | <0.001 | 1.575 (1.310, 1.895) | <0.001 | 1.339 (1.105, 1.624) | 0.003 |
| Q4 | 2.412 (2.026, 2.872) | <0.001 | 2.459 (2.064, 2.929) | <0.001 | 1.837 (1.513, 2.232) | <0.001 |
| p for trend | <0.001 | <0.001 | <0.001 | |||
Multivariate Cox proportional hazards models of 28-day mortality.
Model 1: adjusted for no covariates. Model 2: adjusted for age, sex, and ethnicity. Model 3: on the basis of model 2 and further adjusted for HR, SpO2, SBP, DBP, hemoglobin, WBC, platelet, SCr, BUN, glucose, potassium, sodium, MI, CHF, malignancy, renal disease, diabetes, liver disease, RRT, SOFA score, and CCI.
ROC curve analysis
We plotted the ROC curves of five biomarkers (LAR, lactate, albumin, SOFA, and CCI) to estimate their predictive capability for mortality. As detailed in Table 4 and depicted in Figure 3, LAR’s AUC (0.6092, 95% CI: 0.5896–0.6288) was the highest in comparison with the other four indicators, including lactate (0.5982, 95% CI: 0.5785–0.6179), albumin (0.5584, 95% CI: 0.5382–0.5786), SOFA (0.5671, 95% CI: 0.5474–0.5869), and CCI (0.6089, 95% CI: 0.5895–0.6283). Therefore, LAR has a relatively better predictive performance. The results revealed that LAR exhibited a moderate diagnostic capacity of 28-day mortality. The ideal cutoff value was 0.83 with specificity of 63.7% and sensitivity of 52.2%.
Table 4
| Variables | AUC | 95% CI | Cutoff value | Sensitivity | Specificity |
|---|---|---|---|---|---|
| Lactate/albumin ratio | 0.6092 | 0.5896–0.6288 | 0.83 | 0.522 | 0.637 |
| Lactate | 0.5982 | 0.5785–0.6179 | 2.29 | 0.549 | 0.587 |
| Albumin | 0.5584 | 0.5382–0.5786 | 2.76 | 0.397 | 0.699 |
| Sequential organ failure assessment | 0.5671 | 0.5474–0.5869 | 3.50 | 0.621 | 0.480 |
| Charlson comorbidity index | 0.6089 | 0.5895–0.6283 | 6.50 | 0.528 | 0.617 |
Details regarding ROC curves.
Figure 3
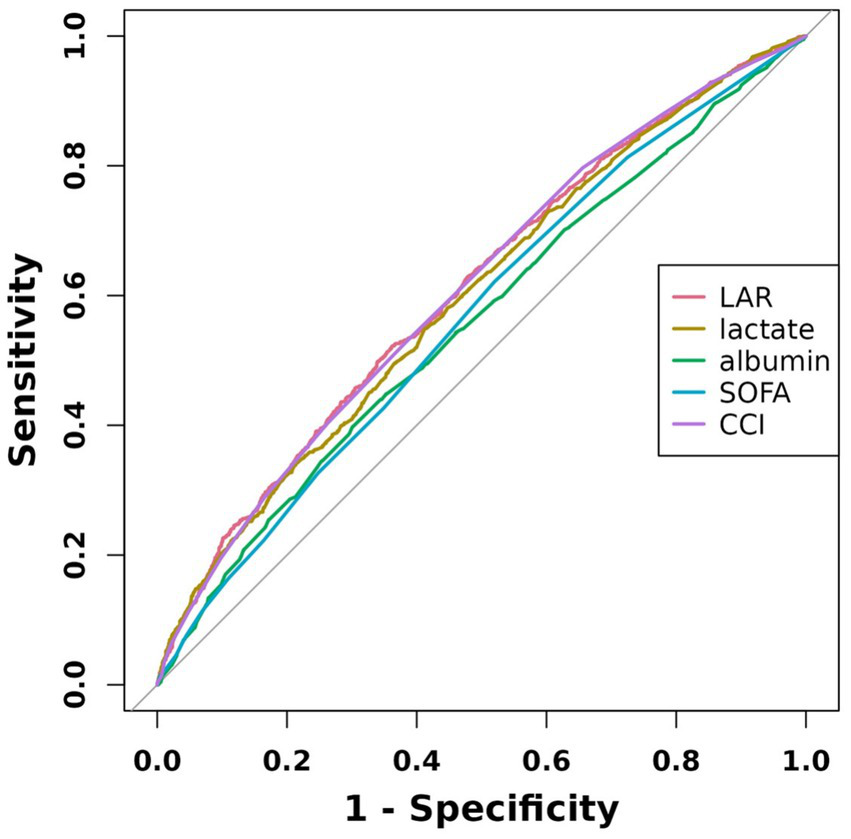
ROC curves of five indicators associated with 28-day mortality.
Analyses of the non-linear relationship
We observed the non-linear relation between LAR and the mortality using restricted cubic splines (p-non-linear < 0.05) (Figure 4). Subsequently, we analyzed the influence of LAR levels on the all-cause death rate within 28 days based on a two-part Cox proportional hazards model. An inflection point was identified at 0.30. When LAR was less than 0.30, no statistically significant link between LAR and the mortality was discovered (p > 0.05). However, when LAR exceeded 0.30, it was markedly and positively correlated with the risk of 28-day death. With every 1-unit increase in LAR, there was a 28% greater risk of 28-day mortality (Table 5).
Figure 4
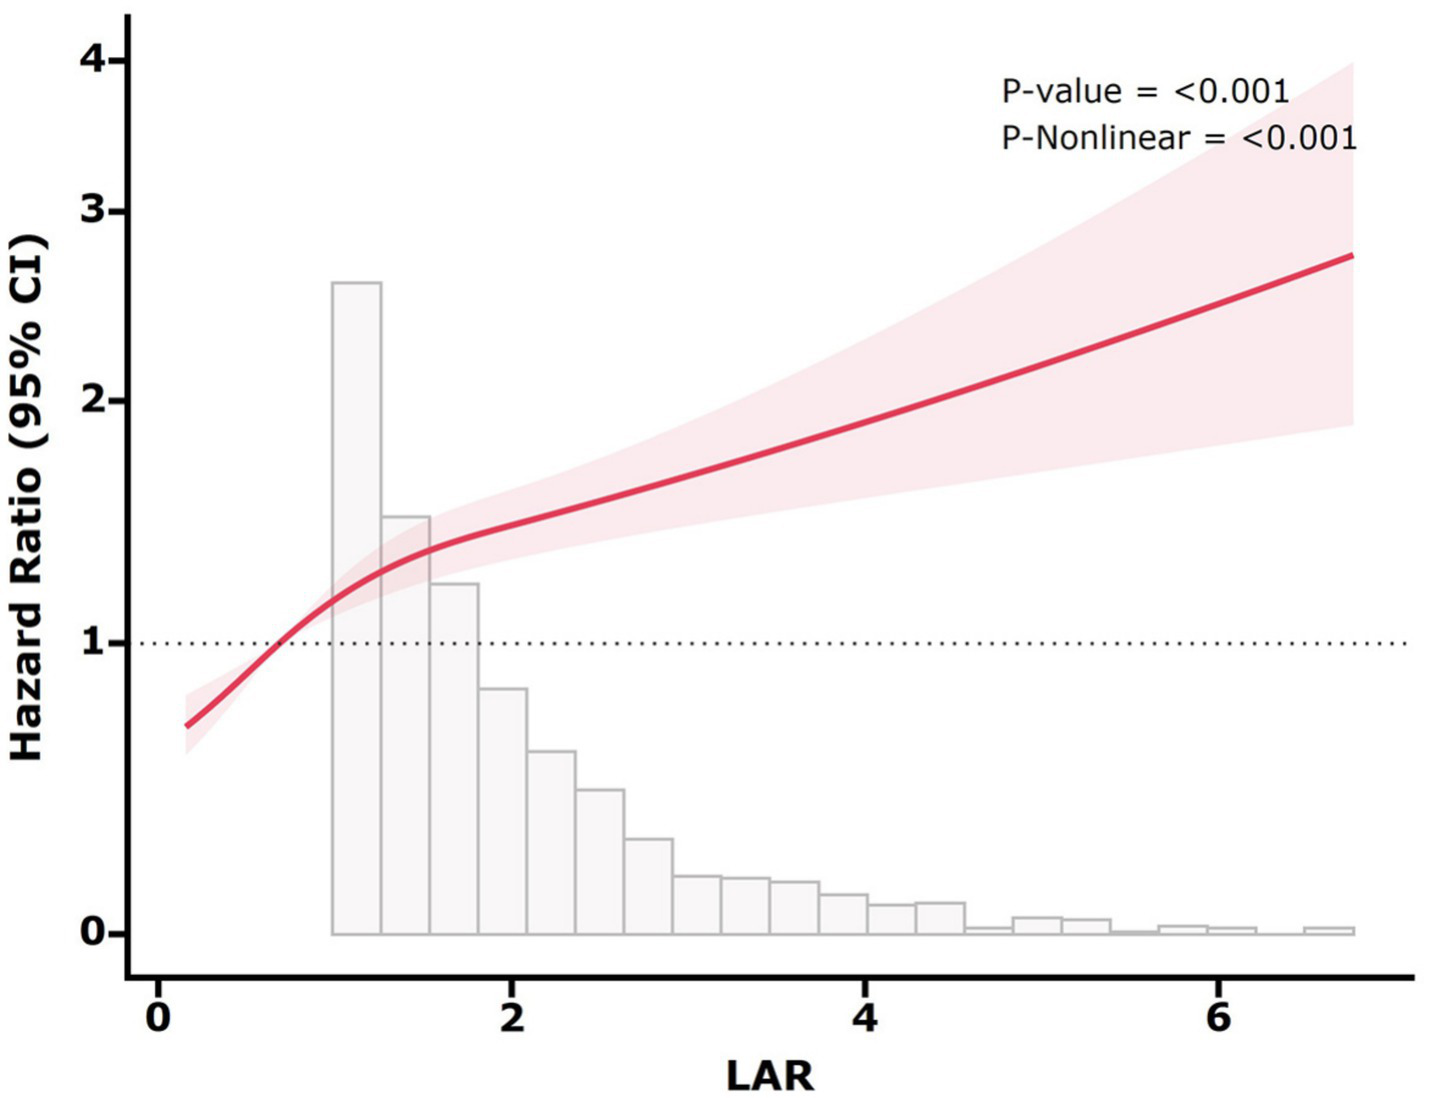
Restricted cubic spline for 28-day all-cause mortality. The red solid line represents the HR, and the shaded band represents the 95% CI. The model adjusted for age, sex, ethnicity, HR, SBP, DBP, SpO2, hemoglobin, platelet, WBC, BUN, SCr, glucose, sodium, potassium, MI, CHF, liver disease, renal disease, diabetes, malignancy, RRT, CCI, and SOFA.
Table 5
| LAR | HR (95% CI) | p-value |
|---|---|---|
| LAR (<0.3) | 1.08 (0.81–1.44) | 0.59 |
| LAR (≥0.3) | 1.28 (1.23–1.34) | <0.001 |
Impact of LAR level on 28-day mortality based on the two-part Cox proportional hazard model.
Subgroup analysis
The relationship between LAR and SA-AKI was stratified according to age, sex, ethnicity, MI, CHF, liver disease, renal disease, diabetes, and RRT (Table 6). We observed an interaction in the age and renal disease subgroups. Nevertheless, there was no interaction in the sex, ethnicity, MI, CHF, liver disease, diabetes, and RRT subgroups.
Table 6
| Subgroup | Total | Case (%) | HR (95% CI) | p-value | p for interaction |
|---|---|---|---|---|---|
| Age | <0.001 | ||||
| ≤65 | 1878 | 433 (23.06%) | 1.377 (1.270–1.492) | <0.001 | |
| >65 | 2017 | 679 (33.67%) | 1.135 (1.050–1.226) | 0.001 | |
| Sex | 0.876 | ||||
| Female | 1,613 | 465 (28.83%) | 1.194 (1.100–1.295) | <0.001 | |
| Male | 2,282 | 647 (28.35%) | 1.253 (1.164–1.348) | <0.001 | |
| Ethnicity | 0.494 | ||||
| White | 2,385 | 609 (25.53%) | 1.255 (1.159–1.359) | <0.001 | |
| Black | 336 | 82 (24.40%) | 1.317 (1.090–1.591) | 0.004 | |
| Other | 1,174 | 421 (35.86%) | 1.205 (1.105–1.314) | <0.001 | |
| MI | 0.832 | ||||
| No | 3,145 | 877 (27.89%) | 1.237 (1.165–1.313) | <0.001 | |
| Yes | 750 | 235 (31.33%) | 1.136 (1.000–1.291) | 0.051 | |
| CHF | 0.358 | ||||
| No | 2,632 | 725 (27.55%) | 1.254 (1.178–1.334) | <0.001 | |
| Yes | 1,263 | 387 (30.64%) | 1.164 (1.045–1.297) | 0.006 | |
| Liver disease | 0.405 | ||||
| No | 2,843 | 751 (26.42%) | 1.177 (1.090–1.271) | <0.001 | |
| Yes | 1,052 | 361 (34.32%) | 1.308 (1.207–1.416) | <0.001 | |
| Diabetes | 0.340 | ||||
| No | 2,681 | 788 (29.39%) | 1.262 (1.183–1.348) | <0.001 | |
| Yes | 1,214 | 324 (26.69%) | 1.147 (1.037–1.268) | 0.008 | |
| Renal disease | 0.041 | ||||
| No | 2,992 | 843 (28.18%) | 1.259 (1.187–1.336) | <0.001 | |
| Yes | 903 | 269 (29.79%) | 1.095 (0.948–1.266) | 0.219 | |
| RRT | 0.468 | ||||
| No | 3,220 | 850 (26.40%) | 1.231 (1.147–1.321) | <0.001 | |
| Yes | 675 | 262 (38.81%) | 1.216 (1.113–1.328) | <0.001 |
Subgroup analyses for the relationship of LAR with 28-day mortality.
MI (myocardial infarction), CHF (congestive heart failure), RRT (renal replacement therapy).
Discussion
In the present research, we observed a strong relation between LAR and 28-day mortality in SA-AKI patients. Even following confounding factor adjustment, the conclusion still held. Therefore, LAR may have the potential to be an independent indicator that can influence the prognosis and management decisions in patients with SA-AKI.
Lactate serves as a significant indicator for blood perfusion, tissue oxygenation, and metabolism in the body (28). Hyperlactacidemia occurs in the situation of an imbalance between lactic acid production and metabolism (29). Recent investigations have found that elevated lactate levels are related to adverse outcomes among septic shock patients and extremely high mortality in ICU (30, 31). Our study found that in contrast to the survival cohort, the lactate levels in the non-survival group were significantly higher (p < 0.001). However, the fluctuations in lactate levels, which can be caused by multiple factors, are thereby rather intricate. For instance, among individuals suffering from liver diseases, lactate metabolism disorder is a common phenomenon (15). In addition, some drugs such as metformin or salbutamol can lead to abnormal elevations of lactate (16). Furthermore, in certain individuals with critical condition, it is particularly noteworthy that they may exhibit significantly lower lactate levels (32). Thus, merely using lactate for forecasting is inaccurate.
Serum albumin, as a negative acute phase reactant, is capable of reflecting the inflammatory level and systemic nutritional status. It performs a vital part in facilitating the transport of hormones and drugs, maintaining plasma oncotic pressure, and acting as a pH buffer. Recent research studies have discovered that the albumin level is strongly related to the adverse outcomes of sepsis patients (33, 34). A previous investigation already demonstrated a significant relation between hypoproteinemia and the poor prognosis in AKI patients (35). However, since chronic disease states, nutritional intervention measures, and inflammatory responses can influence the levels of serum albumin (36), relying solely on albumin may have some limitations. In this study, we used LAR to increase the precision in predicting the prognosis among SA-AKI patients. By means of the reverse changes from the two distinct mechanisms, the influence of an individual element on the modulatory mechanism was reduced.
LAR, a comprehensive indicator, simultaneously takes into account the inflammatory and nutritional condition and has become an important biomarker for forecasting the prognosis of diverse diseases. Some research studies have found that increased LAR is related to the development of multiple organ dysfunction syndrome and increased risk of mortality among patients suffering from severe sepsis and septic shock (37, 38). It is noteworthy that Michael et al. suggested using LAR as a better prognostic factor to stratify patients with sepsis in accordance with disease severity (39). In addition, LAR was related to poor prognosis in heart failure, myocardial infarction, and acute pancreatitis (19–24). Therefore, LAR can be applied as a potent clinical indicator for forecasting the outcome in SA-AKI patients. Analyzing the database, our study found a significant relation between an elevated LAR and a higher 28-day death rate in SA-AKI patients.
The RCS analysis demonstrated a non-linear association between LAR and 28-day mortality in SA-AKI patients, with an inflection point at 0.30. Although the precise biological mechanisms remain to be elucidated, LAR levels below 0.30 may reflect a compensatory state in which homeostatic mechanisms partially counteract the detrimental effects of sepsis and renal injury. In contrast, LAR exceeding this threshold suggests severe physiological derangement, characterized by impaired tissue oxygenation and microcirculatory dysfunction, thereby increasing the mortality rate. Clinically, this inflection point serves as a critical prognostic indicator. Physicians should consider intensified monitoring and early intervention when LAR approaches or surpasses 0.30. Therefore, our findings could enhance the utility of LAR in risk stratification and clinical decision-making for SA-AKI patients.
The subgroup analysis indicated that the prognostic capacity of LAR was more significant in the subgroups of patients without renal disease and aged ≤ 65 years (p for interaction < 0.05). Our study revealed that patients without underlying diseases (including MI, CHF, diabetes, and renal disease) had higher mortality risk within 28 days. This might be due to reverse causality. That is to say, patients with these diseases are given more intensive treatment. Meanwhile, abnormal LAR in these patients is corrected more promptly. In addition, LAR had a significant relation with higher mortality risk within 28 days in patients without renal disease. The reason for this inconsistent result may be that patients with renal disease are more likely to have adequate renal perfusion before SA-AKI occurs. Another interesting finding was that the prognostic capacity of LAR was extremely prominent in patients aged 65 years or younger. In contrast to the general perception, clinicians may focus more on elderly patients because of their greater prevalence of comorbidities. Nevertheless, our study advocated for giving equal attention to young patients as their mortality rate may be higher.
Cakir et al. demonstrated that LAR (AUC = 0.869) was better at predicting in-hospital mortality than albumin (AUC = 0.812) and lactate (AUC = 0.816) separately (40). Shin et al. reported that among 946 patients diagnosed with sepsis, LAR exhibited a better predictive capacity for 28-day mortality compared to lactate (41). Yoo et al. reported that LAR (AUC = 0.715) was better at forecasting mortality rate within 28 days compared to SOFA score (AUC = 0.669) in patients with sepsis and septic shock (42). These outcomes are in line with the conclusion of our research. Therefore, our findings may assist clinicians to make a more accurate assessment of the severity and prognosis for SA-AKI, allowing for earlier intervention and better management of patients. However, it is important to note that while LAR showed predictive potential for 28-day mortality in SA-AKI patients, its discriminative performance remained moderate. Consequently, LAR should be utilized as part of a comprehensive evaluation rather than a sole factor for clinical decision-making.
The mechanism explaining the correlation between LAR and SA-AKI has not been fully elucidated. During SA-AKI, the systemic inflammatory response caused by sepsis can cause microcirculatory disorders, resulting in insufficient perfusion of kidney, and a large amount of pyruvate is converted into lactate. Meanwhile, sepsis can directly damage cell mitochondria and affect the oxidative phosphorylation function, leading to metabolism shifts from oxidative phosphorylation to aerobic glycolysis, thereby promoting the generation of lactate (43). Albumin maintains renal function by maintaining hemodynamic stability, exerting an antioxidant effect, binding harmful substances, and regulating inflammation (44). Moreover, albumin can contribute to promoting the synthesis of DNA in renal tubular cells through a specific signaling pathway associated with Ca2+ (45). Individuals diagnosed with SA-AKI usually have a decrease in serum albumin levels. This is attributed to damage to the glomerular filtration membrane and increased permeability and inflammatory responses. Consequently, LAR may have potential benefits in forecasting the prognosis of SA-AKI patients as it combines the reverse changes caused by the different mechanisms of two independent predictors.
However, it is essential to recognize the limitations of the research. First, this retrospective investigation depended on observational research, and thus, a definitive causal relationship could not be established. Second, despite the adjustment for confounding variables, potential residual confounding factors could still affect the findings. Third, using multiple imputation for variables with less than 20% missing values may also introduce additional uncertainty and potentially affect the accuracy of our conclusion. Finally, the study solely concentrated on assessing baseline LAR. Further research is required to verify whether changes in LAR can also predict mortality. Therefore, future research efforts should consider using prospective or randomized controlled trials to determine causality and broaden the research scope, thereby verifying and strengthening the obtained findings.
Conclusion
In summary, LAR can be applied as a potential predictor for 28-day all-cause mortality in those with SA-AKI. Monitoring LAR could contribute to treatment decisions, disease management, and prognostic assessment in clinical practice. Future research is necessary to investigate whether better control of LAR can lead to improved clinical outcomes.
Statements
Data availability statement
The raw data supporting the conclusions of this article will be made available by the authors, without undue reservation.
Author contributions
SH: Data curation, Investigation, Methodology, Resources, Software, Visualization, Writing – original draft, Writing – review & editing. YW: Investigation, Methodology, Software, Supervision, Validation, Writing – review & editing. SW: Formal analysis, Investigation, Validation, Visualization, Writing – review & editing. SY: Project administration, Supervision, Validation, Visualization, Writing – review & editing.
Funding
The author(s) declare that no financial support was received for the research and/or publication of this article.
Acknowledgments
We acknowledged the contributions of the MIMIC-IV program registry in the creation and update of the MIMIC IV database.
Conflict of interest
The authors declare that the research was conducted in the absence of any commercial or financial relationships that could be construed as a potential conflict of interest.
Generative AI statement
The author(s) declare that no Gen AI was used in the creation of this manuscript.
Publisher’s note
All claims expressed in this article are solely those of the authors and do not necessarily represent those of their affiliated organizations, or those of the publisher, the editors and the reviewers. Any product that may be evaluated in this article, or claim that may be made by its manufacturer, is not guaranteed or endorsed by the publisher.
Supplementary material
The Supplementary material for this article can be found online at: https://www.frontiersin.org/articles/10.3389/fmed.2025.1546112/full#supplementary-material
References
1.
Singer M Deutschman CS Seymour CW Shankar-Hari M Annane D Bauer M et al . The third international consensus definitions for Sepsis and septic shock (Sepsis-3). JAMA. (2016) 315:801–10. doi: 10.1001/jama.2016.0287
2.
Uchino S Kellum JA Bellomo R Doig GS Morimatsu H Morgera S et al . Acute renal failure in critically ill patients: a multinational, multicenter study. JAMA. (2005) 294:813–8. doi: 10.1001/jama.294.7.813
3.
Hoste EAJ Bagshaw SM Bellomo R Cely CM Colman R Cruz DN et al . Epidemiology of acute kidney injury in critically ill patients: the multinational AKI-EPI study. Intensive Care Med. (2015) 41:1411–23. doi: 10.1007/s00134-015-3934-7
4.
Bagshaw SM Uchino S Bellomo R Morimatsu H Morgera S Schetz M et al . Septic acute kidney injury in critically ill patients: clinical characteristics and outcomes. Clin J Am Soc Nephrol. (2007) 2:431–9. doi: 10.2215/CJN.03681106
5.
Bagshaw SM George C Bellomo R . Early acute kidney injury and sepsis: a multicentre evaluation. Crit Care. (2008) 12:R47. doi: 10.1186/cc6863
6.
Xu X Nie S Liu Z Chen C Xu G Zha Y et al . Epidemiology and clinical correlates of AKI in Chinese hospitalized adults. Clin J Am Soc Nephrol. (2015) 10:1510–8. doi: 10.2215/CJN.02140215
7.
Cruz MG Dantas JG Levi TM Rocha Mde S de Souza SP Boa-Sorte N et al . Septic versus non-septic acute kidney injury in critically ill patients: characteristics and clinical outcomes. Rev Bras Ter Intensiva. (2014) 26:384–91. doi: 10.5935/0103-507X.20140059
8.
Peerapornratana S Manrique-Caballero CL Gómez H Kellum JA . Acute kidney injury from sepsis: current concepts, epidemiology, pathophysiology, prevention and treatment. Kidney Int. (2019) 96:1083–99. doi: 10.1016/j.kint.2019.05.026
9.
Shum HP Kong HH Chan KC Kong HH-Y Yan W-W Chan TM . Septic acute kidney injury in critically ill patients—a single-center study on its incidence, clinical characteristics, and outcome predictors. Ren Fail. (2016) 38:706–16. doi: 10.3109/0886022X.2016.1157749
10.
Alobaidi R Basu RK Goldstein SL Bagshaw SM . Sepsis-associated acute kidney injury. Semin Nephrol. (2015) 35:2–11. doi: 10.1016/j.semnephrol.2015.01.002
11.
Hsu YC Hsu CW . Septic acute kidney injury patients in emergency department: the risk factors and its correlation to serum lactate. Am J Emerg Med. (2019) 37:204–8. doi: 10.1016/j.ajem.2018.05.012
12.
Langenberg C Wan L Bagshaw SM Egi M May CN Bellomo R . Urinary biochemistry in experimental septic acute renal failure. Nephrol Dial Transplant. (2006) 21:3389–97. doi: 10.1093/ndt/gfl541
13.
Langenberg C Wan L Egi M May CN Bellomo R . Renal blood flow in experimental septic acute renal failure. Kidney Int. (2006) 69:1996–2002. doi: 10.1038/sj.ki.5000440
14.
James JH Luchette FA McCarter FD Fischer JE . Lactate is an unreliable indicator of tissue hypoxia in injury or sepsis. Lancet. (1999) 354:505–8. doi: 10.1016/S0140-6736(98)91132-1
15.
Katopodis P Pappas EM Katopodis KP . Acid-base abnormalities and liver dysfunction. Ann Hepatol. (2022) 27:100675. doi: 10.1016/j.aohep.2022.100675
16.
Park J Hwang SY Jo IJ Jeon K Suh GY Lee TR et al . Impact of metformin use on lactate kinetics in patients with severe Sepsis and septic shock. Shock. (2017) 47:582–7. doi: 10.1097/SHK.0000000000000782
17.
Yin M Si L Qin W Li C Zhang J Yang H et al . Predictive value of serum albumin level for the prognosis of severe Sepsis without exogenous human albumin administration: a prospective cohort study. J Intensive Care Med. (2018) 33:687–94. doi: 10.1177/0885066616685300
18.
Murat SN Kurtul A Yarlioglues M . Impact of serum albumin levels on contrast-induced acute kidney injury in patients with acute coronary syndromes treated with percutaneous coronary intervention. Angiology. (2015) 66:732–7. doi: 10.1177/0003319714551979
19.
Liu Q Zheng HL Wu MM Wang QZ Yan SJ Wang M et al . Association between lactate-to-albumin ratio and 28-days all-cause mortality in patients with acute pancreatitis: a retrospective analysis of the MIMIC-IV database. Front Immunol. (2022) 13:1076121. doi: 10.3389/fimmu.2022.1076121
20.
Zhong Y Sun H Chen H Jing W Chen W Ma J . Association between lactate/albumin ratio and 28-day all-cause mortality in ischemic stroke patients without reperfusion therapy: a retrospective analysis of the MIMIC-IV database. Front Neurol. (2023) 14:1271391. doi: 10.3389/fneur.2023.1271391
21.
Chen Y Lai W Yang K Wu B Xie D Peng C . Association between lactate/albumin ratio and prognosis in patients with acute myocardial infarction. Eur J Clin Investig. (2024) 54:e14094. doi: 10.1111/eci.14094
22.
Guo W Zhao L Zhao H Zeng F Peng C Guo W et al . The value of lactate/albumin ratio for predicting the clinical outcomes of critically ill patients with heart failure. Ann Transl Med. (2021) 9:118. doi: 10.21037/atm-20-4519
23.
Chen S Guan S Yan Z Ouyang F Li S Liu L et al . The lactate to albumin ratio linked to all-cause mortality in critically ill patients with septic myocardial injury. Front Cardiovasc Med. (2023) 10:1233147. doi: 10.3389/fcvm.2023.1233147
24.
Ren J Kang Q Wang F Yu W . Association of lactate/albumin ratio with in-hospital mortality in ICU patients with acute respiratory failure: a retrospective analysis based on MIMIC-IV database. Medicine. (2023) 102:e35410. doi: 10.1097/MD.0000000000035410
25.
Johnson AEW Bulgarelli L Shen L Gayles A Shammout A Horng S et al . MIMIC-IV, a freely accessible electronic health record dataset. Sci Data. (2023) 10:1. doi: 10.1038/s41597-022-01899-x
26.
Khwaja A . KDIGO clinical practice guidelines for acute kidney injury. Nephron Clin Pract. (2012) 120:c179–84. doi: 10.1159/000339789
27.
Stekhoven DJ Bühlmann P . Missforest--non-parametric missing value imputation for mixed-type data. Bioinformatics. (2012) 28:112–8. doi: 10.1093/bioinformatics/btr597
28.
Suetrong B Walley KR . Lactic acidosis in sepsis: it’s not all anaerobic: implications for diagnosis and management. Chest. (2016) 149:252–61. doi: 10.1378/chest.15-1703
29.
Kraut JA Madias NE . Lactic acidosis. N Engl J Med. (2014) 371:2309–19. doi: 10.1056/NEJMra1309483
30.
Gharipour A Razavi R Gharipour M Modarres R Nezafati P Mirkheshti N . The incidence and outcome of severe hyperlactatemia in critically ill patients. Intern Emerg Med. (2021) 16:115–23. doi: 10.1007/s11739-020-02337-9
31.
Yang X Zhou Y Liu A Pu Z . Relationship between dynamic changes of microcirculation flow, tissue perfusion parameters, and lactate level and mortality of septic shock in ICU. Contrast Media Mol Imaging. (2022) 2022:1192902. doi: 10.1155/2022/1192902
32.
Bou Chebl R Geha M Assaf M Kattouf N Haidar S Abdeldaem K et al . The prognostic value of the lactate/albumin ratio for predicting mortality in septic patients presenting to the emergency department: a prospective study. Ann Med. (2021) 53:2268–77. doi: 10.1080/07853890.2021.2009125
33.
Turcato G Zaboli A Sibilio S Rella E Bonora A Brigo F . Albumin as a prognostic marker of 30-day mortality in septic patients admitted to the emergency department. Intern Emerg Med. (2023) 18:2407–17. doi: 10.1007/s11739-023-03387-5
34.
Hu J Lv C Hu X Liu J . Effect of hypoproteinemia on the mortality of sepsis patients in the ICU: a retrospective cohort study. Sci Rep. (2021) 11:24379. doi: 10.1038/s41598-021-03865-w
35.
Wiedermann CJ Wiedermann W Joannidis M . Hypoalbuminemia and acute kidney injury: a meta-analysis of observational clinical studies. Intensive Care Med. (2010) 36:1657–65. doi: 10.1007/s00134-010-1928-z
36.
Gharipour A Razavi R Gharipour M Mukasa D . Lactate/albumin ratio: an early prognostic marker in critically ill patients. Am J Emerg Med. (2020) 38:2088–95. doi: 10.1016/j.ajem.2020.06.067
37.
Wang B Chen G Cao Y Xue J Li J Wu Y . Correlation of lactate/albumin ratio level to organ failure and mortality in severe sepsis and septic shock. J Crit Care. (2015) 30:271–5. doi: 10.1016/j.jcrc.2014.10.030
38.
Sai IN Prasad R T V . Assessing the prognostic value of Crp/albumin ratio and lactate/albumin ratio in critically ill patients. J Assoc Physicians India. (2022) 70:11–2.
39.
Lichtenauer M Wernly B Ohnewein B Franz M Kabisch B Muessig J et al . The lactate/albumin ratio: a valuable tool for risk stratification in septic patients admitted to ICU. Int J Mol Sci. (2017) 18:1893. doi: 10.3390/ijms18091893
40.
Cakir E Turan IO . Lactate/albumin ratio is more effective than lactate or albumin alone in predicting clinical outcomes in intensive care patients with sepsis. Scand J Clin Lab Invest. (2021) 81:225–9. doi: 10.1080/00365513.2021.1901306
41.
Shin J Hwang SY Jo IJ Kim WY Ryoo SM Kang GH et al . Prognostic value of the lactate/albumin ratio for predicting 28-day mortality in critically ILL Sepsis patients. Shock. (2018) 50:545–50. doi: 10.1097/SHK.0000000000001128
42.
Yoo KH Choi SH Suh GJ Chung SP Choi HS Park YS et al . The usefulness of lactate/albumin ratio, C-reactive protein/albumin ratio, procalcitonin/albumin ratio, SOFA, and qSOFA in predicting the prognosis of patients with sepsis who presented to EDs. Am J Emerg Med. (2024) 78:1–7. doi: 10.1016/j.ajem.2023.12.028
43.
Tan C Gu J Li T Chen H Liu K Liu M et al . Inhibition of aerobic glycolysis alleviates sepsis-induced acute kidney injury by promoting lactate/Sirtuin 3/AMPK-regulated autophagy. Int J Mol Med. (2021) 47:19. doi: 10.3892/ijmm.2021.4852
44.
Iglesias J Abernethy VE Wang Z Lieberthal W Koh JS Levine JS . Albumin is a major serum survival factor for renal tubular cells and macrophages through scavenging of ROS. Am J Phys. (1999) 277:F711–22. doi: 10.1152/ajprenal.1999.277.5.F711
45.
Lee YJ Han HJ . Albumin-stimulated DNA synthesis is mediated by Ca2+/PKC as well as EGF receptor-dependent p44/42 MAPK and NF-kappaB signal pathways in renal proximal tubule cells. Am J Physiol Renal Physiol. (2008) 294:F534–41. doi: 10.1152/ajprenal.00408.2007
Summary
Keywords
sepsis-associated acute kidney injury, lactate/albumin ratio, mortality, 28-day, MIMIC-IV
Citation
He S, Wang Y, Wei S and Yang S (2025) Correlation between lactate/albumin ratio and 28-day mortality in sepsis-associated acute kidney injury patients. Front. Med. 12:1546112. doi: 10.3389/fmed.2025.1546112
Received
16 December 2024
Accepted
13 May 2025
Published
05 June 2025
Volume
12 - 2025
Edited by
Stefano Busani, University Hospital of Modena, Italy
Reviewed by
Feng Shen, Affiliated Hospital of Guizhou Medical University, China
Xihui Yu, Second Affiliated Hospital of Shantou University Medical College, China
Updates
Copyright
© 2025 He, Wang, Wei and Yang.
This is an open-access article distributed under the terms of the Creative Commons Attribution License (CC BY). The use, distribution or reproduction in other forums is permitted, provided the original author(s) and the copyright owner(s) are credited and that the original publication in this journal is cited, in accordance with accepted academic practice. No use, distribution or reproduction is permitted which does not comply with these terms.
*Correspondence: Shifeng Yang, jeffysy@qq.com
Disclaimer
All claims expressed in this article are solely those of the authors and do not necessarily represent those of their affiliated organizations, or those of the publisher, the editors and the reviewers. Any product that may be evaluated in this article or claim that may be made by its manufacturer is not guaranteed or endorsed by the publisher.