 Biao Wu1†
 Huanhua Wu2†
 Zheng Wang1Zhiqiang Tan1Bin Guo1
 Jingjie Shang1Yong Cheng1Chunyuan Zeng1
 Yuanfang Jiang1Qijun Cai1
 Jian Gong1*
 Hao Xu1*
- 1Department of Nuclear Medicine, The First Affiliated Hospital of Jinan University, Guangzhou, Guangdong, China
- 2Central Laboratory, The Affiliated Shunde Hospital of Jinan University, Foshan, Guangdong, China
Background: Pre-dialysis chronic kidney disease (CKD) Patients show a markedly elevated risk of fractures, and BMD assessments offer only limited insights into their bone health. The trabecular bone score (TBS), a newly introduced parameter for evaluating bone microarchitecture, is recommended for studying bone health under this context.
Methods: A total of 46 subjects were included in the control group, and 136 patients were included in the CKD group. All participants underwent laboratory examinations, Dual energy X-ray absorptiometry (DXA) scans, and medical history reviews. The relationships between TBS and demographic characteristics, history of fractures, LS-BMD, FN-BMD, and laboratory parameters were analyzed.
Results: Age, gender, and BMI were matched between the control and CKD groups (P > 0.05). The control group had an average age of 64.96 ± 7.76 years with 27 females (58.70%), while the CKD group had an average age of 64.42 ± 10.90 years with 66 females (48.53%). Among the CKD group, 43 patients had fractures. In both control and CKD participants, when BMD was normal or osteopenia, TBS frequently indicated partially reduced bone microarchitecture or reduced bone microarchitecture, a statistically significant finding (P < 0.05). In CKD fracture patients with normal or osteopenic BMD, several patients had TBS classified as degraded or degraded trabecular bone, and among this population, the number of individuals classified as having partially reduced bone microarchitecture or reduced bone microarchitecture based on the TBS (China reference range) is higher than the number classified under the TBS (META reference range). Furthermore, except for the FN-BMD (Osteoporosis) group, TBS-incorporated models significantly improved fracture discrimination across other groups (P < 0.05).
Conclusion: In pre-dialysis CKD patients with normal or reduced BMD, TBS is significantly associated with fracture risk. Additional evaluation of bone microstructure using TBS enhances fracture risk identification, particularly in patients with relatively high BMD.
Introduction
Chronic kidney disease (CKD) is a major global health concern, affecting approximately 11–13% of the population worldwide. Its consequences extend beyond the progressive decline in renal function, also impacting bone health (1). Chronic kidney disease-mineral and bone disorder (CKD-MBD) is a common complication of CKD, which increases the risk of osteoporosis and fractures. The pathophysiology of CKD-MBD is complex, primarily involving metabolic disturbances in vitamin D, phosphate, and calcium (2). Key features of CKD-MBD include reduced bone mineral density and alterations in bone microarchitecture, leading to bone fragility and a higher risk of fractures (3).
Bone biopsy is considered the gold standard for diagnosing CKD-MBD in patients with CKD. However, its clinical application is limited by concerns regarding invasiveness, high cost, and patient acceptance. Dual-energy X-ray absorptiometry (DXA) is widely recognized as the standard method for assessing bone mineral density (BMD) and received a 2B recommendation in the 2017 KDIGO update on CKD-MBD clinical practice guidelines (4). However, the anteroposterior DXA projection for the lumbar spine does not account for factors such as osteophytes, small joint sclerosis, and abdominal aortic calcification (AAC), which may lead to an overestimation of lumbar spine BMD values. This limitation can also result in discrepancies between lumbar spine BMD (LS-BMD) and femoral neck BMD (FN-BMD) measurements. Furthermore, BMD measurements do not capture microstructural changes in bone quality (5, 6).
Trabecular Bone Score (TBS) is a technique used to analyze the structure of standard lumbar DXA images, providing insights into bone microarchitecture that bone mineral density (BMD) alone cannot offer. A higher TBS value is indicative of better bone microstructure, whereas a lower TBS value correlates with weaker bone microarchitecture. Moreover, TBS offers several advantages over non-DXA tests and bone biomarkers (7), including cost-effectiveness, non-invasiveness, and ease of clinical implementation. According to a recent meta-analysis, TBS values are categorized as normal (TBS ≥ 1.35), partially reduced bone microarchitecture (TBS 1.21–1.34), reduced bone microarchitecture (TBS ≤ 1.20) (8). Considering the influence of factors such as ethnicity and geographic region, our team has developed a TBS reference range specific to mainland China. In Chinese men, TBS values are categorized as normal (TBS ≥ 1.39), partially reduced bone microarchitecture (TBS 1.31–1.39), reduced bone microarchitecture (TBS ≤ 1.31). In Chinese women, TBS values are categorized as normal (TBS ≥ 1.35), partially reduced bone microarchitecture (TBS 1.27–1.35), reduced bone microarchitecture (TBS ≤ 1.27) (9).
To date, studies evaluating the use of TBS in patients with CKD remain limited. Existing research indicates that TBS is significantly lower in the dialysis-dependent CKD population, with lower TBS values associated with a higher incidence of fractures or an increased risk of new fractures in CKD patients (10, 11). However, there is a paucity of studies focusing on pre-dialysis CKD patients, particularly regarding the reduction in TBS in those with normal bone mineral density, a topic that remains underexplored. Furthermore, no studies have been conducted on the establishment of a TBS reference range for the Chinese population in relation to bone quality in CKD patients.
Thus, we conducted a retrospective study using DXA to measure parameters such as LS-BMD, FN-BMD, and TBS (L1–4) in pre-dialysis CKD patients. The study involved stratifying CKD patients to evaluate their bone health and explore the clinical significance of these indicators, enabling healthcare providers to identify CKD patients at higher risk for bone health complications in a timely manner.
Materials and methods
Study population
This is a single-center retrospective observational study. The study participants were pre-dialysis CKD patients recruited from the Affiliated Hospital of Jinan University from December 2021 to December 2022. During this time, we also recruited a control group of individuals with normal kidney function (estimated glomerular filtration rate [eGFR] ≥ 90 mL/min/1.73 m2), who were matched with CKD patients based on age and gender. The inclusion criteria for participants were as follows: (1) male patients aged over 50 years or postmenopausal female patients; (2) Patients with CKD who are not yet on dialysis. According to the 2012 KDIGO clinical practice guidelines on chronic kidney disease evaluation and management, CKD is defined as persistent abnormalities in kidney structure or function for over 3 months, with adverse effects on health; (3) signed informed consent. Exclusion criteria included: (1) a history of malignant tumors; (2) use of glucocorticoids or immunosuppressants for more than 3 months in the past 5 years; (3) a history of parathyroidectomy; (4) underweight (BMI < 18 kg/m2) or obesity (BMI > 30 kg/m2); (5) patients diagnosed with acute renal decline during hospitalization; (6) control group members diagnosed with diseases affecting bone health, such as thyroid dysfunction or rheumatic diseases. In total, 136 CKD patients and 46 controls were included in the study (Figure 1).
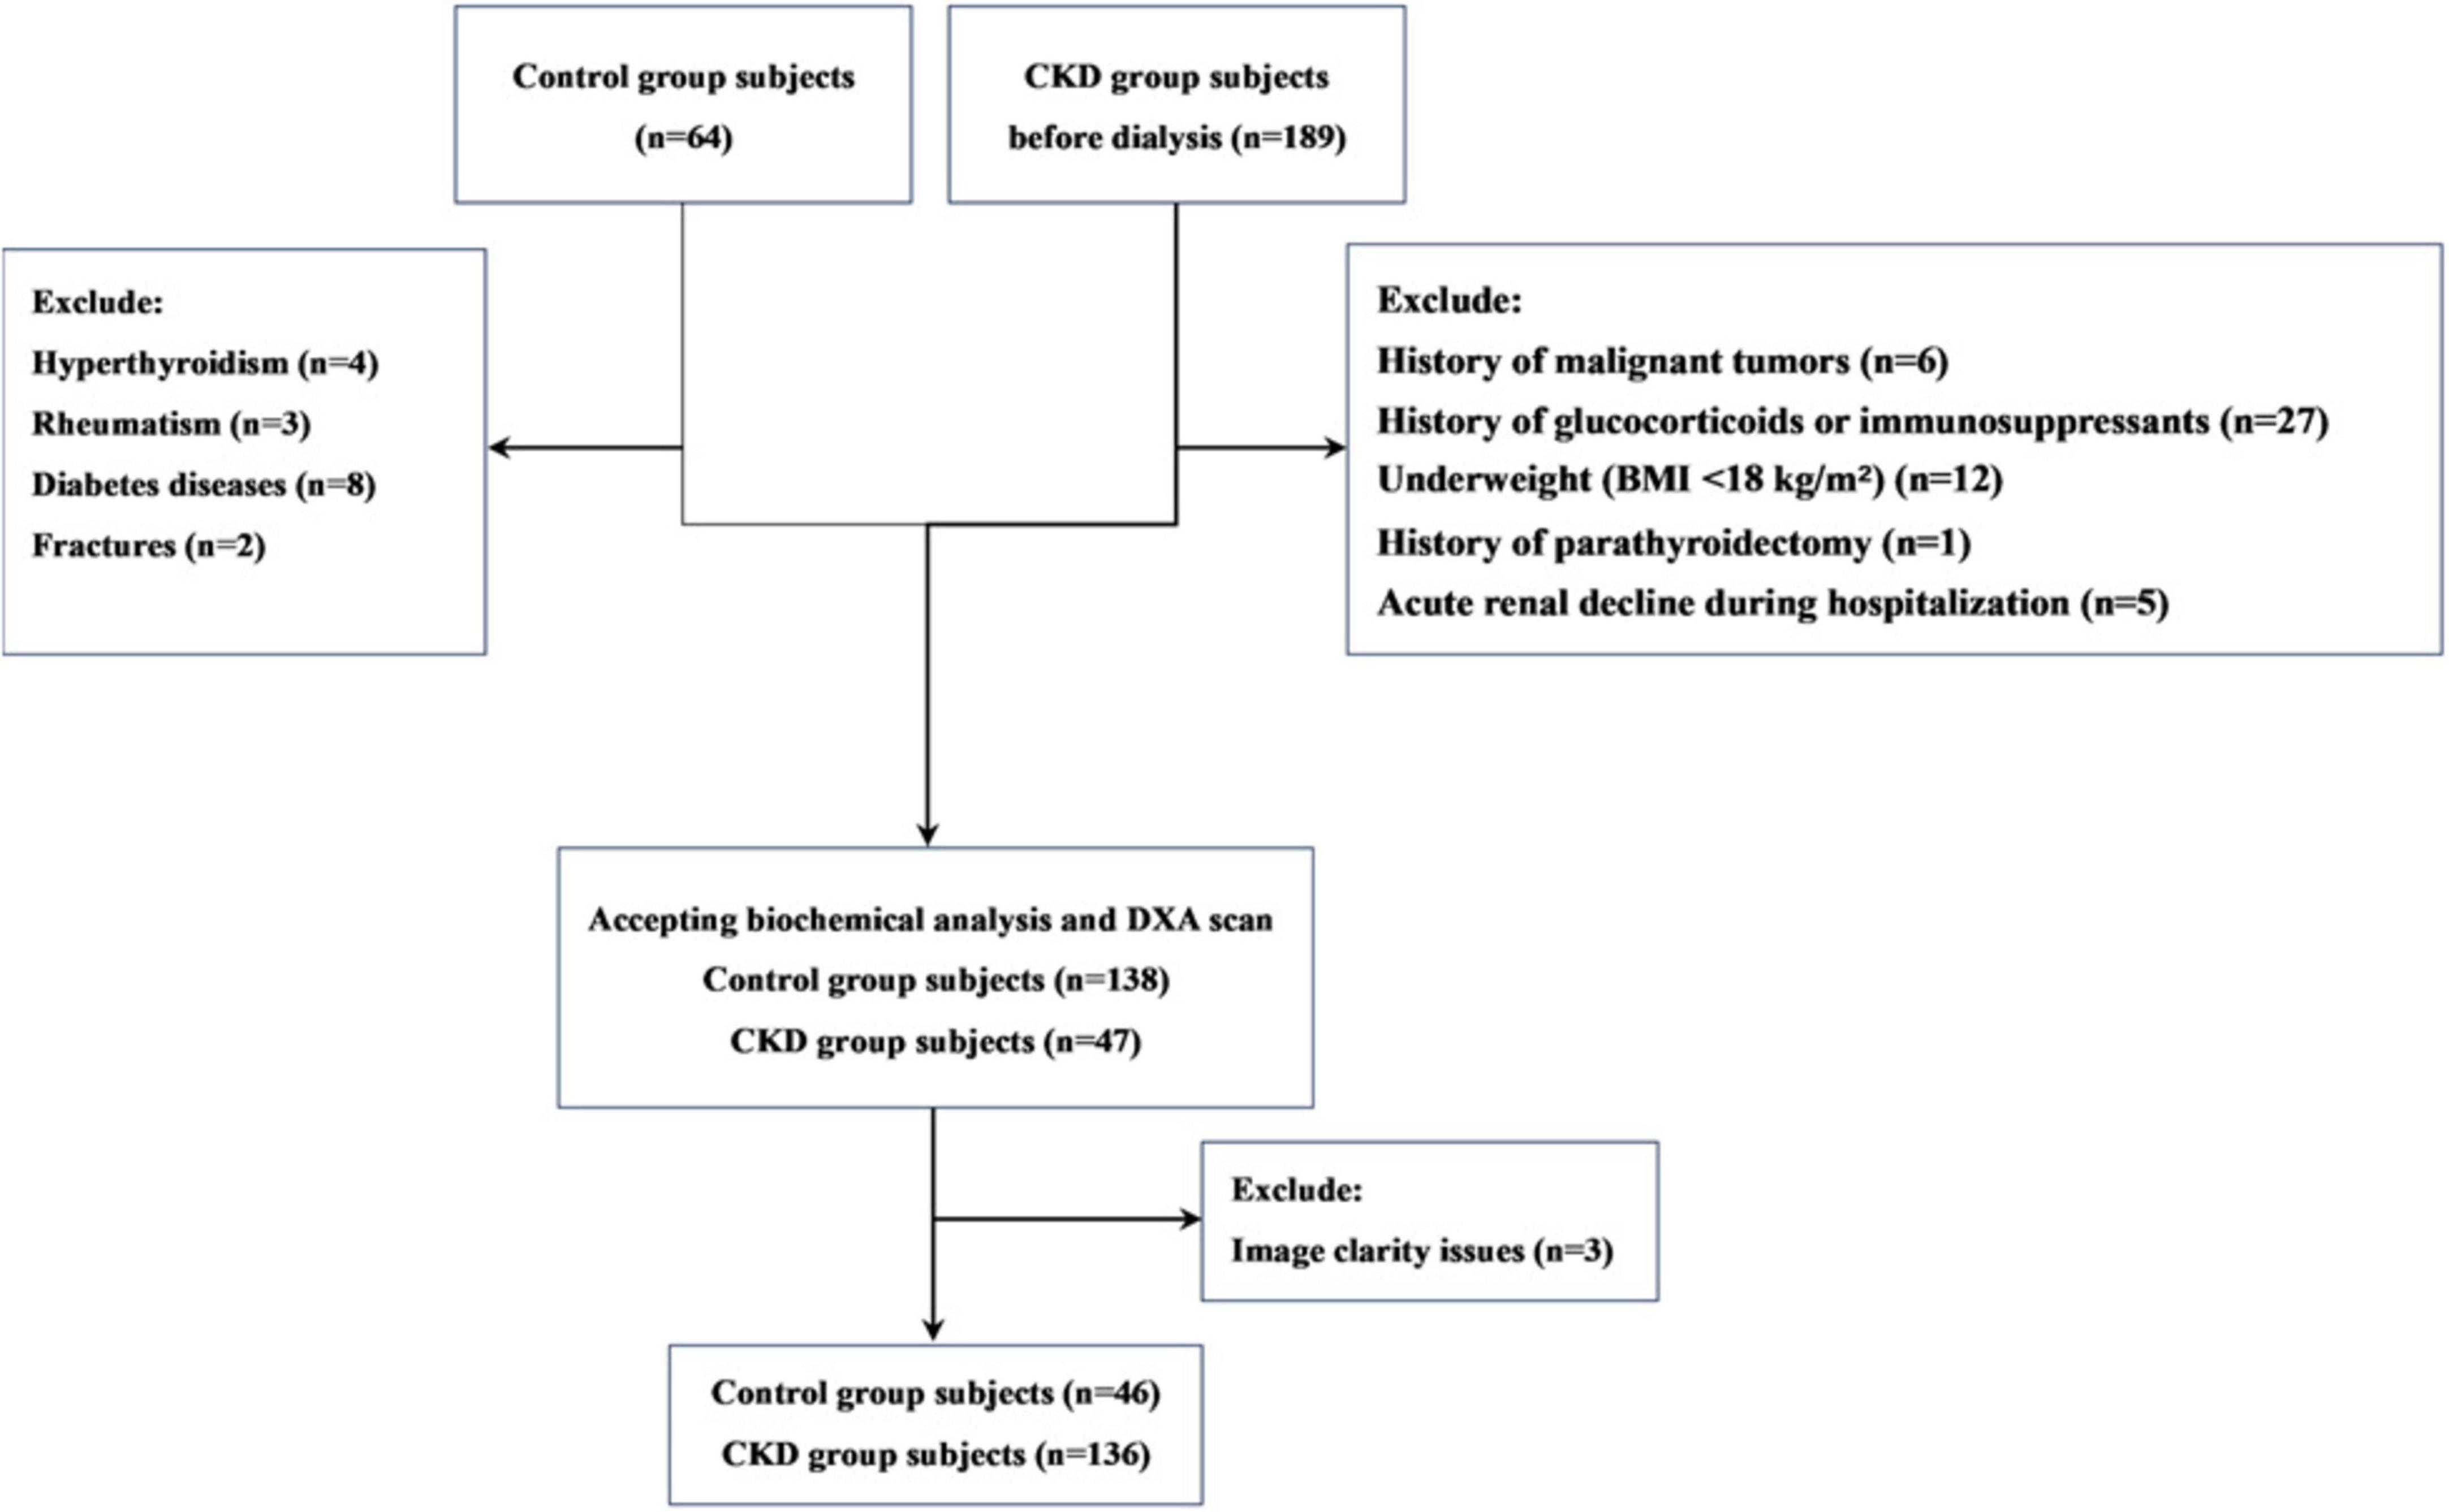
Figure 1. Subject flow diagram.
Clinical and anthropometric parameters and biochemical analysis
Demographic and clinical data were collected from prior medical records, including age, sex, smoking history, alcohol consumption history, and medical history (such as diabetes, fractures, and rheumatoid arthritis). Fractures were identified based on clinical history and confirmed by imaging and radiological reports for all patients. Only fractures resulting from minimal trauma within the past 10 years were included in the analysis, while fractures of the fingers, toes, face, and skull were excluded. Biochemical parameters related to bone metabolism were assessed within 48 hours before the BMD and TBS measurements. These included complete blood count, liver and kidney function tests, calcium (Ca), phosphorus (P), serum alkaline phosphatase (ALP), plasma 25-(OH)-vitamin D, and intact parathyroid hormone (iPTH). Throughout the study, the lowest serum creatinine value was used to calculate the estimated glomerular filtration rate (eGFR) using the Chronic Kidney Disease Epidemiology Collaboration (CKD-EPI) formula (12).
DXA scanning
DXA scans were conducted using the iDXA device (GE Lunar Corp., Madison, WI, United States), adhering to the standard imaging and positioning protocols. Results were presented as grams of bone mineral per square centimeter (g/cm2). Prior to routine scanning, quality control procedures were carried out following the manufacturer’s guidelines. In our laboratory, accuracy was recorded in an assessment involving 30 volunteers, and the obtained root mean square coefficient of variation was less than 0.8%. The World Health Organization (WHO) T-score was used to classify bone status for postmenopausal women and men over 50 as normal (T ≥–1.0), osteopenia (–2.5 < T < –1.0), and osteoporosis (T ≤ –2.5). At enrollment, lumbar spine BMD and femoral neck BMD were measured in all CKD patients and controls. The study was categorized by Overall BMD T score, LS-BMD T score, and FN-BMD T score.
TBS
DXA was used to measure BMD (L1–4) in all participants. All measurements were conducted by experienced operators using the same equipment and standardized procedures, with the operators blinded to the clinical parameters and results. The TBS analysis was performed using TBS iNsight® software (version 3.0.2.0, Med-Imaps, Bordeaux, France) as a grayscale texture index. It involved analyzing the spatial organization of pixel intensities in the lumbar spine (L1–4), which reflects the difference in X-ray absorption intensity between the damaged bone trabeculae structure and the normal bone trabeculae configuration (7). In this study, we categorized bone microstructure based on the TBS (L1–4) ranges derived from our previous research in the Chinese population: for males, normal (> 1.39), partially reduced bone microarchitecture (1.31–1.39), and reduced bone microarchitecture (< 1.31); for females, normal (> 1.35), partially reduced bone microarchitecture (1.27–1.35), and reduced bone microarchitecture (< 1.27) (9); The meta-analysis reference range for TBS (L1–4) was categorized as normal (TBS ≥ 1.35), partially reduced bone microarchitecture (1.21–1.34), reduced bone microarchitecture (≤ 1.20) (8).
Statistical analysis
Data are expressed as means ± standard deviation (SD). The fracture incidence was calculated by dividing the number of patients with vertebral fractures by the total number of participants in each group. The normality of continuous variables was assessed using the Shapiro-Wilk test. TBS followed a normal distribution, whereas LS-BMD and FN-BMD did not. Therefore, Student’s t-test was used to compare TBS, while the Wilcoxon rank-sum test was employed to compare LS-BMD and FN-BMD among the groups. Pearson correlation coefficient was used to analyze the correlation between variables. Chi-square or Fisher’s exact test was applied to compare proportions between groups. To evaluate differences in DXA and TBS diagnostic results across groups, the Kruskal-Wallis test or ANOVA was used. Additionally, ROC curve analysis was performed to calculate the area under the curve (AUC) to assess the predictive performance of the fracture model. Statistical analyses were performed using SPSS software (version 26.0; SPSS Inc., Chicago, United States), and a P-value < 0.05 was regarded as significant.
Results
Subject characteristics
The baseline demographic, clinical, and laboratory characteristics of the control and CKD groups, with matching in age, gender, and body mass index (BMI) are summarized (Table 1). The average age of participants in the control group was 64.96 ± 7.76 years, with 27 females (58.70%), while the average age in the CKD group was 64.42 ± 10.90 years, with 66 females (48.53%). In the CKD group, creatinine (Cr), blood urea nitrogen (Urea), cystatin C, alkaline phosphatase (ALP), iPTH, and phosphorus (P) levels were significantly higher than those in the control group (P < 0.01). Conversely, the CKD group showed significantly lower eGFR, calcium (Ca), and plasma 25-(OH)-vitamin D levels compared to the control group (P < 0.01). In the CKD patient group, 74 patients had diabetes, 43 patients had fractures, 14 patients were smokers, and 8 patients were drinkers. In CKD patients, LS-BMD, FN-BMD, and TBS (L1–4) were significantly negatively correlated with BMI (P < 0.01); only TBS (L1–4) was negatively correlated with age (P < 0.01); no significant correlation was observed between LS-BMD, FN-BMD, TBS (L1–4), and renal function or bone turnover markers (Table 2). Differences in TBS were observed between groups classified based on LS-BMD or FN-BMD, irrespective of whether they were in the control group or the CKD group. TBS decreased as the severity of the bone density classification increased (P < 0.01) (Table 3; Figure 2). In the LS-BMD classification, significant differences in TBS were observed between the normal and osteopenia groups in both the control and CKD groups, with TBS being consistently lower in the CKD group. Similarly, in the FN-BMD classification, the normal groups also exhibited significant differences in TBS, with lower values observed in the CKD group (Figure 3).
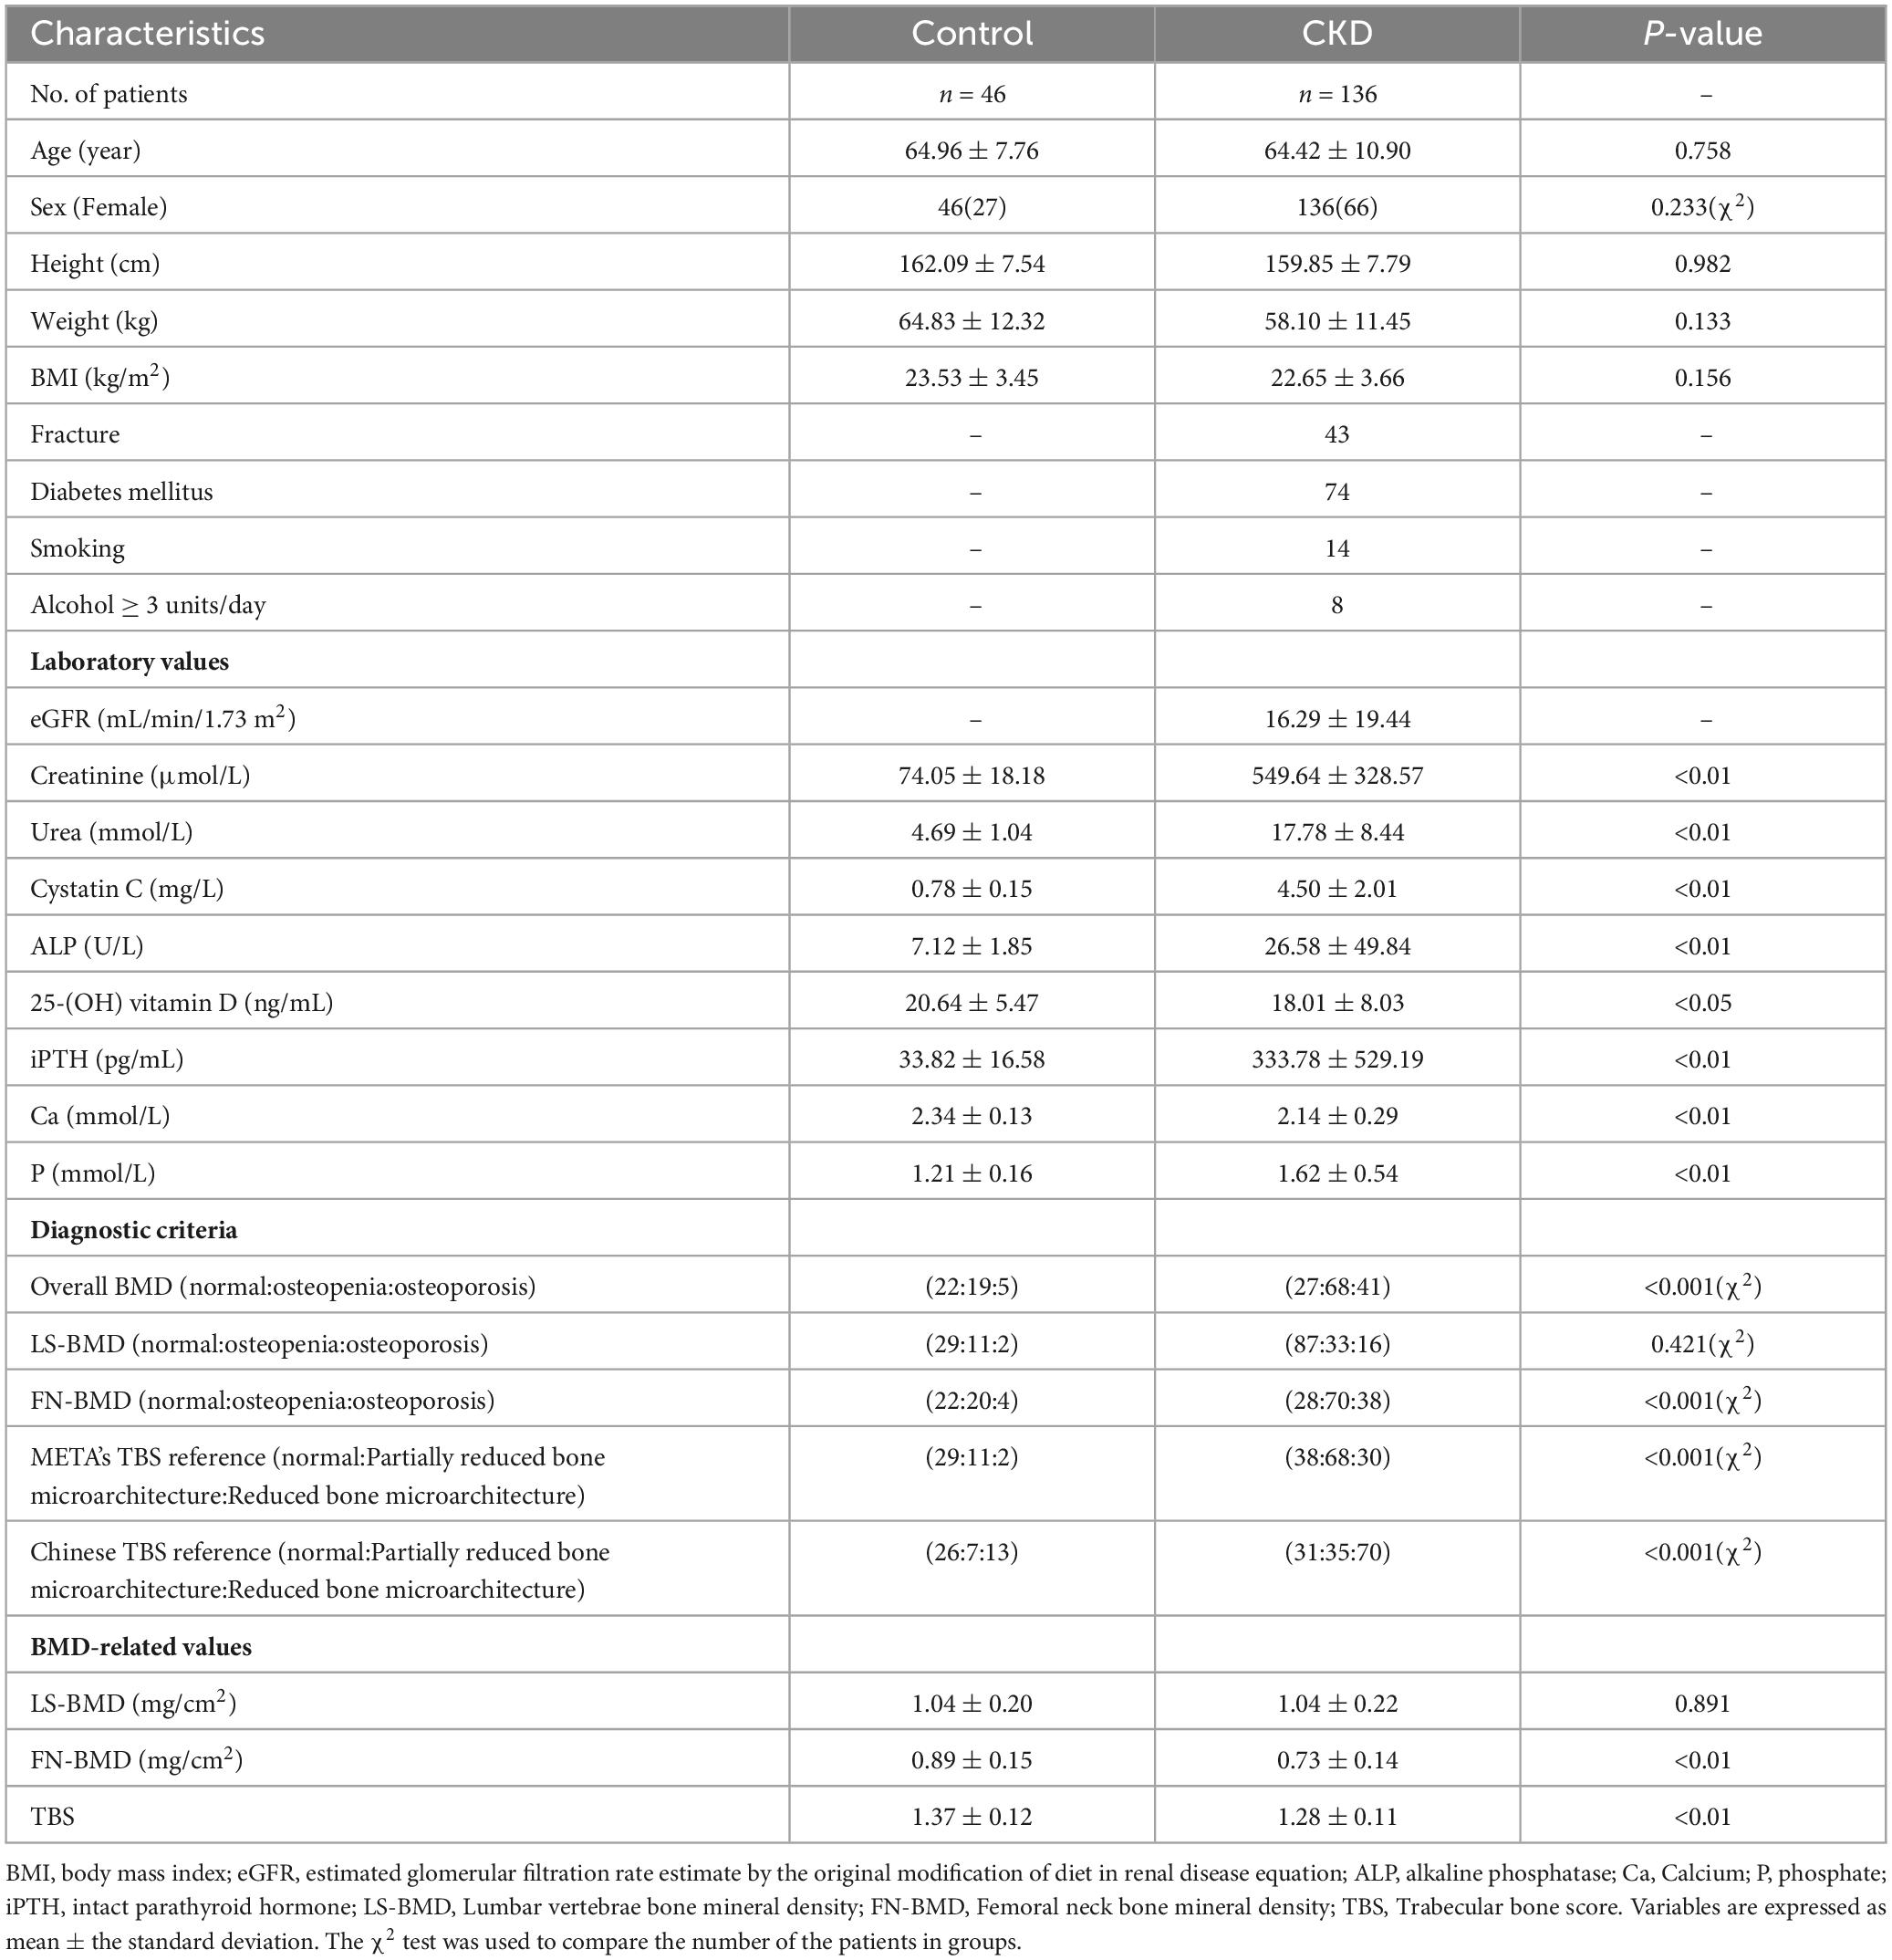
Table 1. Charsubjects and patients with CKD.
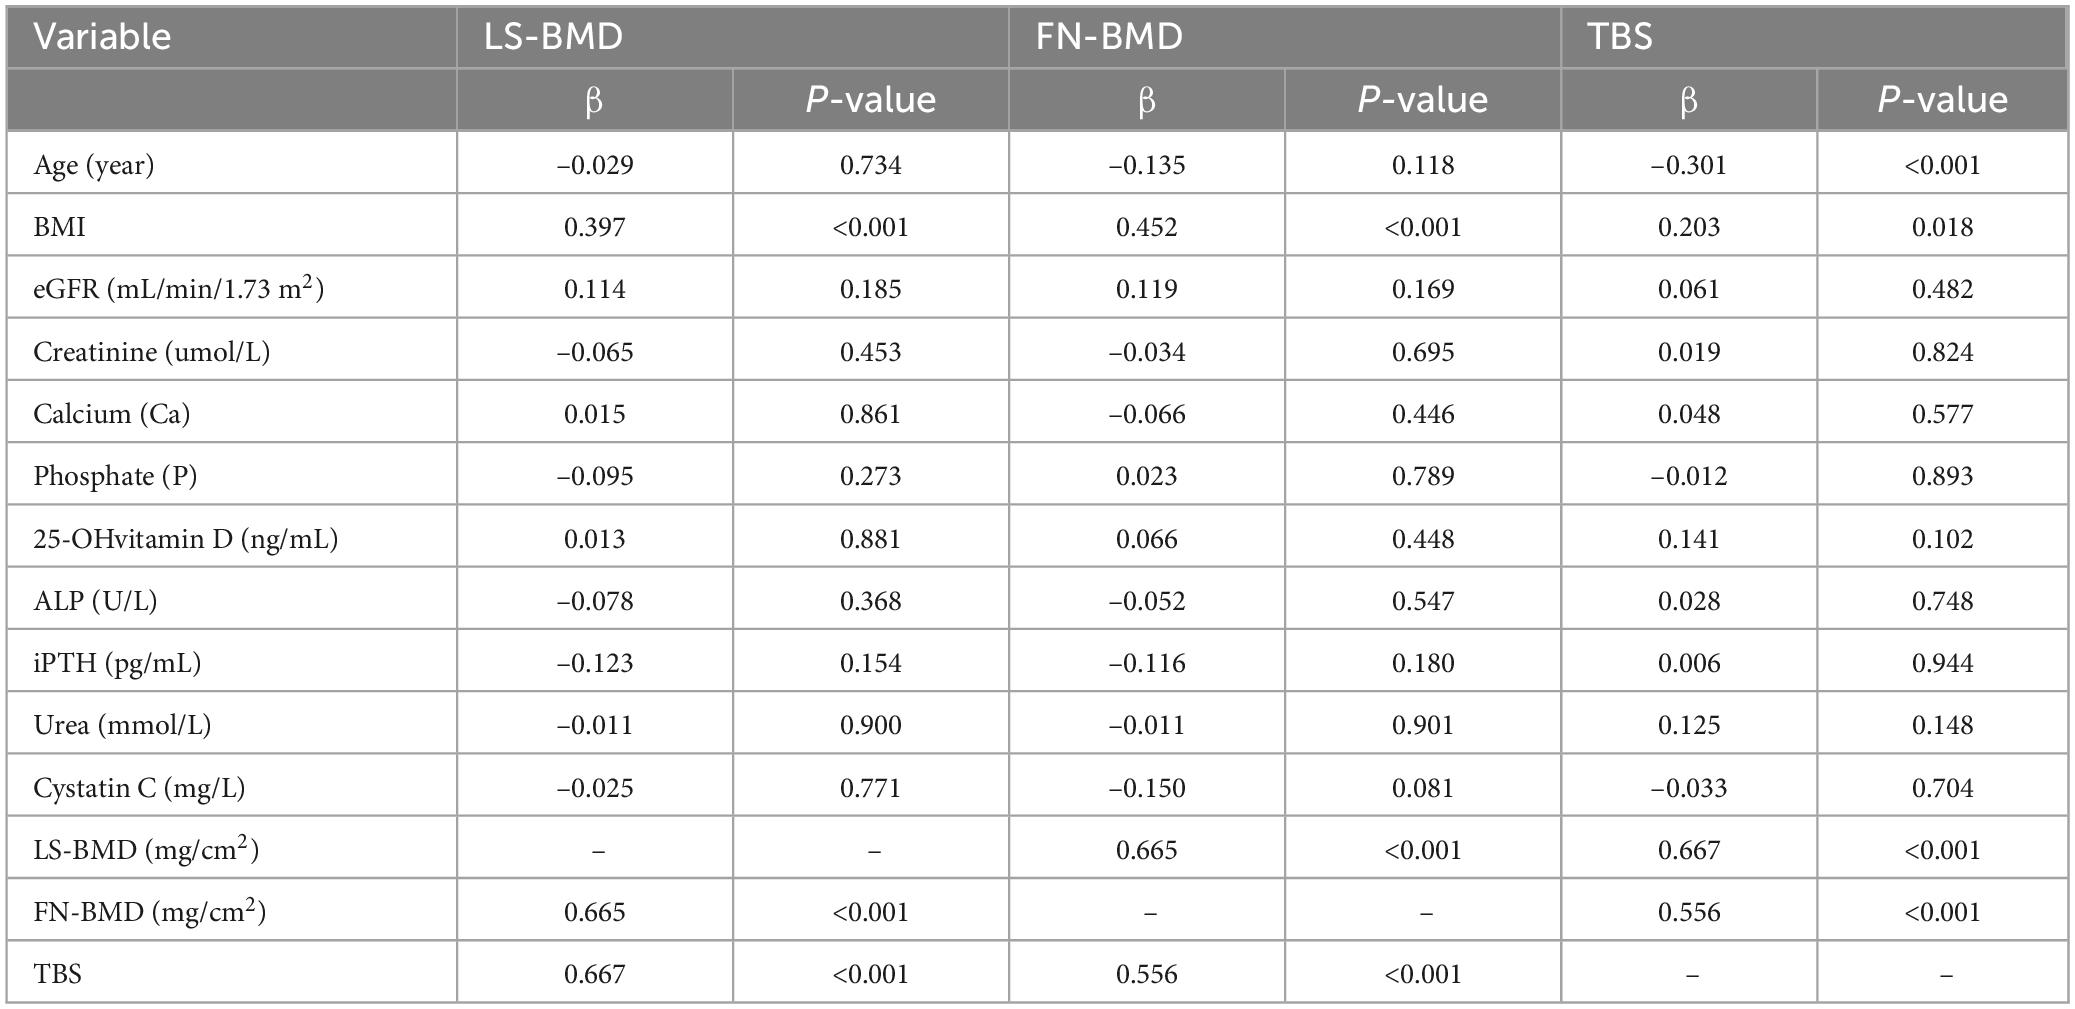
Table 2. Correlation between clinical findings and bone parameters.
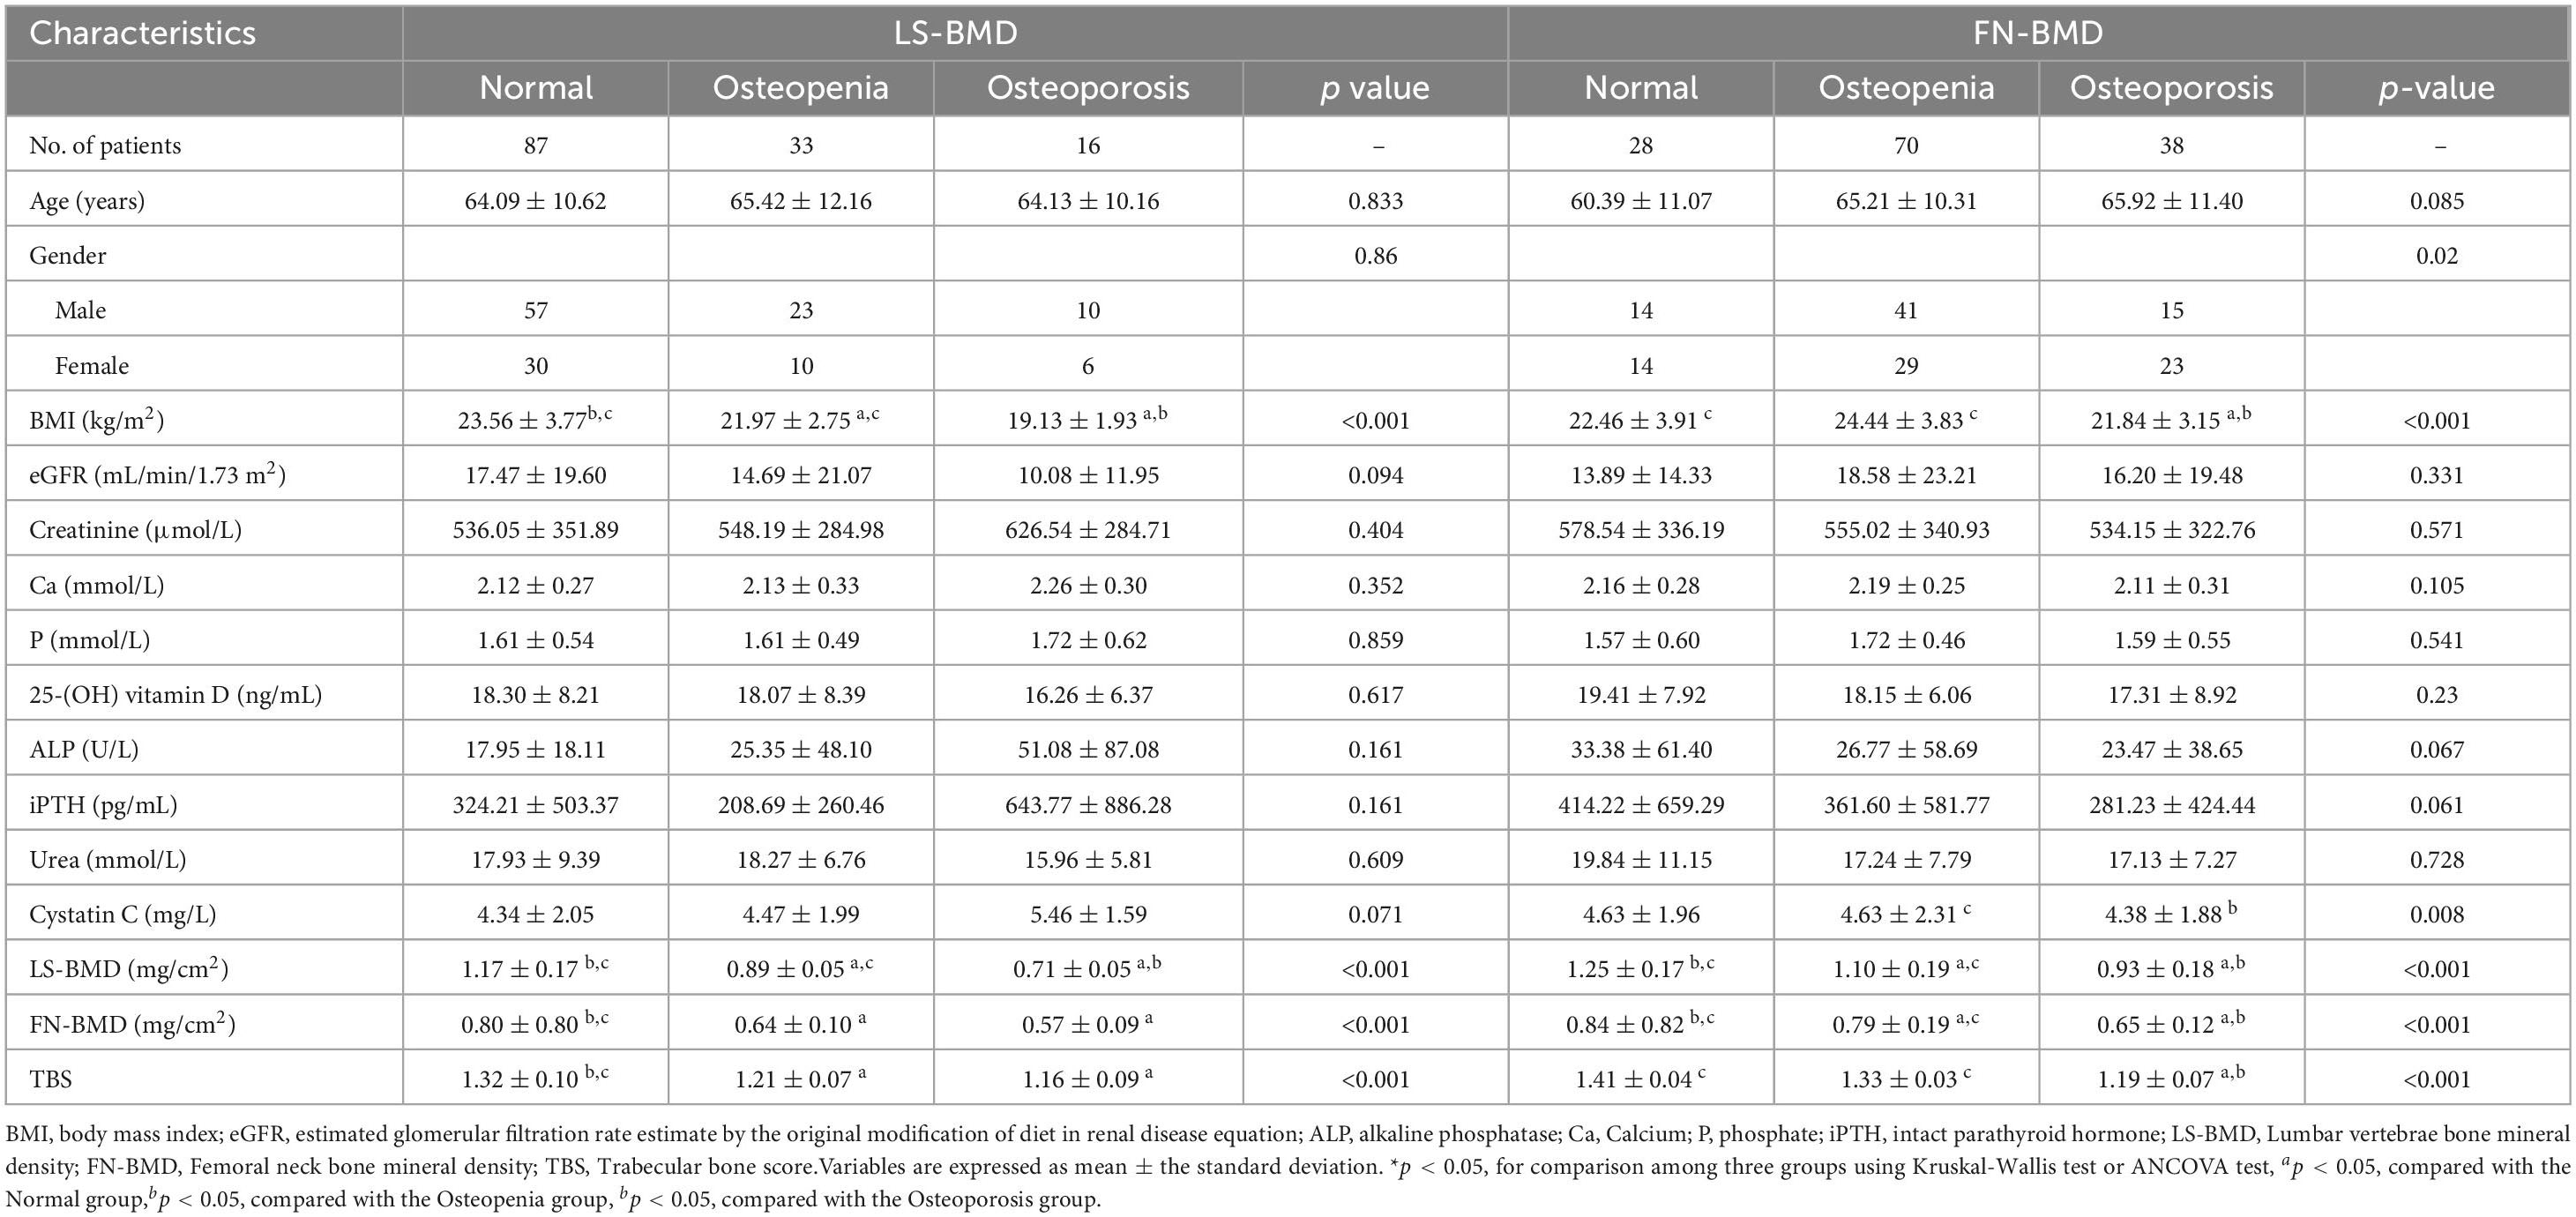
Table 3. Comparative baseline variables according to BMD status from LS-BMD and FN-BMD of the CKD subjects.
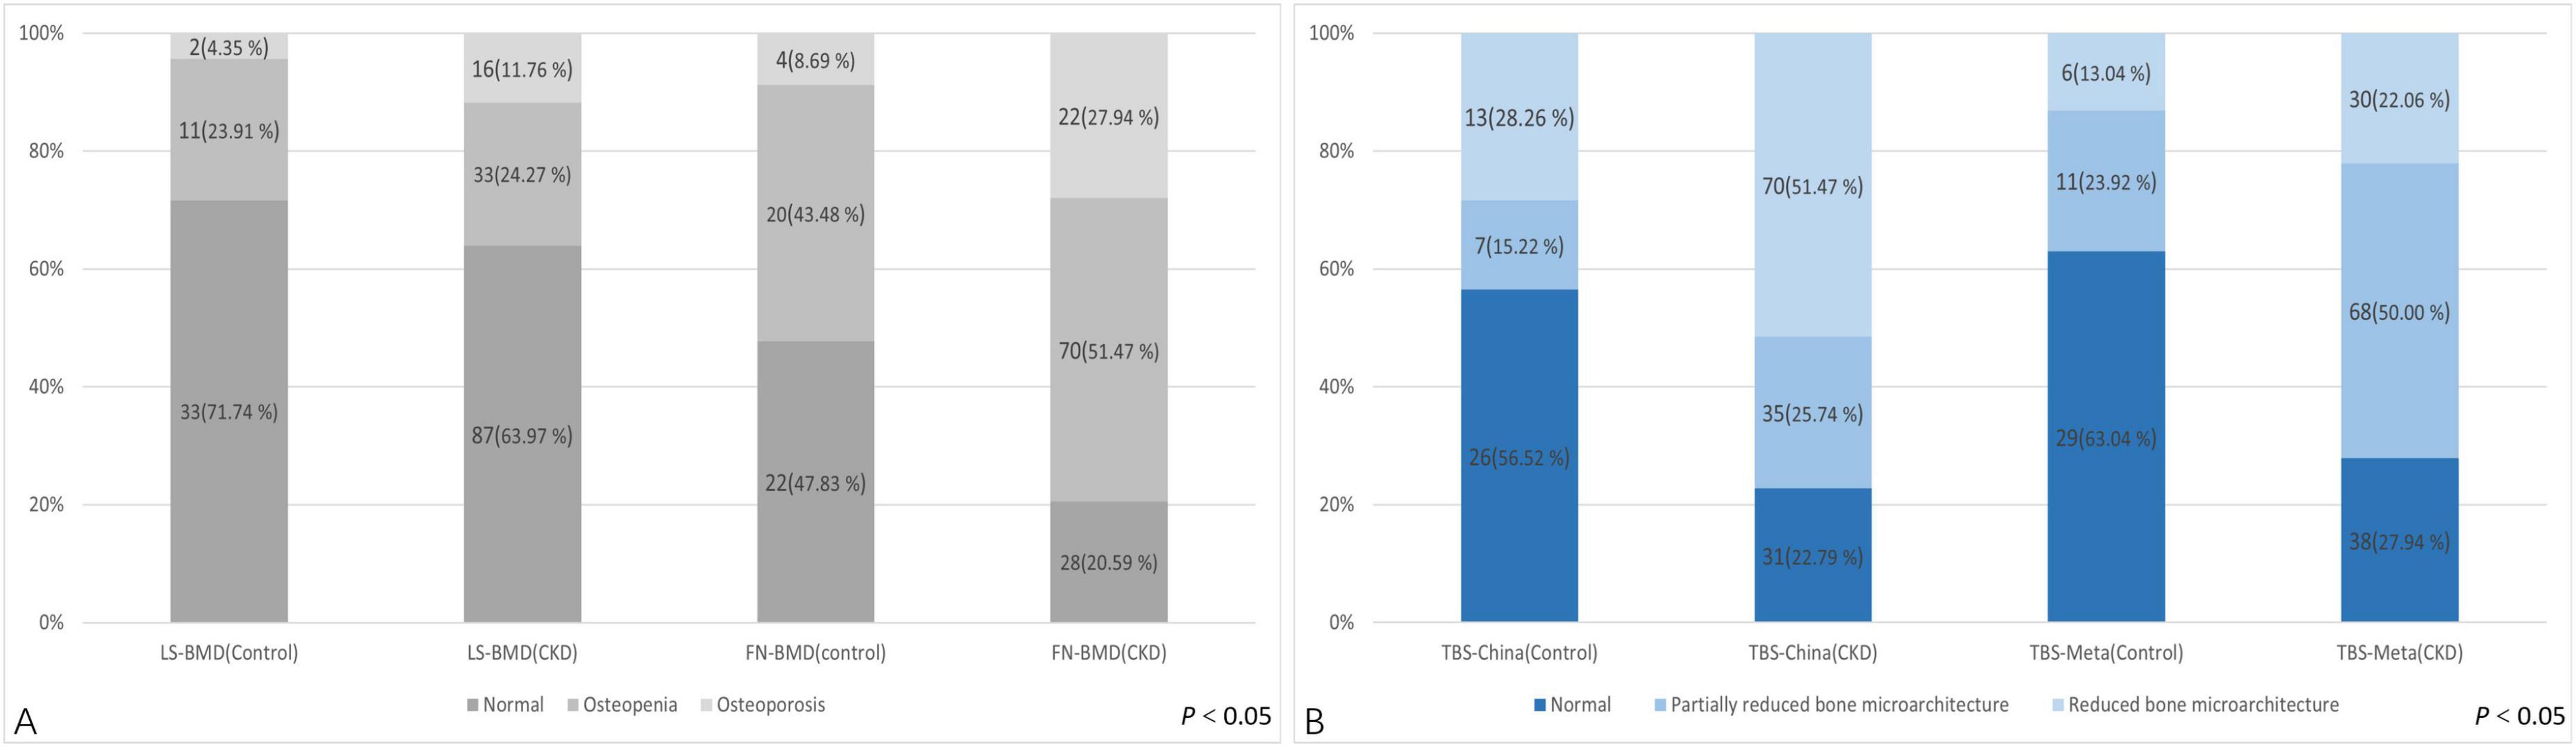
Figure 2. Difference in the TBS between the control group and CKD patients according to the diagnosis of the lumbar spine or femoral neck.
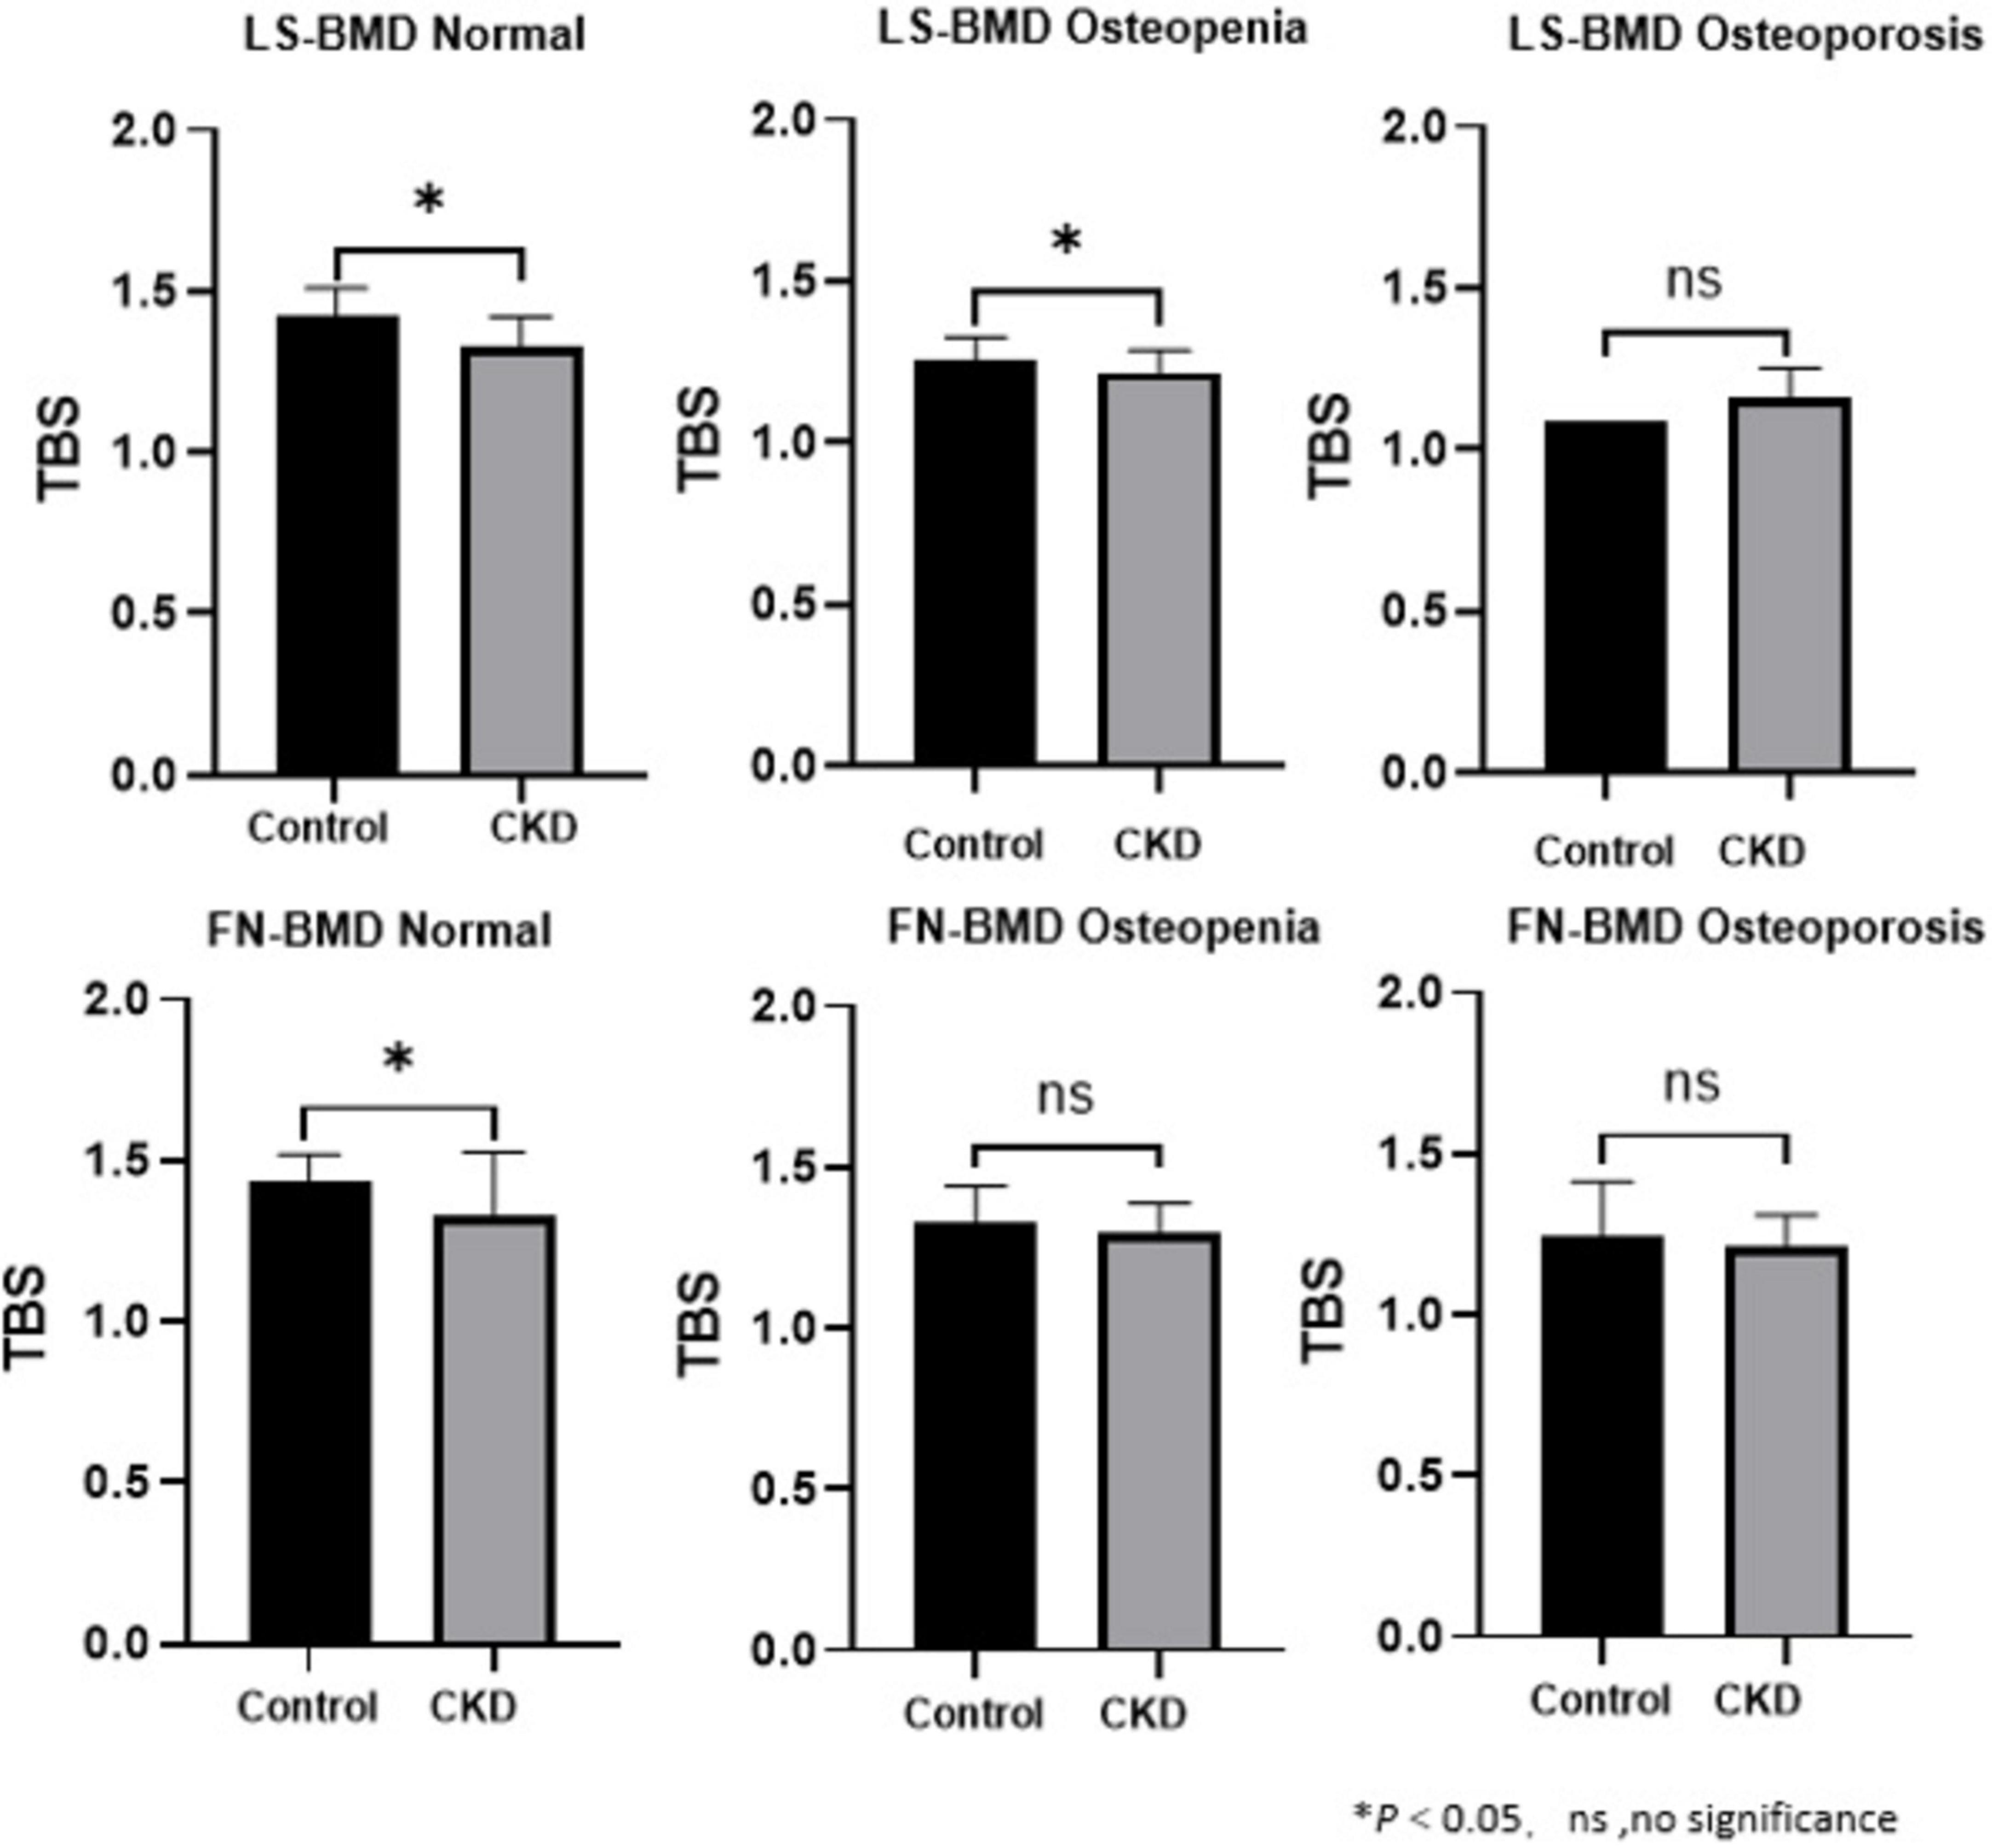
Figure 3. Analysis of Pearson correlation coefficients for BMD, TBS in CKD patients.
The diagnostic classification differences of BMD and TBS measurements in control group and CKD group
Regarding the diagnostic classification of BMD, there was no significant difference in LS-BMD between the control and CKD groups (1.04 ± 0.20 vs. 1.04 ± 0.22, P = 0.891). However, the FN-BMD in the CKD group was significantly lower than in the control group (0.73 ± 0.14 vs. 0.89 ± 0.15, P < 0.01), and the TBS (L1–4) was also lower in the CKD group compared to the control group (1.28 ± 0.11 vs. 1.37 ± 0.12, P < 0.01) (Table 1). No significant difference was found between the two groups in the proportion of individuals classified as normal, osteopenia, or osteoporosis based on LS-BMD T-scores (P = 0.421) (Table 3). However, the classification by Overall BMD T-scores and FN-BMD T-scores significantly differed from the control group, with a higher proportion of individuals classified as osteopenia or osteoporosis in the CKD group (P < 0.001).
Regarding the diagnostic classification of TBS, when classified using TBS (China/META reference ranges) as normal, partially reduced bone microarchitecture, or reduced bone microarchitecture, the proportion of reduced bone microarchitecture was significantly higher in the CKD group compared to the control group (P < 0.001) (Figure 4). In the control group, using the TBS (China reference range) standard classification, 26 subjects (56.52%) were evaluated as normal, 7 (15.22%) as partially reduced bone microarchitecture, and 13 (28.26%) as reduced bone microarchitecture; based on the TBS (META reference range) standard classification, 29 subjects (63.04%) were assessed as normal, 11 (23.91%) as partially reduced bone microarchitecture, and 2 (4.35%) as reduced bone microarchitecture (Table 4). The inconsistency in diagnoses between TBS (China reference range) and TBS (META reference range) was mainly observed when TBS (META reference range) was diagnosed as normal or partially reduced bone microarchitecture, 10 patients were diagnosed with partially reduced bone microarchitecture or reduced bone microarchitecture by TBS (China reference range) (P < 0.01) (Table 5).
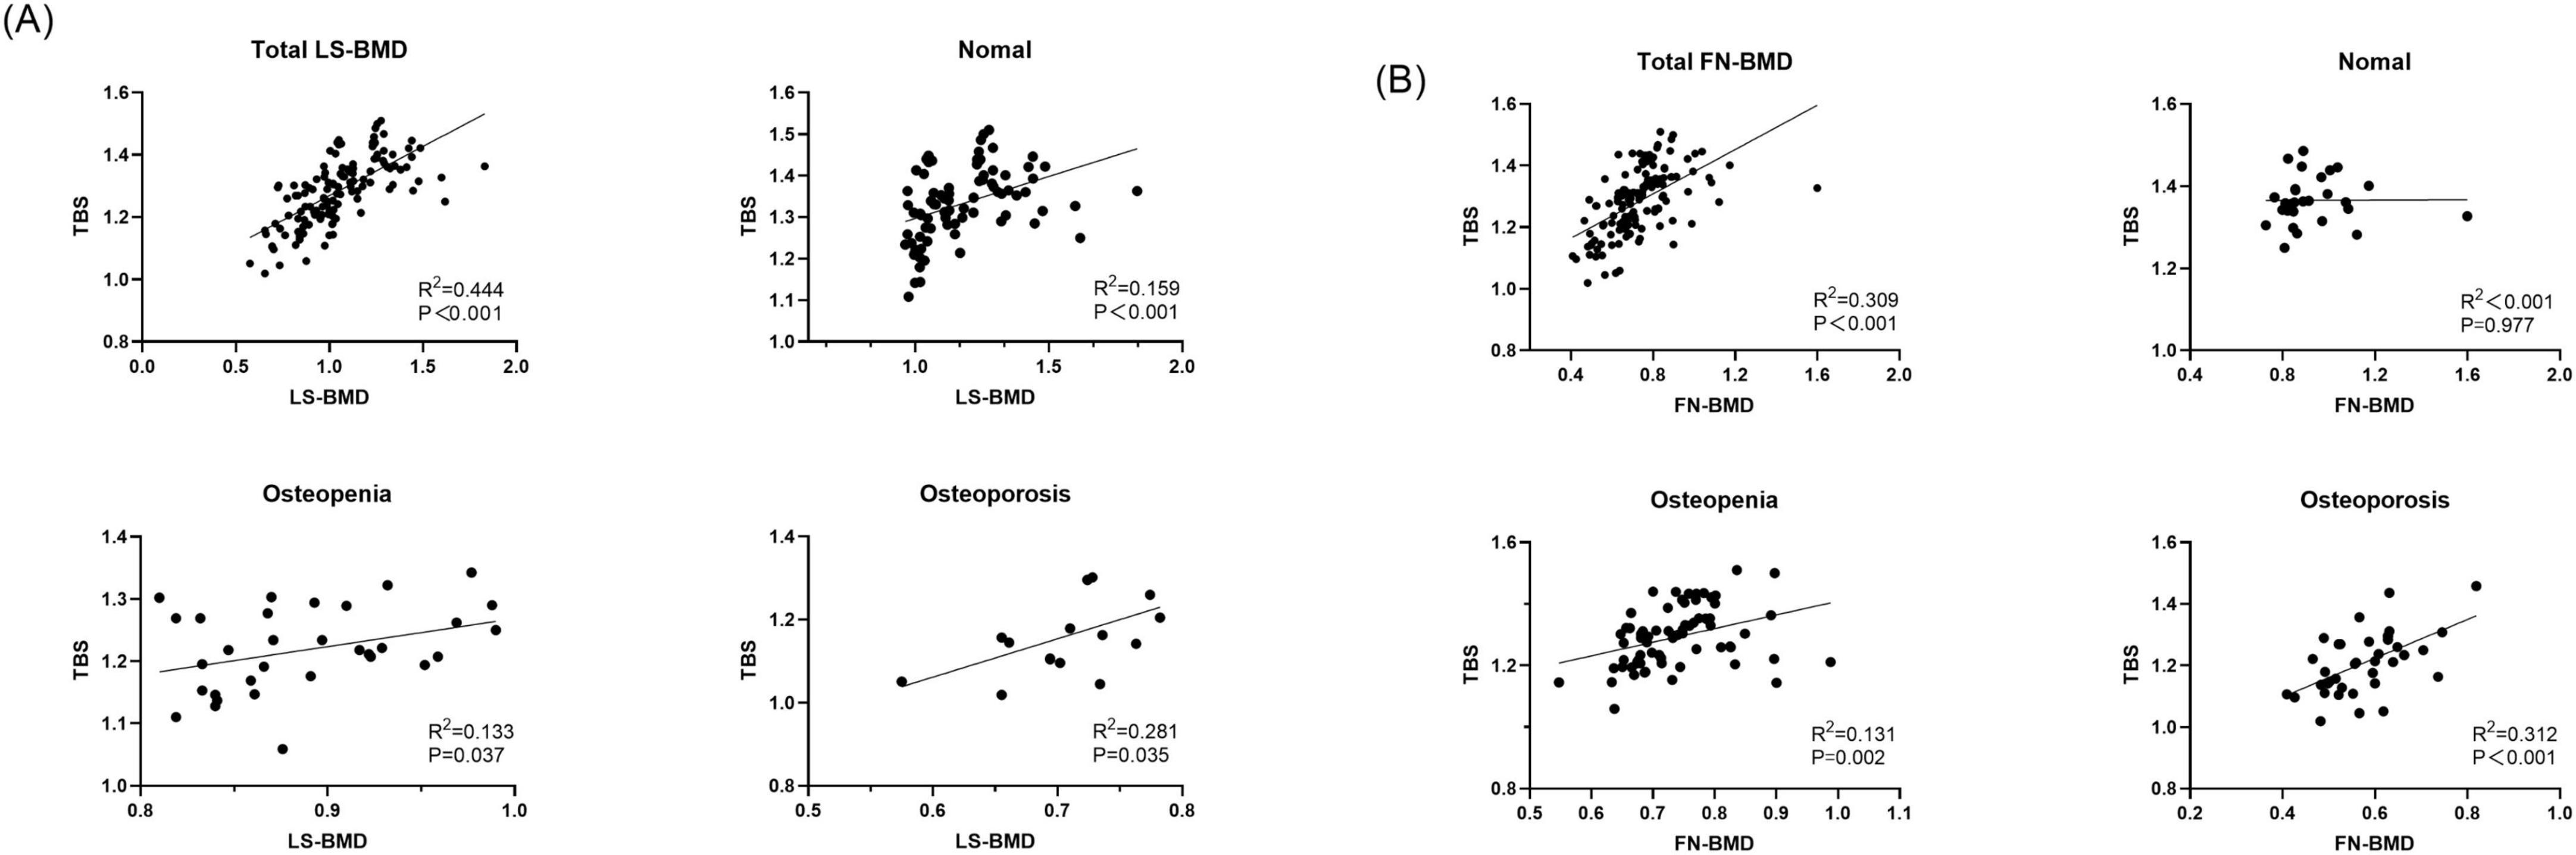
Figure 4. Discrepant diagnostic results of BMD and TBS for control group and CKD group. (A) Discrepant diagnostic in BMD. (B) Discrepant diagnostic in BMD.
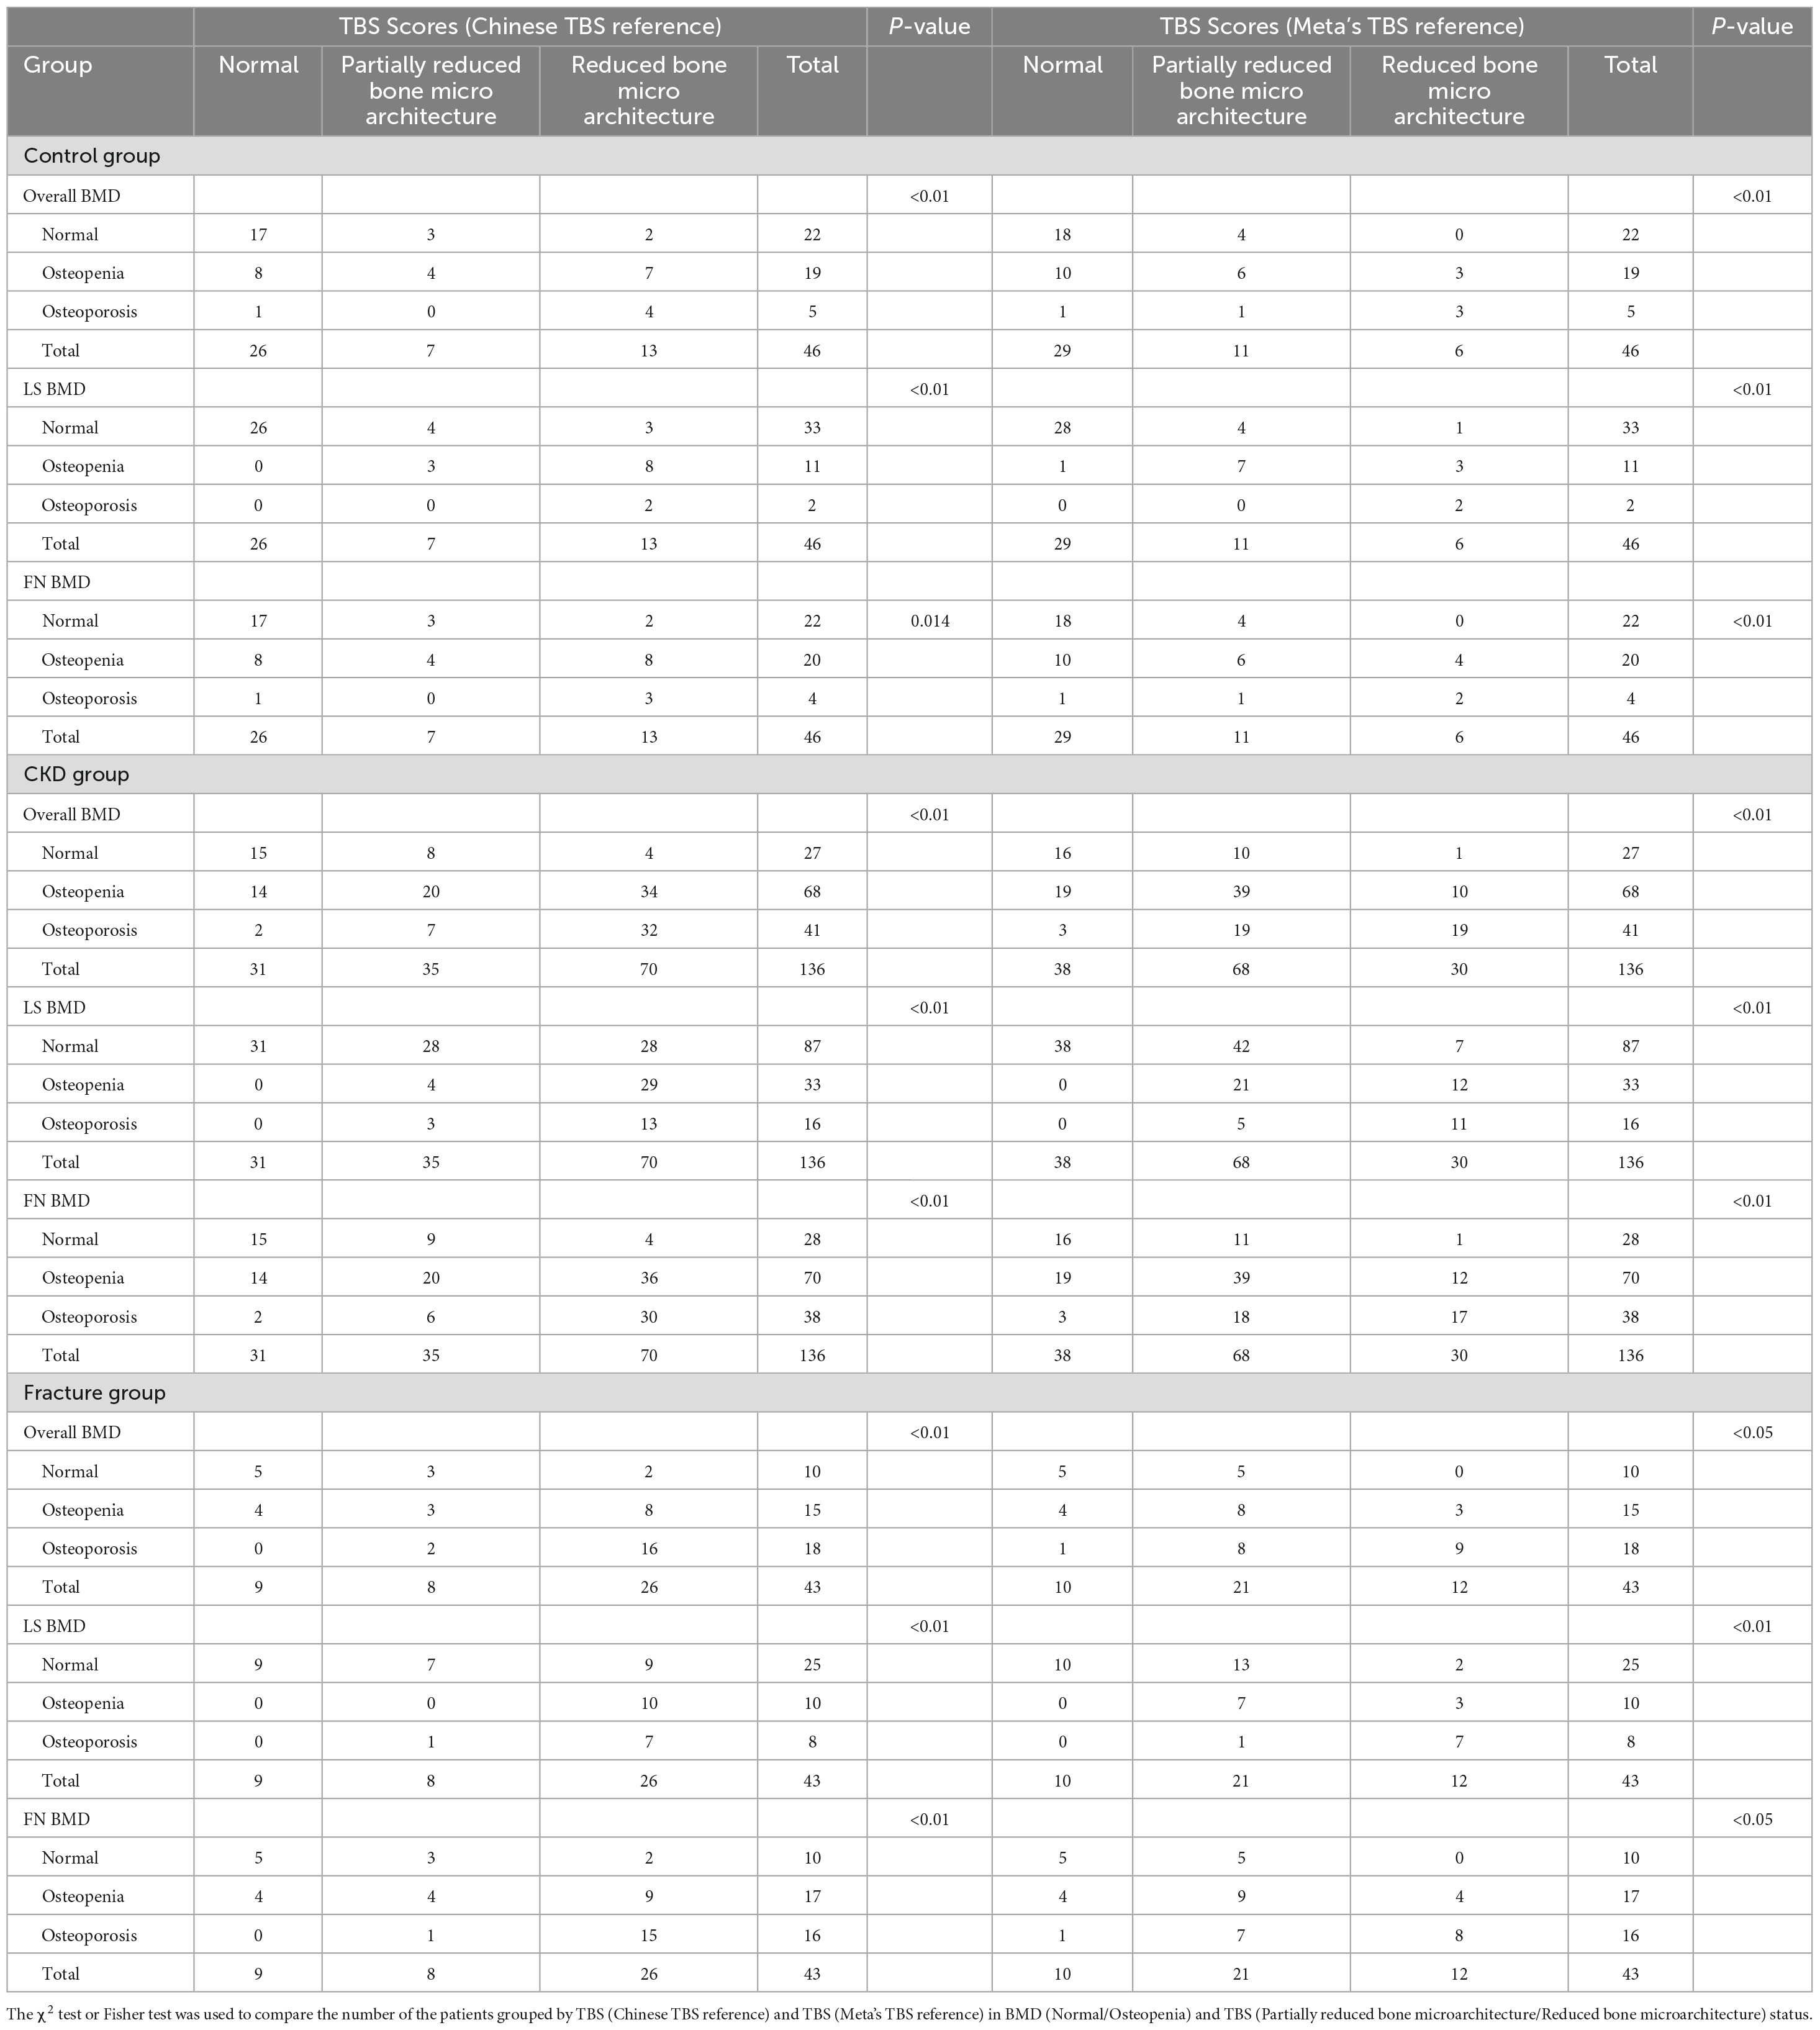
Table 4. Difference of diagnosis in each group with discordant results of BMD and TBS.
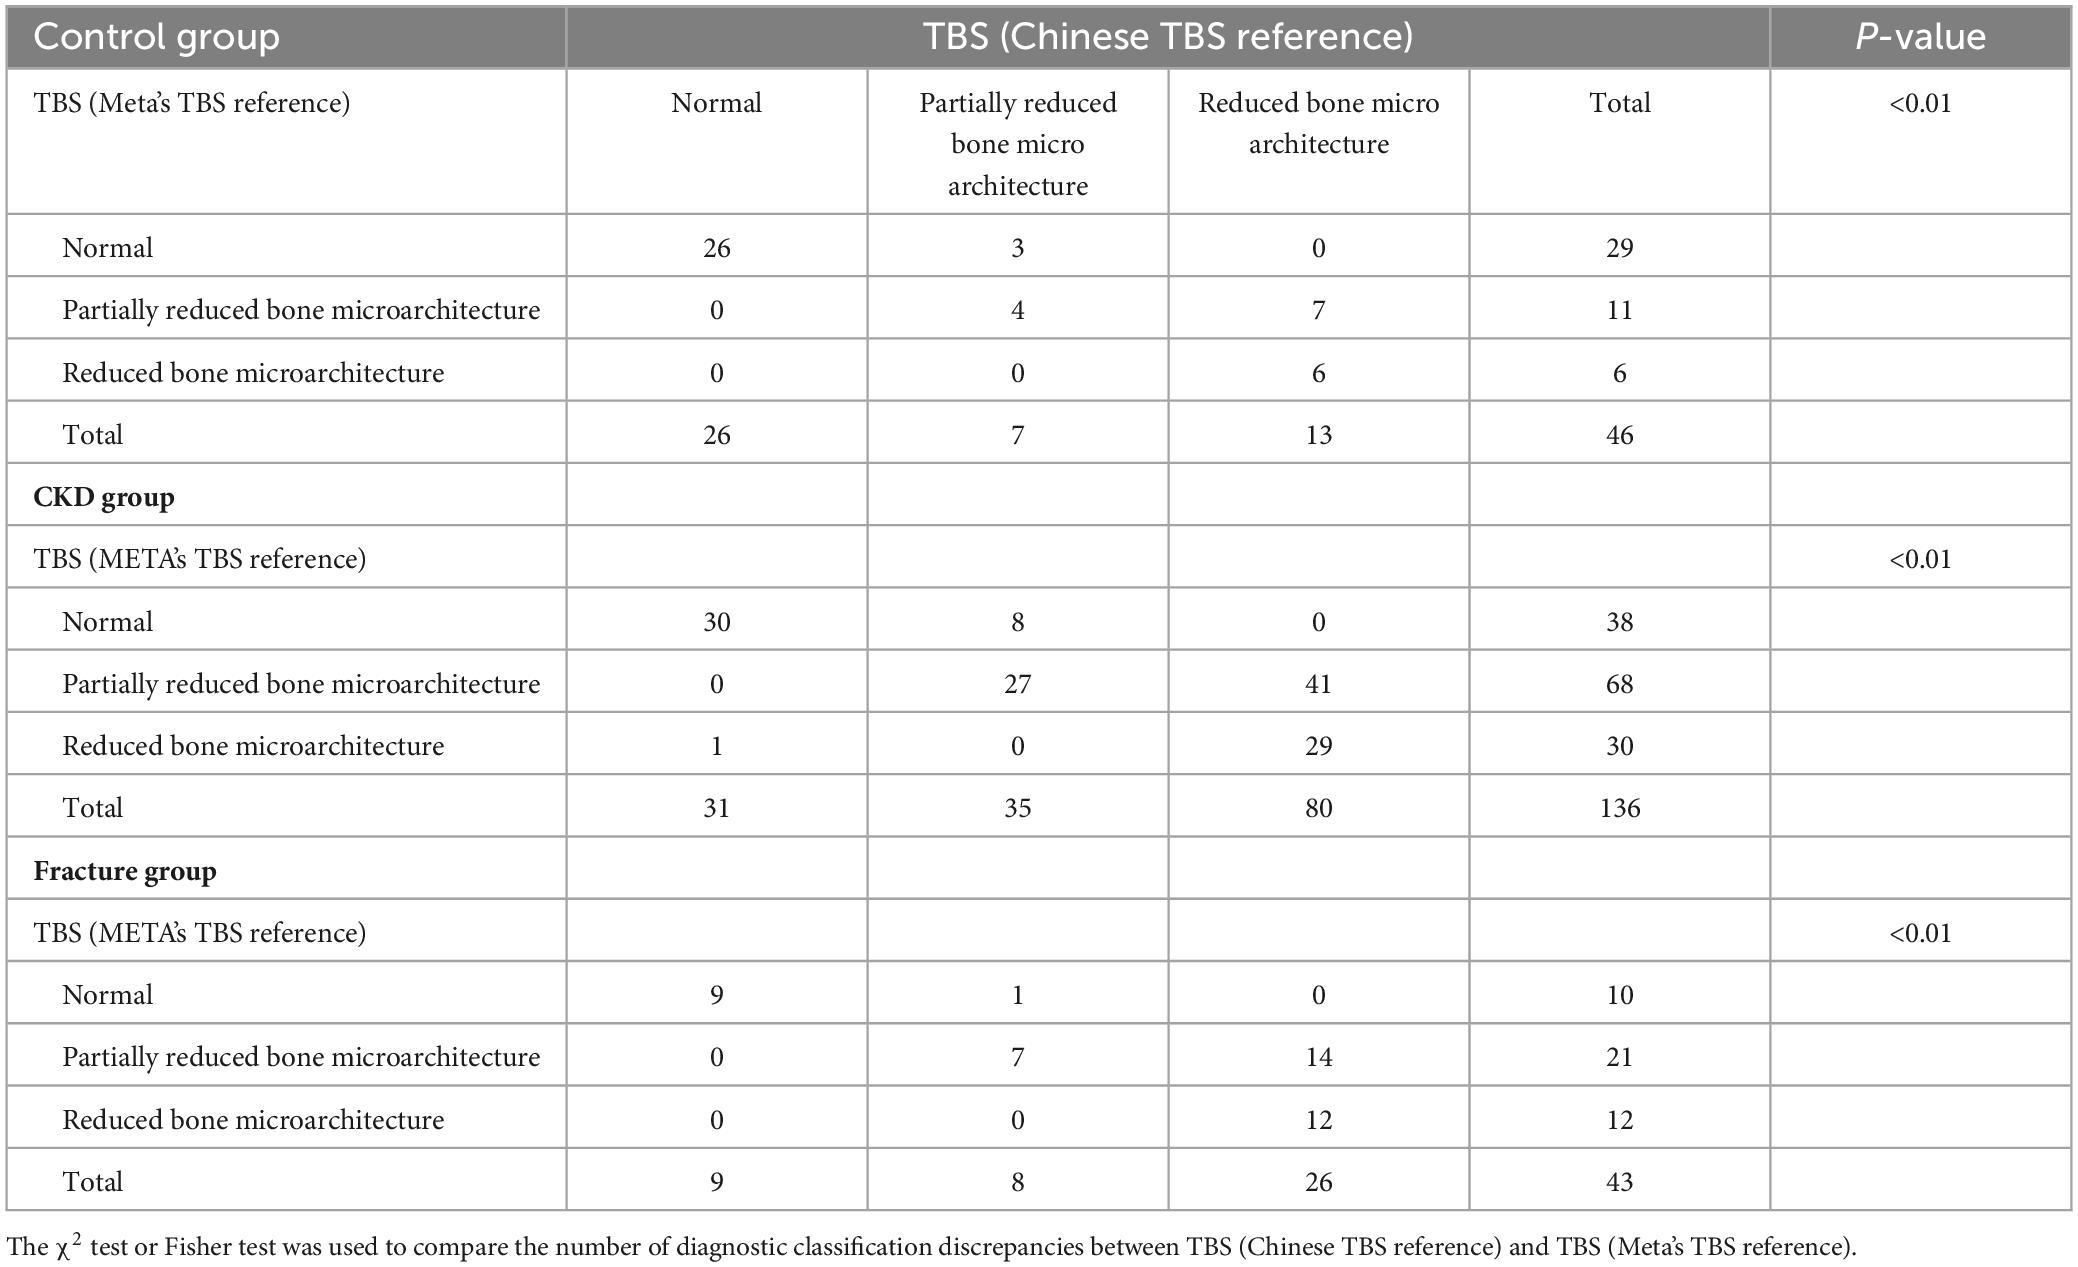
Table 5. Difference of diagnosis in control group and CKD group with discordant results of Chinese TBS reference and Meta’s TBS reference.
In the CKD group, using the TBS (China reference range) classification, 31 subjects (22.79%) were assessed as normal, 35 (25.74%) as partially reduced bone microarchitecture, and 70 (51.47%) as reduced bone microarchitecture; according to the TBS (META reference range) classification, 38 subjects (27.94%) were evaluated as normal, 68 (50.00%) as partially reduced bone microarchitecture, and 30 (22.06%) as reduced bone microarchitecture (Table 4). Whether the Overall BMD T-score, LS-BMD T-score, or FN-BMD T-score is diagnosed as normal or osteopenia, some patients were diagnosed with partially reduced bone microarchitecture or reduced bone microarchitecture based on TBS (China/META reference range) (P < 0.05). The inconsistency between TBS (China reference range) and TBS (META reference range) diagnoses was mainly observed when TBS (META reference range) diagnosed as normal or partially reduced bone microarchitecture, 49 patients were diagnosed with partially reduced bone microarchitecture damage or reduced bone microarchitecture by TBS (China reference range) (P < 0.01) (Table 5).
The diagnostic classification differences of BMD and TBS measurements in fracture participants of the CKD group
In CKD fracture patients, regardless of whether Overall BMD T-scores, LS-BMD T-scores, or FN-BMD T-scores were classified as normal or osteopenia, some patients were diagnosed with partial or complete trabecular bone degradation based on either TBS (China reference range) or TBS (META reference range). When fracture patients were diagnosed as normal or osteopenia based on Overall BMD T-scores, LS-BMD T-scores, or FN-BMD T-scores, a higher number of fracture patients were diagnosed with partial or complete trabecular bone degradation according to TBS (China reference range) compared to TBS (META reference range), Percentages: [13 (30.23%) vs. 8 (18.60%), 26 (60.47%) vs. 18 (41.86%), 14 (32.56%) vs. 9 (20.93%)] (P < 0.01) (Table 4). Among the 43 CKD fracture patients, 15 patients classified as normal or partially reduced bone microarchitecture according to TBS (META reference range) were classified as having partially reduced bone microarchitecture or reduced bone microarchitecture according to TBS (China reference range) (P < 0.01) (Table 5).
Comparison of AUC for fracture prediction in the CKD group based on bone parameters
In the Overall BMD (Normal/Osteopenia) and Overall BMD (Osteoporosis) groups, the combination model of TBS, FN-BMD, and age significantly enhanced the ability to distinguish fractures. In the LS-BMD (Normal/Osteopenia) group, the TBS, FN-BMD, and age model showed fracture discrimination capability comparable to the TBS, LS-BMD, FN-BMD, and age model (P < 0.05). In the LS-BMD (Osteoporosis) group, the combination of TBS, LS-BMD, FN-BMD, and age significantly enhanced fracture discrimination (P < 0.05). In the FN-BMD (Normal/Osteopenia) group, none of the models showed significant differences in fracture discrimination. In the FN-BMD (Osteoporosis) group, models combining FN-BMD, LS-BMD, and age; TBS, FN-BMD, and age; and TBS, LS-BMD, FN-BMD, and age effectively distinguished fractures, with the TBS, LS-BMD, FN-BMD, and age model having the highest AUC (P < 0.05). In the Overall BMD (Normal/Osteopenia/Osteoporosis) group, the TBS, FN-BMD, and age model demonstrated similar fracture discrimination capability to the TBS, LS-BMD, FN-BMD, and age model, effectively enhancing fracture discrimination (P < 0.05) (Table 6).
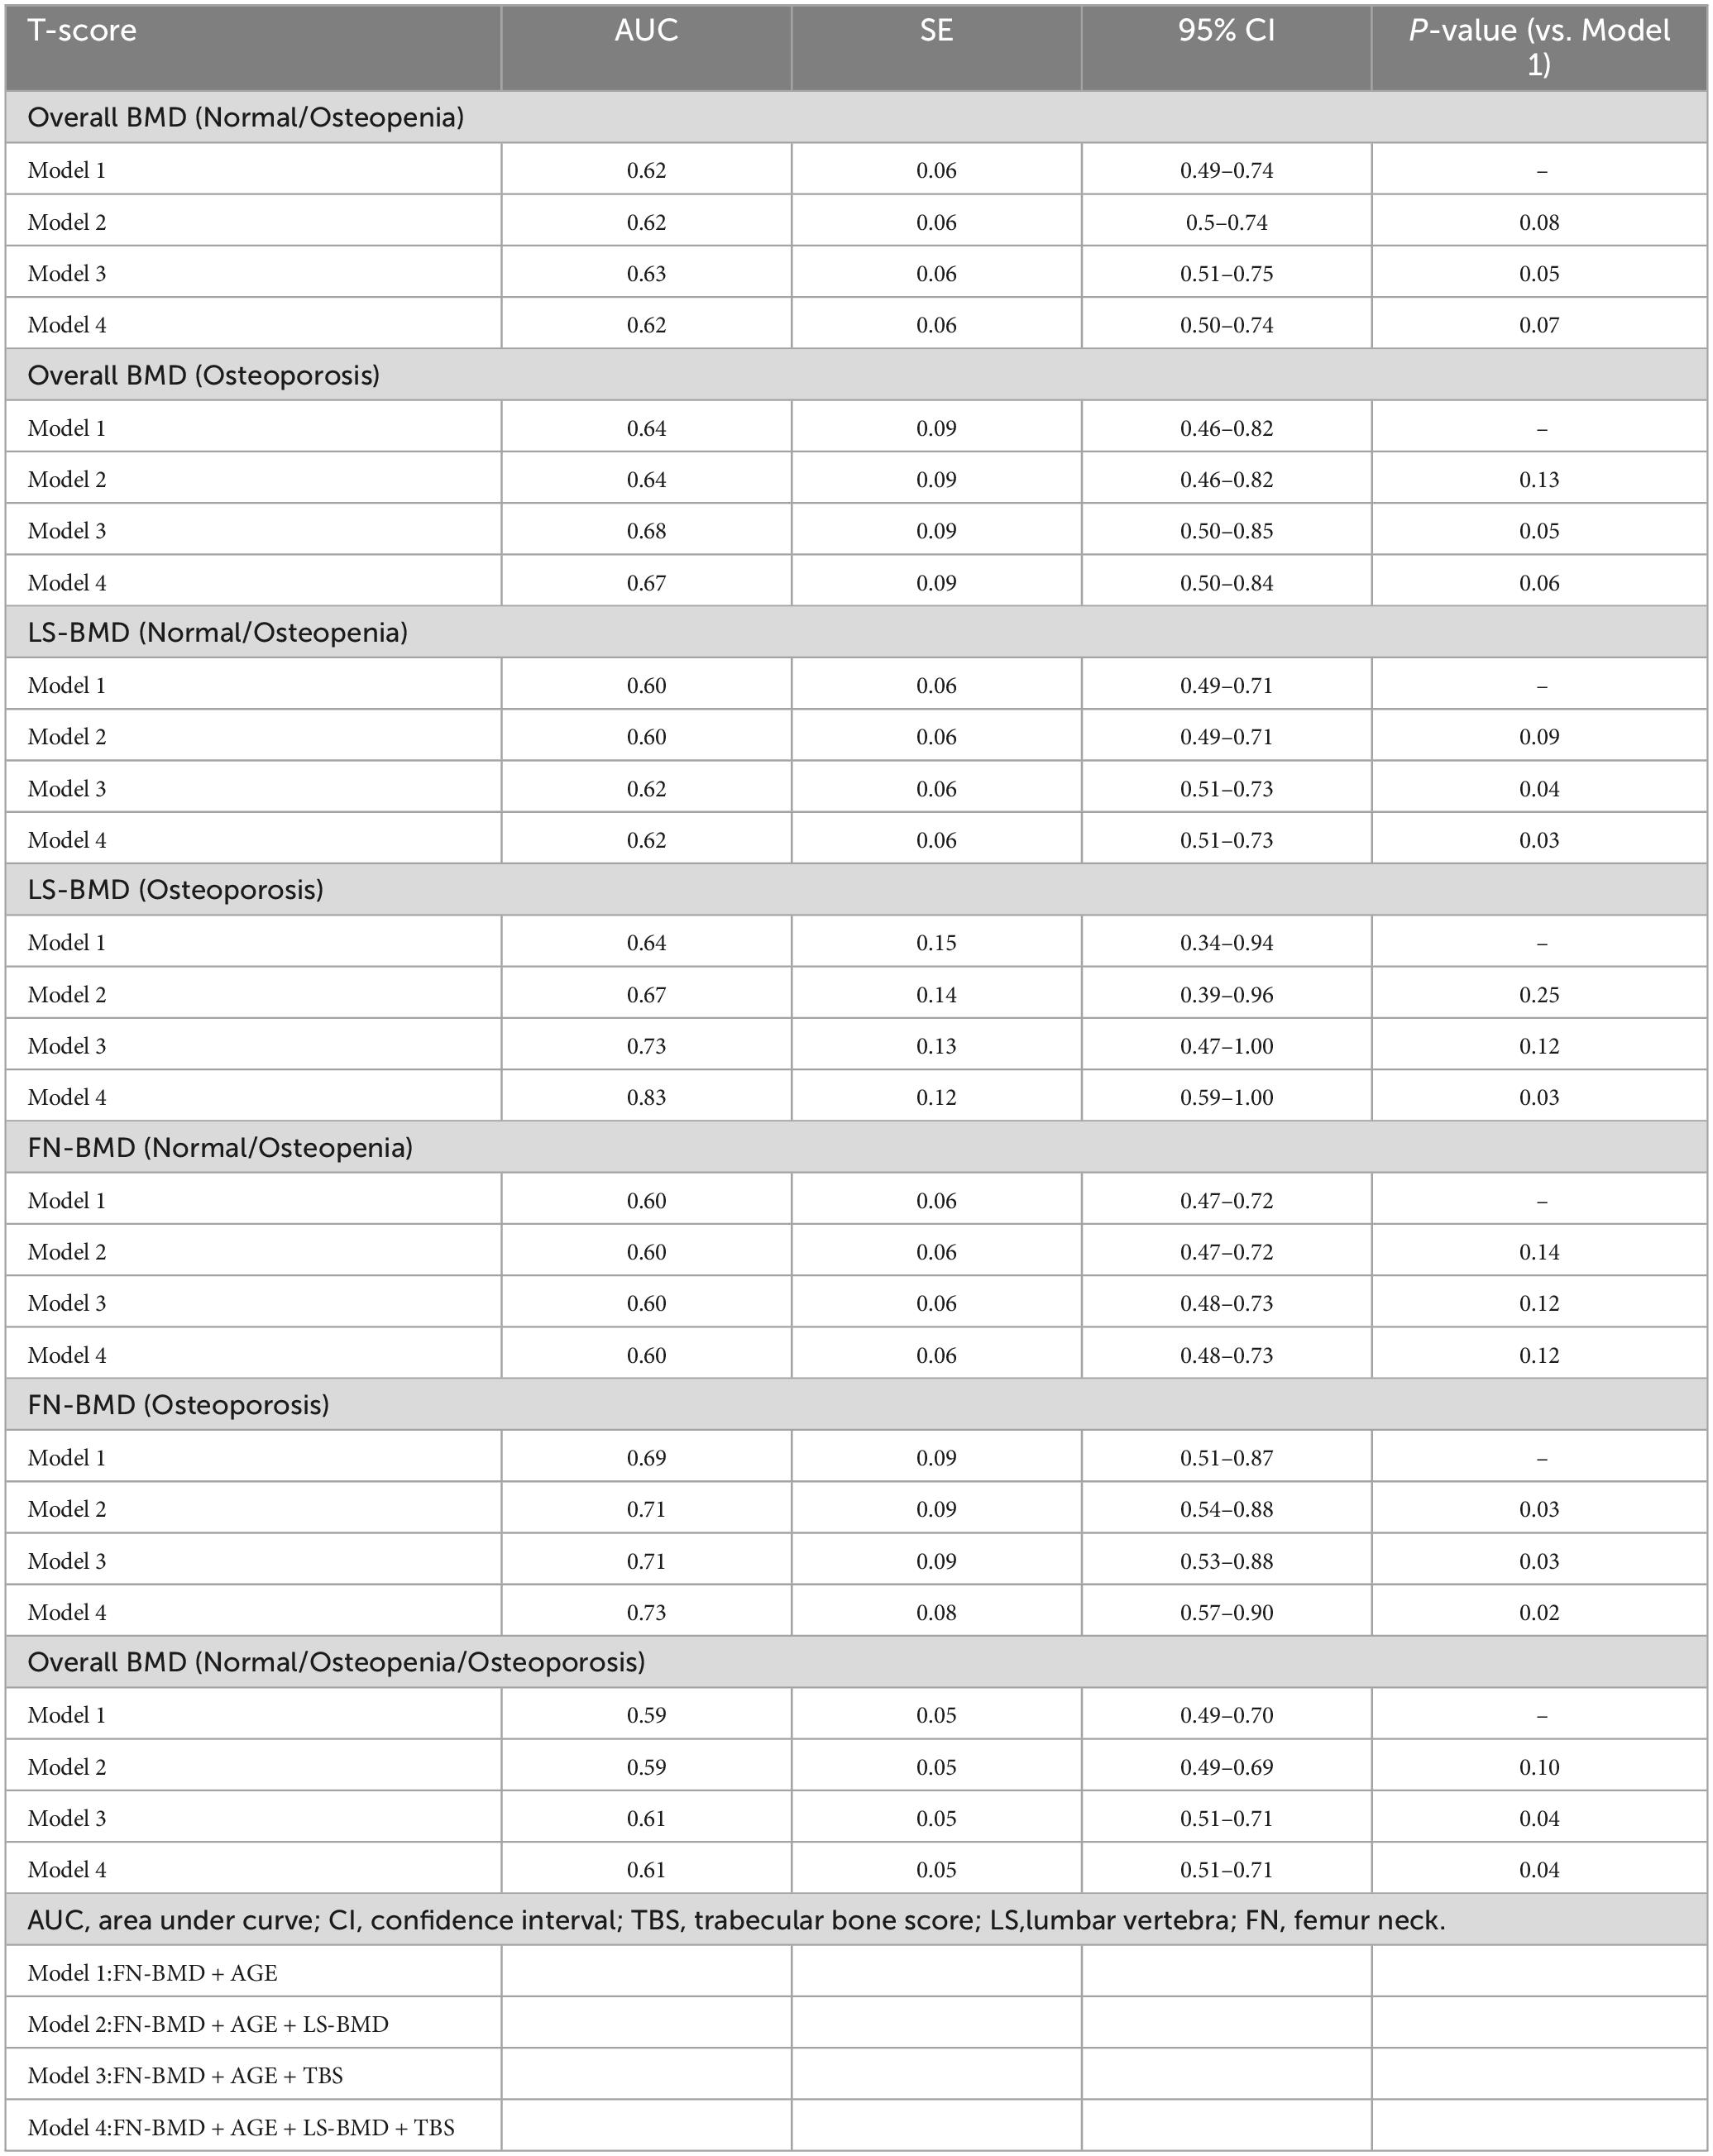
Table 6. Comparison of AUC for prediction of vertebral fracture according to WHO classification.
Discussion
In CKD patients, chronic kidney damage combined with factors like abnormal protein metabolism, insufficient vitamin D production, and secondary hyperparathyroidism causes severe mineral imbalances, leading to bone metabolism disorders. The resulting low bone turnover state is typically accompanied by higher bone quality than that of age- and sex-matched populations (13). The results of studies evaluating bone parameters (such as BMD, TBS, etc.) in CKD patients are inconsistent, and no medical consensus has been reached (14, 15), especially in dialysis-naïve CKD patients with normal BMD but reduced TBS, where further research is lacking. Additionally, the reference ranges for TBS in bone parameters vary by region, and most studies focus primarily on dialysis patients, with limited attention given to pre-dialysis CKD patients. Hence, the aim of this study is to analyze the relationship between bone parameters and pre-dialysis CKD patients in China, and compare the differences in bone quality between CKD patients classified by the Chinese TBS reference range and those classified by the META TBS reference range.
We confirmed that there were significant differences between CKD patients and the control group in the proportions of participants classified based on Overall BMD, FN-BMD, and TBS; the FN-BMD and TBS values also differed significantly between the two groups. However, LS-BMD showed no significant differences, either in the proportions classified by T-score or in the LS-BMD values. We hypothesize that the inconsistency in the results for CKD patients reflects the limitations of using only DXA-derived BMD measurements. The reason for this may be that LS-BMD is influenced by vertebral body size and pathological conditions, such as osteoarthritis, vertebral osteophytes, and abdominal aortic calcification, whereas FN-BMD and TBS are not affected by these factors (16, 17). In our study, TBS did not show a significant correlation with bone turnover parameters, which is similar to some previous findings (18). This suggests that bone microstructure deterioration and increased fracture risk may depend on factors other than high bone turnover. However, some studies have shown a link between TBS and bone turnover markers13, warranting further research. In our study, BMI was correlated with bone parameters (LS-BMD r = 0.40, P < 0.001; FN-BMD r = 0.45, P < 0.001; TBS r = 0.20, P = 0.02). As a result, the increase in adipose tissue around the region of interest may reduce the signal-to-noise ratio, leading to lower bone parameter values. Notably, the BMI of our CKD patients fell within the recommended working range for TBS (15–37 kg/m2).
In this study, TBS was significantly correlated with both LS-BMD and FN-BMD. As BMD decreased, the correlation between TBS and LS-BMD, FN-BMD strengthened. In our study, when patients were classified based on TBS scores into osteopenia, osteoporosis, and normal BMD categories, significant differences were observed. Patients with lower Overall BMD, LS-BMD, and FN-BMD had a higher proportion of TBS falling into partially reduced bone microarchitecture or reduced bone microarchitecture categories. In our study, TBS changed the diagnosis of Overall BMD, LS-BMD, and FN-BMD to a worse classification in the majority of CKD patients. Even in patients with normal BMD, lower TBS in CKD patients was clinically significant. When BMD was classified as normal or osteopenia, some patients had already sustained fractures, and their TBS was diagnosed as partially reduced bone microarchitecture or reduced bone microarchitecture. Our study demonstrates that TBS levels have predictive value for fractures not only in individuals diagnosed with osteoporosis by BMD but also in the overall population diagnosed with normal or osteopenia LS-BMD. While it is commonly believed that patients with normal BMD have fewer fractures, clinical observations show that many fracture patients actually present with normal BMD. Specifically, in this study, TBS was more predictive of fractures than BMD. This implies that CKD patients with normal bone density but reduced TBS may be more susceptible to fractures. In our study, we found that the combination of the TBS model significantly improved the ability to identify fractures in CKD patients. This may be attributed to the fact that our study population consisted of postmenopausal women and men over the age of 50, some of whom may have experienced degenerative changes in the spine. TBS, however, is not affected by these spinal degenerative changes. In contrast, BMD fails to capture the complex microstructural abnormalities associated with CKD-MBD, which can increase bone fragility and often lead to an underestimation of fracture risk. Additionally, TBS reflects the trabecular microstructure in CKD patients’ bone, and studies have shown that trabecular bone has a larger surface area and greater mineral buffering capacity compared to cortical bone (15, 19). Therefore, the model incorporating TBS significantly improves fracture discrimination in CKD patients.
The occurrence of fractures is the result of a multifactorial process, where BMD is an important factor in evaluating bone strength and fracture risk (including vertebral fractures), but bone quality is also crucial (20). Even in populations with osteopenia or normal BMD, the high fracture incidence may highlight the importance of bone quality (21). Bone quality is a multifaceted composite metric that involves trabecular microstructure, cortical bone properties, mineralization levels, metabolic state, bone marrow environment, nutritional status, and more. Alterations in these factors may independently or interactively affect bone mechanical properties and fracture resistance, ultimately leading to an increased fracture risk (22). Recent studies have also indicated that TBS reflects the trabecular microstructure of bone in CKD patients (23), and TBS measurement has been shown to be highly valuable in detecting fractures in patients with secondary osteoporosis (24). In CKD kidney transplantation studies, it was also found that when BMD is normal, TBS can reflect the fracture risk of patients (25). This phenomenon may be attributed to the complexity of CKD, where alterations in bone metabolism reflect multiple physiological processes (such as osteomalacia, hypoactive bone disease, and mixed bone disease), resulting in normal bone strength despite reduced bone quality (26), thereby increasing the fracture risk in CKD patients.
Currently, there is no standard unified reference range for TBS. The most commonly used reference range is derived from a meta-analysis (8), while some countries or regions, such as the United States, Mexico, Australia, Japan, and China, have developed their own local reference ranges to account for confounding factors like race and region (9, 27–29). Therefore, this study is the first to use the TBS China reference range to assess CKD patients in China. In our study, the number of patients classified with partial or complete bone loss based on the Chinese reference range was higher than those classified using the international reference range. Additionally, when BMD was diagnosed as normal or osteopenia, the number of fractures classified as having partially reduced bone microarchitecture or reduced bone microarchitecture using the Chinese reference range was higher than those classified with the international reference range. This indicates that the TBS classification based on the Chinese reference range has better predictive ability for fractures where diagnoses are inconsistent. It also underscores the importance of establishing regional TBS reference ranges for clinicians to evaluate the bone status of CKD patients.
This study has some limitations. First, it is a single-center retrospective study with a small sample size, and the strength of evidence is not as strong as that of a prospective study. To improve the broader applicability of our results, future research should focus on multi-center and prospective studies involving larger cohorts. Second, due to the limitation in sample size, we were unable to conduct further stratified analysis of pre-dialysis CKD patients with varying degrees of renal dysfunction to explore the bone status under different renal function conditions. Third, our study did not classify fractures or investigate their influencing factors, although some studies have shown that TBS is related to non-vertebral fractures (13). This is mainly because the number of hip fractures among the patients we included was only 3 cases, and future research needs to further expand the sample size.
In conclusion, TBS is lower in CKD patients compared to the control group, and TBS is positively correlated with BMD. For situations where there is a discrepancy with BMD diagnosis, TBS has a higher predictive value for fractures in CKD patients. Furthermore, the TBS classification based on the Chinese reference range is more strongly associated with fracture rates in CKD patients. These findings support the use of TBS as a tool for identifying fracture risk in CKD patients. However, further studies with larger sample sizes are needed to validate the conclusions of this study.
Data availability statement
The raw data supporting the conclusions of this article will be made available by the authors, without undue reservation.
Ethics statement
The studies involving humans were approved by the institutional board of The First Affiliated Hospital, Jinan University. The studies were conducted in accordance with the local legislation and institutional requirements. The participants provided their written informed consent to participate in this study. Written informed consent was obtained from the individual(s) for the publication of any potentially identifiable images or data included in this article.
Author contributions
BW: Writing – original draft, Writing – review and editing, Conceptualization, Data curation, Formal Analysis, Investigation, Methodology, Software, Validation. HW: Conceptualization, Data curation, Investigation, Project administration, Writing – original draft, Writing – review and editing. ZW: Data curation, Formal Analysis, Writing – original draft, Writing – review and editing. ZT: Data curation, Formal Analysis, Writing – original draft, Writing – review and editing. BG: Data curation, Formal Analysis, Writing – original draft, Writing – review and editing. JS: Investigation, Methodology, Writing – original draft, Writing – review and editing. YC: Data curation, Formal Analysis, Writing – original draft, Writing – review and editing. CZ: Formal Analysis, Methodology, Writing – original draft, Writing – review and editing. YJ: Formal Analysis, Methodology, Writing – original draft, Writing – review and editing. QC: Conceptualization, Data curation, Formal Analysis, Methodology, Writing – original draft, Writing – review and editing. JG: Data curation, Formal Analysis, Methodology, Project administration, Resources, Writing – original draft, Writing – review and editing. HX: Conceptualization, Data curation, Formal Analysis, Investigation, Methodology, Writing – original draft, Writing – review and editing.
Funding
The author(s) declare that financial support was received for the research and/or publication of this article. This study was financially supported by Science and Technology Projects in Guangzhou (2024A03J1042).
Conflict of interest
The authors declare that the research was conducted in the absence of any commercial or financial relationships that could be construed as a potential conflict of interest.
Generative AI statement
The authors declare that no Generative AI was used in the creation of this manuscript.
Publisher’s note
All claims expressed in this article are solely those of the authors and do not necessarily represent those of their affiliated organizations, or those of the publisher, the editors and the reviewers. Any product that may be evaluated in this article, or claim that may be made by its manufacturer, is not guaranteed or endorsed by the publisher.
References
1. Obrador G, Mahdavi-Mazdeh M, Collins A. Establishing the Global Kidney Disease Prevention Network (KDPN): A position statement from the National Kidney Foundation. Am J Kidney Dis. (2011) 57:361–70. doi: 10.1053/j.ajkd.2010.12.006
2. Zhan Y, He X, Hong D, Wang L, Li G. The current status of chronic kidney disease-mineral and bone disorder management in China. Sci Rep. (2022) 12:16694. doi: 10.1038/s41598-022-20790-8
3. Abdalbary M, Sobh M, Elnagar S, Elhadedy MA, Elshabrawy N, Abdelsalam M, et al. Management of osteoporosis in patients with chronic kidney disease. Osteoporos Int. (2022) 33:2259–74. doi: 10.1007/s00198-022-06462-3
4. Kidney Disease KDIGO 2017 clinical practice guideline update for the diagnosis, evaluation, prevention, and treatment of chronic kidney disease-mineral and bone disorder (CKD-MBD). Kidney Int Suppl. (2017) 7:1–59. doi: 10.1016/j.kisu.2017.10.001
5. El Maghraoui A, Roux C. DXA scanning in clinical practice. QJM. (2008) 101:605–17. doi: 10.1093/qjmed/hcn022
6. Seeman E, Delmas P. Bone quality–the material and structural basis of bone strength and fragility. N Engl J Med. (2006) 354:2250–61. doi: 10.1056/NEJMra053077
7. Harvey NC, Glüer CC, Binkley N, McCloskey EV, Brandi M, Cooper C, et al. Trabecular bone score (TBS) as a new complementary approach for osteoporosis evaluation in clinical practice. Bone. (2015) 78:216–24. doi: 10.1016/j.bone.2015.05.016
8. McCloskey E, Odén A, Harvey N, Leslie W, Hans D, Johansson H, et al. A meta-analysis of trabecular bone score in fracture risk prediction and its relationship to FRAX. J Bone Miner Res. (2016) 31:940–8. doi: 10.1002/jbmr.2734
9. Wu H, Wu B, Zhang S, Zhou Z, Shang J, Cheng Y, et al. Establishing age-adjusted trabecular bone score curves using dual-energy X-ray absorptiometry in Chinese women and men: A cross-sectional study. Quant Imaging Med Surg. (2023) 13:2478–85.
10. Brunerov L, Ronov P, Verešov J, Beranov P, Potoèkov J, Kasalick P, et al. Osteoporosis and impaired trabecular bone score in hemodialysis patients. Kidney Blood Press Res. (2016) 41:345–54. doi: 10.1159/000443439
11. Yavropoulou M, Vaios V, Pikilidou M, Chryssogonidis I, Sachinidou M, Tournis S, et al. Bone quality assessment as measured by trabecular bone score in patients with end-stage renal disease on dialysis. J Clin Densitom. (2017) 20:490–7. doi: 10.1016/j.jocd.2016.11.002
12. Levey A, Stevens L, Schmid C, Zhang Y, Feldman H, Kusek J, et al. A new equation to estimate glomerular filtration rate. Ann Intern Med. (2009) 150:604–12. doi: 10.7326/0003-4819-150-9-200905050-00006
13. Aleksova J, Kurniawan S, Elder G. The trabecular bone score is associated with bone mineral density, markers of bone turnover and prevalent fracture in patients with end stage kidney disease. Osteoporos Int. (2018) 29:1447–55. doi: 10.1007/s00198-018-4468-y
14. Holloway-Kew K, Rufus-Membere P, Anderson K, Betson A, Gaston J, Kotowicz M, et al. Bone material strength index is associated with prior fracture in men with and without moderate chronic kidney disease. Bone. (2020) 133:115241. doi: 10.1016/j.bone.2020.115241
15. Catalano A, Gaudio A, Bellone F, Fauci Mattia M, Xourafa A, Gembillo G, et al. Trabecular bone score and phalangeal quantitative ultrasound are associated with muscle strength and fracture risk in hemodialysis patients. Front Endocrinol. (2022) 13:940040. doi: 10.3389/fendo.2022.940040
16. Silva B, Bilezikian J. Trabecular bone score: Perspectives of an imaging technology coming of age. Arq Bras Endocrinol Metabol. (2014) 58:493–503. doi: 10.1590/0004-2730000003456
17. Yun H, Ryoo S, Kim J, Choi Y, Park I, Shin G, et al. Trabecular bone score may indicate chronic kidney disease-mineral and bone disorder (CKD-MBD) phenotypes in hemodialysis patients: A prospective observational study. BMC Nephrol. (2020) 21:299. doi: 10.1186/s12882-020-01944-0
18. Dusceac R, Niculescu D, Dobre R, Sorohan MC, Caragheorgheopol A, Tacu C, et al. Bone turnover correlates with bone quantity but not bone microarchitecture in chronic hemodialysis. J Bone Miner Metab. (2020) 38:597–604. doi: 10.1007/s00774-020-01094-1
19. Bonaccorsi G, Sciavicco G, Rinaudo L, Brigato A, Fiorella G, Carnevale A, et al. Usefulness of DXA-based bone strain index in postmenopausal women with type 2 diabetes mellitus. Arch Osteoporos. (2024) 19:54. doi: 10.1007/s11657-024-01411-5
20. Fonseca H, Moreira-Gonçalves D, Coriolano H, Duarte J. Bone quality: The determinants of bone strength and fragility. Sports Med. (2014) 44:37–53. doi: 10.1007/s40279-013-0100-7
21. Sornay-Rendu E, Munoz F, Garnero P, Duboeuf F, Delmas P. Identification of osteopenic women at high risk of fracture: The OFELY study. J Bone Miner Res. (2005) 20:1813–9. doi: 10.1359/JBMR.050609
22. Zebaze R, Ghasem-Zadeh A, Bohte A, Iuliano-Burns S, Mirams M, Price R, et al. Intracortical remodelling and porosity in the distal radius and post-mortem femurs of women: A cross-sectional study. Lancet. (2010) 375:1729–36. doi: 10.1016/S0140-6736(10)60320-0
23. Ramalho J, Marques ID, Hans D, Dempster D, Zhou H, Patel P, et al. The trabecular bone score: Relationships with trabecular and cortical microarchitecture measured by HR-pQCT and histomorphometry in patients with chronic kidney disease. Bone. (2018) 116:215–20. doi: 10.1016/j.bone.2018.08.006
24. Shevroja E, Reginster J, Lamy O, Al-Daghri N, Chandran M, Demoux-Baiada A, et al. Update on the clinical use of trabecular bone score (TBS) in the management of osteoporosis: Results of an expert group meeting organized by the European Society for Clinical and Economic Aspects of Osteoporosis, Osteoarthritis and Musculoskeletal Diseases (ESCEO), and the International Osteoporosis Foundation (IOF) under the auspices of WHO Collaborating Center for Epidemiology of Musculoskeletal Health and Aging. Osteoporos Int. (2023) 34:1501–29. doi: 10.1007/s00198-023-06817-4
25. Naylor KL, Lix LM, Hans D, Garg AX, Rush DN, Hodsman AB, et al. Trabecular bone score in kidney transplant recipients. Osteoporos Int. (2016) 27:1115–21. doi: 10.1007/s00198-015-3424-3
26. Weisinger J, Carlini R, Rojas E, Bellorin-Font E. Bone disease after renal transplantation. Clin J Am Soc Nephrol. (2006) 1:1300–13. doi: 10.2215/CJN.01510506
27. Simonelli C, Leib E, Mossman N, Winzenrieth R, Hans D, McClung M. Creation of an age-adjusted, dual-energy x-ray absorptiometry-derived trabecular bone score curve for the lumbar spine in non-Hispanic US White women. J Clin Densitom. (2014) 17:314–9. doi: 10.1016/j.jocd.2013.09.002
28. Guagnelli M, Winzenrieth R, Deleze M, Cons-Molina F, Clark P. Description of normative Spine TBS data for men and women in Mexican population. J Clin Densitom. (2021) 24:129–34. doi: 10.1016/j.jocd.2020.06.003
Keywords: chronic kidney disease, dual energy X-ray absorptiometry, bone mineral density, trabecular bone score, fracture
Citation: Wu B, Wu H, Wang Z, Tan Z, Guo B, Shang J, Cheng Y, Zeng C, Jiang Y, Cai Q, Gong J and Xu H (2025) Assessment of bone health in pre-dialysis CKD patients based on TBS reference range for the Chinese population. Front. Med. 12:1556782. doi: 10.3389/fmed.2025.1556782
Received: 07 January 2025; Accepted: 28 May 2025;
Published: 19 June 2025.
Edited by:
Divya Vohora, Jamia Hamdard University, IndiaReviewed by:
Amit Chougule, University of Michigan, United StatesYu Xiong, Ganzhou People’s Hospital, China
Copyright © 2025 Wu, Wu, Wang, Tan, Guo, Shang, Cheng, Zeng, Jiang, Cai, Gong and Xu. This is an open-access article distributed under the terms of the Creative Commons Attribution License (CC BY). The use, distribution or reproduction in other forums is permitted, provided the original author(s) and the copyright owner(s) are credited and that the original publication in this journal is cited, in accordance with accepted academic practice. No use, distribution or reproduction is permitted which does not comply with these terms.
*Correspondence: Jian Gong, Z29uZ2ppYW4yMDIxQDE2My5jb20=; Hao Xu, dHhoQGpudS5lZHUuY24=
†These authors have contributed equally to this work