Abstract
Introduction:
Dissemination indices derived from [18F]FDG PET/CT, such as Dmax, Dmaxbulk, SPREADbulk, SPREADpatient, and DmaxVox are validated prognostic biomarkers in diffuse large B-cell lymphoma. We introduce DmaxVoxMIP, the distance between the outermost voxels of the two most distant lesions on a 2D maximum intensity projection image, which is easy and straightforward to obtain. Our goal is to evaluate DmaxVoxMIP’s prognostic value compared to other features for easier clinical application.
Methods:
Metabolic tumor volume and dissemination indices were obtained from LIFEx, while DmaxVoxMIP was obtained from Telemis and OsiriX.
Results:
DmaxVoxMIP was not significantly higher in deceased than in living patients. However, patients with DmaxVoxMIP values above the derived cutoff showed a shorter survival. By combining MTV and DmaxVoxMIP, we obtained 3 risk groups for OS and PFS.
Discussion:
DmaxVoxMIP could advantageously replace other dissemination parameters as a prognostic index in patients with DLBCL.
Introduction
Diffuse large B-cell lymphoma (DLBCL) is the largest subtype of malignant lymphoma characterized by a large diversity of presentations, treatments and outcomes due to multiple histologic subtypes, genetic abnormalities, and origin of cells. In routine clinical practice, several prognostic models such as the international prognostic index (IPI) or the national comprehensive cancer network (NCCN)-IPI, are valuable to predict overall survival (OS) and progression free survival (PFS). DLBCL is the most common and aggressive histological subtype of non-Hodgkin’s lymphoma (1) with around 30% of patients experiencing refractory disease or relapse (2). Hence, it is crucial to have precise prognostic markers to recognize patients with an elevated risk of advancing or experiencing a recurrence as they could potentially gain from an early transition to innovative therapies designed to enhance their prognosis.
In the past decade, biomarkers derived from fluorine-18 fluorodeoxyglucose positron emission tomography ([18F]FDG PET), such as metabolic tumor volume (MTV)—a quantitative parameter representing the total volume of tumor tissue exhibiting radiotracer uptake above a defined threshold and therefore reflecting the metabolically active portion of the tumor -, have been proven to improve risk classification of DLBCL patients because they better reflect tumor burden compared with the Ann Arbor stage or the notion of bulky disease. Large prospective studies have demonstrated the superiority of MTV as prognostic feature over the commonly used prognostic indices (3, 4).
More recently, lesion dissemination indices derived from [18F]FDG PET have been introduced because MTV measurements do not reflect the heterogeneity of the spatial distribution of lesions often encountered in DLBCL patients. Several lesion dissemination parameters such as Dmax, Dmaxbulk, SPREADbulk, SPREADpatient and DmaxVox [also called SDmax_Euc_Vox or SDmax_Vox when normalized to the body surface area (BSA) (5)] have been validated as prognostic biomarkers in diffuse large B-cell lymphoma (DLBCL) (5–9). The distance measured for Dmax and DmaxVox is the euclidean distance. The definition of several lesion dissemination indices is graphically represented in Figure 1.
FIGURE 1

Representation of the different dissemination parameters used in this study. (A) Dmaxbulk (red arrow) is the distance between the metabolic center of the largest lesion and the most distant lesion from it (6, 7). Dmax (blue arrow) is the distance between the metabolic center of the two most distant lesions (6, 7). (B) SPREADbulk (green arrows) is the sum of the distances from the metabolic center of the largest lesion to the center of every other lesion (6, 7). (C) SPREADpatient (orange arrows) is the largest value, over all lesions, of the sum of the distances from a lesion to all the others (6, 7). (D) Representative picture illustrating the difference between Dmax (blue arrow) and DmaxVox (pink arrow) which is the distance between the outermost voxels of the two most distant lesions, and cannot be differentiated from DmaxVoxMIP on a 2D image. For illustration purposes, only a selection of arrows is shown; these do not represent all distances measured.
Dmax intuitively reflects the spatial extent of the disease and is an easily measurable dimensional feature that is less affected by acquisition or reconstruction parameters than other PET metabolic indices. In addition, its automatic measurement eliminates operator dependency, and several software tools are nowadays available to perform an accurate and reproducible analysis. Therefore, Dmax can potentially better reflect the tumor’s capacity to disseminate, endowing it with stronger prognostic power than the traditional Ann Arbor stage (10). However, one of its limitations is that it cannot be used in patients with a single lesion. Secondly, it remains unclear whether this feature is dependent on patient height and/or body composition, although several studies showed a better performance of Dmax when normalized to BSA (5, 8). To overcome some of the limitations of ‘standard’ Dmax values, the concept of SDmax_Vox has been proposed by Cottereau et al. (5) and the use of 2D MIP was validated in the study of Girum et al. (11). In the latter study, Dmax was measured on sagittal and coronal MIPs using an artificial intelligence (AI) algorithm. Therefore, the purpose of this study was to investigate the prognostic value of a novel index, DmaxVoxMIP, defined as the distance between the outermost voxels of the two most distant lesions or of a single lesion on a 2D MIP image in the coronal view in comparison to other established dissemination features.
Compared to all the other dissemination parameters, DmaxVoxMIP requires only a simple medical image viewing program (Telemis, OsiriX) and is therefore very easy to obtain. Our objective here is to demonstrate the prognostic value of DmaxVoxMIP in relation to the other dissemination features as it would allow for a simpler use of these in everyday practice. Furthermore, the use of such simplified indices may be particularly valuable in settings where access to advanced or commercial image processing tools is limited, thereby enhancing the applicability of prognostic markers across a broader range of clinical environments.
Materials and methods
Patients
We performed a bi-centric retrospective study including all consecutive adult patients with a de novo diagnosis of DLBCL between 2008 and 2017 who were treated either at the Centre Hospitalier Universitaire UCLouvain Namur or at the Cliniques universitaires Saint-Luc (Belgium). All patients underwent a baseline fluorine-18 fluorodeoxyglucose positron emission tomography/computed tomography ([18F]FDG PET/CT) before receiving any treatment, and were subsequently treated with R-CHOP or R-CHOP like chemotherapy. All patients had at least a 5-year follow-up. Of note, patients who died before 5 years were included. We excluded patients who underwent a stand-alone PET without CT, patients with a primary central nervous system lymphoma or patients with a [18F]FDG PET/CT exam divided into an “ear-nose-throat” acquisition and a “rest of body” acquisition each containing lesions, precluding accurate measurement of dissemination indices. At last, we excluded patients who were diagnosed less than 5 years prior to the study or of whom we lost touch within 5 years. This study was approved by the institutional review board and patient consent was waived because of the retrospective nature and analysis of anonymized data.
[18F]FDG PET/CT acquisition and analysis
[18F]FDG PET/CT images were obtained using a Gemini TOF-16 PET-CT camera (Philips Medical Systems). All our patients fasted for at least 6 h before FDG injection, with blood glucose levels systematically controlled at < 175 mg/dl. Injected activity ranged from 203 to 363 MBq. Iterative image reconstruction was performed using the Ordered-Subsets Expectation Maximization (OSEM) algorithm with 33 subsets and 3 iterations and with time-of-flight (TOF) information incorporated. A voxel size of 4 mm was employed throughout the process, with no additional smoothing applied to the images.
All dissemination and metabolic parameters, except DmaxVoxMIP, were obtained using LIFEx (12). DmaxVoxMIP was measured manually on the 2D MIP image in the coronal view using the Telemis and OsiriX DICOM Viewer programs. To reduce potential bias, these measurements were carried out independently by observers who were blinded to clinical outcomes. For MTV measurement, an adaptive SUV-based threshold method (Nestle) was used as previously reported (13–16).
For the sake of simplicity, we chose to omit normalization of the dissemination indices to body surface area, since this yielded fairly similar statistical results.
Statistical analysis
Statistical analysis was performed using The R Project for Statistical Computing 4.2.0 and SAS 9.4. Variables were summarized by their median and interquartile range (IQR) and compared between groups using the Wilcoxon-Mann-Whitney test. Comparisons were made between patients alive at 5 years and those deceased at 5 years, as well as between patients with and without an event at 5 years of follow-up. PFS events were defined as recurrence, progression, or death from any cause. To determine whether imaging variables improve the 5-year survival prediction of the international prognostic index (IPI) score, we used the Wald Chi-Squared test. The method of Contal and O’Quigley (17) based on logrank statistics was employed to categorize patients into “High” or “Low” risk groups for overall and progression-free survival based on each of the imaging variables. Cox proportional hazards model was used to determine the hazard ratio (HR) and its 95% confidence interval (CI95) between the high and low categories and then overall and progression-free survival curves were drawn using the Kaplan-Meier approach. Statistical significance was established for a p-value of < 0.05. In order to assess the reproducibility of DmaxVoxMIP, two more observers each analyzed 20 different patients on both Telemis and OsiriX. Bland-Altman plots were created to evaluate the agreement between the measurements.
Results
Patient characteristics
The clinical characteristics of the 104 patients included are shown in Table 1. Most patients had an advanced disease stage (73/103, 71%) and the majority were > 60 years old (66%). Median follow-up was 68.6 months (range: 0.53–166.2).
TABLE 1
| N | |
| Age | |
| Median | 68 (18–89) |
| < 60 years old | 35 (34%) |
| ≥ 60 years old | 69 (66%) |
| Ann Arbor Stage | |
| 1 | 7 (7%) |
| 2 | 24 (23%) |
| 3 | 12 (12%) |
| 4 | 61 (59%) |
| ECOG performance status | |
| 0 | 24 (23%) |
| 1 | 45 (43%) |
| 2 | 18 (17%) |
| 3 | 12 (12%) |
| 4 | 5 (5%) |
| Score IPI | |
| 0 | 3 (3%) |
| 1, 2 | 42 (40%) |
| 3, 4, 5 | 59 (57%) |
Patients characteristics.
At the time of data collection and last follow-up, 50 patients had died from any cause. Of these, 35 patients had died within 5 years of lymphoma diagnosis and 29/35 died of lymphoma. Of the 15 patients who died after a 5-year follow-up period, 2 deaths were lymphoma-related. At time of data collection, 54 patients had a PFS event (relapse, progression, or death of any cause), including 39 within the 5-year follow-up. The 5-year overall survival (5-y OS) and 5-year progression free survival (5-y PFS) were 66 and 63% respectively.
PET indices
The Bland-Altman plot in Supplementary Figure 1 (comparing DmaxVoxMIP measurements on the same PET by the same observer) shows good repeatability.
The Bland-Altman plots in Figure 2A (comparing DmaxVoxMIP measurements between observer 1 and 2) and Figure 2B (between observer 1 and 3) and in Supplementary Figure 2 (between observer 2 and 3) show only small differences between observers and no systematic bias. Likewise, the Bland-Altman plot comparing DmaxVox and DmaxVoxMIP in Figure 3A shows small differences and no systematic bias. The scatterplot (Figure 3B) shows a strong positive correlation between DmaxVox and DmaxVoxMIP with R of 0.9985.
FIGURE 2
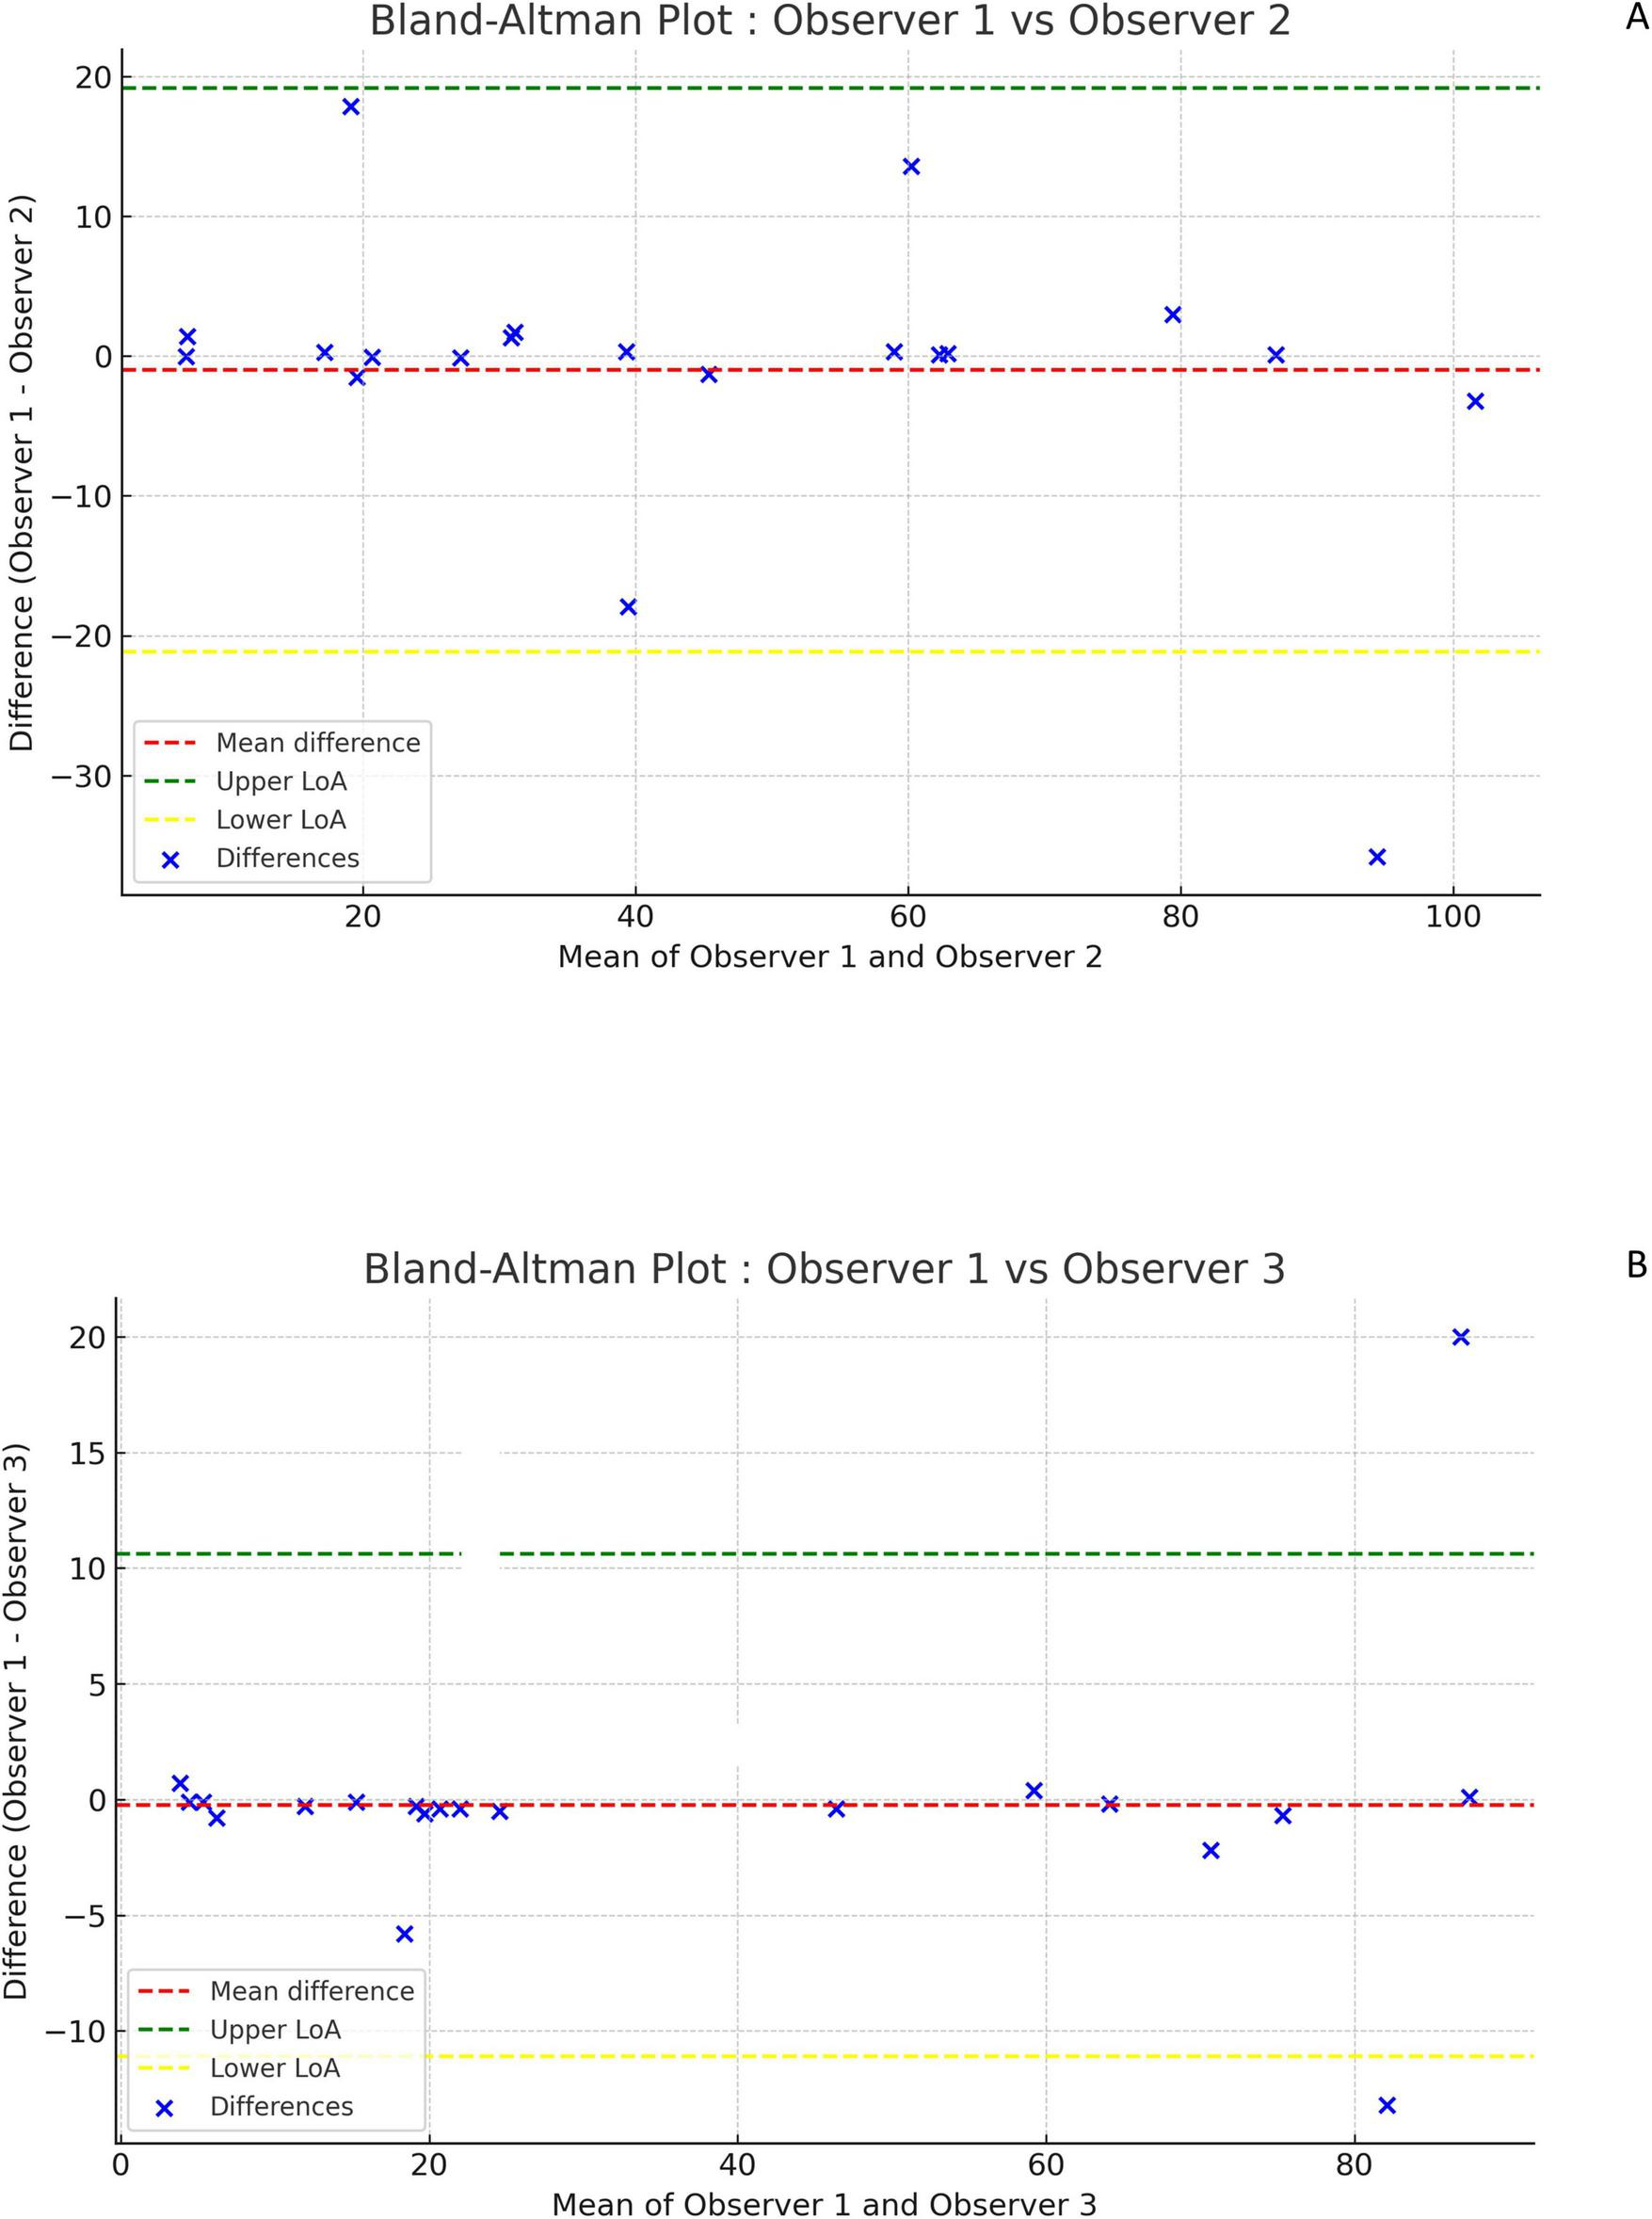
Bland-Altman plots comparing DmaxVoxMIP measurements between observers. Difference between measurements of observer 1 and 2 versus their mean (A). Difference between measurements of observer 1 and 3 versus their mean (B).
FIGURE 3

Bland-Altman plots comparing DmaxVox and DmaxVoxMIP(A) and scatterplot showing the correlation between DmaxVox and DmaxVoxMIP(B). Difference between measurements of DmaxVox and DmaxVoxMIP versus their mean (A).
MTV was significantly higher in patients who died within 5 years compared to those alive at 5-year follow-up (p = 0.031). In contrast, no significant difference was found between groups for any of the dissemination features (Table 2).
TABLE 2
| Variables | Alive at 5 years (n = 69) | Deceased at 5 years (n = 35) | p-value | ||
| Median [IQR] | Range | Median [IQR] | Range | ||
| MTV (mL) | 298.00 [60.00, 1148.00] | 2; 8368 | 534.00 [266.50, 1792.00] | 19; 5509 | 0.031 |
| Dmax (cm) | 30.20 [8.10, 60.60] | 0; 93.4 | 47.70 [20.50, 66.60] | 3.9; 101.2 | 0.151 |
| DmaxVox (cm) | 37.70 [14.70, 62.50] | 2.2; 98.4 | 51.00 [24.70, 72.55] | 9.4; 109.2 | 0.106 |
| DmaxVoxMIP (cm) | 37.90 [15.10, 62.30] | 2.4; 96.9 | 49.30 [23.75, 72.95] | 5.3; 107.5 | 0.107 |
| Dmaxbulk (cm) | 27.10 [8.10, 43.80] | 0; 72.7 | 33.40 [14.10, 45.95] | 3.9; 83.7 | 0.176 |
| SPREADbulk (cm) | 67.90 [13.00, 300.00] | 0; 2227 | 197.00 [56.65, 478.50] | 3.9; 2044 | 0.104 |
| SPREADpatient (cm) | 291.00 [31.10, 6994.00] | 0; 145052 | 1452.00 [313.50, 10341.50] | 7.8; 158218 | 0.097 |
Comparison of variables between groups alive at 5 years and deceased at 5 years.
Patients who experienced an event within 5 years had significantly higher MTV values compared to those who did not (p = 0.027). Similarly, DmaxVox (p = 0.048), SPREADbulk (p = 0.044) and SPREADpatient (p = 0.037) showed significant differences between the two groups. DmaxVoxMIP was higher in the event group than in the non-event group, but not significantly so (p = 0.052) (Table 3).
TABLE 3
| Variables | No PFS event at 5 years (n = 65) | PFS event at 5 years (n = 39) | p-value | ||
| Median [IQR] | Range | Median [IQR] | Range | ||
| MTV (ml) | 284.00 [60.00, 1101.00] | 2; 8368 | 534.00 [240.50, 1759.00] | 19; 5509 | 0.027 |
| Dmax (cm) | 30.20 [8.10, 60.10] | 0; 93.4 | 53.30 [19.90, 67.40] | 3.9; 101.2 | 0.069 |
| DmaxVox (cm) | 35.80 [14.70, 62.10] | 2.2; 98.4 | 59.10 [22.60, 75.50] | 9.4; 109.2 | 0.048 |
| DmaxVoxMIP (cm) | 35.70 [15.10, 61.80] | 2.4; 96.9 | 58.1 [21.80, 75.00] | 5.3; 107.5 | 0.052 |
| Dmaxbulk (cm) | 26.80 [8.10, 43.40] | 0; 72.7 | 33.40 [13.80, 46.60] | 3.9; 83.7 | 0.118 |
| SPREADbulk (cm) | 46.50 [13.00, 290.00] | 0; 2227 | 198.00 [50.30, 510.00] | 3.9; 2044 | 0.044 |
| SPREADpatient (cm) | 280.00 [32.10, 6591.00] | 0; 139349 | 2013.00 [261.00, 12173.00] | 7.8; 158218 | 0.037 |
Comparison of variables between groups with and without event at 5 years of follow-up.
As illustrated in Table 4, adding PET metabolic or dissemination indices to the IPI variable did not significantly improve the discrimination between deceased and surviving patients, neither between patients free of disease and patients with a PFS event at 5-year follow-up.
TABLE 4
| 5-y OS | 5-y PFS | |||||||
| Variables | HR | Lower limit | Upper limit | ¶ p-value | HR | Lower limit | Upper limit | ¶ p-value |
| Dmax | 1.395 | 0.396 | 4.915 | 0.6046 | 1.555 | 0.758 | 3.190 | 0.2288 |
| DmaxVox | 1.696 | 0.409 | 7.037 | 0.4669 | 1.489 | 0.732 | 3.028 | 0.2717 |
| DmaxVoxMIP | 1.295 | 0.416 | 4.032 | 0.6559 | 1.489 | 0.732 | 3.028 | 0.2717 |
| Dmaxbulk | 1.543 | 0.441 | 5.400 | 0.4976 | 1.283 | 0.413 | 3.989 | 0.6669 |
| SPREADbulk | 1.427 | 0.541 | 3.767 | 0.4726 | 1.522 | 0.617 | 3.752 | 0.3621 |
| SPREADpatient | 1.249 | 0.478 | 3.266 | 0.6497 | 1.365 | 0.558 | 3.340 | 0.4950 |
| MTV | 1.290 | 0.516 | 3.229 | 0.5861 | 1.447 | 0.618 | 3.384 | 0.3944 |
Hazard ratios for OS and PFS for imaging variables added to a survival model already containing the IPI.
¶ p-value of the Wald Chi-square test for the addition of the imaging variable to the survival model already containing IPI.
Table 5 shows the hazard ratio with 95% CI for the 5-year OS and PFS for each individual PET-derived variable considering the group “Low” as a reference. All imaging features provided significant prognostic information with regard to 5-y OS and 5-y PFS.
TABLE 5
| 5-y OS | 5-y PFS | |||||||||
| Variables | Cutoff | Survival rate “High” | Survival rate “Low” | HR (95%CI) | p-value | Cutoff | Survival rate “High” | Survival rate “Low” | HR (95%CI) | p-value |
| Dmax | 10.1 cm | 61% (31/79) | 84% (4/25) | 2.97 (1.05–8.43) | 0.0313 | 61.8 cm | 44% (15/27) | 69% (24/77) | 2.29 (1.20–4.37) | 0.0097 |
| DmaxVox | 16 cm | 61% (32/82) | 86% (3/22) | 3.50 (1.07–11.45) | 0.0268 | 63.8 cm | 47% (16/30) | 69% (23/74) | 2.16 (1.14–4.09) | 0.0156 |
| DmaxVoxMIP | 19 cm | 61% (30/76) | 82% (5/28) | 2.70 (1.05–6.96) | 0.0323 | 63.3 cm | 47% (16/30) | 69% (23/74) | 2.16 (1.14–4.09) | 0.0156 |
| Dmaxbulk | 10.1 cm | 60% (31/78) | 85% (4/26) | 3.15 (1.11–8.93) | 0.0227 | 10.1 cm | 56% (34/78) | 81% (5/26) | 2.83 (1.11–7.24) | 0.0233 |
| Spreadbulk | 50.3 cm | 56% (27/62) | 81% (8/42) | 2.76 (1.25–6.08) | 0.0086 | 50.3 cm | 52% (30/62) | 79% (9/42) | 2.87 (1.36–6.05) | 0.0038 |
| Spreadpatient | 366 cm | 57% (26/60) | 80% (9/44) | 2.53 (1.19–5.41) | 0.0128 | 366 cm | 52% (29/60) | 77% (10/44) | 2.66 (1.30–5.47) | 0.0056 |
| MTV | 332 ml | 56% (25/57) | 79% (10/47) | 2.59 (1.24–5.39) | 0.0085 | 332 ml | 51% (28/57) | 77% (11/47) | 2.73 (1.36–5.49) | 0.0033 |
PET parameters associated with OS and PFS in log-rank cox tests.
“High”/”Low”: groups defined by the variable being more/less than the specified cutoff, HR (95%CI): Hazard ratio and corresponding 95% confidence interval based on Cox model, p-value: logrank test p-value, numbers between brackets represent the number of patients in a group who experienced an event over the total number of patients of the group; total number of patient is 104.
Kaplan-Meier curves of 5-year OS and PFS for Dmax and DmaxVoxMIP according to the optimal dichotomization are shown in Figure 4. Based on a combination of DmaxVoxMIP and MTV, three risk categories could be distinguished: group 1 with low DmaxVoxMIP and low MTV (Low-Low), group 2 with either high DmaxVoxMIP or high MTV (Mixed) and lastly group 3 with high DmaxVoxMIP and high MTV (High-High). These three groups had nearly significantly different 5-y OS rates of 83, 69, and 57% respectively and significantly different 5-y PFS rates of 75, 60, and 44% (Figure 4). For groups 2 and 3, using group 1 as a reference, the 5-y OS HR were 2.04 and 3.29 and 5-y PFS HR were 1.86 and 3.04 (Figure 4).
FIGURE 4
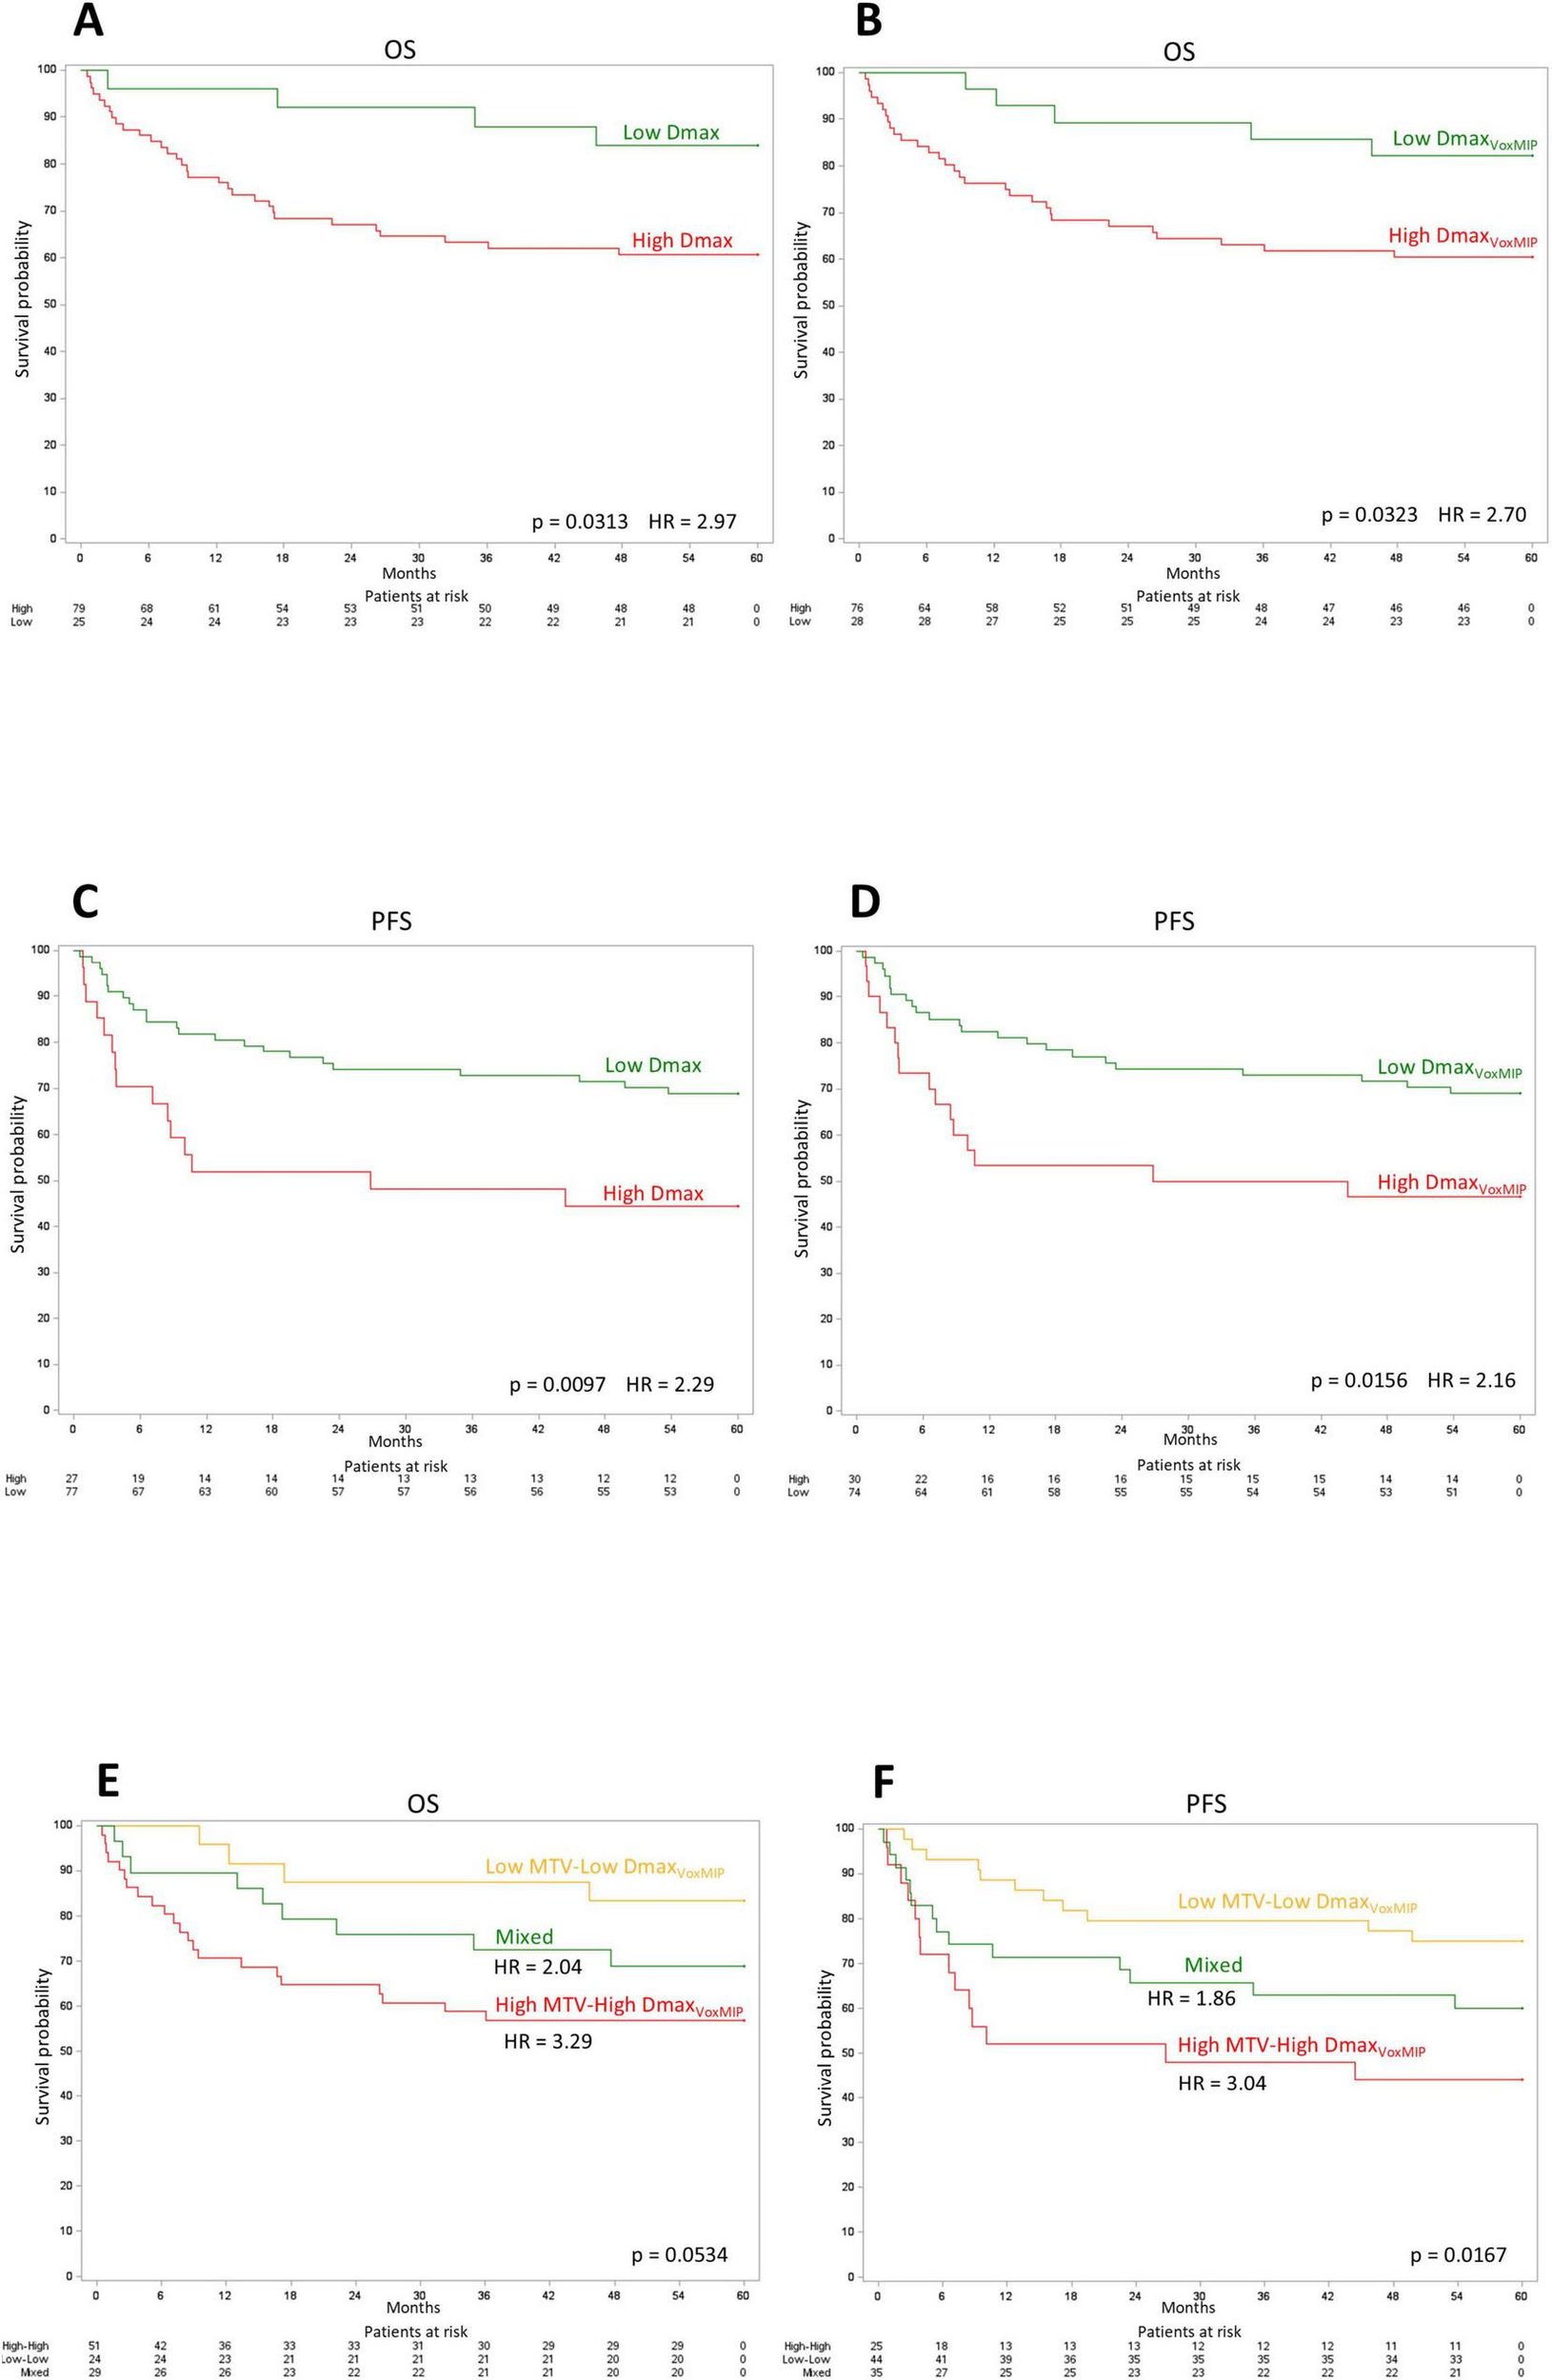
Kaplan-Meier curves. Kaplan-Meier OS curves for Dmax (A) and DmaxVoxMIP(B). Kaplan-Meier PFS curves for Dmax (C) and DmaxVoxMIP(D). Kaplan-Meier OS (E) and PFS (F) curves using a cross-classification of the MTV and DmaxVoxMIP variables.
The addition of MTV or DmaxVoxMIP (as continuous parameters) to survival models including the IPI score as a (categorical) explanatory variable for either overall survival or progression free survival endpoints, did not bring statistically significant improvement (Table 4). The absence of statistically significant improvement may be partly due to limited sample size, potentially affecting the power to detect incremental prognostic value of PET metrics.
Discussion
In the present study, we showed in a retrospective bi-centric cohort, that the dissemination index DmaxVoxMIP, which is the distance between the outermost voxels of the most distant lymphoma sites, is a prognostic parameter with similar performance characteristics as Dmax.
First, confirming literature data, we found that Dmax, DmaxVox, Dmaxbulk, SPREADbulk, SPREADpatient carry significant prognostic value for 5-y OS and 5-y PFS (5–9). The method of Contal and Quigley (17) based on the logrank statistic that is best suited for survival analysis has been used (rather than the usual Youden criterion) to determine optimal cutoff values for these variables.
SDmax_Vox (DmaxVox, calculated from the two most distant voxels and normalized by the BSA) has been shown to slightly improve the prognostic value of SDmax (calculated from the centroids) (5). This could potentially open the door to an easier method to gauge dissemination extent, by measuring the distance on a 2D MIP (5). Therefore, in this study, we introduced a new index of dissemination, measured manually on a 2D MIP in the coronal view: DmaxVoxMIP. The prognostic significance of DmaxVoxMIP was demonstrated when patients were classified according to the optimal threshold determined by the Contal and O’Quigley method, showing statistically significant differences in 5-year OS and 5-year PFS. This provides additional evidence that advanced assessment of tumor spread is relevant in DLBCL patients (5–9).
It seems more intuitive to analyze lesion dissemination by considering the most distant points of the lesions rather than their center. Although Dmax and DmaxVox (or DmaxVoxMIP) are similar for small-sized lesions, a bulky lesion may lead to underestimation of the spread by Dmax. Furthermore, we noted that lesion selection can vary considerably depending on how the software segments the regions of interest (ROIs). This can be particularly important when lesions present unusual shapes and can wrongfully lead to the segmentation of a single lesion into several distinct regions. Manual confirmation of segmentation is always required for Dmax.
While Dmax depends on ROIs selection, DmaxVox and DmaxVoxMIP are independent of it. Moreover, as their calculation does not rely on lesion centroids, both DmaxVox and DmaxVoxMIP can be applied to patients with a single lesion, by measuring the longest intra-lesion diameter. DmaxVoxMIP does not require any automated tumor segmentation program. On the other hand, DmaxVox and DmaxVoxMIP are more sensitive to lesion edge definition than Dmax and may therefore be somewhat more influenced by image acquisition and reconstruction parameters.
The use of 2D MIP images was recently described in a study investigating whether MTV and Dmax could be replaced by surrogate parameters calculated automatically using an AI algorithm from just 2 MIPs (coronal and sagittal) (11). This study found that the delineation of lymphoma regions on 2D MIP images is faster than on 3D volumes, and that training an automated tumor segmentation algorithm is easier in 2D than in 3D. STMTV and SDmax were evaluated for their prognostic value in two independent cohorts of lymphoma patients (11). The results showed that STMTV and SDmax calculated automatically by AI have a strong prognostic value for progression-free survival and overall survival, comparable to that of TMTV and Dmax calculated from 3D volumes. The researchers also showed that using 2D MIP for parameter extraction reduced inter-expert variation in lesion delineation (11).
In our study, we used a more practical method with 2D MIP images, measuring the distance between the outermost voxels by hand. DmaxVoxMIP showed a strong correlation with DmaxVox obtained using LIFEx software. The Bland-Altman plot revealed that the largest differences occurred for the largest distances, as expected. Additionally, the plot showed mostly positive differences, but also some negative ones, indicating that different endpoints were designated for DmaxVox and DmaxVoxMIP. Furthermore, we demonstrated that DmaxVoxMIP is reproducible between observers. Compared with DmaxVox, DmaxVoxMIP yields comparable differences between patients alive or deceased at 5 years, or between patients with or without events within 5 years. It also provides similar overall and progression-free survival rates and risk stratification as Dmax. This method is simple, quick, and easily obtainable, making it a viable alternative for distance measurements.
A limitation of our method is the possible presence of one of the extreme lesions behind organs displaying high tracer concentrations such as the bladder or the heart. To exclude any lesion behind a physiological uptake in the heart or the bladder, the sagittal 2D MIP was also viewed.
We combined DmaxVoxMIP to MTV to create three groups showing nearly significantly different 5-y OS rates and significantly different 5-y PFS rates similarly to what Cotterau et al. obtained in their articles (6, 8). However, combining PET-derived parameters (dissemination and MTV) showed no improvement to IPI’s predictive value. This can most likely be explained by the fact that the prognostic information of these PET metrics is already covered by constituents of the IPI score (18–20).
A limitation of this work is the use of a retrospective design, and the disadvantages that entails, such as misclassification bias (e.g., patients being assigned to the wrong Ann Arbor stage), patients lost to follow-up, missing data, etc. Moreover, cut-offs were obtained from this study dataset. Therefore, they are only valid for this specific cohort, as is the case for most studies on dissemination features (10).
Conclusion
To conclude, DmaxVoxMIP is an easy parameter to measure on [18F]FDG PET/CT, foregoing the use of a segmentation program. If dissemination parameters prove useful clinically, Dmax could possibly be advantageously replaced by DmaxVoxMIP, but future prospective studies are needed to confirm our results.
Statements
Data availability statement
The raw data supporting the conclusions of this article will be made available by the authors, without undue reservation.
Ethics statement
Written informed consent was not obtained from the individual(s) for the publication of any potentially identifiable images or data included in this article because this is a retrospective study based solely on the collection of already existing data in the medical/paramedical files of the patients, and who have not expressed their opposition to the use of their medical files for scientific research purposes. We have obtained the exemption of informed consent from the patient from the Ethics Committee.
Author contributions
IK: Writing – original draft, Writing – review and editing. OG: Writing – original draft, Writing – review and editing. MR: Writing – review and editing. AC: Writing – review and editing. MA: Writing – review and editing. EV: Writing – review and editing. TV: Writing – review and editing.
Funding
The author(s) declare that no financial support was received for the research and/or publication of this article.
Conflict of interest
The authors declare that the research was conducted in the absence of any commercial or financial relationships that could be construed as a potential conflict of interest.
Generative AI statement
The authors declare that no Generative AI was used in the creation of this manuscript.
Publisher’s note
All claims expressed in this article are solely those of the authors and do not necessarily represent those of their affiliated organizations, or those of the publisher, the editors and the reviewers. Any product that may be evaluated in this article, or claim that may be made by its manufacturer, is not guaranteed or endorsed by the publisher.
Supplementary material
The Supplementary Material for this article can be found online at: https://www.frontiersin.org/articles/10.3389/fmed.2025.1565525/full#supplementary-material
Supplementary Figure 1Bland-Altman plot comparing repeated DmaxVoxMIP measurements by one observer.
Supplementary Figure 2Bland-Altman plot comparing DmaxVoxMIP measurements between observers 2 and 3.
References
1.
Sant M Allemani C Tereanu C De Angelis R Capocaccia R Visser O et al Incidence of hematologic malignancies in Europe by morphologic subtype: Results of the HAEMACARE project. Blood. (2010) 116:3724–34. 10.1182/blood-2010-05-282632
2.
Crump M Neelapu S Farooq U Van Den Neste E Kuruvilla J Westin J et al Outcomes in refractory diffuse large B-cell lymphoma: Results from the international SCHOLAR-1 study. Blood. (2017) 130:1800–8. 10.1182/blood-2017-03-769620
3.
Islam P Goldstein J Flowers CR . PET-derived tumor metrics predict DLBCL response and progression-free survival.Leuk Lymphoma. (2019) 60:1965–71. 10.1080/10428194.2018.1562181
4.
Cottereau A Lanic H Mareschal S Meignan M Vera P Tilly H et al Molecular profile and FDG-PET/CT total metabolic tumor volume improve risk classification at diagnosis for patients with diffuse large B-Cell lymphoma. Clin Cancer Res. (2016) 22:3801–9. 10.1158/1078-0432.CCR-15-2825
5.
Cottereau A Meignan M Nioche C Clerc J Chartier L Vercellino L et al New approaches in characterization of lesions dissemination in DLBCL patients on baseline PET/CT. Cancers (Basel). (2021) 13:3998. 10.3390/cancers13163998
6.
Cottereau A Nioche C Dirand A Clerc J Morschhauser F Casasnovas O et al 18F-FDG PET dissemination features in diffuse large B-Cell lymphoma are predictive of outcome. J Nucl Med. (2020) 61:40–5. 10.2967/jnumed.119.229450
7.
Eertink J van de Brug T Wiegers S Zwezerijnen G Pfaehler E Lugtenburg P et al 18F-FDG PET baseline radiomics features improve the prediction of treatment outcome in diffuse large B-cell lymphoma. Eur J Nucl Med Mol Imaging. (2022) 49:932–42. 10.1007/s00259-021-05480-3
8.
Cottereau A Meignan M Nioche C Capobianco N Clerc J Chartier L et al Risk stratification in diffuse large B-cell lymphoma using lesion dissemination and metabolic tumor burden calculated from baseline PET/CT†. Ann Oncol. (2021) 32:404–11. 10.1016/j.annonc.2020.11.019
9.
Eertink J Zwezerijnen G Cysouw M Wiegers S Pfaehler E Lugtenburg P et al Comparing lesion and feature selections to predict progression in newly diagnosed DLBCL patients with FDG PET/CT radiomics features. Eur J Nucl Med Mol Imaging. (2022) 49:4642–51. 10.1007/s00259-022-05916-4
10.
Albano D Treglia G Dondi F Calabrò A Rizzo A Annunziata S et al 18F-FDG PET/CT maximum tumor dissemination (Dmax) in lymphoma: A new prognostic factor? Cancers (Basel). (2023) 15:2494. 10.3390/cancers15092494
11.
Girum K Rebaud L Cottereau A Meignan M Clerc J Vercellino L et al 18F-FDG PET maximum-intensity projections and artificial intelligence: A win-win combination to easily measure prognostic biomarkers in DLBCL patients. J Nucl Med. (2022) 63:1925–32. 10.2967/jnumed.121.263501
12.
Nioche C Orlhac F Boughdad S Reuzé S Goya-Outi J Robert C et al LIFEx: A freeware for radiomic feature calculation in multimodality imaging to accelerate advances in the characterization of tumor heterogeneity. Cancer Res. (2018) 78:4786–9. 10.1158/0008-5472.CAN-18-0125
13.
Voltin C Mettler J Grosse J Dietlein M Baues C Schmitz C et al FDG-PET imaging for hodgkin and diffuse large B-Cell lymphoma-An updated overview. Cancers (Basel). (2020) 12:601. 10.3390/cancers12030601
14.
Kostakoglu L Chauvie S . Metabolic tumor volume metrics in lymphoma.Semin Nucl Med. (2018) 48:50–66. 10.1053/j.semnuclmed.2017.09.005
15.
Cottereau A Hapdey S Chartier L Modzelewski R Casasnovas O Itti E et al Baseline total metabolic tumor volume measured with fixed or different adaptive thresholding methods equally predicts outcome in peripheral T cell lymphoma. J Nucl Med. (2017) 58:276–81. 10.2967/jnumed.116.180406
16.
Nestle U Kremp S Schaefer-Schuler A Sebastian-Welsch C Hellwig D Rübe C et al Comparison of different methods for delineation of 18F-FDG PET-positive tissue for target volume definition in radiotherapy of patients with non-Small cell lung cancer. J Nucl Med. (2005) 46:1342–8.
17.
Contal C O’Quigley J . An application of changepoint methods in studying the effect of age on survival in breast cancer.Comput Stat Data Anal. (1999) 30:253–70. 10.1016/S0167-9473(98)00096-6
18.
Ziepert M Hasenclever D Kuhnt E Glass B Schmitz N Pfreundschuh M et al Standard International prognostic index remains a valid predictor of outcome for patients with aggressive CD20+ B-cell lymphoma in the rituximab era. J Clin Oncol. (2010) 28:2373–80. 10.1200/JCO.2009.26.2493
19.
International Non-Hodgkin’s Lymphoma Prognostic Factors Project. A predictive model for aggressive non-Hodgkin’s lymphoma. N Engl J Med. (1993) 329:987–94. 10.1056/NEJM199309303291402
20.
Ruppert A Dixon J Salles G Wall A Cunningham D Poeschel V et al International prognostic indices in diffuse large B-cell lymphoma: A comparison of IPI. R-IPI, and NCCN-IPI. Blood. (2020) 135:2041–8. 10.1182/blood.2019002729
Summary
Keywords
[18F]FDG PET/CT, oncology, lymphoma, DLBCL, dissemination
Citation
Kargar Samani I, Gheysens O, Regnier M, Collard A, André M, Van Den Neste E and Vander Borght T (2025) Prognostic value of a simple distance index derived from PET maximum intensity projection. Front. Med. 12:1565525. doi: 10.3389/fmed.2025.1565525
Received
23 January 2025
Accepted
23 June 2025
Published
14 July 2025
Volume
12 - 2025
Edited by
Egesta Lopci, University of Milan, Italy
Reviewed by
Edel Noriega-Álvarez, University Hospital of Guadalajara, Spain
Frank W. De Geeter, Independent Researcher, Brugge, Belgium
Updates
Copyright
© 2025 Kargar Samani, Gheysens, Regnier, Collard, André, Van Den Neste and Vander Borght.
This is an open-access article distributed under the terms of the Creative Commons Attribution License (CC BY). The use, distribution or reproduction in other forums is permitted, provided the original author(s) and the copyright owner(s) are credited and that the original publication in this journal is cited, in accordance with accepted academic practice. No use, distribution or reproduction is permitted which does not comply with these terms.
*Correspondence: Isaac Kargar Samani, isaac.kargar@gmail.com
†These authors have contributed equally to this work
Disclaimer
All claims expressed in this article are solely those of the authors and do not necessarily represent those of their affiliated organizations, or those of the publisher, the editors and the reviewers. Any product that may be evaluated in this article or claim that may be made by its manufacturer is not guaranteed or endorsed by the publisher.