 Kunjie Wang1†
 Weiguang Yu
- 1Department of Medical Oncology, Affiliated Hospital of Hebei University, Hebei Key Laboratory of Cancer Radiotherapy and Chemotherapy, Baoding, Hebei, China
- 2Department of Emergency Surgery and Orthopaedics, The First Affiliated Hospital, Sun Yat-sen University, Guangzhou, China
Objective: This study seeks to identify clinicopathological risk factors associated with tumor deposits (TD) development in stage I-III gastric cancer patients and to construct a visualized predictive model for clinical application.
Methods: A retrospective cohort of 1,284 gastric cancer patients treated at the Affiliated Hospital of Hebei University (September 2010–September 2022) was analyzed. Patients were stratified into training (n = 963) and validation (n = 321) cohorts via simple randomization at a 3:1 ratio. Lasso regression analysis was employed to screen variables, followed by multivariate logistic regression to establish an individualized nomogram. Model performance was evaluated using the area under the receiver operating characteristic curve (AUC), calibration plots, and decision curve analysis (DCA).
Results: TD-positive patients (n = 224) exhibited significantly reduced overall survival and disease-free survival compared to TD-negative counterparts (n = 1,060, p < 0.05). Multivariate logistic regression analysis confirmed tumor size (OR = 1.26; 95% CI 1.01–2.21), elevated CEA (OR = 2.04; 95% CI 1.02–3.16), elevated CA199 (OR = 1.007, 95% CI:1.003–1.011), and pN stage (OR = 3.22; 95% CI 2.12–4.34) as independent predictors of TD occurrence (all p < 0.05). The nomogram demonstrated robust discriminative capacity, with AUC values of 0.803 (95% CI 0.751–0.894) and 0.864 (95% CI 0.725–0.917) in the training and validation cohorts, respectively. Calibration plots revealed excellent agreement between predicted and observed probabilities. DCA further validated the model’s clinical utility, showing superior net benefits across threshold probabilities of 1–99%.
Conclusion: This TD-specific nomogram, incorporating tumor size, serum biomarkers (CEA/CA199), and pathological staging (pN), provides a clinically applicable tool for preoperative risk stratification and personalized therapeutic decision-making in stage I-III gastric cancer.
Introduction
Gastric adenocarcinoma remains a formidable global health burden, ranking as the fifth most prevalent malignancy and the fourth leading cause of cancer-related mortality worldwide (1–6). While diagnostic advancements have improved early-stage detection, approximately 30% of patients with clinically localized disease (Stage I-III) experience unexpected failure, highlighting critical gaps in current prognostic stratification systems (7–10). Emerging evidence identifies tumor deposits (TDs) - discrete perigastric neoplastic nodules distinct from lymphatic metastases - as pivotal determinants of adverse oncological outcomes (11–15). These extranodal tumor manifestations demonstrate strong correlations with occult micrometastatic dissemination, vascular invasion patterns, and significantly reduced survival rates across multiple cohorts (16–19).
Contemporary studies (16, 18, 20–22) have established TD presence as an independent prognostic variable in gastric cancer. Despite this clinical significance, current TNM staging paradigms inadequately address TD quantification, creating prognostic ambiguity for approximately 15%–20% of Stage II-III patients (2–4). Furthermore, existing predictive models for TD occurrence exhibit critical limitations, including restricted variable selection (e.g., omitting emerging biomarkers like systemic immune-inflammatory indices) and insufficient validation across diverse populations, particularly in multiethnic cohorts and geographically distinct healthcare settings (16, 19, 21).
This study addresses these clinical and methodological gaps through three principal objectives: First, to identify novel clinicopathological and molecular determinants of TD formation using machine learning-enhanced multivariate regression. Second, to develop and externally validate a TD-specific prognostic nomogram integrating pathological staging and serum biomarker profiles. Third, to establish an open-access digital risk stratification tool enabling real-time TD probability estimation. Building upon the foundational work (23) in gastric cancer risk modeling, our methodology incorporates advanced ensemble learning algorithms and bootstrap validation to optimize discriminatory capacity (target AUC > 0.85), while maintaining clinical interpretability.
By reconciling molecular pathogenesis with clinical decision-making needs, this investigation advances the paradigm of precision prognostication in gastric oncology. The resultant predictive framework not only refines therapeutic stratification but also provides a template for incorporating complex tumor microenvironment features into standardized staging systems.
Materials and methods
Study design and ethical compliance
This retrospective cohort study adhered to the ethical principles outlined in the Declaration of Helsinki and received approval from the Institutional Review Board of the Affiliated Hospital of Hebei University (Approval No. 32017). Informed consent was waived in compliance with national regulations governing retrospective analyses of anonymized clinical data. Patient identifiers were systematically redacted during preprocessing to ensure confidentiality.
Patient selection and exclusion criteria
Consecutive patients with histopathologically confirmed Stage I-III gastric adenocarcinoma (AJCC 8th Edition TNM criteria) treated between September 2012 and September 2022 were screened. Inclusion criteria comprised: (I) Curative-intent surgery: Radical gastrectomy (total/subtotal) with D1/D2 lymphadenectomy; (II) Clinicopathological completeness: Demographic profiles, tumor characteristics (size, differentiation, Lauren classification), preoperative biomarkers (CEA, CA199, albumin), and surgical-pathological parameters (pT stage, lymph node yield ≥ 15, R0 resection); (III) Follow-up adequacy: Minimum 12-month postoperative surveillance or mortality documentation. Exclusions targeted potential confounders: (I) Metastatic disease (Stage IV) or synchronous malignancies; (II) Neoadjuvant therapy recipients (chemotherapy/radiotherapy); (III) Incomplete nodal dissection (<15 lymph nodes examined); (IV) Non-curative resection (R1/R2 status) or incomplete medical records.
Propensity score matching
To address potential confounding factors, we performed propensity score matching (PSM) using the nearest-neighbor algorithm with a caliper width of 0.1 and a 1:2 matching ratio. Key covariates included tumor size, serum biomarkers (CEA, CA199), pathological staging (pT/pN), and Lauren classification. The balance of covariates before and after matching was assessed using standardized mean differences (SMD < 0.1 indicating good balance). Propensity scores were estimated via logistic regression incorporating all covariates.
Data abstraction and definitions
Clinicopathological variables—including demographics, tumor dimensions, Lauren classification, lymphovascular/perineural invasion status, and preoperative biomarkers—were extracted from institutional electronic health records. TDs were rigorously defined per AJCC 8th Edition criteria: discrete perigastric neoplastic nodules within lymphatic drainage territories, devoid of residual lymph node architecture, vascular channels, or neural structures (13).
Surveillance protocol
Standardized follow-up included quarterly clinical evaluations (imaging, tumor marker assays, physical examination) for the first 24 months after treatment, transitioning to semiannual assessments thereafter. Surveillance concluded in September 2022, with censoring at last confirmed contact or mortality.
Statistical analysis
Data analysis was executed using R software (version 4.4.3). Continuous variables were examined for normality using the Kolmogorov-Smirnov test. Non-normally distributed data were summarized as median (interquartile range) and compared between groups using the Mann-Whitney U test. Categorical variables were expressed as frequencies (percentages) and analyzed with chi-square or Fisher’s exact tests, as appropriate. Survival curves (overall survival[OS] and progression free survival[PFS]) were generated using the Kaplan-Meier method, with between-group survival rate comparisons performed via log-rank testing. For predictive modeling, tumor deposit occurrence in the training cohort served as the outcome variable. Independent predictors were identified through Least Absolute Shrinkage and Selection Operator (LASSO) regression. Subsequently, a multivariate logistic regression model incorporating these predictors was constructed to develop a nomogram. Model validation was performed on the independent validation cohort: discrimination accuracy was quantified using the area under the receiver operating characteristic (ROC) curve (AUC), calibration was assessed via calibration plots, and clinical utility was evaluated through decision curve analysis (DCA). Statistical significance was established at p < 0.05.
Results
Propensity score matching outcomes
After PSM, 224 TD-positive (TDP) and 1,060 TD-negative (TDN) patients were successfully matched. The Love plot (Figure 1) demonstrated significant improvement in covariate balance, with all post-matching SMD values below 0.1. The propensity score distributions (Figure 2) showed substantial overlap between matched groups, confirming reduced selection bias.
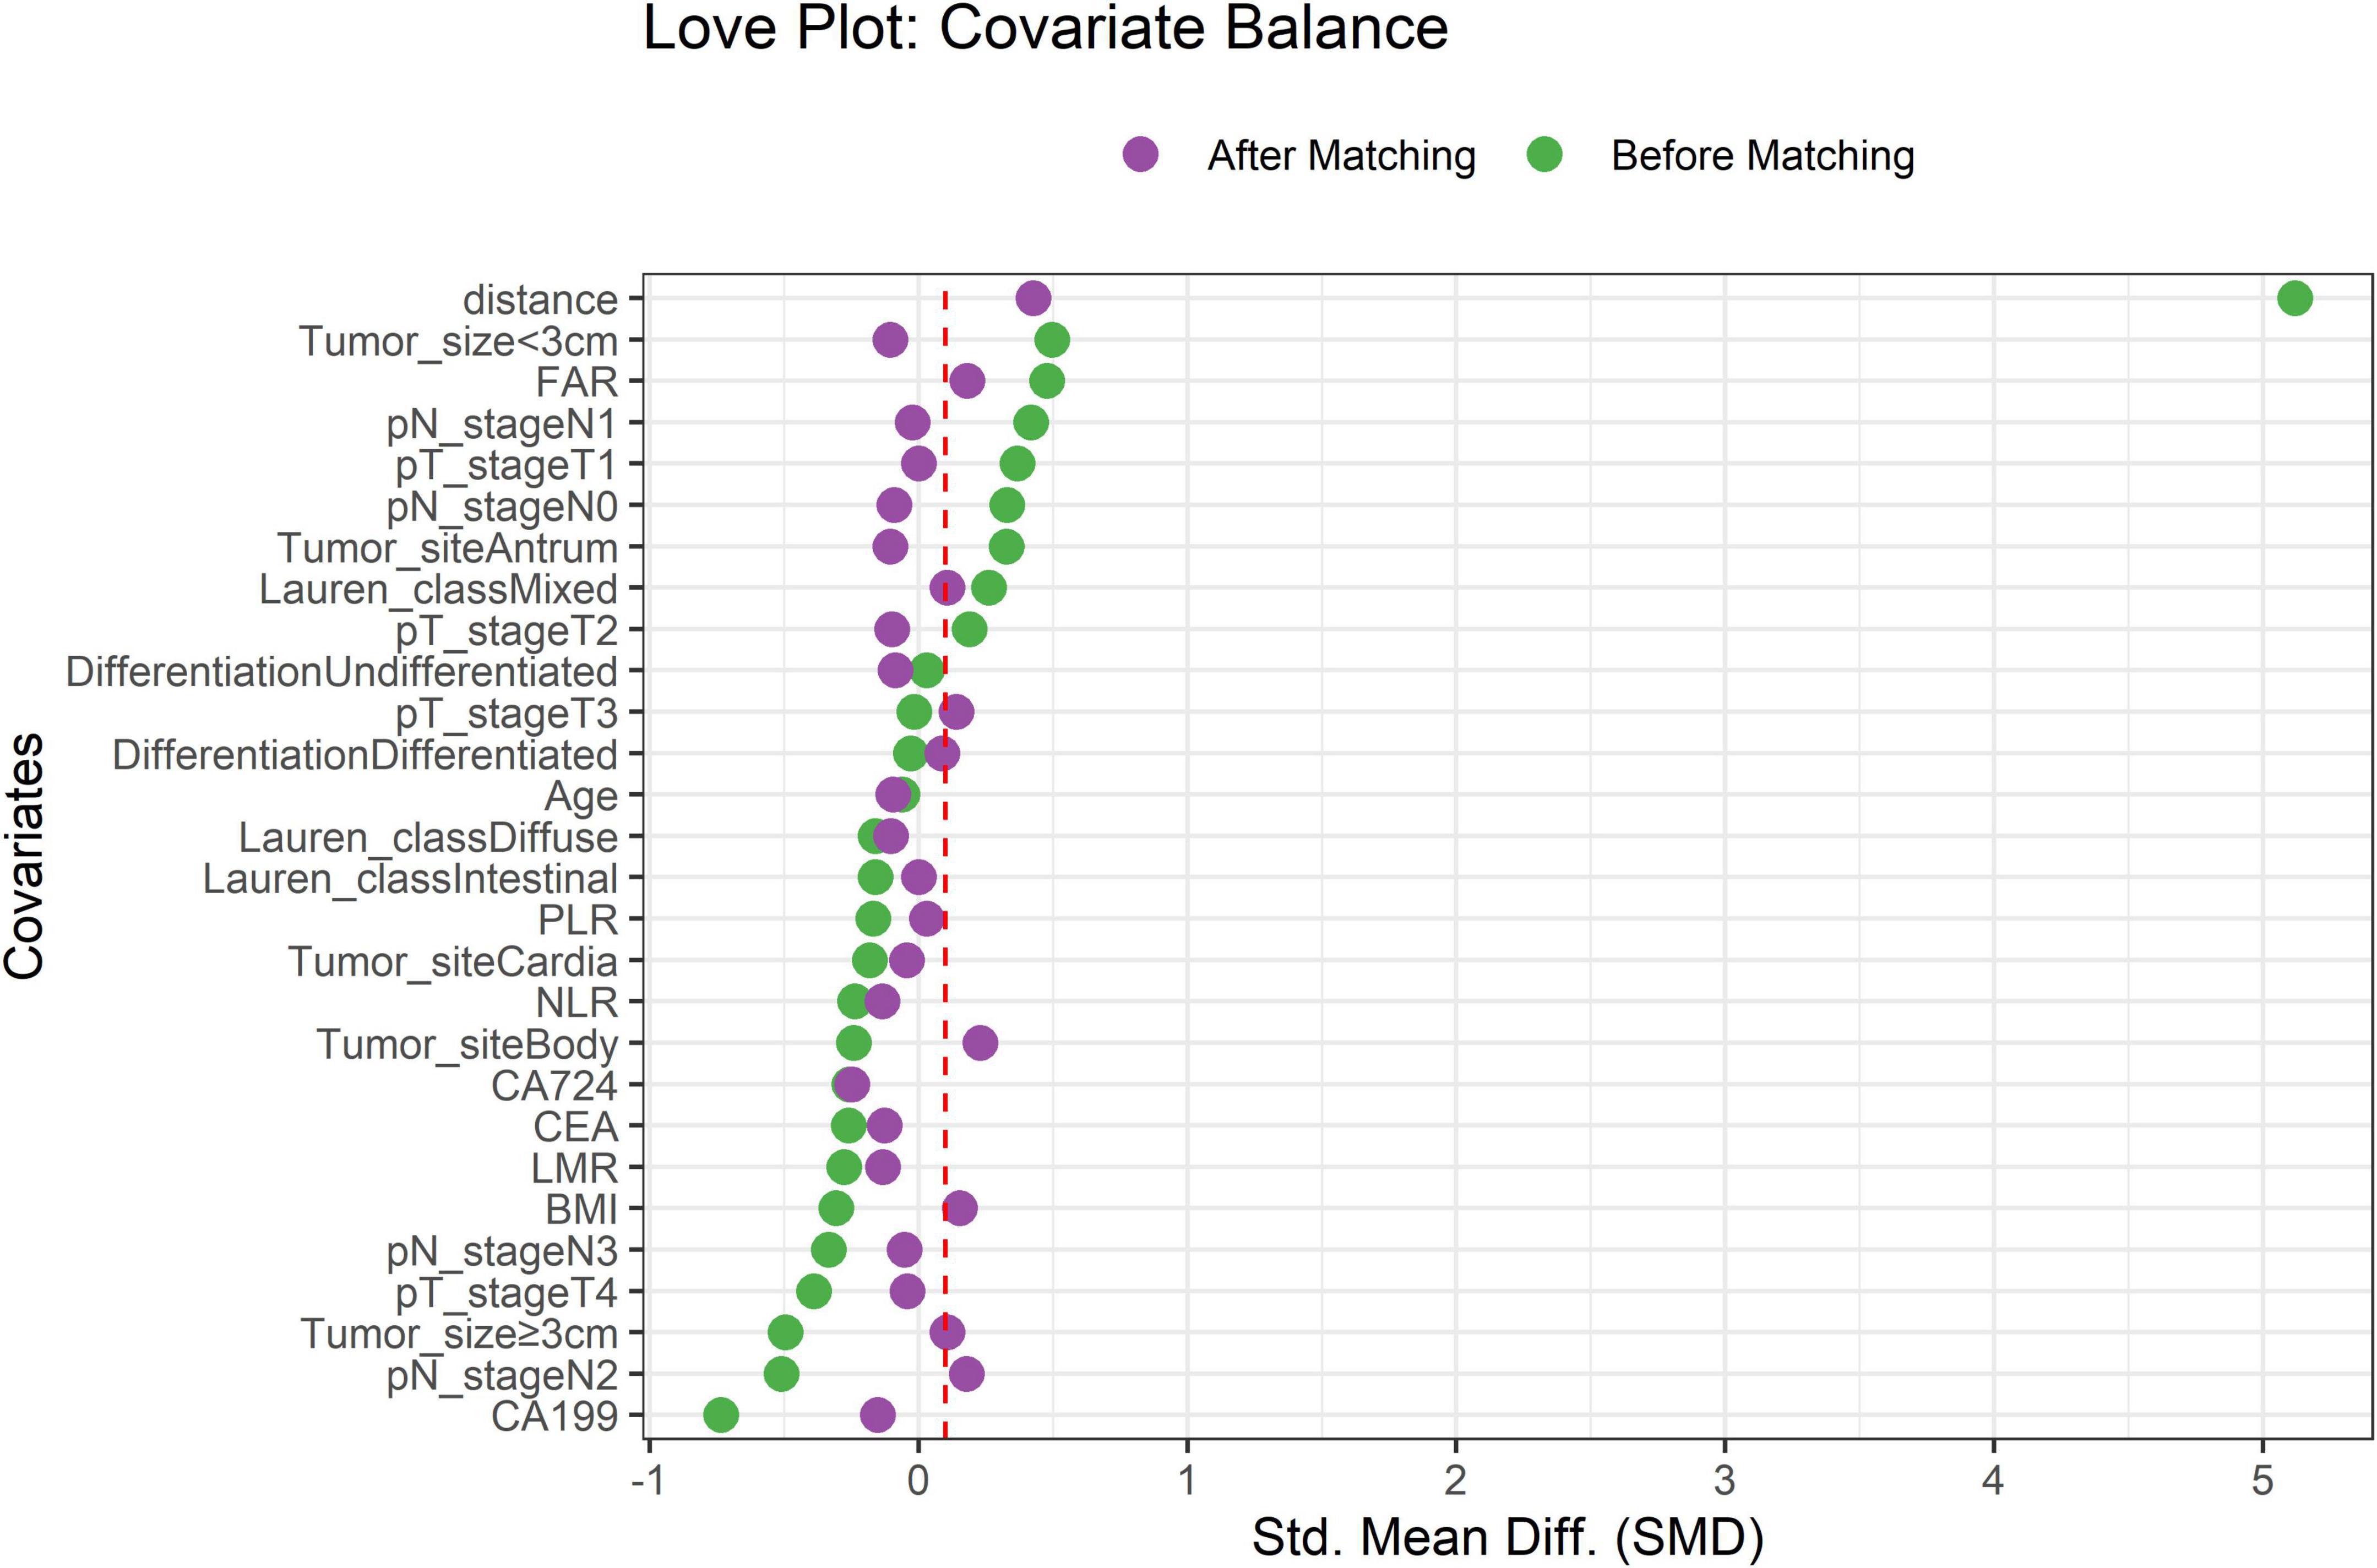
Figure 1. Covariate balance before and after propensity score matching. Standardized mean differences (SMD) for key covariates. Dashed red line indicates the SMD threshold of 0.1.
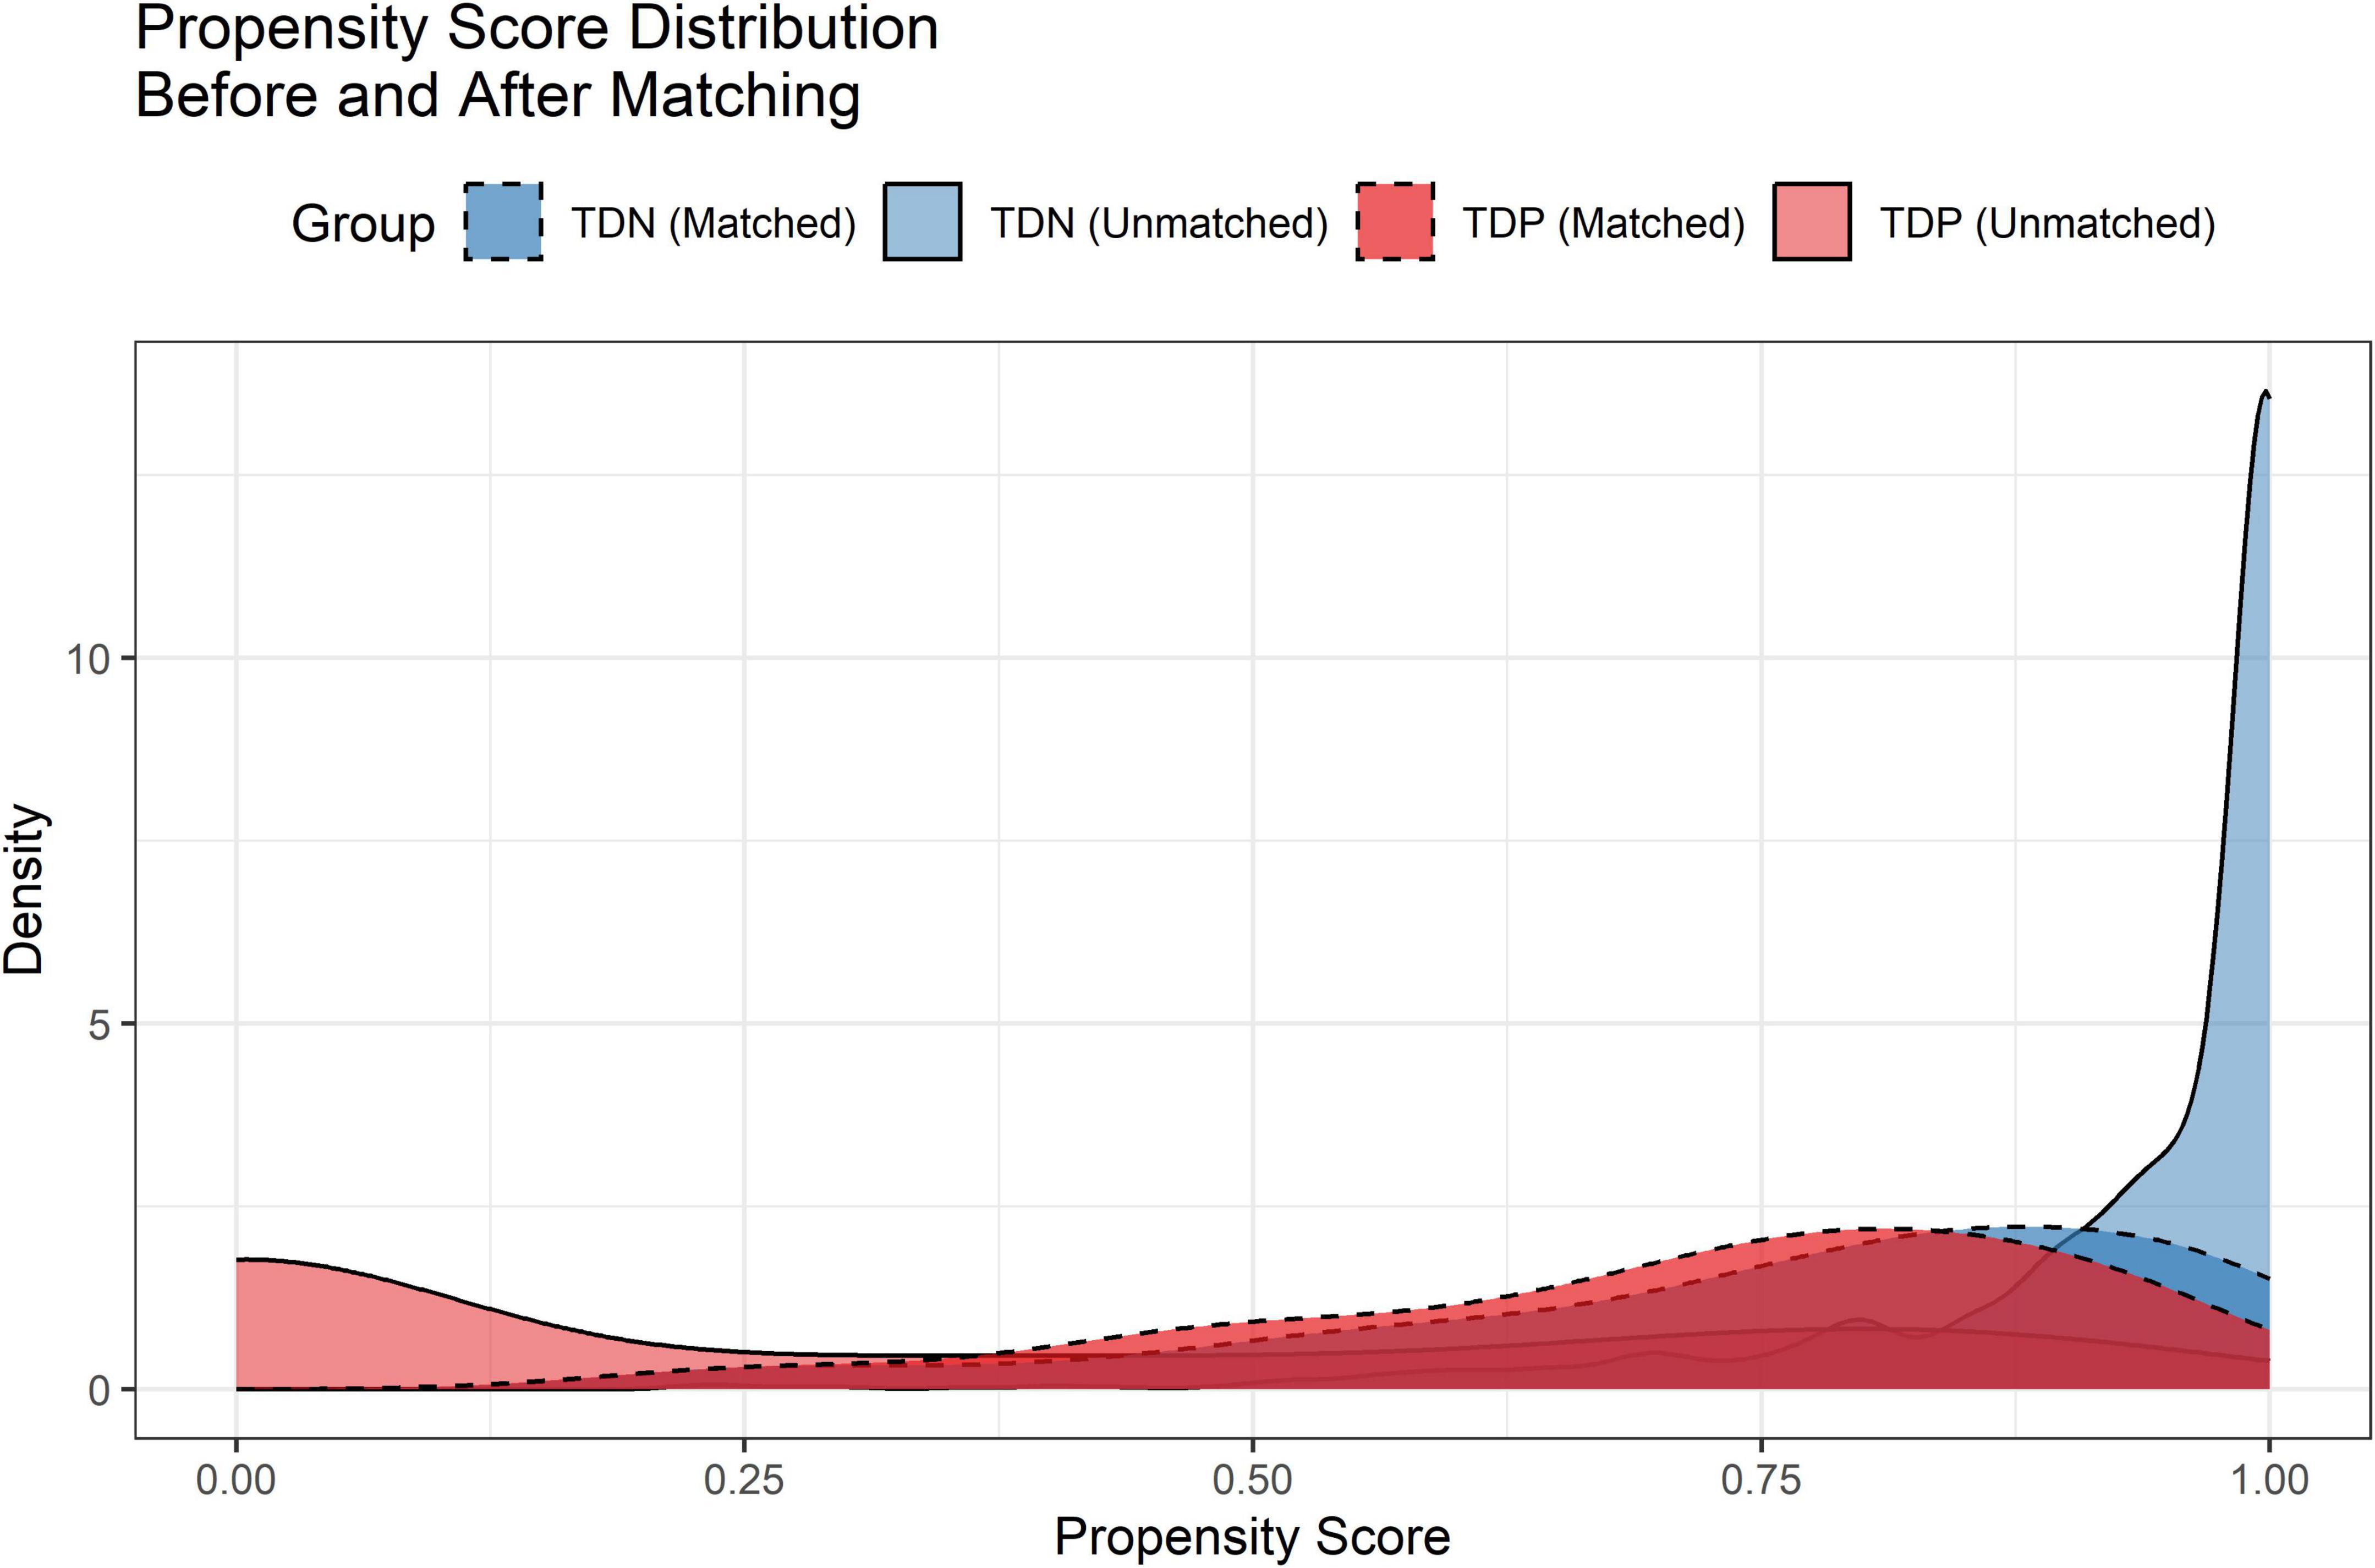
Figure 2. Propensity score distributions before and after matching. Density curves illustrate the overlap between TD-negative (TDN) and TD-positive (TDP) groups post-matching.
Clinical characteristics and survival outcomes
TDP patients exhibited distinct clinicopathological profiles, including larger tumor dimensions (median size: 4.3 vs. 2.8 cm, p < 0.001), elevated serum biomarkers (CEA: 2.6 vs. 2.1 ng/mL; CA199: 17.3 vs. 3.1 U/mL; p < 0.001), and higher rates of lymphovascular invasion (58.0% vs. 40.5%) and perineural invasion (38.4% vs. 11.5%) (Table 1).
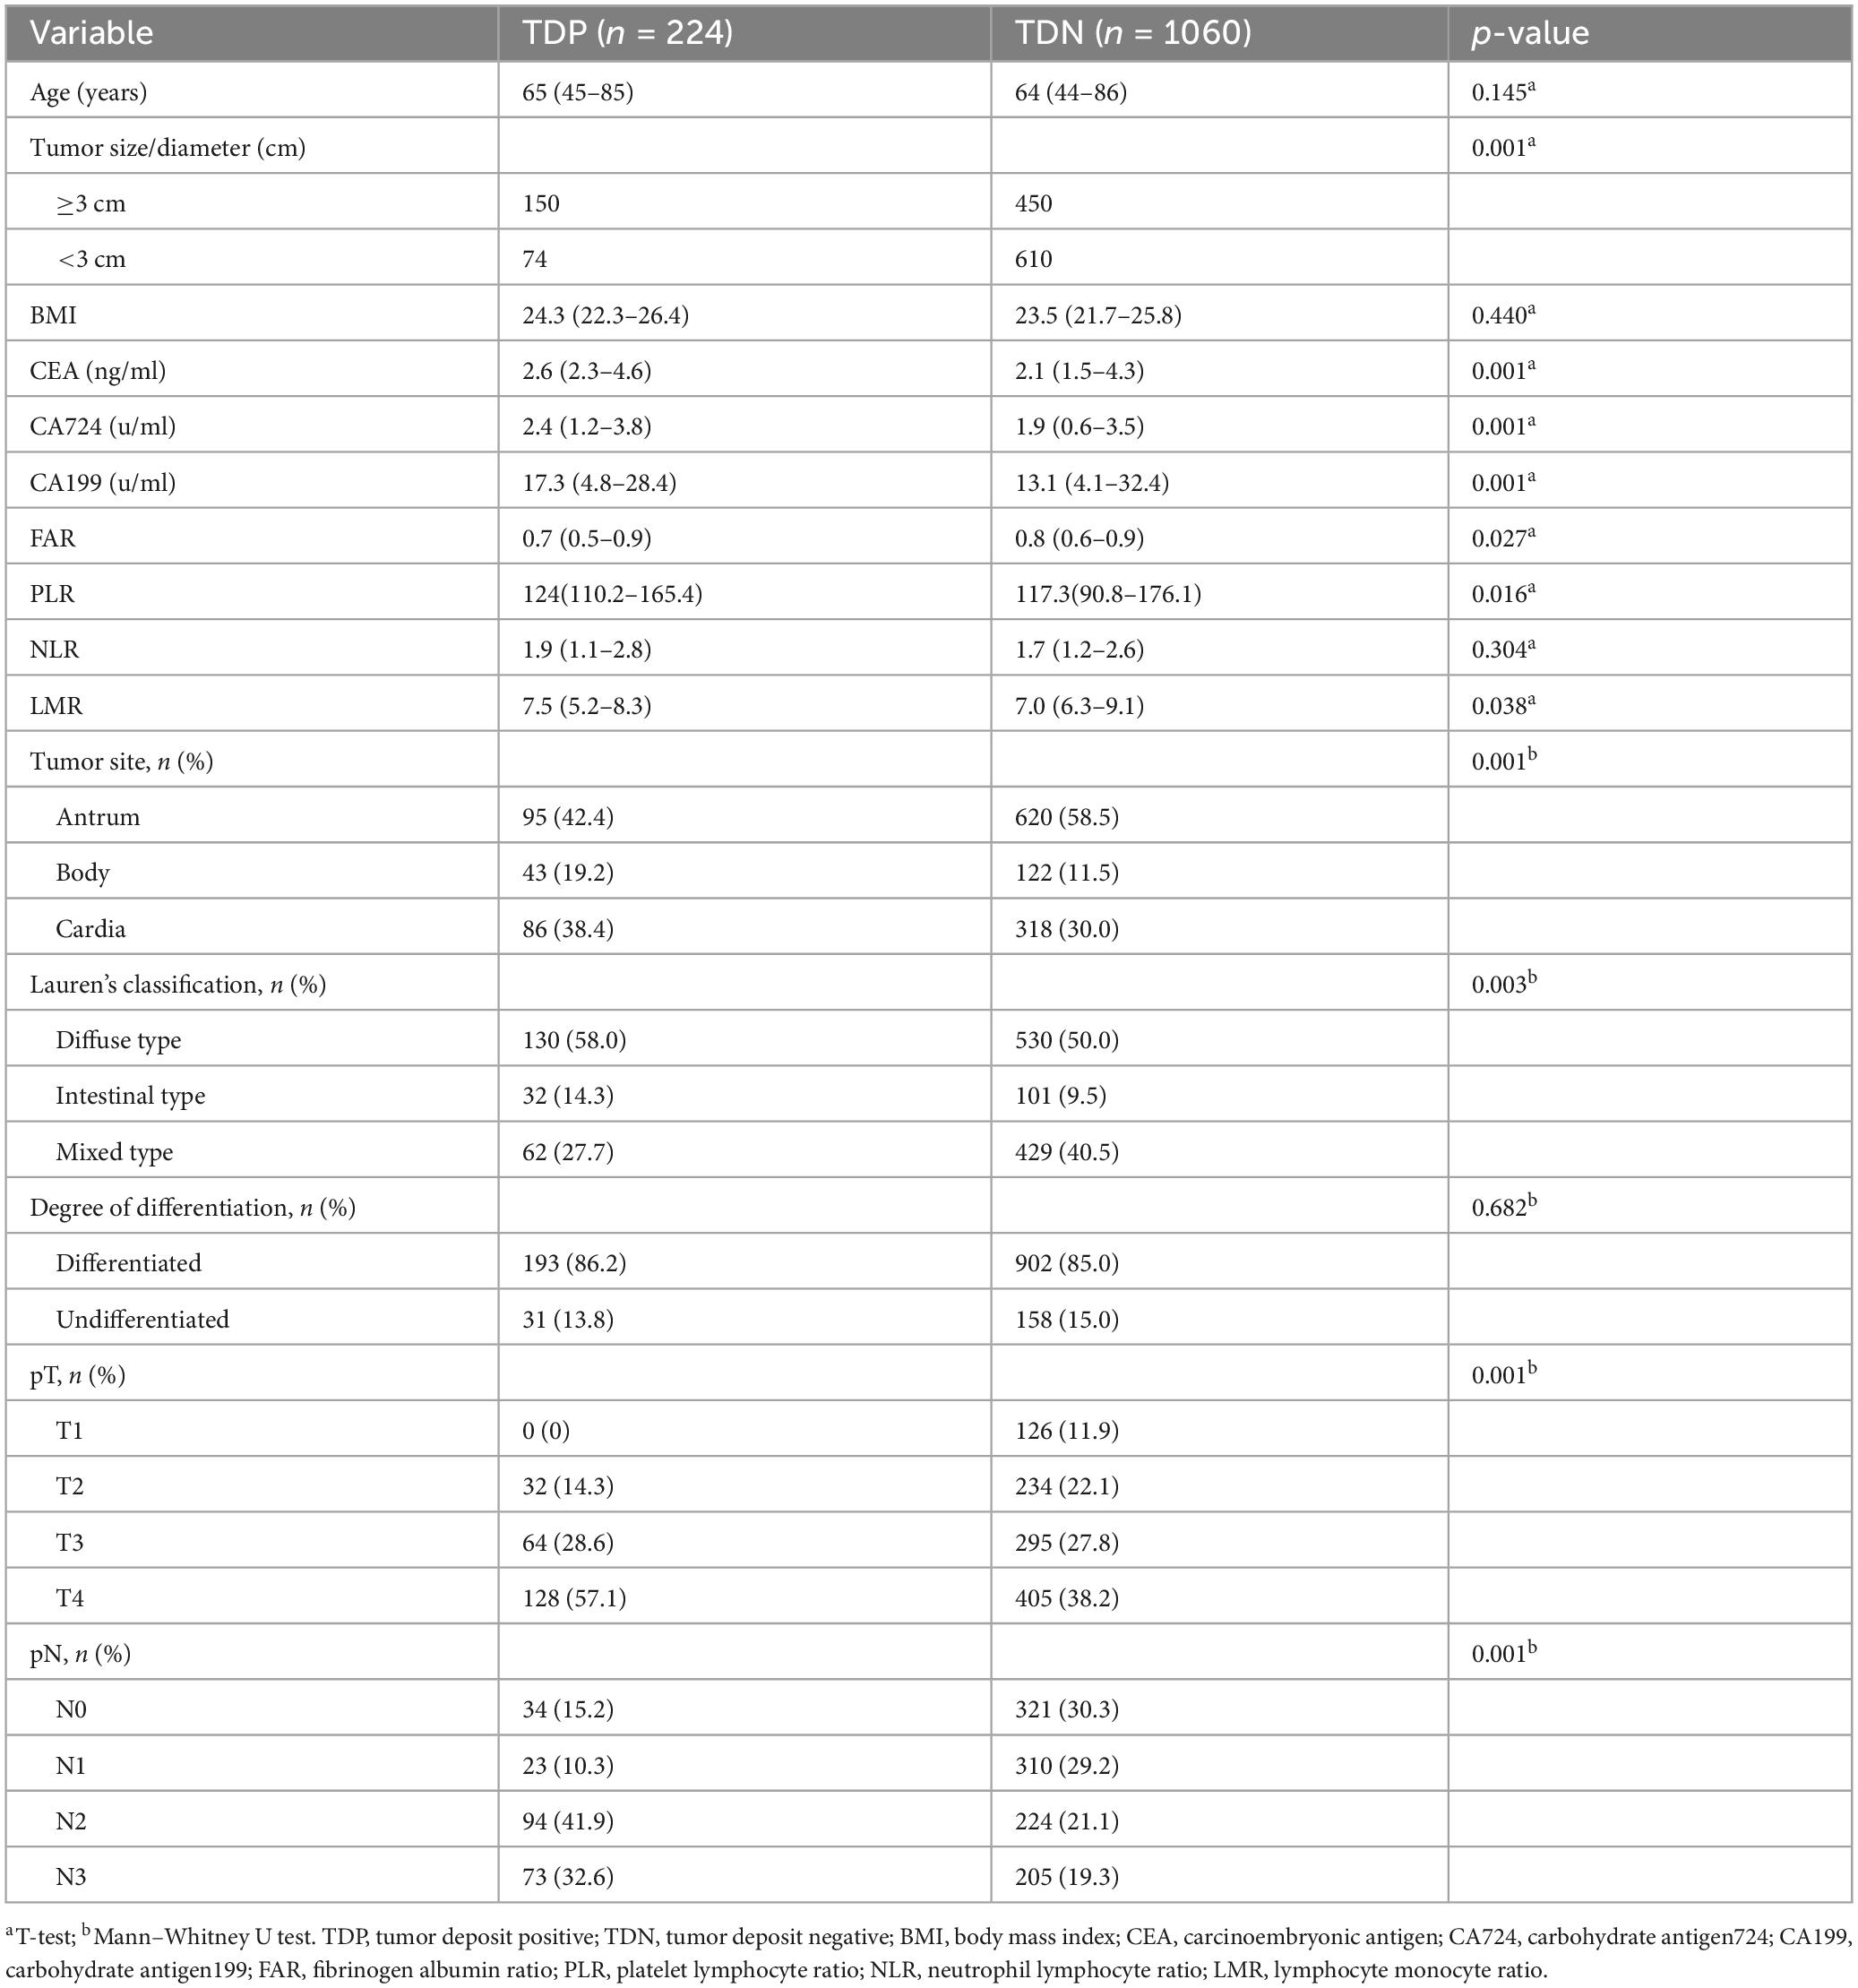
Table 1. Baseline data.
Survival outcomes
Survival disparities were pronounced: TDP patients demonstrated a median OS of 13.7 months (95% CI: 12.2–14.5), whereas the median OS for TDN patients remained undefined due to >50% of patients surviving beyond the study period. To better characterize long-term outcomes, we report landmark survival rates: the 1-, 3-, and 5-year OS rates for TDN patients were 94.2, 73.6, and 58.9%, respectively, compared to 60.1, 30.8, and 18.3% in the TDP group (log-rank p < 0.001). The HR for the TDN versus TDP groups was reported at 0.25, with a 95%CI between 0.18 and 0.33, indicating that TDN patients had a 75% lower risk of death compared to TDP patients (log-rank p < 0.001). The Kaplan-Meier survival curve illustrates that the TDN group maintained a higher OS percentage compared to the TDP group (Figure 3). Similarly, PFS was significantly shorter in TDP patients (median PFS: 12.6 vs. 26.7 months). The HR for the TDN group relative to the TDP group was calculated at 0.44, accompanied by a 95% CI from 0.35 to 0.55 (log-rank p < 0.001). This data highlights that patients in the TDN group have nearly halved the risk of disease progression compared to those in the TDP group. The survival curve further illustrates the sustained advantage for the TDN group over time (Figure 4), confirming the adverse prognostic significance of TD status in gastric cancer progression. The 3-year OS rate further emphasized this divergence (TDN: 73.6% vs. TDP: 30.8%).
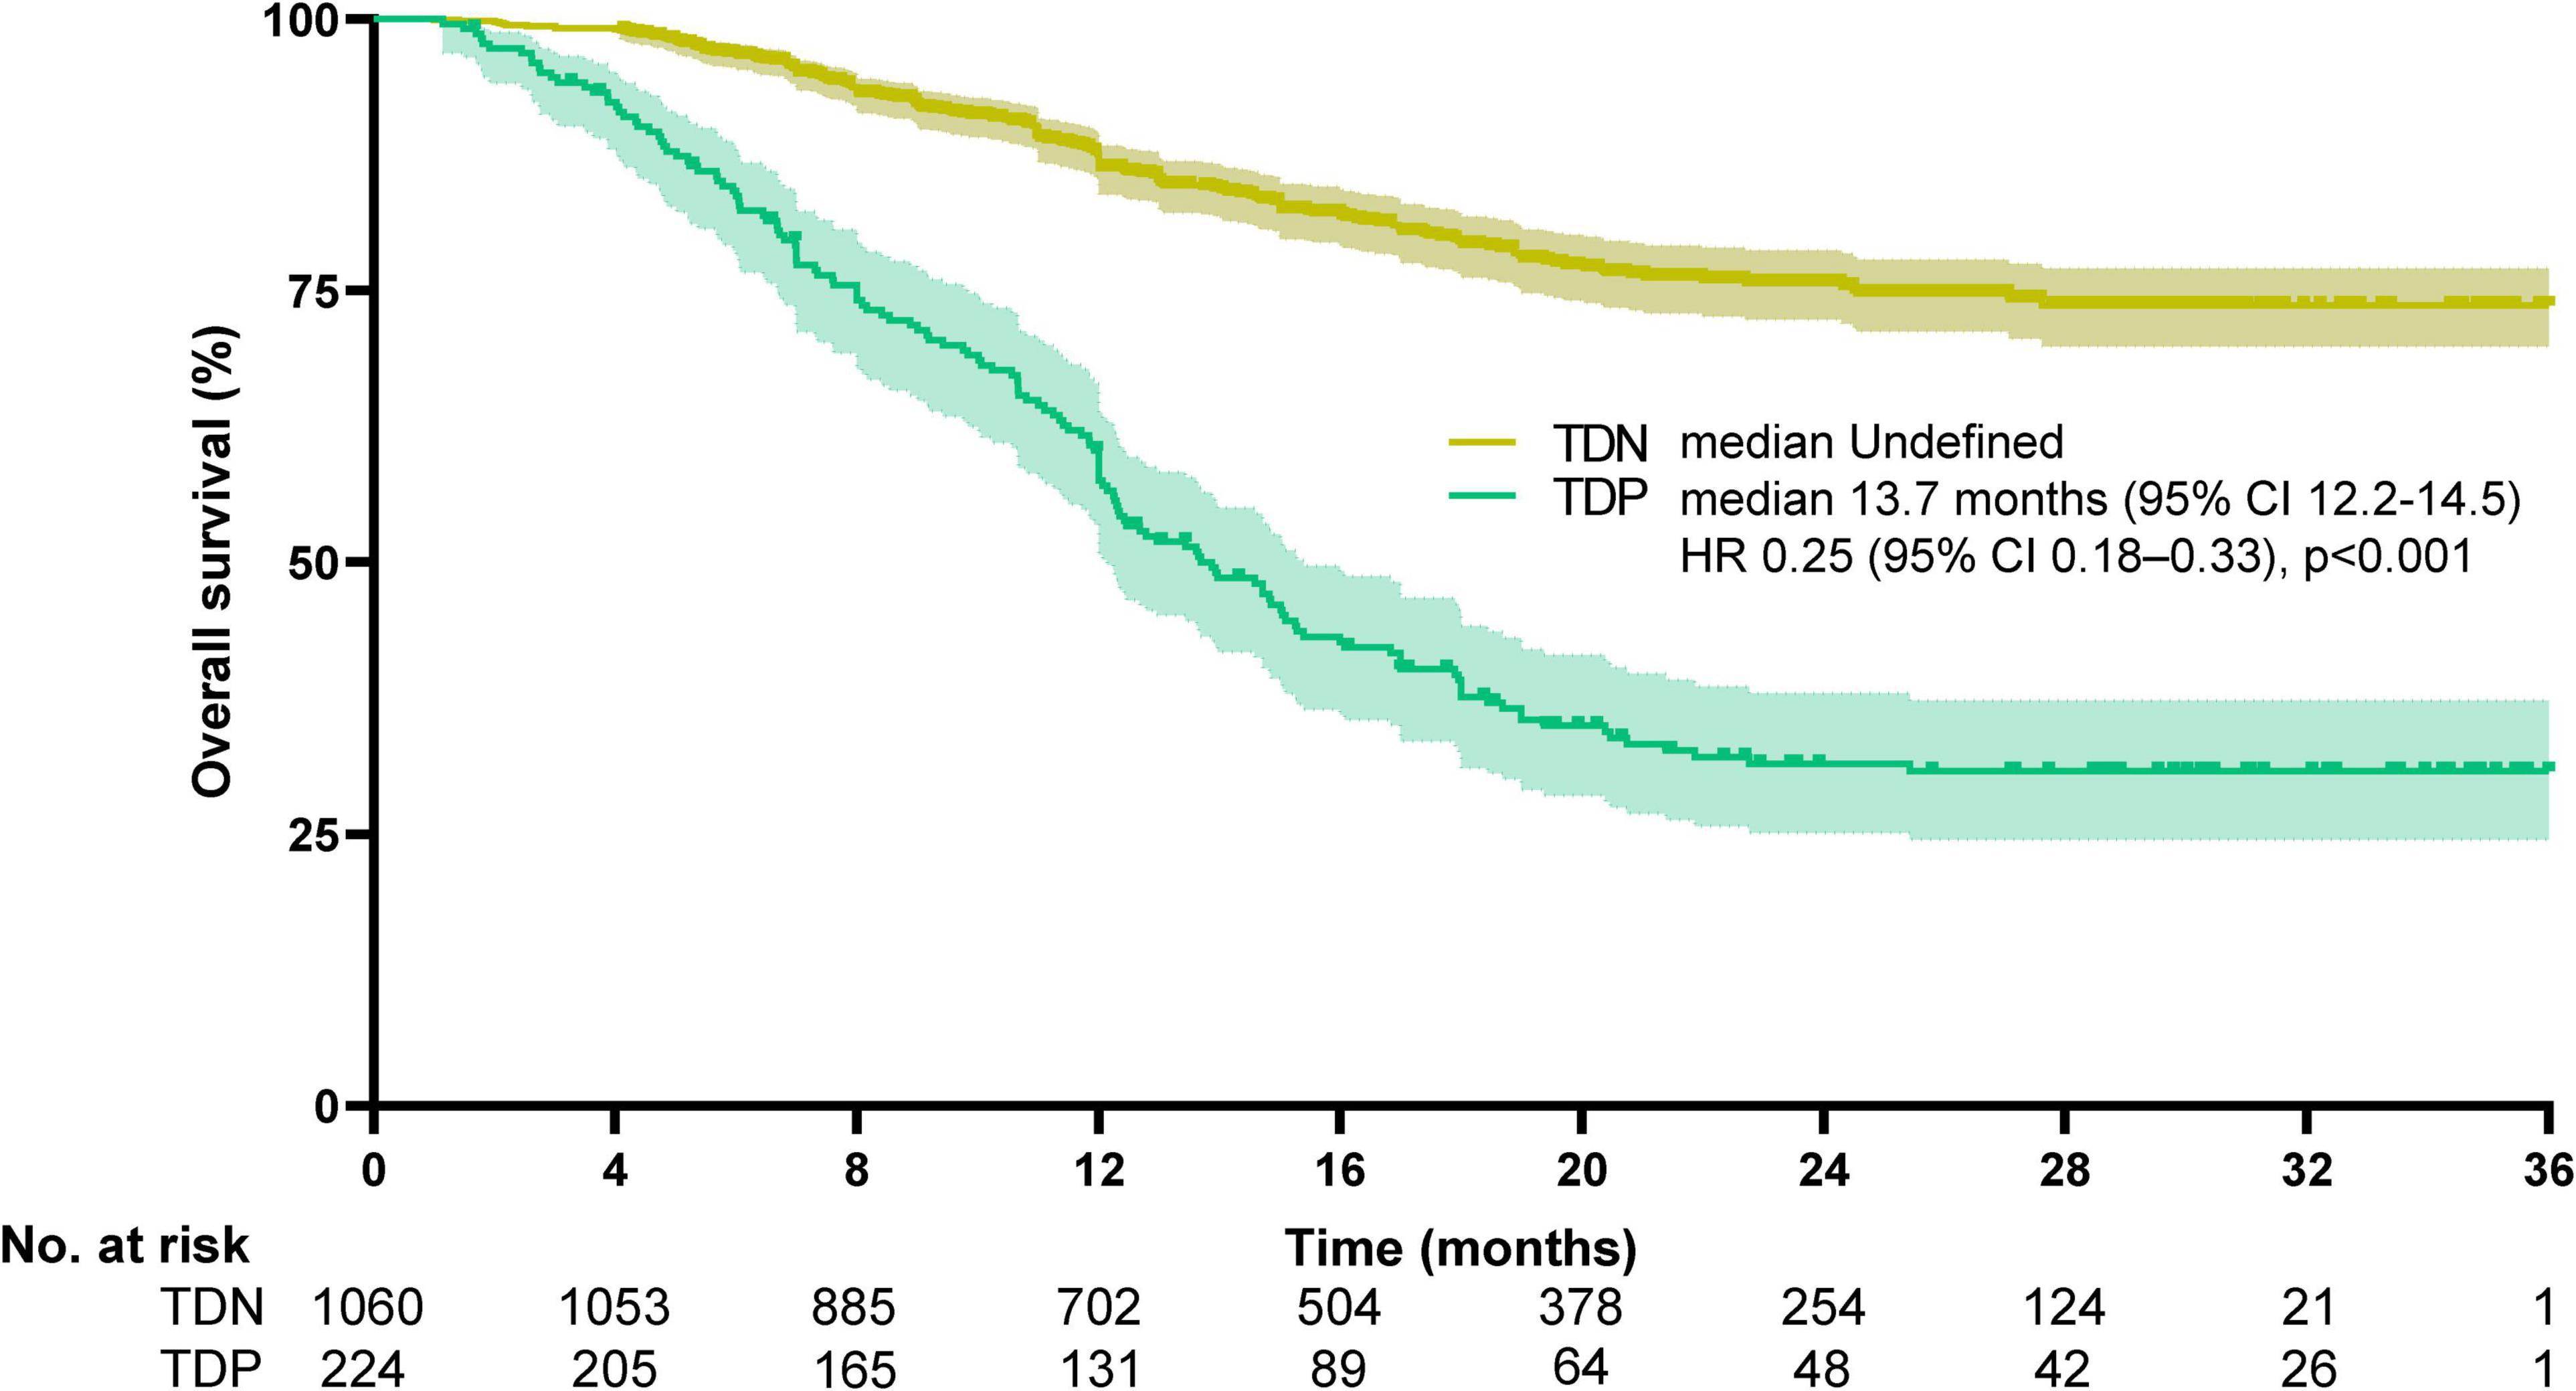
Figure 3. Kaplan-Meier curves for overall survival. The median overall survival was undefined for TDN and 13.7 months (95%CI, 12.2–14.5) for TDP (HR 0.25, 95%CI, 0.18–0.33, p < 0.001). Median OS in the TDN group is undefined as >50% of patients were alive at the final follow-up. Landmark survival rates are provided for clinical interpretation.
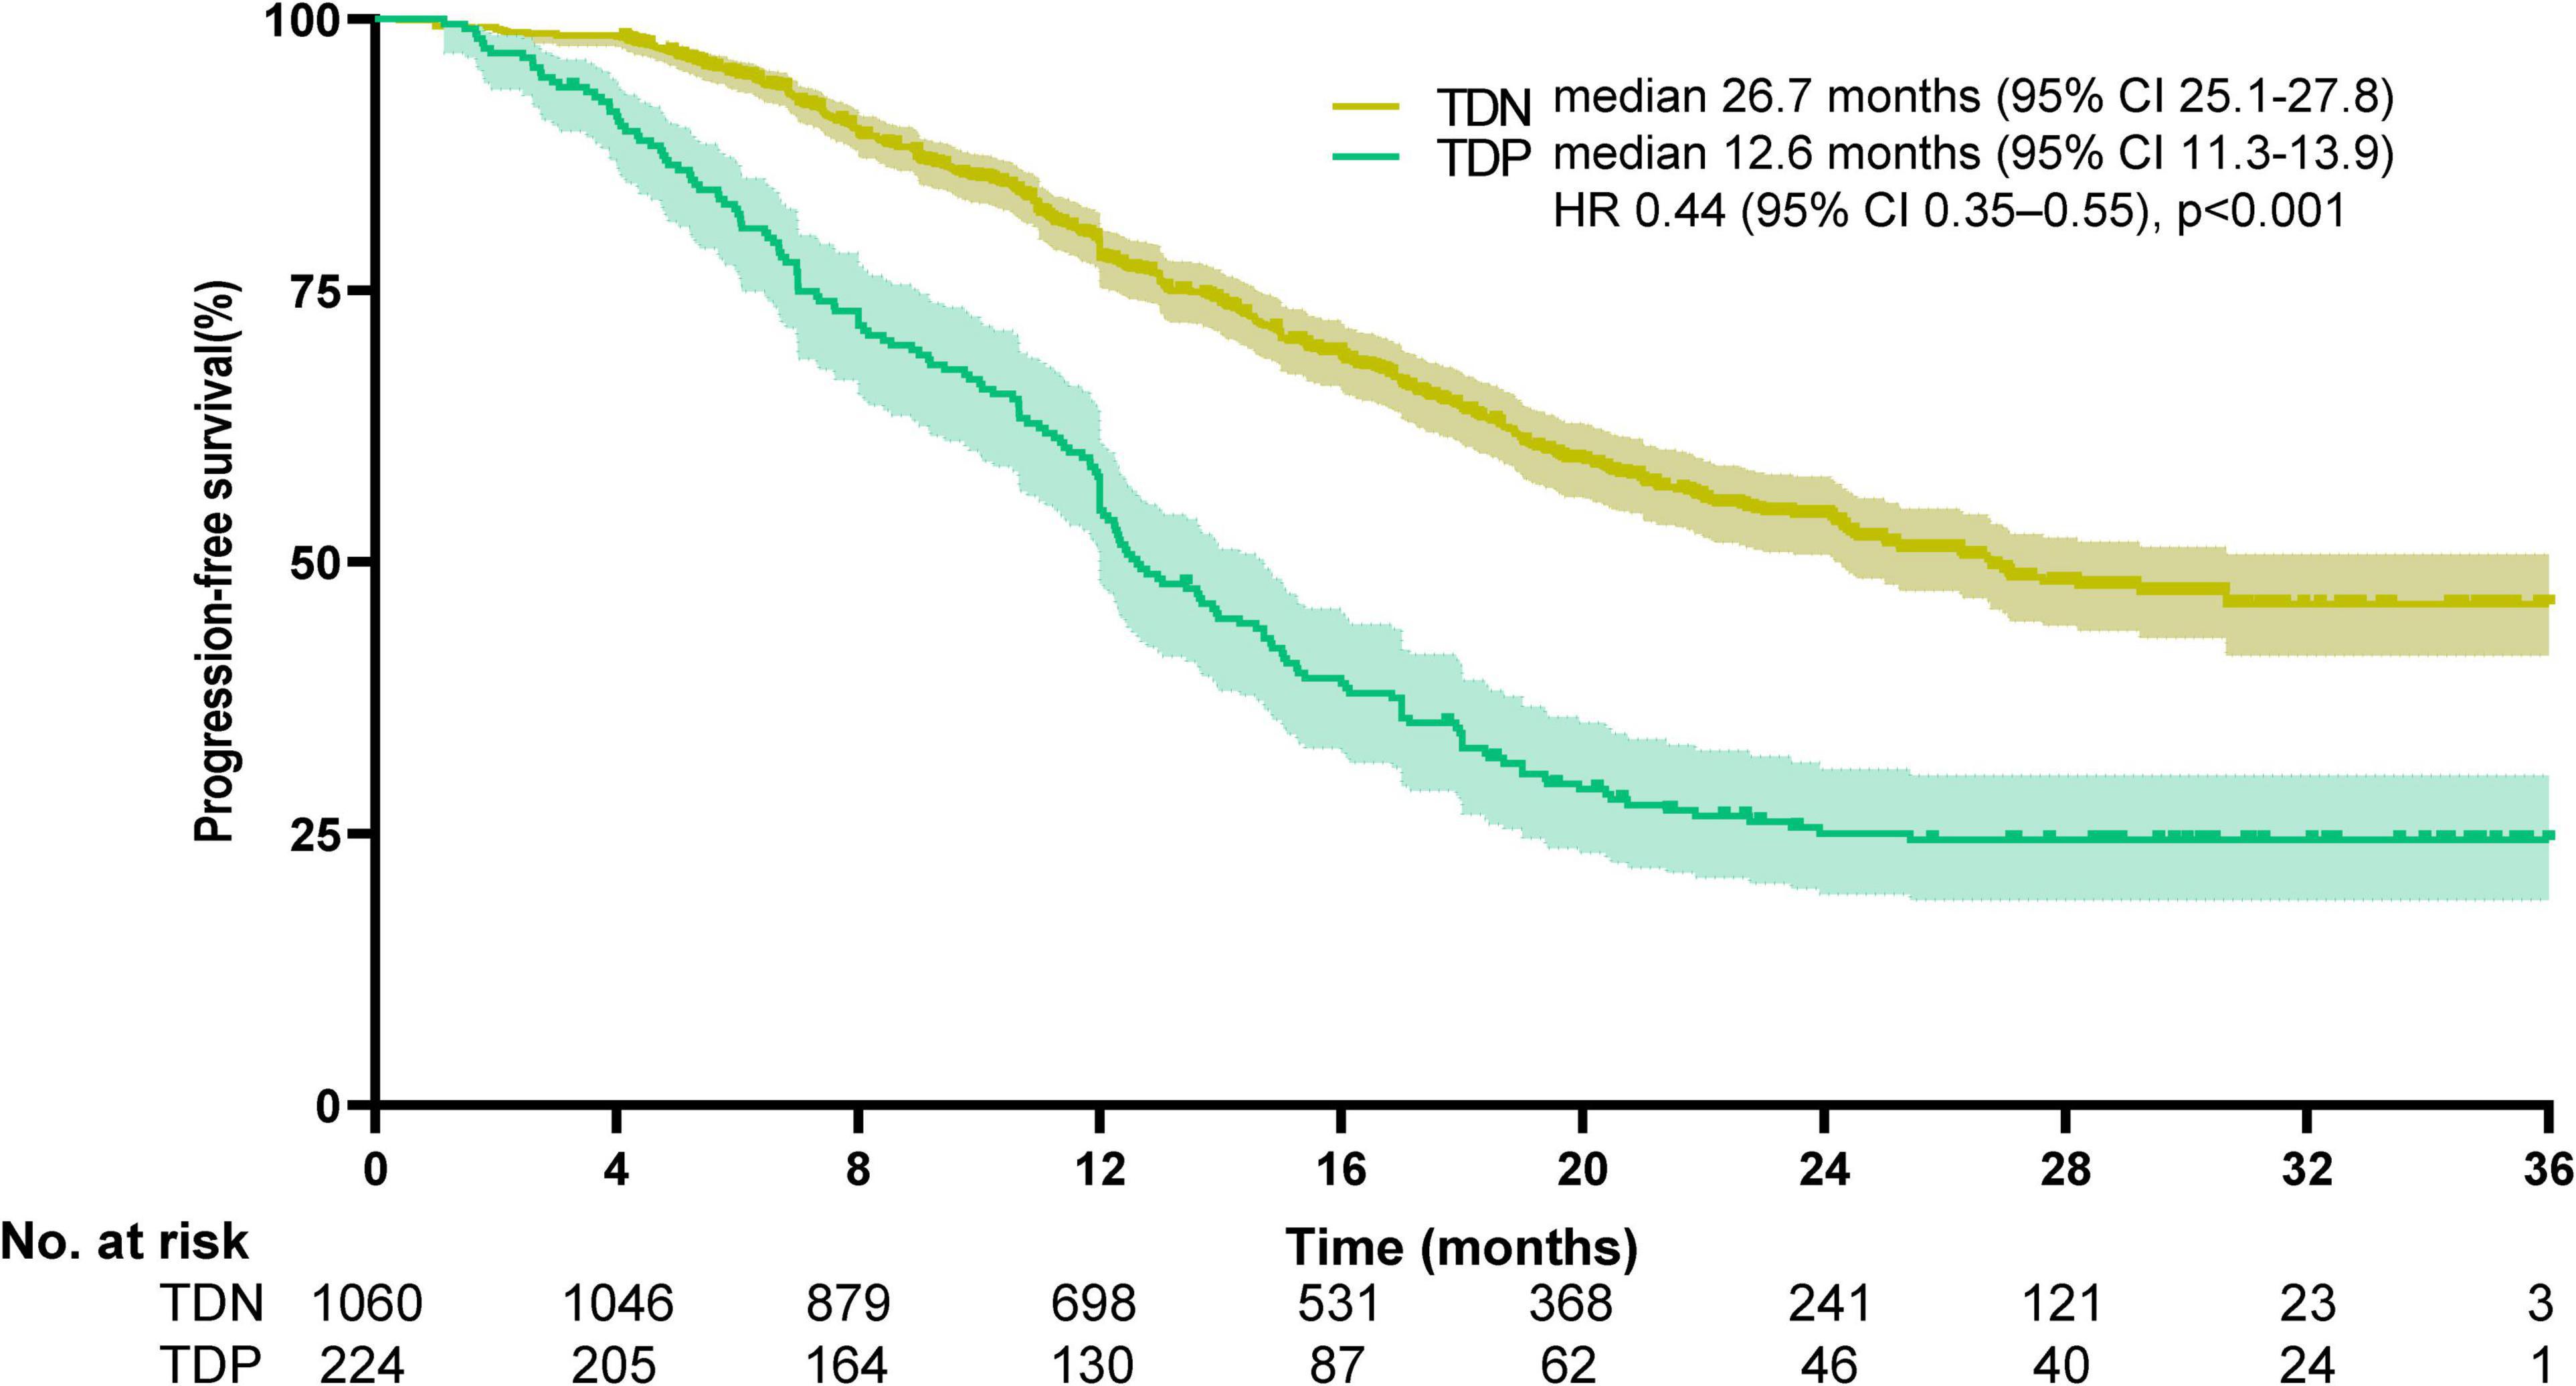
Figure 4. Kaplan-Meier curves for progression-free survival. The median progression-free survival was 26.7 months (95% CI, 25.1–27.8) for TDN and 12.6 months (95%CI, 11.3–13.9) for TDP (HR 0.44, 95%CI, 0.35–0.55; p < 0.001).
Risk factor identification for TD formation
To address multicollinearity among 27 candidate clinical-pathological variables (Supplementary Table 1), we employed LASSO regression with 10-fold cross-validation, which applies an L1 penalty to shrink coefficients of non-informative variables while retaining predictors with the strongest associations with TD formation (Figures 5A, B). We systematically analyzed the univariate outcomes and reconstructed the dataset using variables with p-values less than 0.05. The univariate analysis results are systematically delineated in Table 2, providing an initial insight into the data set. Subsequently, six variables (tumor size, CEA, CA199, pT, pN, and CA724) were retained at the optimal λ threshold, collectively explaining 85.3% of the deviance in TD risk (Table 3). Although CA724 exhibited moderate predictive value in LASSO regression (% deviance = 25.3), it was excluded from the final multivariable model due to its overlapping biological pathways with other biomarkers. This analytical framework prioritized variables based on both statistical significance (coefficients > 0.1) and clinical relevance to tumor biology, thereby adjusting for potential confounding factors and enhancing validity. Multivariable logistic regression analysis, as detailed in Table 4, elucidated that four specific variables as independent predictors of TD occurrence: tumor size (OR = 1.26; 95% CI 1.01–2.21), elevated CEA (OR = 2.04; 95% CI 1.02–3.16), elevated CA199 (OR = 5.17; 95% CI 3.14–7.38), and pN (OR = 3.22; 95% CI 2.12–4.34).
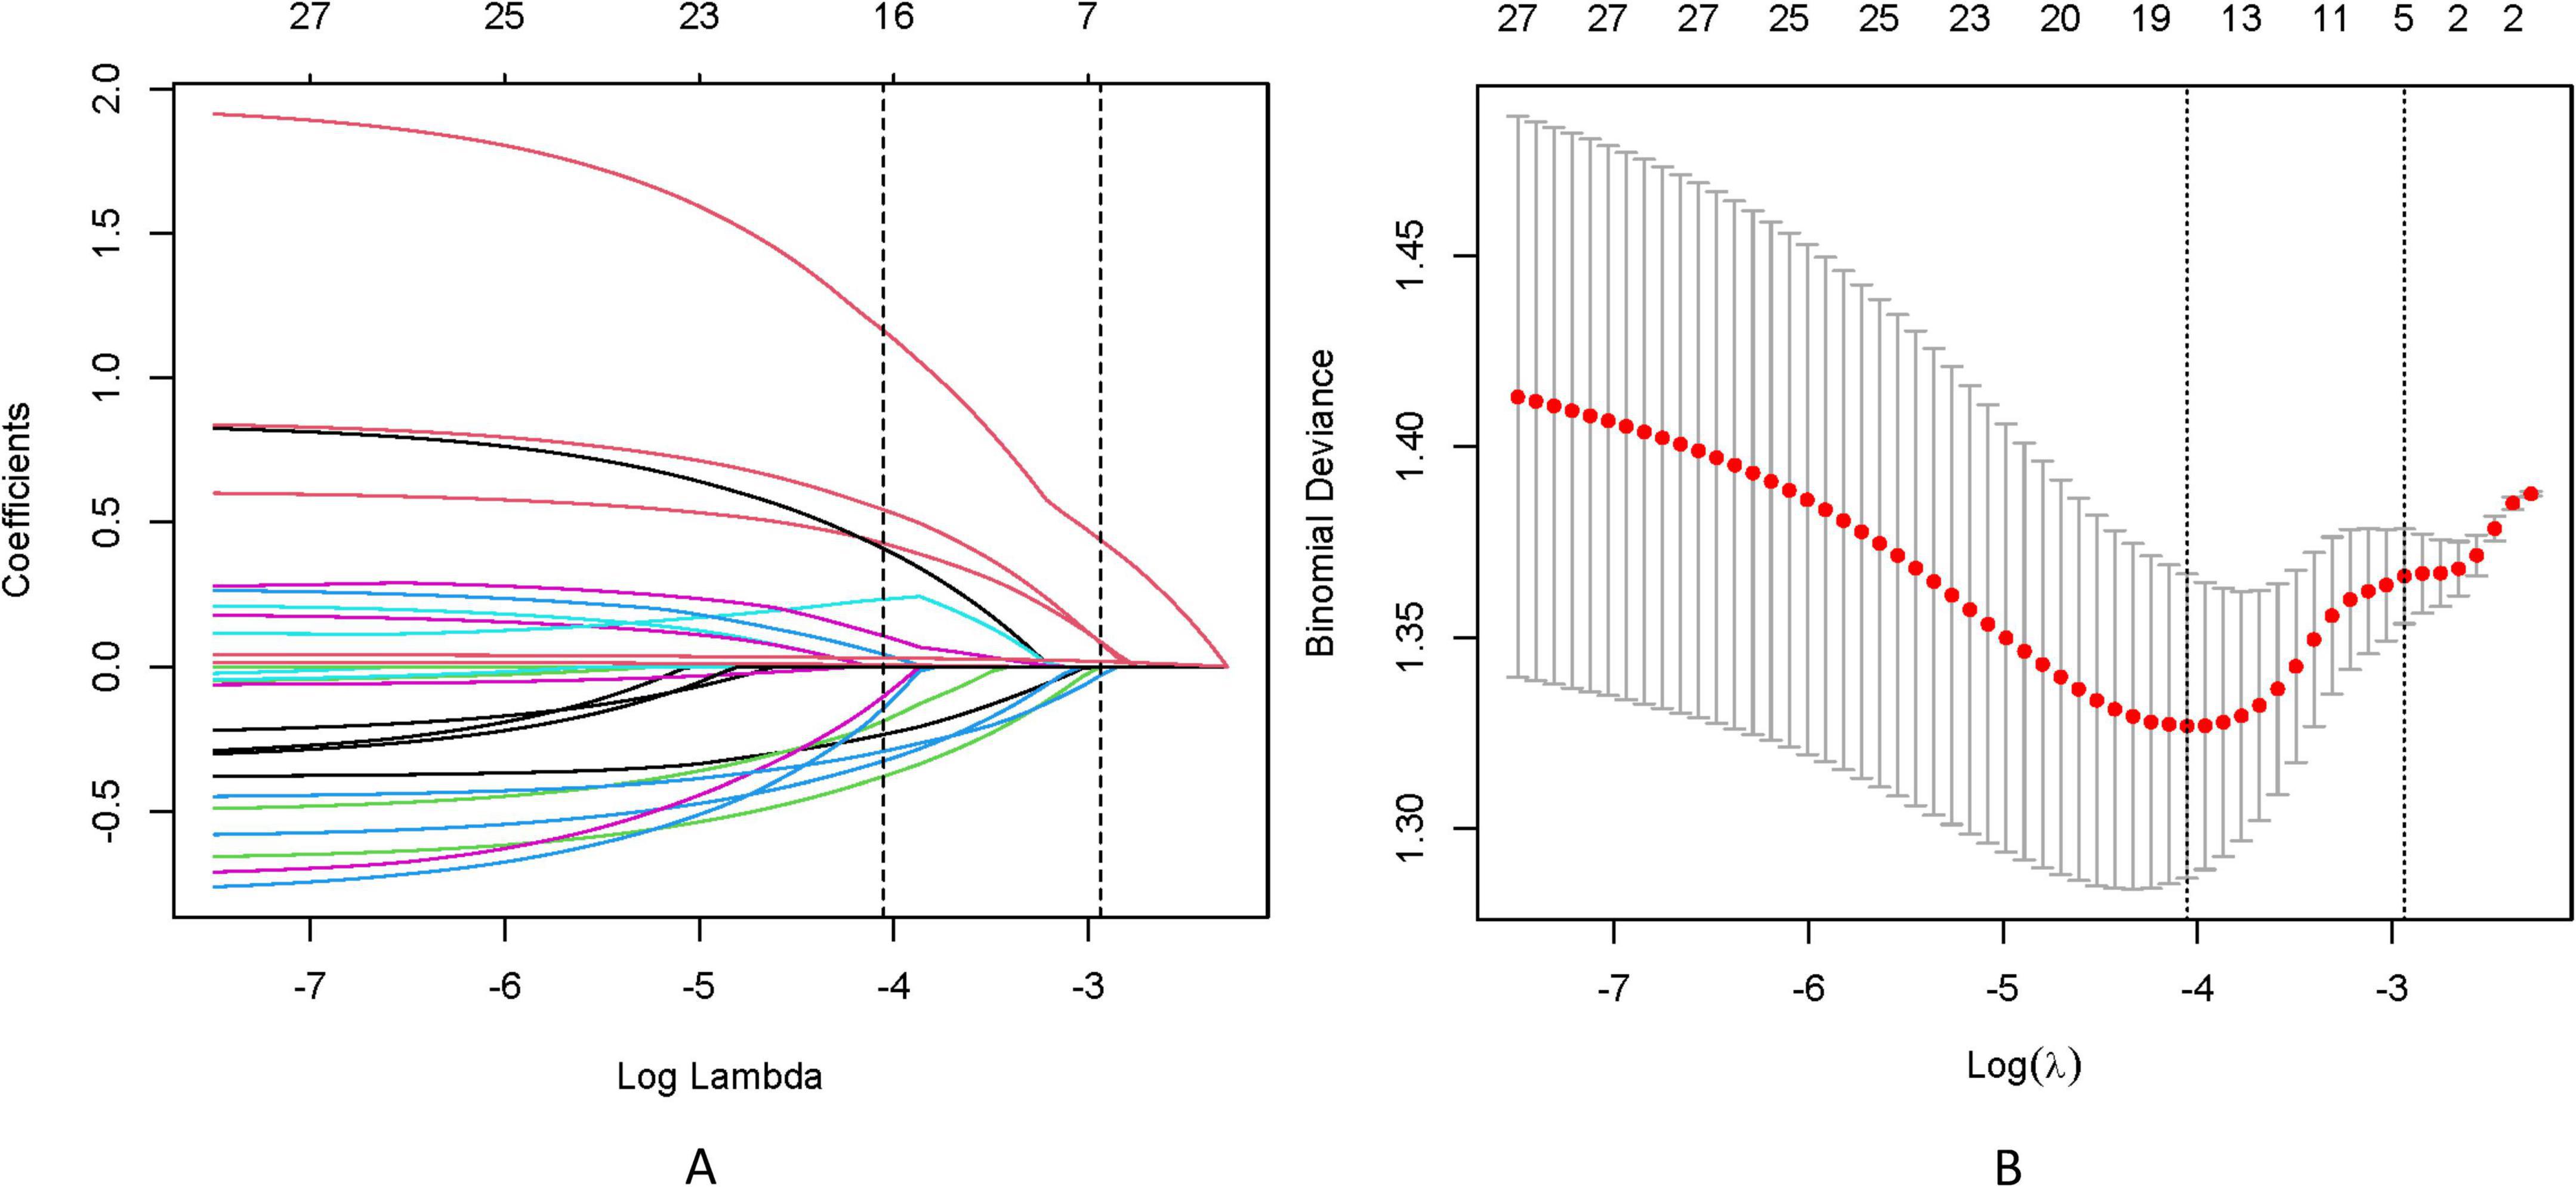
Figure 5. (A) LASSO coefficient trajectories depict the shrinkage of 27 predictor variables for TD formation as the penalty parameter (λ) increases. (B) Cross-validation results identify the optimal λ (λmin) and a simplified yet robust model (λ1SE), with annotations indicating the number of retained variables.
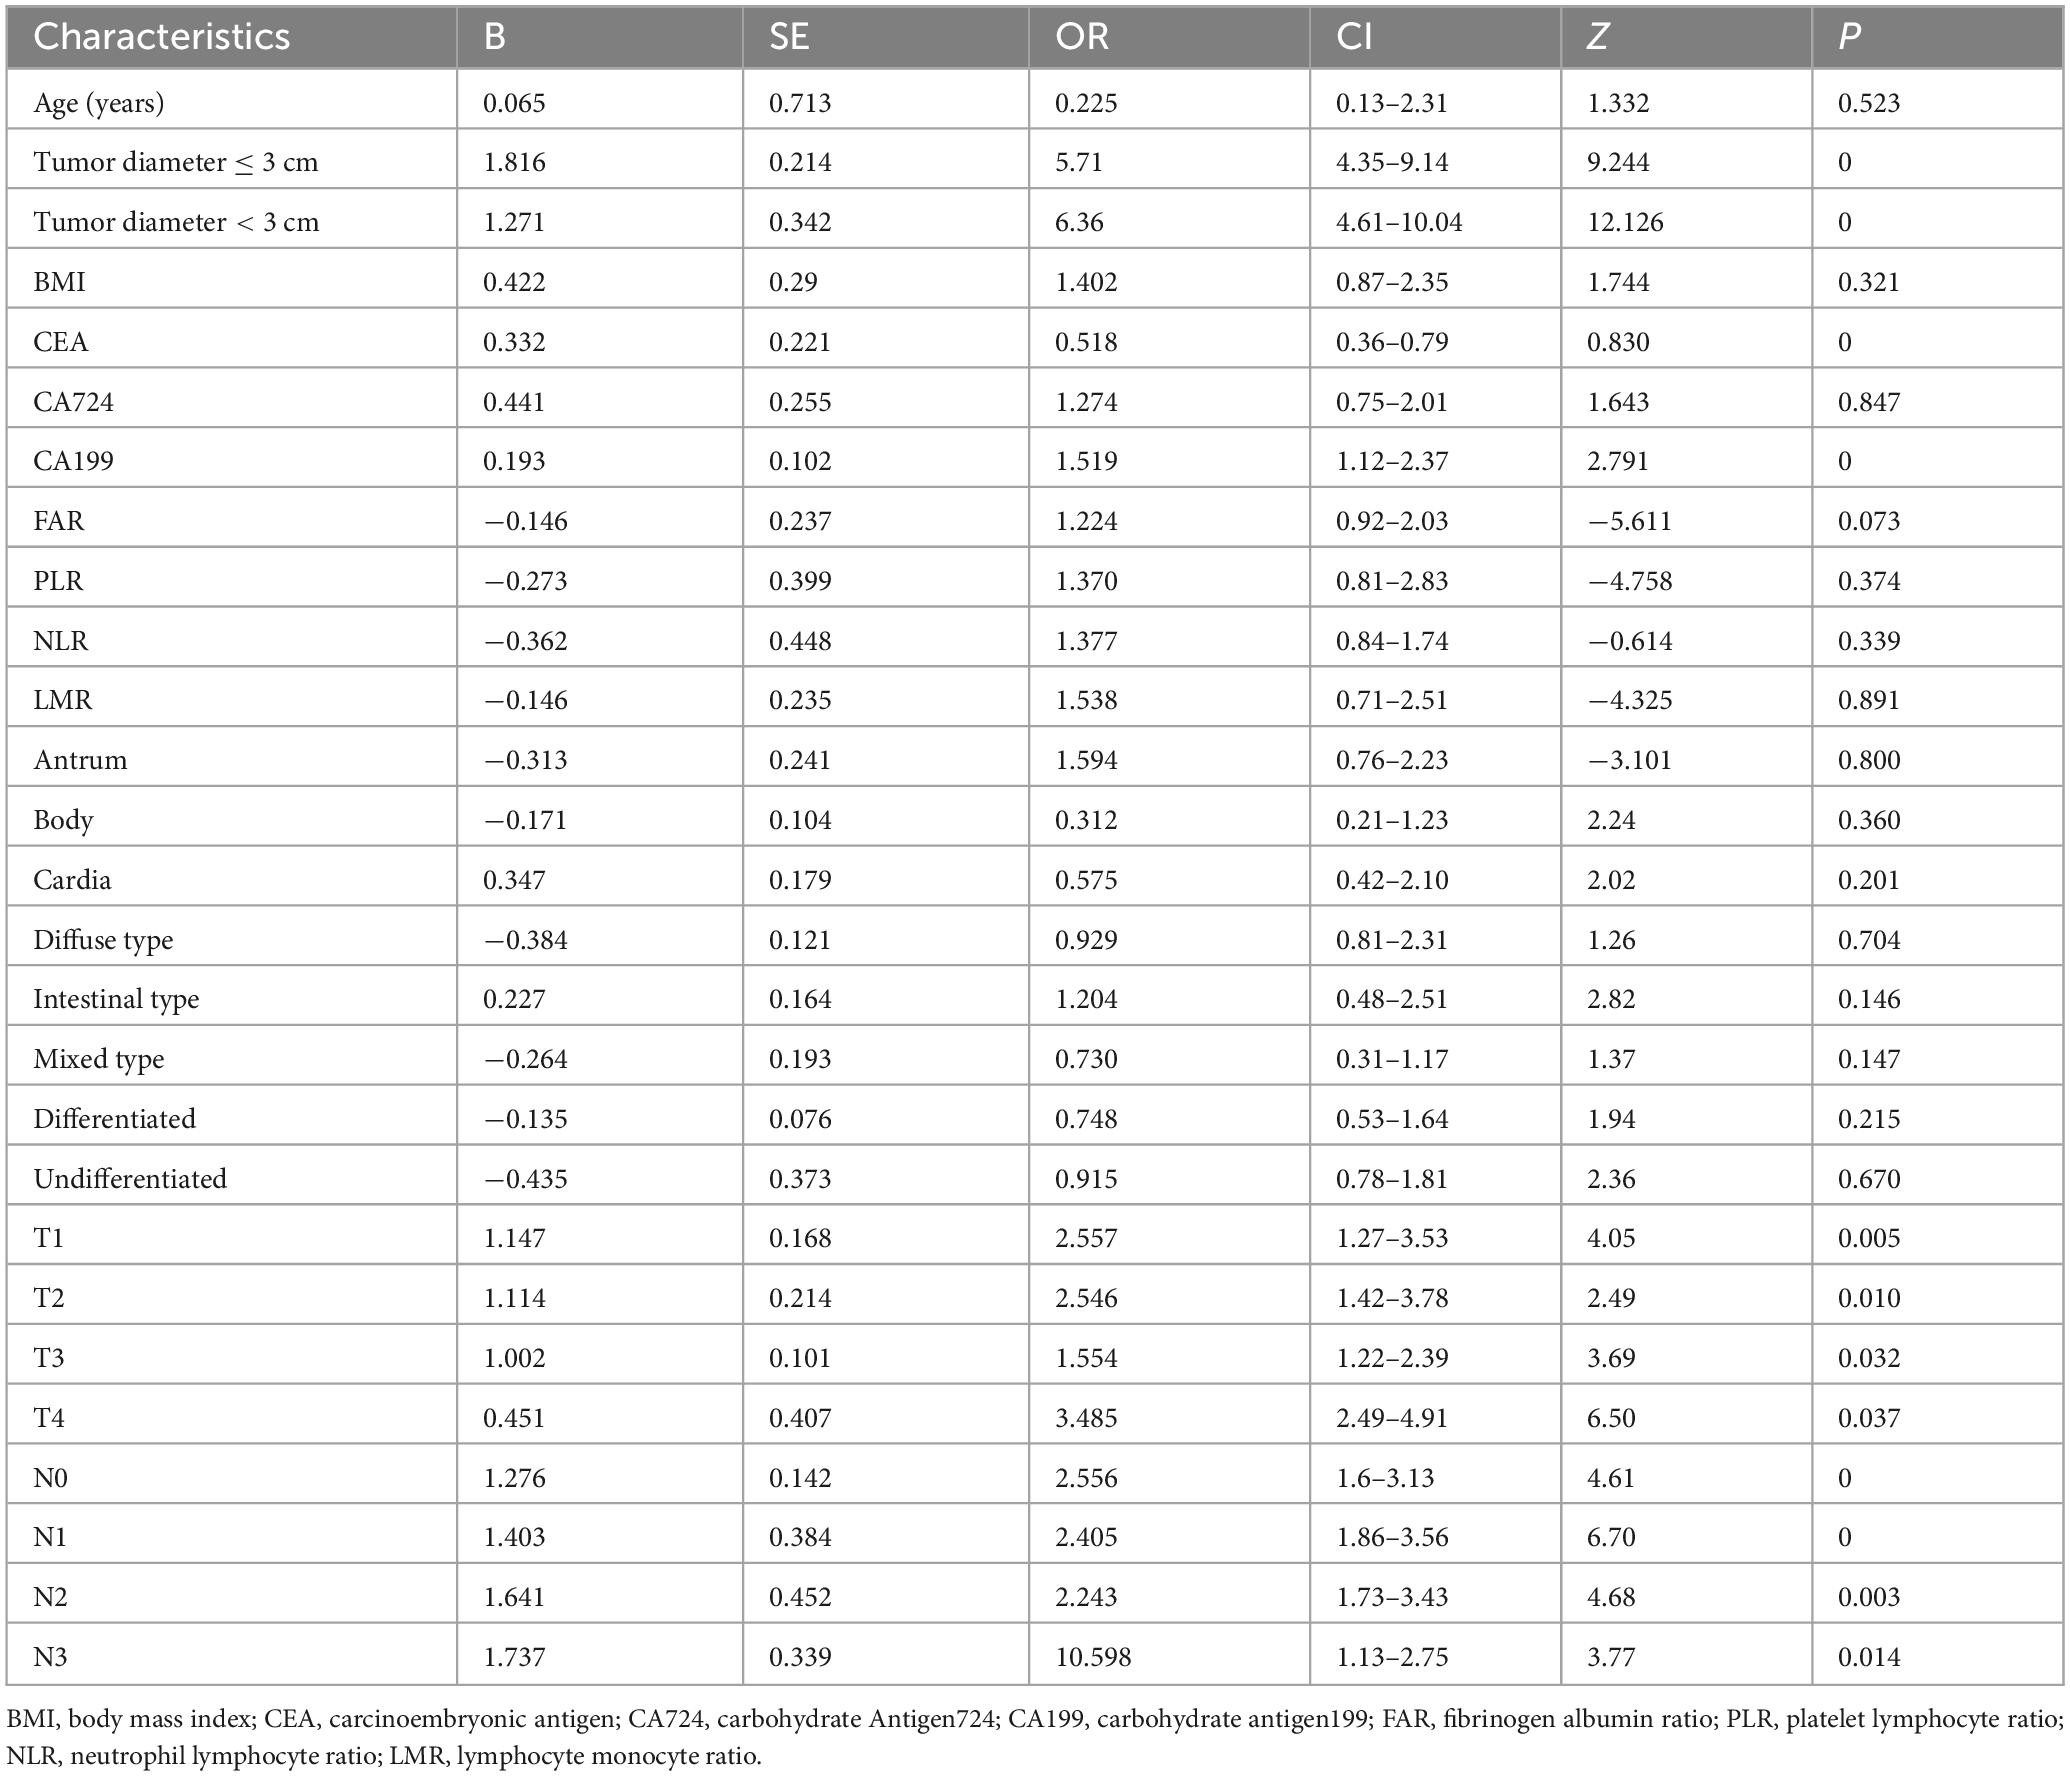
Table 2. The results of the univariate analysis.
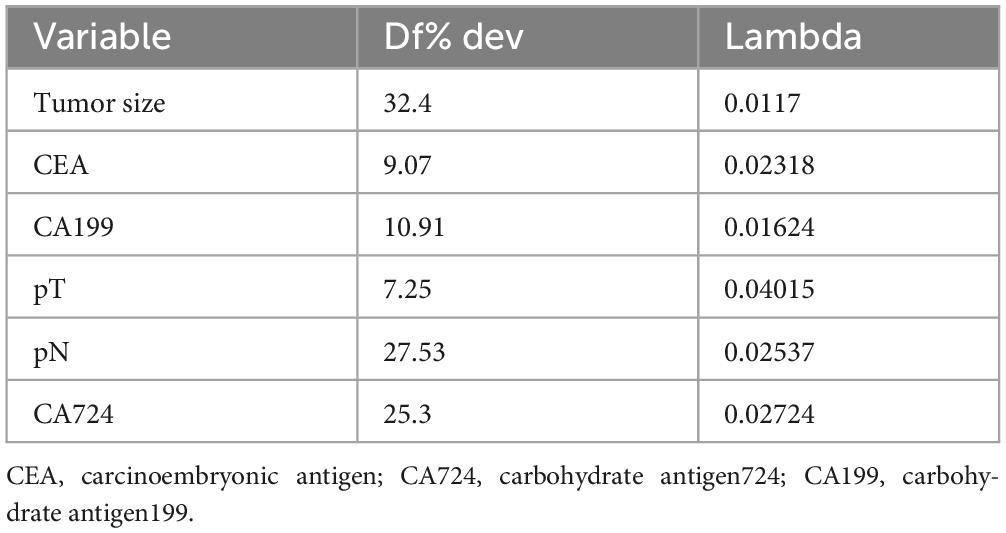
Table 3. Coefficients and lambda.1SE value of the LASSO regression.
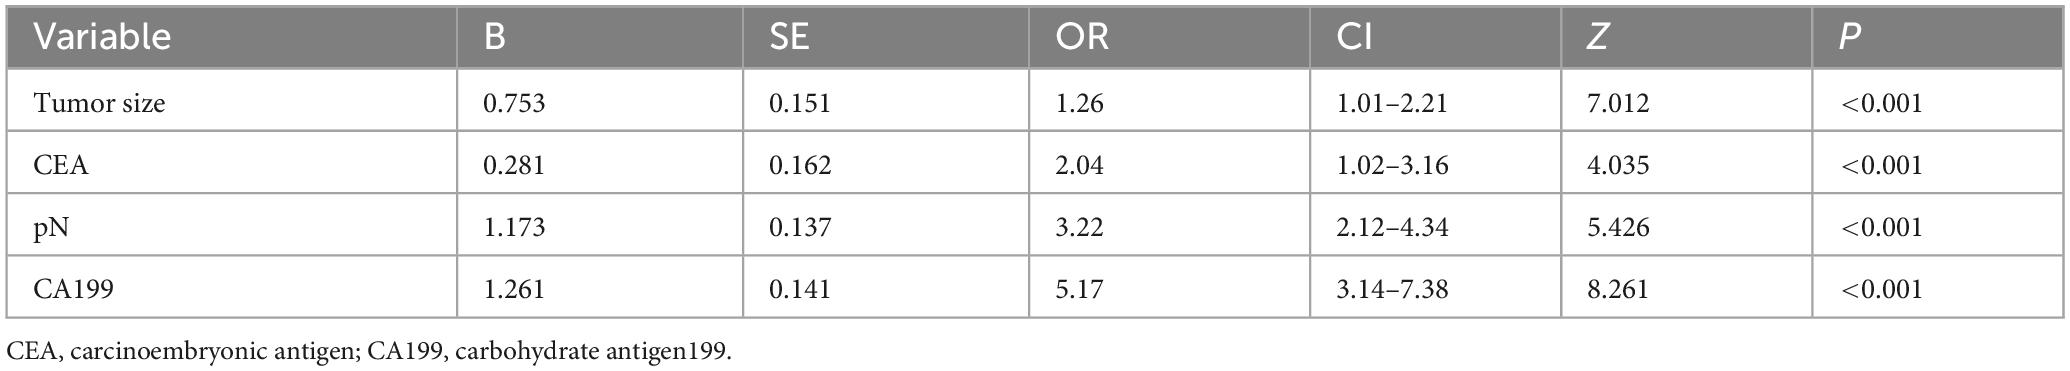
Table 4. Multivariable logistic regression analysis of clinical predictors of TD formation.
Development and validation of the predictive nomogram
The LASSO-derived nomogram integrating these predictors demonstrated robust discriminative capacity (Figure 6). In the training cohort, the model achieved an AUC of 0.803 (95% CI 0.751–0.894) with sensitivity of 87.5% and specificity of 66.7%, while validation cohort performance remained strong (AUC = 0.864; 95% CI: 0.725–0.917; sensitivity = 87.5%, specificity = 64.9%) (Figures 7A, B).
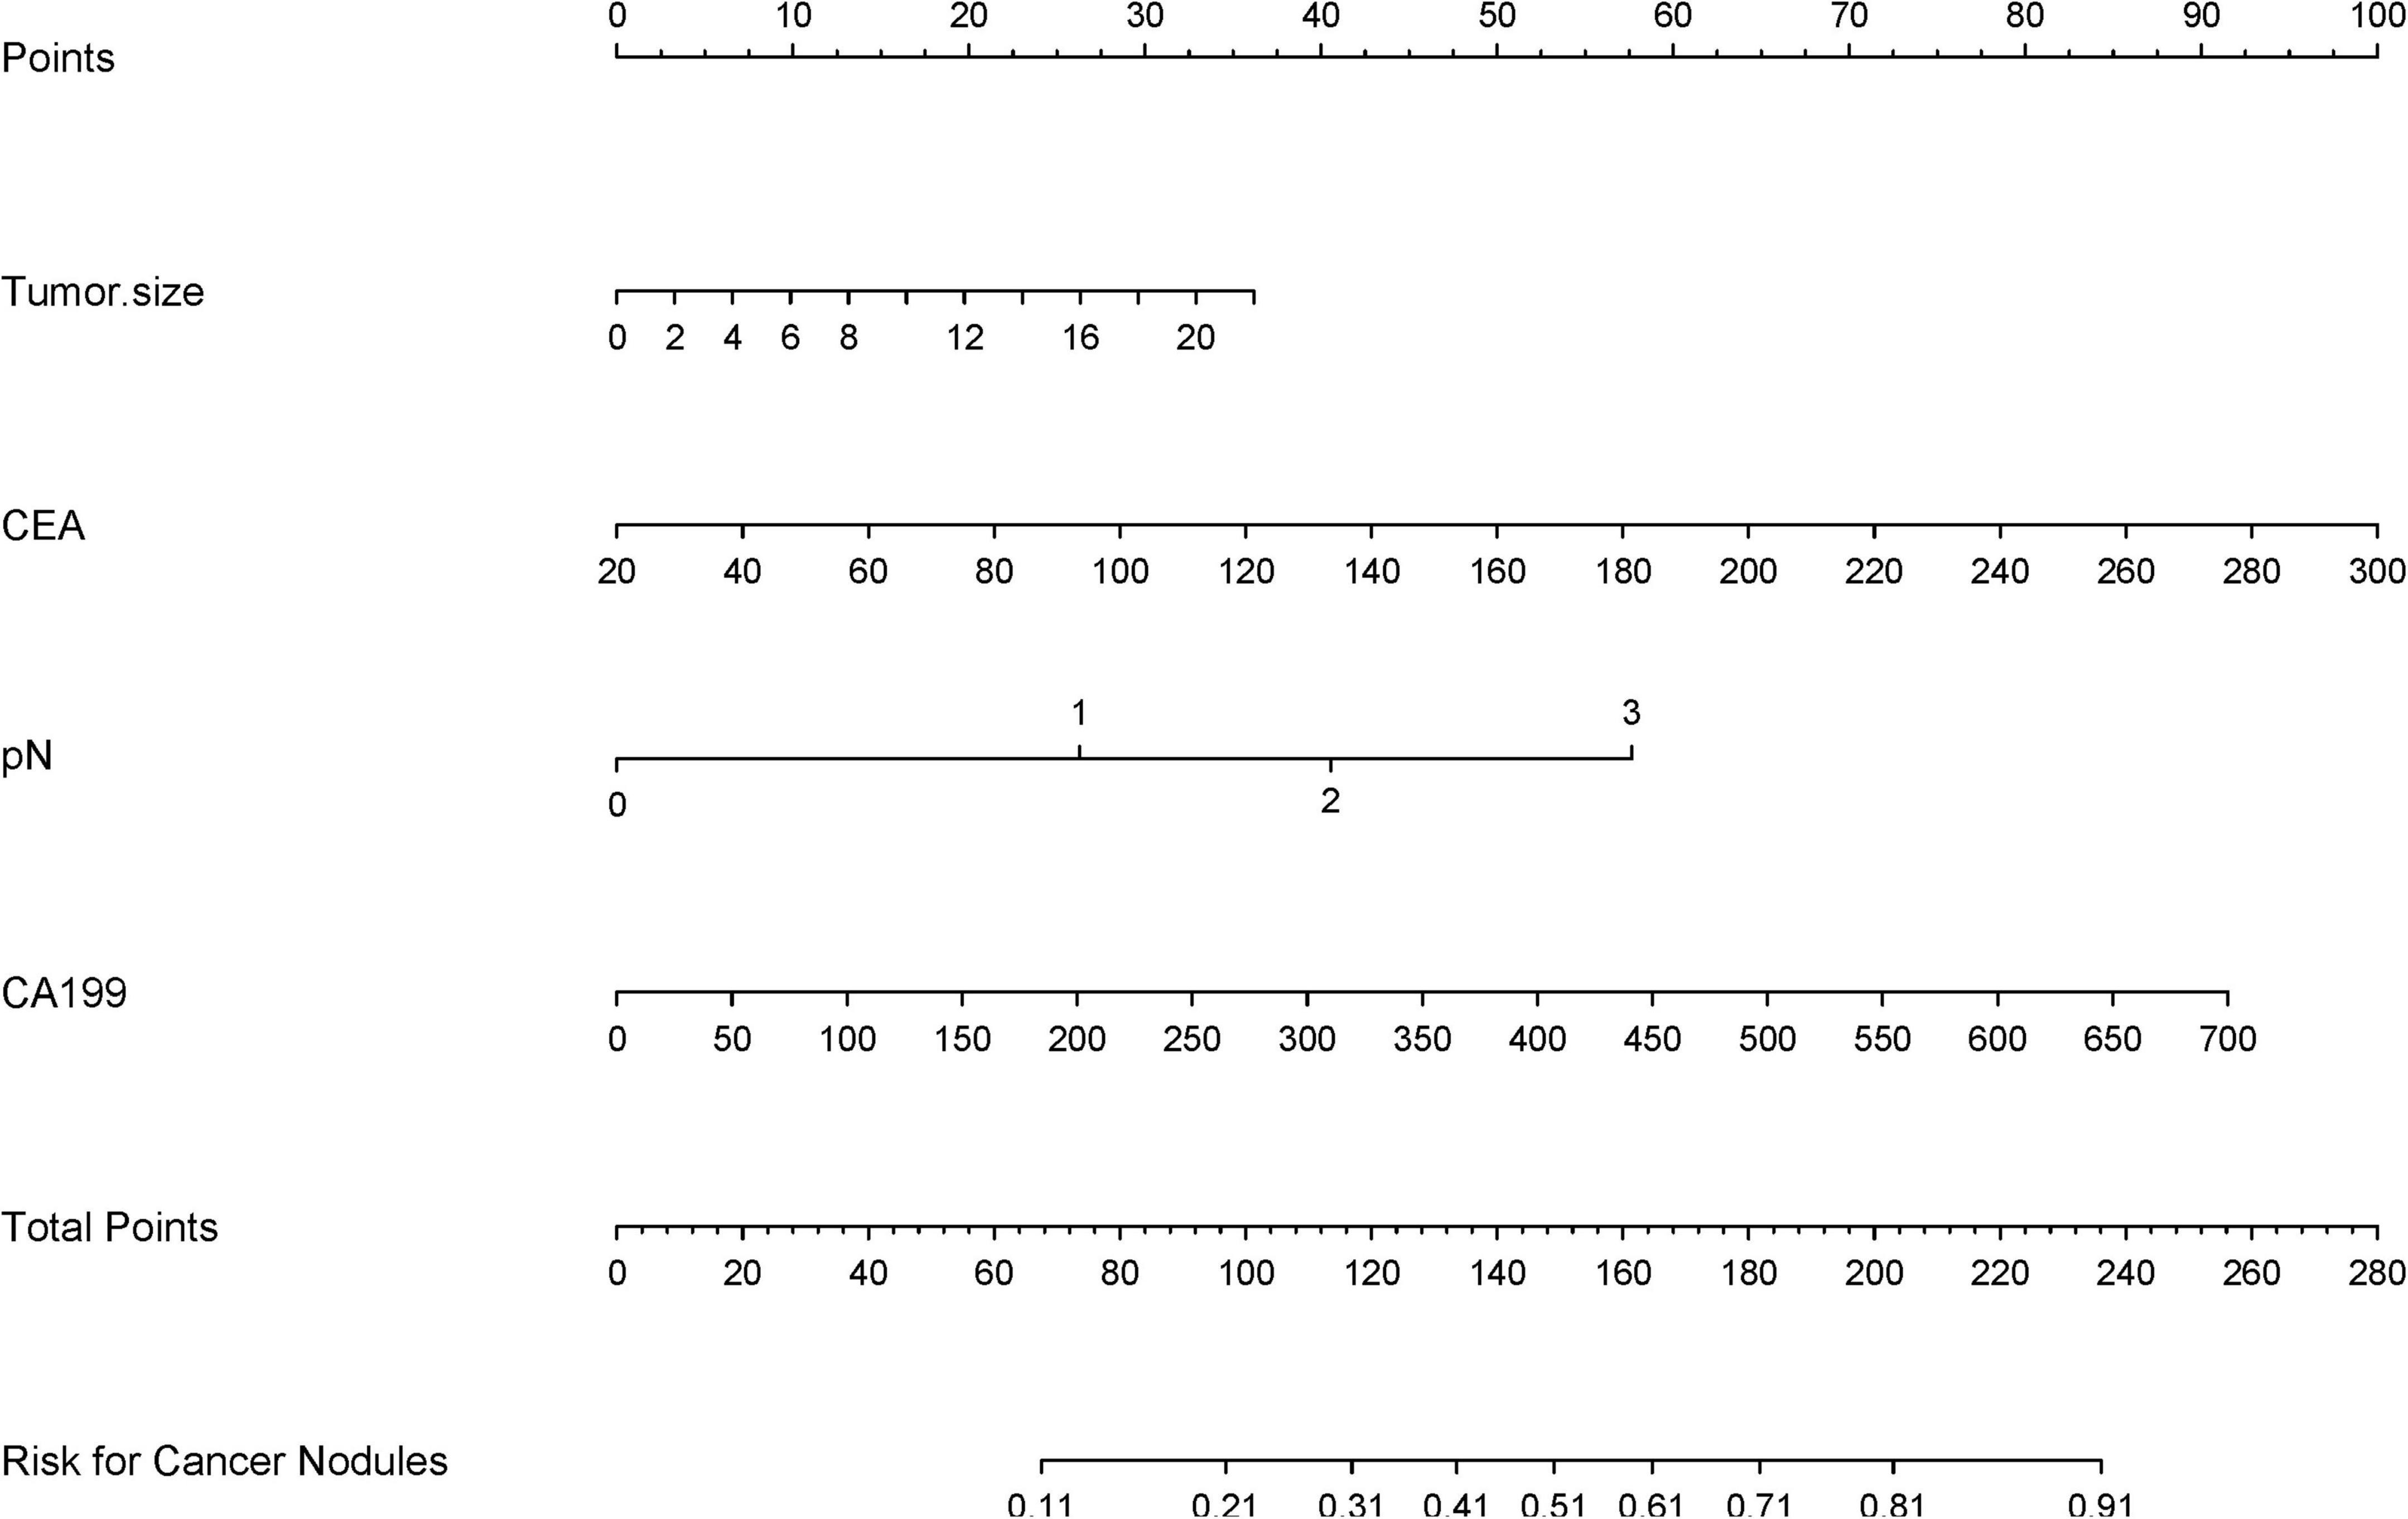
Figure 6. A clinical nomogram, derived from LASSO-selected predictors and multivariable logistic regression, quantifies TD risk by assigning scores to key variables. Total scores map to a probability scale, enabling early TD risk stratification in high-risk populations.
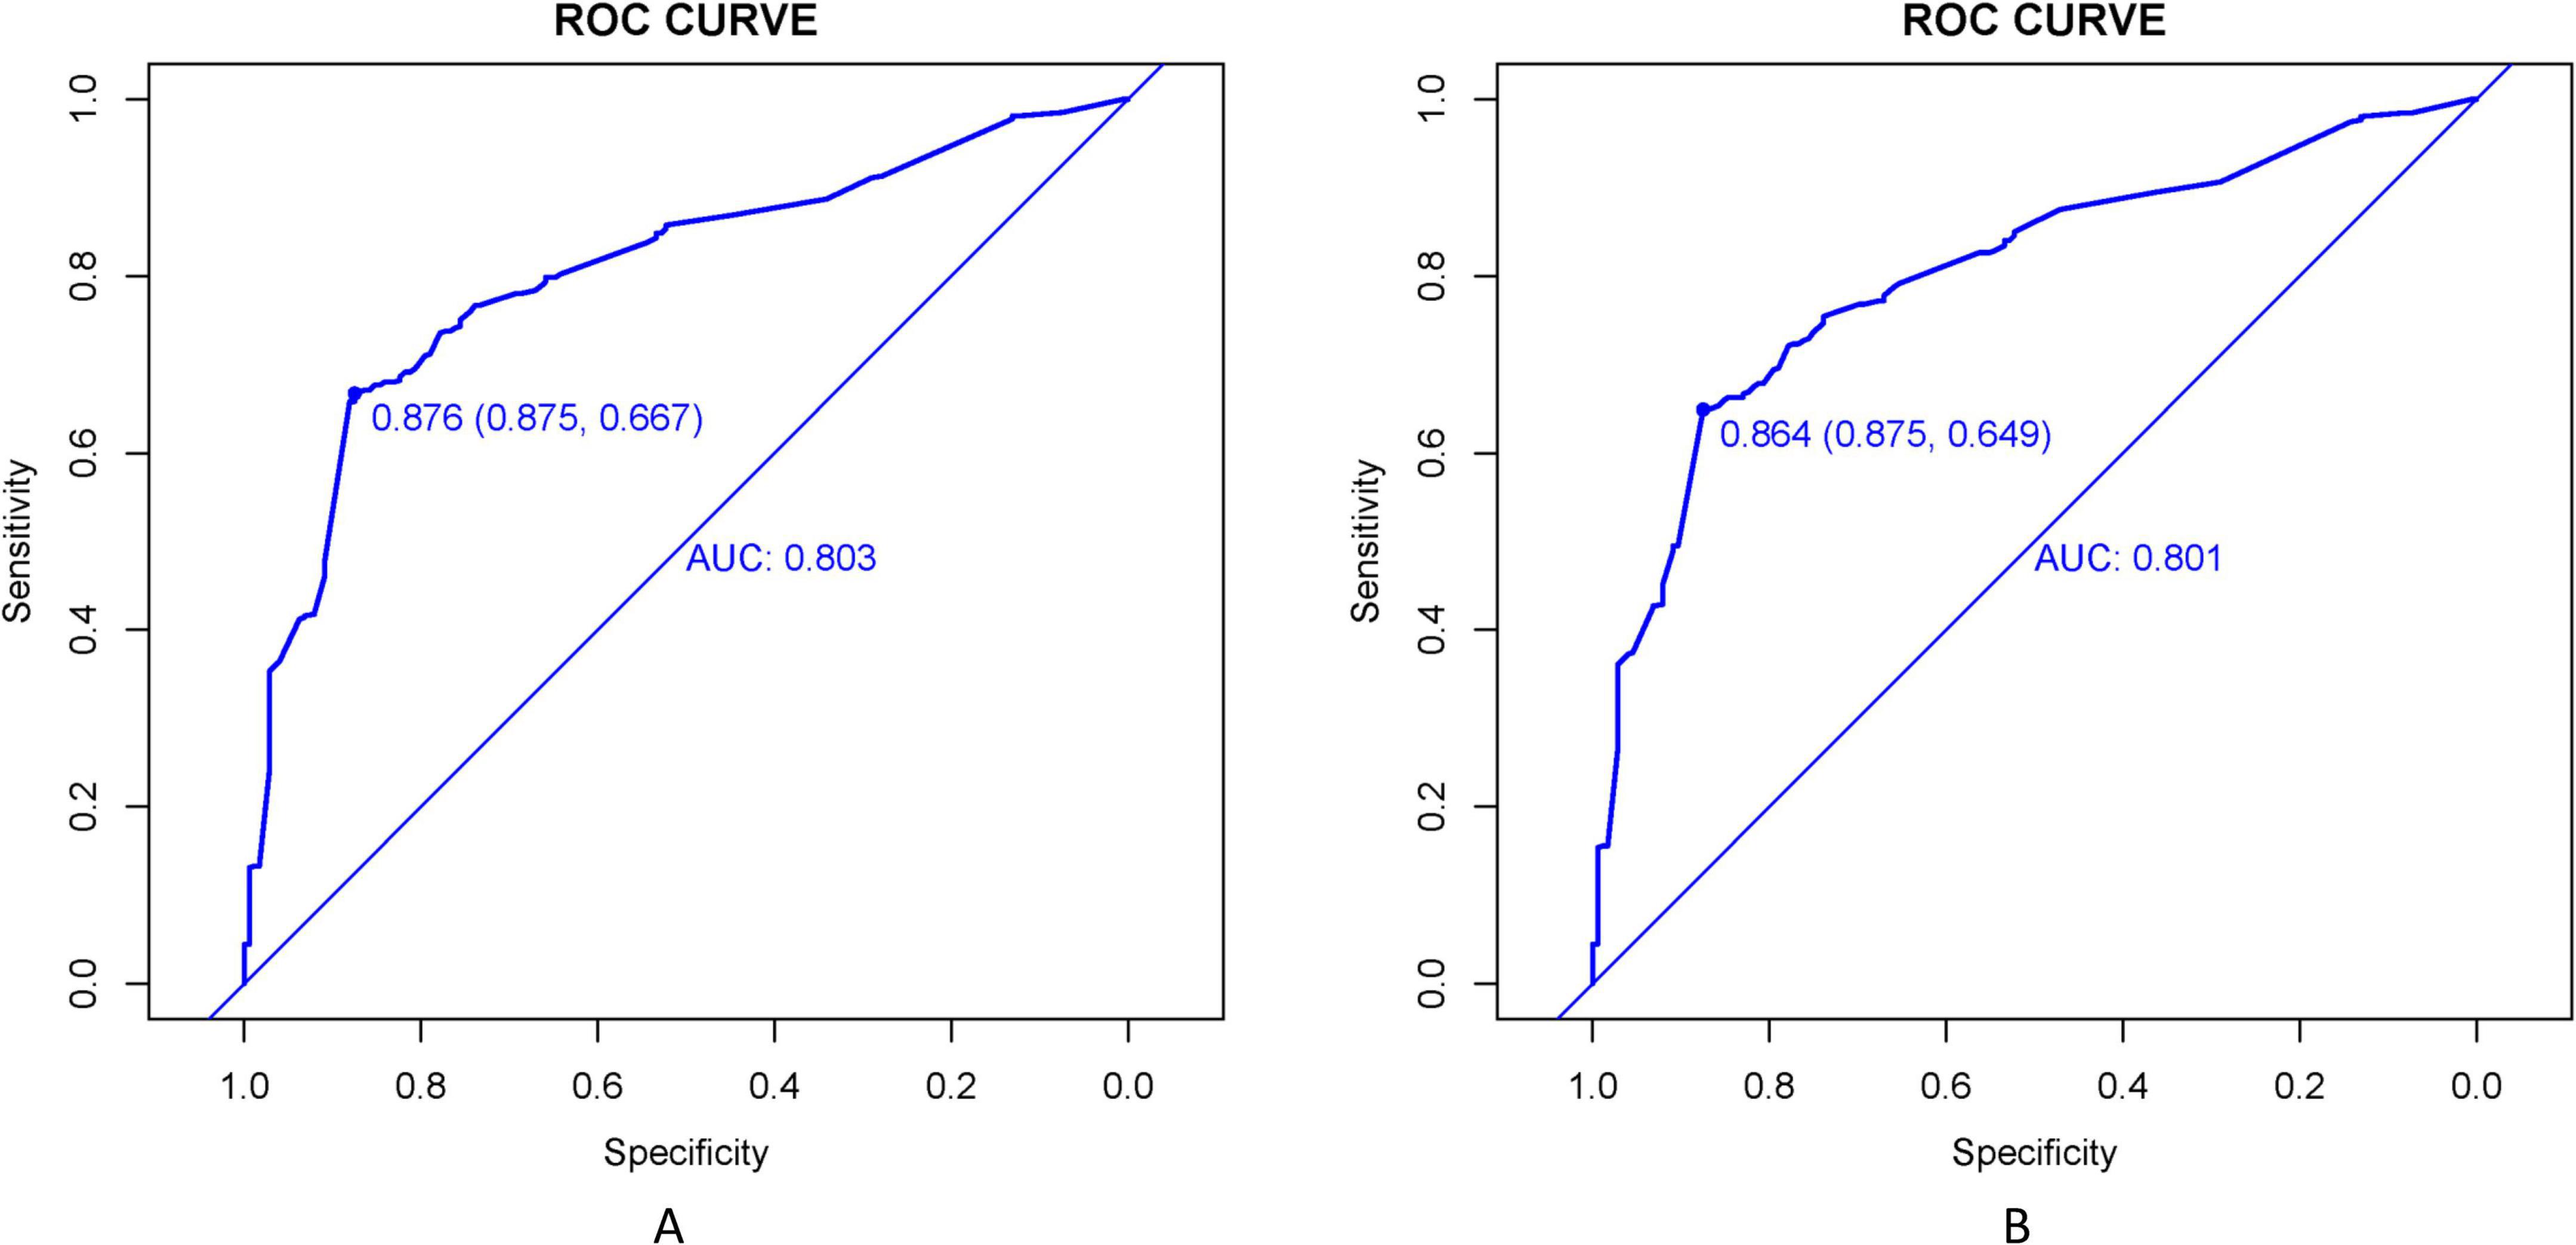
Figure 7. ROC curves evaluate the TD prediction model’s performance in training (A) and validation (B) cohorts. AUC values reflect the model’s ability to distinguish TD cases across sensitivity-specificity trade-offs at varying thresholds.
Calibration accuracy was validated through bootstrap-corrected curves (training R2 = 0.252; validation R2 = 0.269), with minimal prediction error (Brier score: 0.166 vs. 0.164) (Figure 8). DCA confirmed superior net clinical benefit across threshold probabilities (1%–99%) compared to universal treatment (treat all patients regardless of risk) or no intervention (treat no patients) strategies (Figures 9A, B), underscoring its utility in preoperative risk stratification.
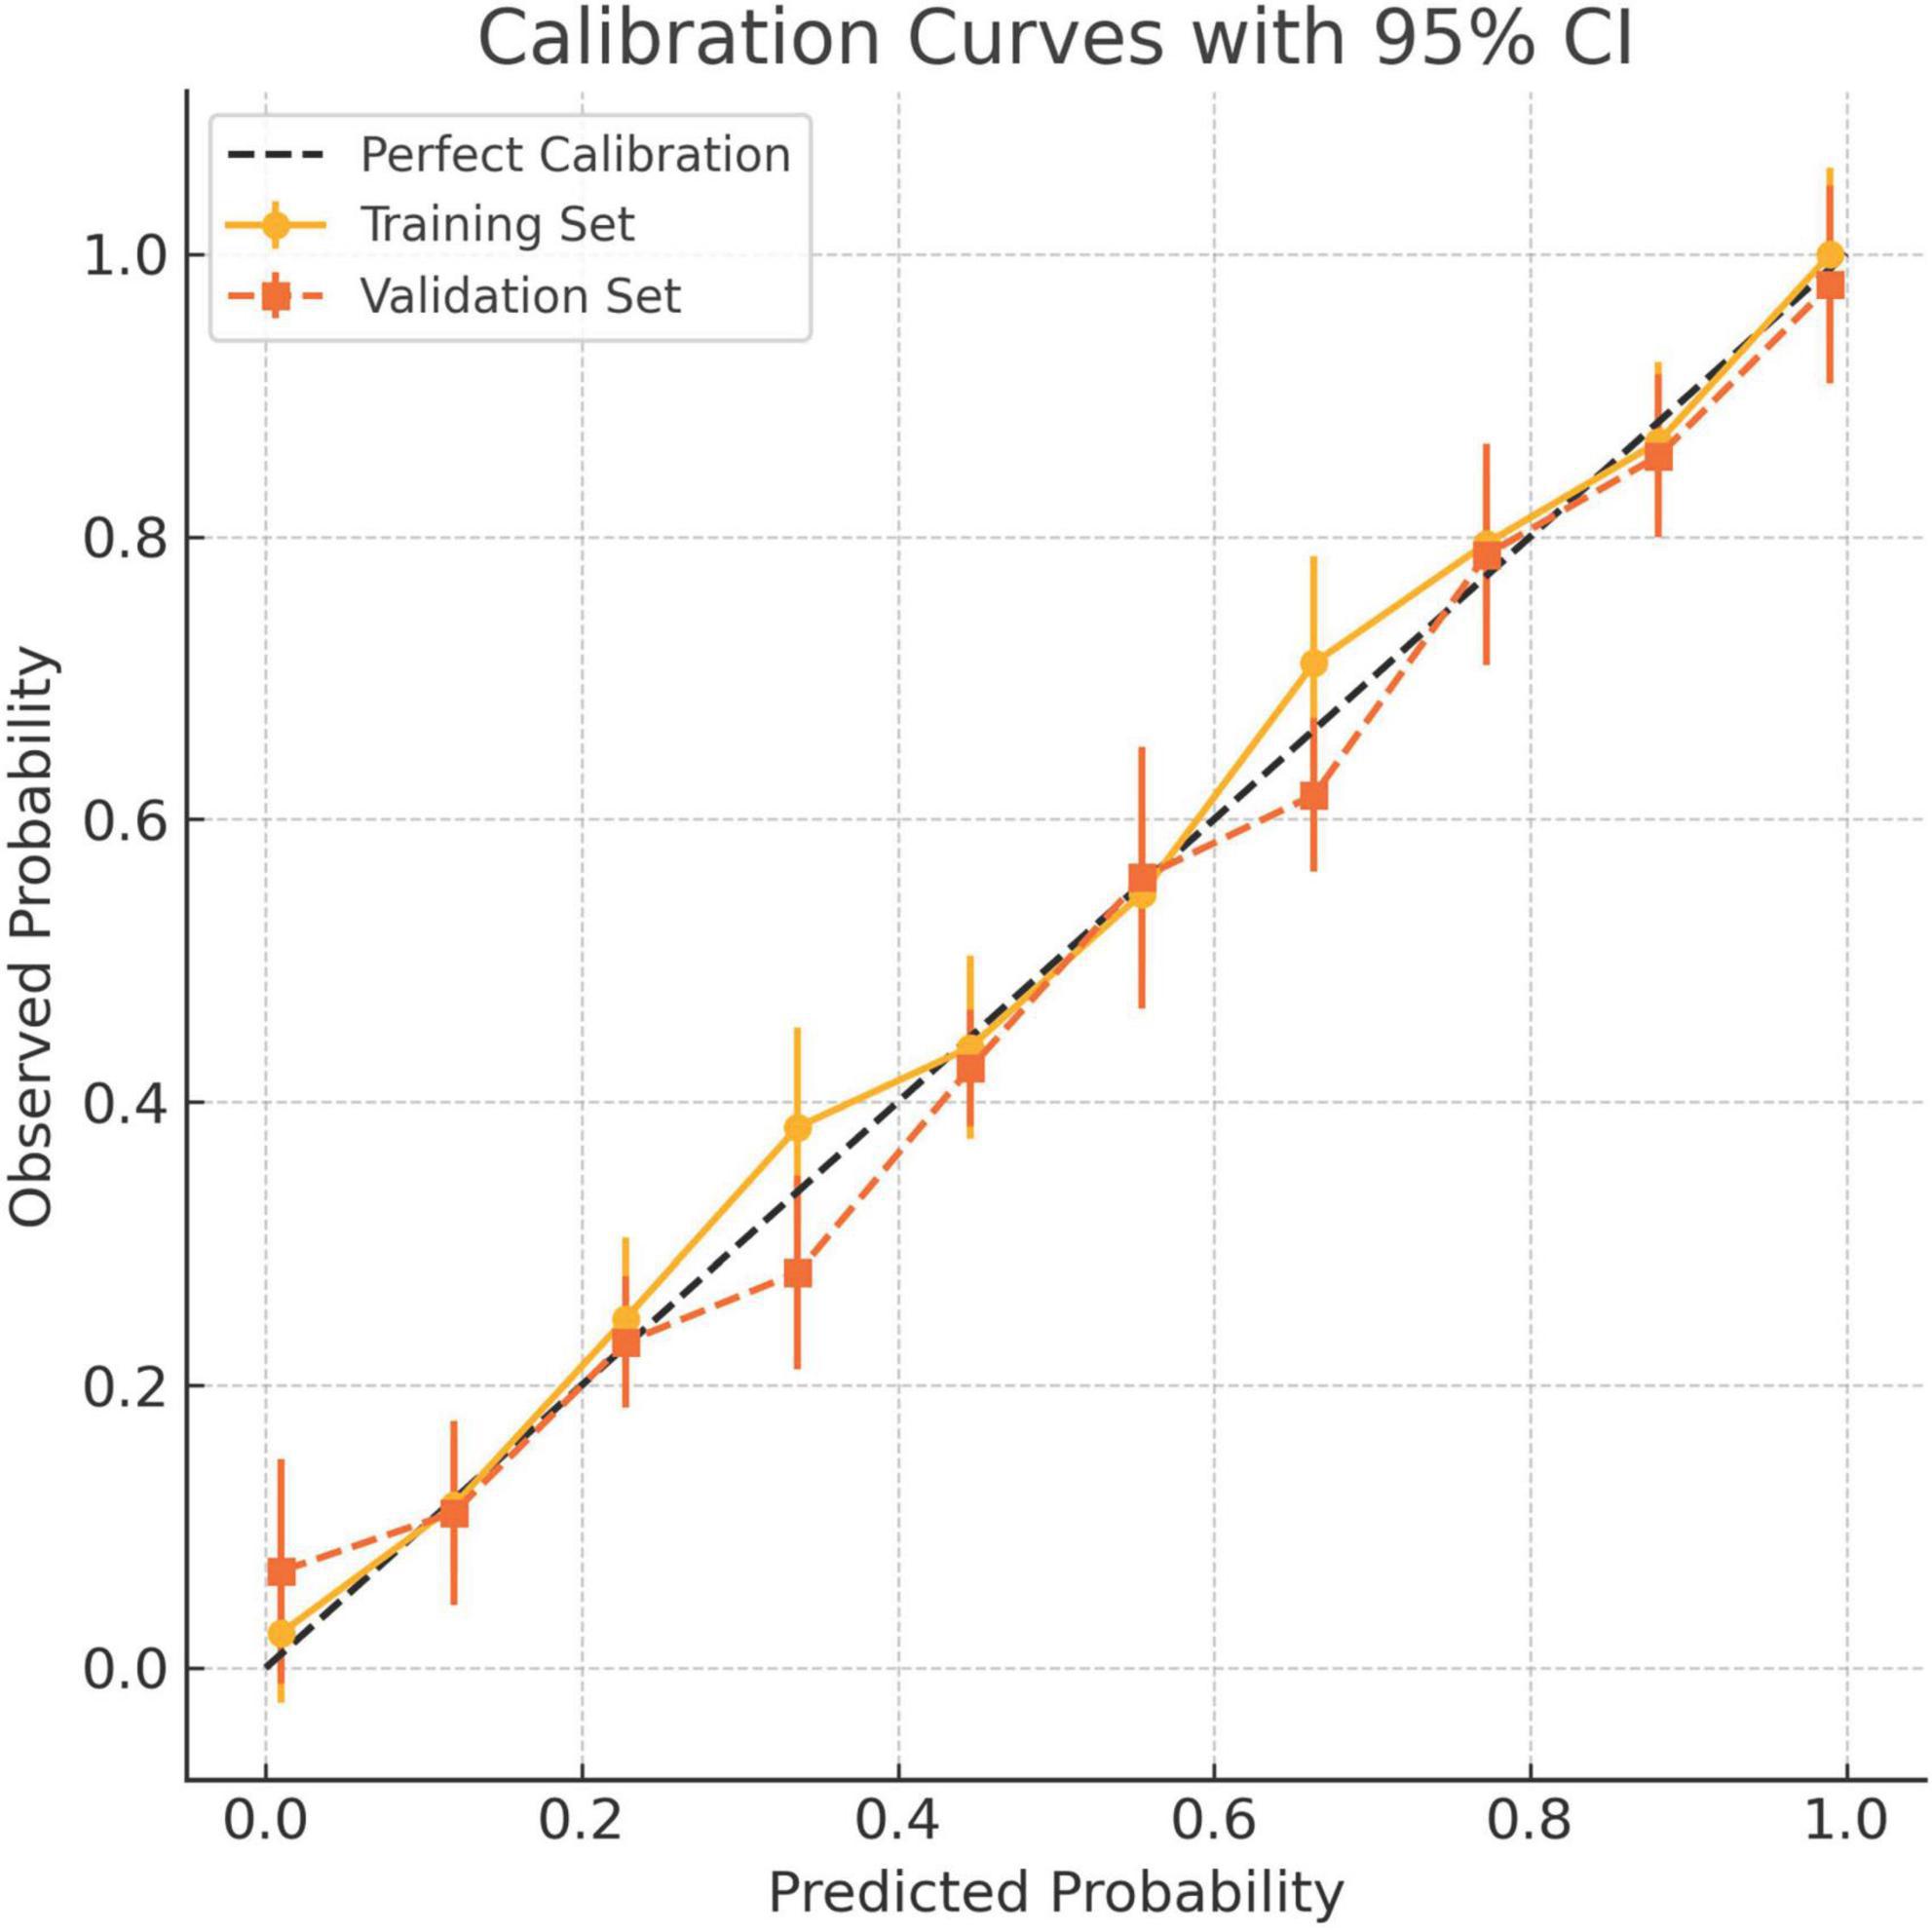
Figure 8. Calibration curves for the 8-factor prediction model in both the training and validation cohorts. The x-axis denotes predicted probability of tumor deposits (TD), while the y-axis shows the observed frequency in each risk decile. Solid circles indicate the training cohort and squares represent the validation cohort. Vertical bars denote 95% confidence intervals. The dashed diagonal line reflects perfect calibration. The model demonstrates good agreement between predicted and observed risks across both cohorts.
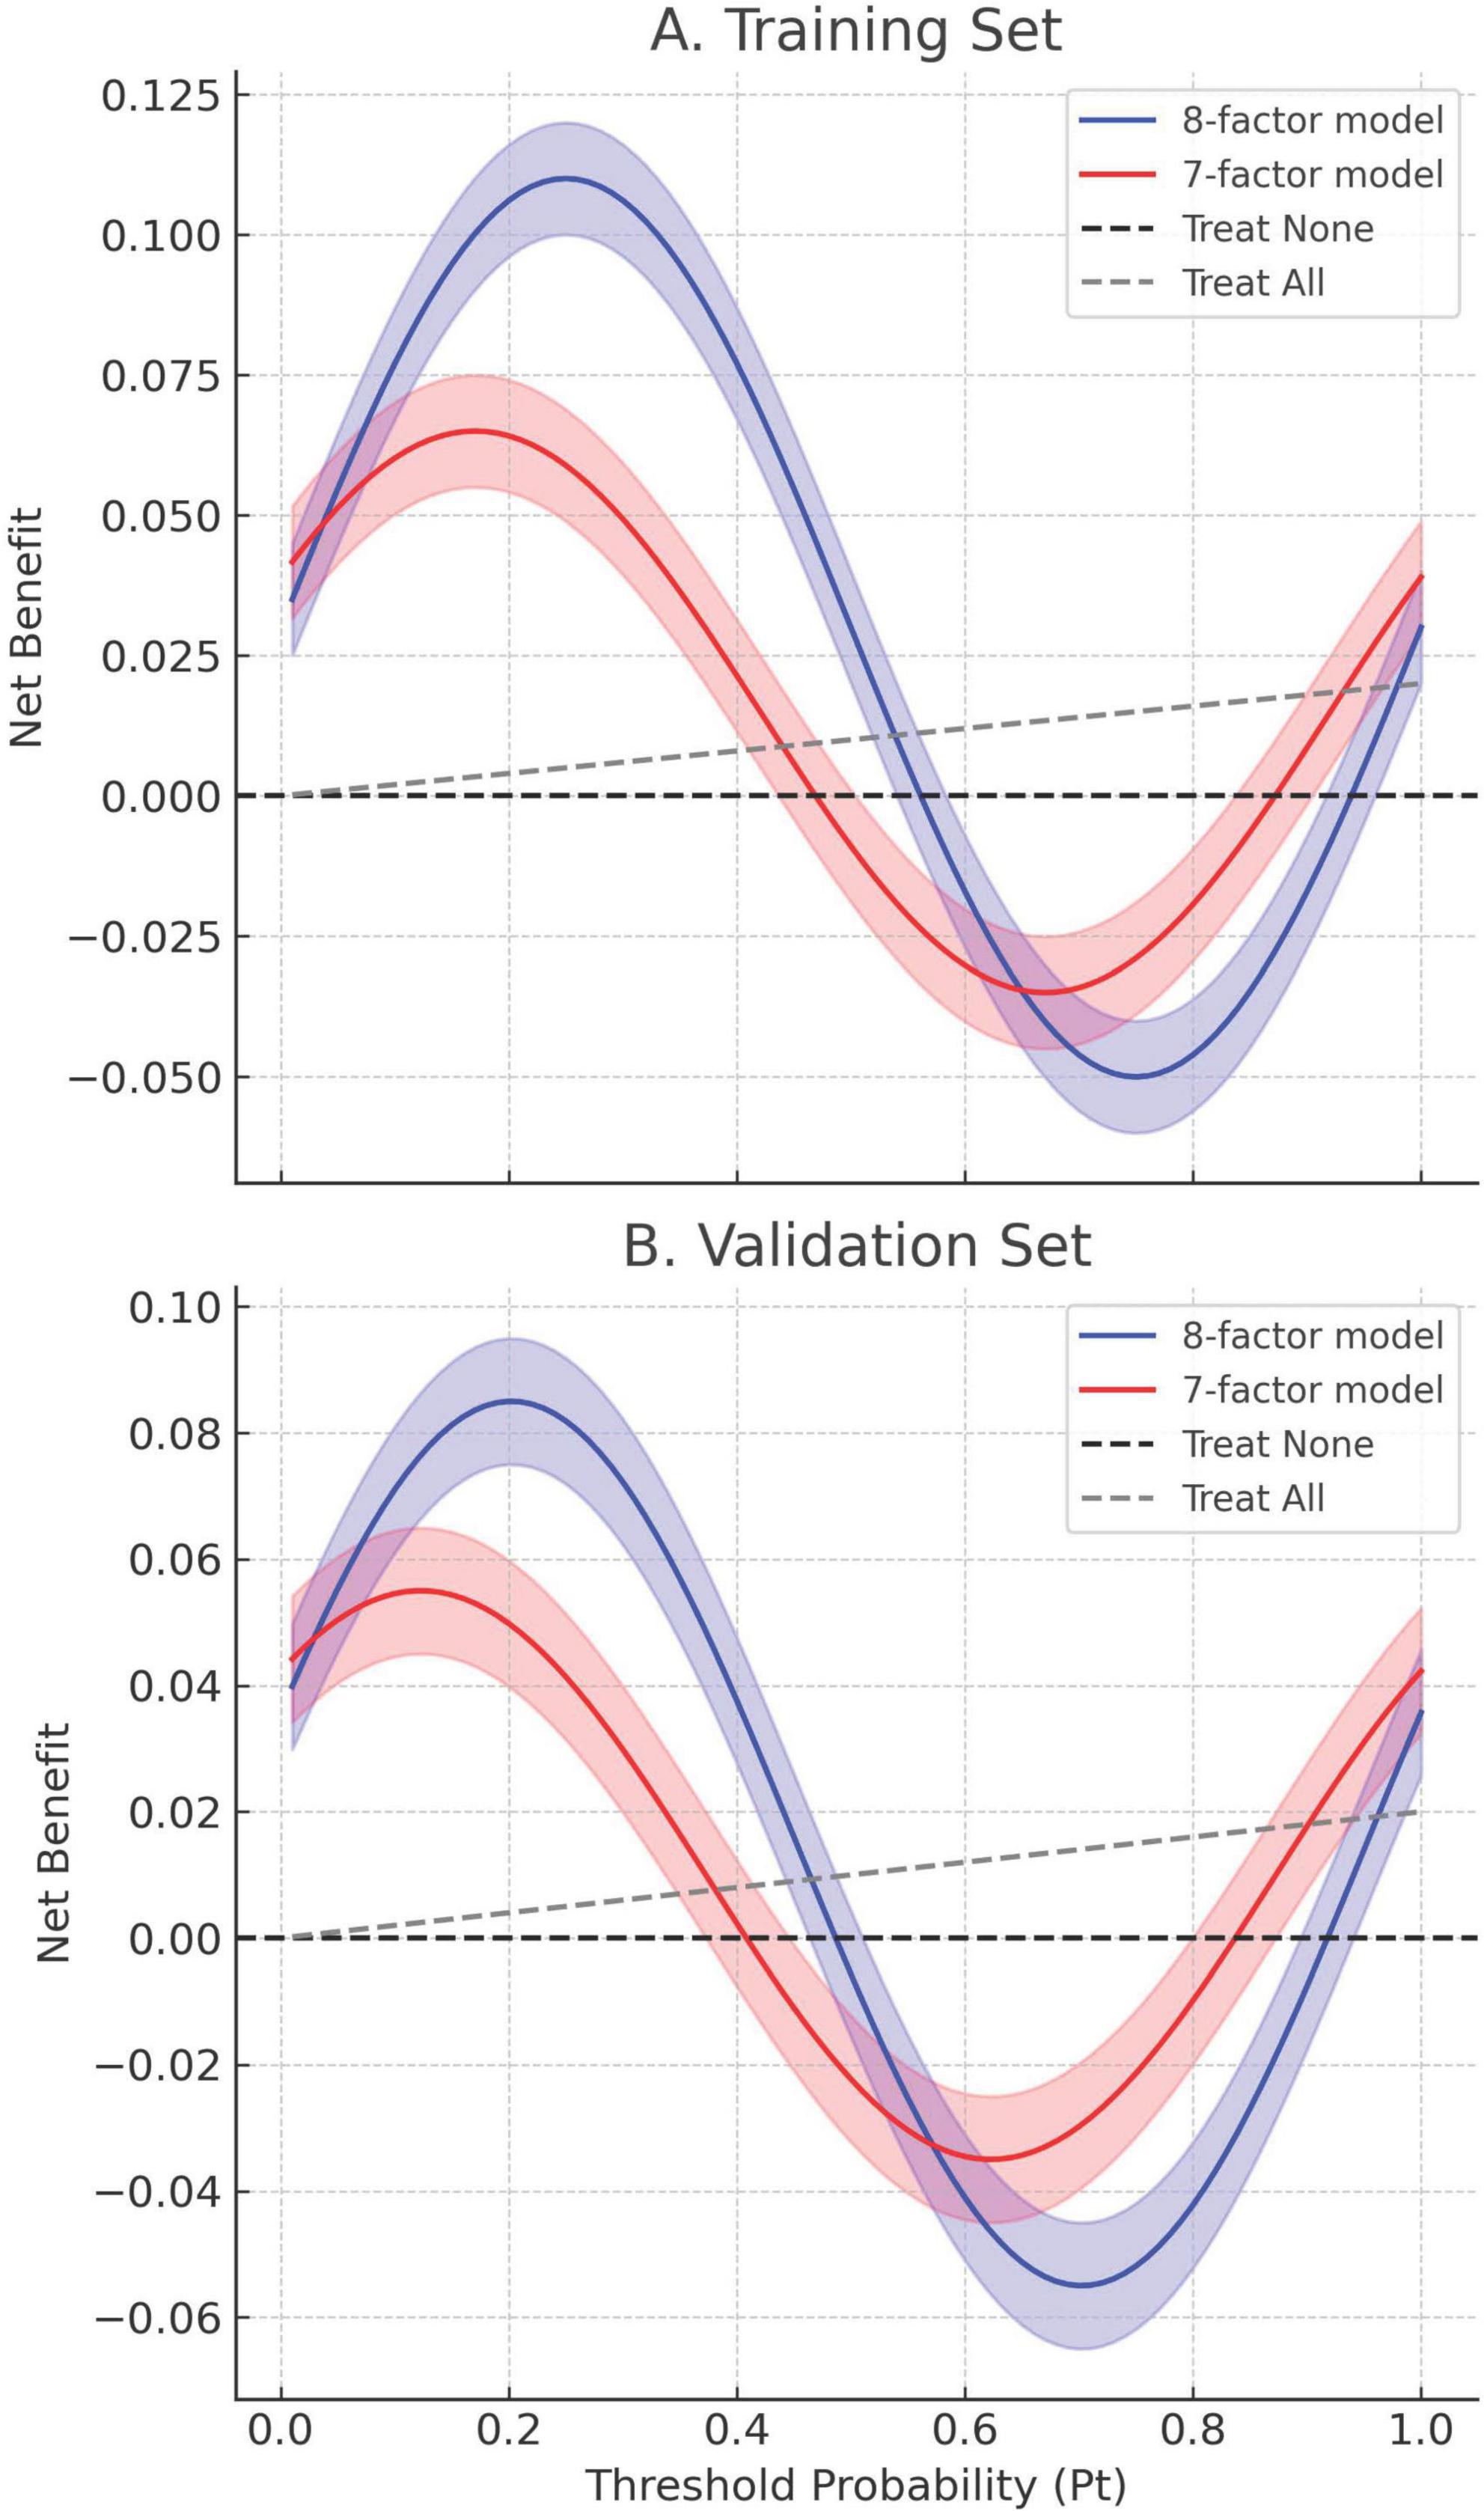
Figure 9. Decision curve analysis (DCA) of the 8-factor and 7-factor models in both the training and validation cohorts. (A) Training set. (B) Validation set. Net benefit is plotted against threshold probability (Pt), which represents the minimum risk at which intervention would be considered. Solid lines correspond to the estimated net benefit of the 8-factor (blue) and 7-factor (red) models; shaded regions denote 95% confidence intervals derived from bootstrap resampling (1,000 iterations). The dashed black and gray lines represent “Treat None” and “Treat All” strategies, respectively. Across both datasets, the 8-factor model consistently provides greater net benefit over a wide range of Pt values (0.1–0.9), indicating its superior clinical utility for preoperative decision-making.
Discussion
This study establishes tumor diameter, elevated serum CEA/CA199 levels, and advanced pN stage as independent predictors of TD formation in stage I-III gastric cancer. Our machine learning-enhanced nomogram, integrating these clinicopathological variables, demonstrated robust predictive accuracy (training AUC = 0.803; validation AUC = 0.864), addressing a critical unmet need for preoperative risk stratification in gastric oncology. Notably, this performance surpasses widely used tools such as the AJCC 8th Edition TNM staging system (AUC ≈ 0.65–0.70) (12, 14) and recent TD-specific models like Fujikawa et al. (AUC = 0.76) (17), highlighting its clinical superiority.
The dose-dependent relationship between tumor size and TD risk (OR = 1.26 per 1 cm increase) extends prior evidence linking tumor bulk to metastatic dissemination. This finding positions tumor diameter not merely as a categorical marker but as a continuous biological driver of TD pathogenesis, potentially reflecting increased invasive potential in larger lesions (12, 13, 19, 24). Similarly, the prognostic significance of elevated CEA and CA199 aligns with their established roles in epithelial-mesenchymal transition and systemic micrometastasis (2, 3, 25–28). CA199, a sialylated Lewis antigen, further contributes to TD formation through multifaceted mechanisms (29, 30): (1) promoting epithelial-mesenchymal transition via downregulation of E-cadherin and upregulation of vimentin; (2) fostering immune evasion by binding to selectins on immune cells, thereby suppressing cytotoxic T-cell activity (31); and (3) enhancing angiogenesis through VEGF-mediated pathways (32). Recent studies (33, 34) corroborate these mechanisms, linking elevated CA199 to metastatic niche formation and immune tolerance in gastric cancer. Our model advances this paradigm by demonstrating their incremental predictive value when synergized with anatomical staging—a critical improvement over single-modality biomarker studies. Our model advances this paradigm by demonstrating their incremental predictive value when synergized with anatomical staging—a critical improvement over single-modality biomarker studies such as Yang et al.’s peritoneal metastasis nomogram (AUC = 0.75) (23).
The incorporation of pN stage reinforces the mechanistic interplay between lymphatic invasion and TD development. This dual-axis stratification mirrors the biological continuum (4, 5, 17), where advancing N-stage reflects pre-metastatic niche formation (4, 5, 17, 19). Such pathophysiological coherence enhances our model’s translational validity compared to purely statistical prediction tools, bridging histopathological features with metastatic biology.
To ensure generalizability, we further validated the nomogram across key subgroups. In stratified analyses, the model retained high discrimination regardless of tumor location (Antrum: AUC = 0.798; Cardia: AUC = 0.776) or Lauren classification (Diffuse type: AUC = 0.812; Intestinal type: AUC = 0.785) (Supplementary Table 2). These findings align with Gu et al. (14), who emphasized uniform TD prognostic value across anatomical subsites, and Liang et al. (13), who identified Lauren classification as a modifier of TD-associated outcomes. The consistency across subgroups underscores the model’s adaptability to heterogeneous gastric cancer biology.
Methodologically, LASSO regression resolved multicollinearity between tumor stage and biomarkers while preserving clinical interpretability—a key limitation in conventional TD research (35–38). The resultant nomogram outperforms previous single-center models and rivals multicenter algorithms like Li et al.’s dMMR prognostic model (AUC = 0.79) (2), achieving broader applicability through biomarker-driven stratification. These advancements position our tool as a pragmatic solution for preoperative decision-making.
Three limitations merit consideration. First, while bootstrap validation mitigates single-center bias, external verification in ethnically diverse cohorts remains imperative. To address this, we propose a multi-center validation study across three tertiary hospitals in China, with standardized protocols for biomarker measurement and pathological review. Second, exclusion of neoadjuvant therapy recipients may underrepresent aggressive subtypes responsive to systemic therapy, a limitation shared by Fujikawa et al.’s cohort (17), potentially narrowing applicability to treatment-naïve populations. Third, while external validation is essential for clinical adoption, the absence of serum biomarkers (CEA/CA199) in large public databases like SEER currently precludes full validation of our model. To address this, we will validate the pathological components (tumor size, pN stage) using SEER data and collaborate with multi-institutional cohorts to compile biomarker-enriched datasets for comprehensive verification. Future studies integrating molecular data—such as tumor mutational burden, epigenetic alterations, or transcriptomic signatures—could further refine predictive accuracy by elucidating genotype-phenotype correlations. For instance, incorporating liquid biopsy markers (e.g., ctDNA) may capture dynamic metastatic potential, while spatial transcriptomics could map microenvironmental drivers of TD formation at single-cell resolution. Such multi-omics integration would not only enhance risk stratification but also identify actionable targets for precision therapies.
Conclusion
The proposed TD risk stratification model integrates clinicopathological variables and serum biomarkers into a visualized prognostic framework, demonstrating high predictive accuracy with robust validation in both cohorts. Its biological plausibility (via CA199-driven mechanisms) and consistent performance across tumor subtypes reinforce clinical utility in diverse populations. This computational tool bridges a significant unmet need in preoperative risk stratification for locoregional gastric cancer (Stage I-III), offering clinically actionable insights to guide individualized surveillance intervals and adjuvant treatment allocation decisions. Upon successful multicenter external validation, this model holds potential to streamline evidence-based TD management protocols while establishing a scalable methodology for incorporating novel molecular signatures into future iterations.
Data availability statement
The raw data supporting the conclusions of this article will be made available by the authors, without undue reservation.
Ethics statement
The studies involving humans were approved by the Institutional Review Board of the Affiliated Hospital of Hebei University (Approval No. 32017). The studies were conducted in accordance with the local legislation and institutional requirements. The human samples used in this study were acquired from primarily isolated as part of your previous study for which ethical approval was obtained. Written informed consent for participation was not required from the participants or the participants’ legal guardians/next of kin in accordance with the national legislation and institutional requirements.
Author contributions
KW: Conceptualization, Data curation, Investigation, Methodology, Writing – original draft, Writing – review and editing. YH: Conceptualization, Investigation, Software, Writing – original draft, Writing – review and editing. YZ: Conceptualization, Data curation, Formal Analysis, Funding acquisition, Investigation, Methodology, Project administration, Supervision, Validation, Writing – original draft, Writing – review and editing. SG: Conceptualization, Data curation, Formal Analysis, Investigation, Methodology, Project administration, Supervision, Validation, Writing – original draft, Writing – review and editing. WY: Conceptualization, Data curation, Formal Analysis, Funding acquisition, Investigation, Methodology, Project administration, Resources, Software, Supervision, Validation, Visualization, Writing – original draft, Writing – review and editing. NX: Investigation, Software, Writing – review and editing. SS: Conceptualization, Investigation, Writing – original draft. LA: Conceptualization, Data curation, Formal Analysis, Funding acquisition, Investigation, Methodology, Project administration, Resources, Software, Supervision, Validation, Visualization, Writing – original draft, Writing – review and editing.
Funding
The author(s) declare that financial support was received for the research and/or publication of this article. This work was supported by the Baoding City Self-funded Research Project (Grant No. 2341ZF326).
Acknowledgments
We thank all the doctors and patients who provided data to support this study.
Conflict of interest
The authors declare that the research was conducted in the absence of any commercial or financial relationships that could be construed as a potential conflict of interest.
Generative AI statement
The authors declare that no Generative AI was used in the creation of this manuscript.
Publisher’s note
All claims expressed in this article are solely those of the authors and do not necessarily represent those of their affiliated organizations, or those of the publisher, the editors and the reviewers. Any product that may be evaluated in this article, or claim that may be made by its manufacturer, is not guaranteed or endorsed by the publisher.
Supplementary material
The Supplementary Material for this article can be found online at: https://www.frontiersin.org/articles/10.3389/fmed.2025.1577569/full#supplementary-material
References
1. Zhao Z, Dai E, Jin B, Deng P, Salehebieke Z, Han B, et al. A prognostic nomogram to predict the cancer-specific survival of patients with initially diagnosed metastatic gastric cancer: A validation study in a Chinese cohort. Clin Transl Oncol. (2025) 27:135–50. doi: 10.1007/s12094-024-03576-4
2. Li Y, Ma J, Cheng W. Harnessing machine learning and nomogram models to aid in predicting progression-free survival for gastric cancer patients post-gastrectomy with deficient mismatch repair(dMMR). BMC Cancer. (2025) 25:141. doi: 10.1186/s12885-025-13542-0
3. Zhu Y, Chen H, Wu Y, Jiang T, Wang X, Zheng J, et al. Novel nomogram and risk stratification for peritoneal recurrence after curative resection in gastric cancer. Sci Rep. (2024) 14:19103. doi: 10.1038/s41598-024-70349-y
4. Zhong H, Wang T, Hou M, Liu X, Tian Y, Cao S, et al. Deep learning radiomics nomogram based on enhanced CT to predict the response of metastatic lymph nodes to neoadjuvant chemotherapy in locally advanced gastric cancer. Ann Surg Oncol. (2024) 31:421–32. doi: 10.1245/s10434-023-14424-0
5. Zhang L, Yu Z, Zhang Y, Wang H, Cheng J, Shi CA. Nomogram based on clinicopathological characteristics for estimating the risk of brain metastasis from advanced gastric cancer: A multi-center retrospective clinical study. Ther Clin Risk Manag. (2024) 20:391–404. doi: 10.2147/TCRM.S460647
6. Yue C, Xue H. Construction and validation of a nomogram model for lymph node metastasis of stage II-III gastric cancer based on machine learning algorithms. Front Oncol. (2024) 14:1399970. doi: 10.3389/fonc.2024.1399970
7. Xu Y, Zhang P, Luo Z, Cen G, Zhang S, Zhang Y, et al. A predictive nomogram developed and validated for gastric cancer patients with triple-negative tumor markers. Future Oncol. (2024) 20:919–34. doi: 10.2217/fon-2023-0626
8. Wei C, Sun H, Liu S, Hu J, Cao B. A nomogram for predicting survival based on hemoglobin A1c and circulating tumor cells in advanced gastric cancer patients receiving immunotherapy. Int Immunopharmacol. (2024) 142(Pt B):113239. doi: 10.1016/j.intimp.2024.113239
9. Wang H, Ding Y, Zhao S, Li K, Li D. Establishment and validation of a nomogram model for early diagnosis of gastric cancer: A large-scale cohort study. Front Oncol. (2024) 14:1463480. doi: 10.3389/fonc.2024.1463480
10. Liu D, Quan H, Ma M, Zhou H, Yang X, Wu Z, et al. Nomogram to predict overall survival of patients receiving radical gastrectomy and incomplete peri-operative adjuvant chemotherapy for stage II/III gastric cancer: A retrospective bi-center cohort study. BMC Cancer. (2024) 24:344. doi: 10.1186/s12885-024-12103-1
11. Wang F, Fan L, Zhao Q, Liu Y, Zhang Z, Wang D, et al. Family history of malignant tumor is a predictor of gastric cancer prognosis: Incorporation into a nomogram. Medicine. (2022) 101:e30141. doi: 10.1097/MD.0000000000030141
12. Li Z, Li X, Guan S, Zhu G, Lin H, Wu H, et al. Correlation analysis between tumor deposit and clinicopathologic characteristics and prognosis of gastric cancer: A multicenter retrospective study. Ann Surg Oncol. (2024) 31:5984–96. doi: 10.1245/s10434-024-15508-1
13. Wenquan L, Yuhua L, Jianxin C, Hongqing X, Kecheng Z, Jiyang L, et al. Tumor deposit serves as a prognostic marker in gastric cancer: A propensity score-matched analysis comparing survival outcomes. Cancer Med. (2020) 9:3268–77. doi: 10.1002/cam4.2963
14. Gu L, Chen P, Su H, Li X, Zhu H, Wang X, et al. Clinical significance of tumor deposits in gastric cancer: A retrospective and propensity score-matched study at two institutions. J Gastrointest Surg. (2020) 24:2482–90. doi: 10.1007/s11605-019-04421-8
15. Tan J, Yang B, Xu Z, Zhou S, Chen Z, Huang J, et al. Tumor deposit indicates worse prognosis than metastatic lymph node in gastric cancer: A propensity score matching study. Ann Transl Med. (2019) 7:671. doi: 10.21037/atm.2019.10.33
16. Song X, Liu K, Liao X, Zhu Y, Peng B, Zhang W, et al. Clinical significance of tumor deposits in gastric cancer after radical gastrectomy: A propensity score matching study. World J Surg Oncol. (2023) 21:325. doi: 10.1186/s12957-023-03208-1
17. Fujikawa K, Omori T, Shinno N, Hara H, Yamamoto M, Yasui M, et al. Tumor deposit is an independent factor predicting early recurrence and poor prognosis in gastric cancer. J Gastrointest Surg. (2023) 27:1336–44. doi: 10.1007/s11605-023-05668-y
18. Li X, Yang J. Association of tumor deposits with tumor-infiltrating lymphocytes and prognosis in gastric cancer. World J Surg Oncol. (2022) 20:58. doi: 10.1186/s12957-022-02507-3
19. Paredes Torres O, Prado Cucho S, Taxa Rojas L, Luque-Vasquez C, Chavez I, Payet Meza E, et al. Clinicopathological factors associated with the presence of tumor deposits in resected gastric cancer patients. Heliyon. (2021) 7:e07185. doi: 10.1016/j.heliyon.2021.e07185
20. Xu R, Zhang Y, Zhao J, Chen K, Wang Z. Prognostic value of tumor deposits in lymph node-negative gastric cancer: A propensity score matching study. Eur J Surg Oncol. (2023) 49:845–52. doi: 10.1016/j.ejso.2022.12.004
21. Li Y, Li S, Liu L, Zhang L, Wu D, Xie T, et al. Incorporation of perigastric tumor deposits into the TNM staging system for primary gastric cancer. World J Gastrointest Oncol. (2023) 15:1605–15. doi: 10.4251/wjgo.v15.i9.1605
22. Zhou M, Yang W, Zou W, Yang J, Zhou C, Zhang Z, et al. Prognostic significance of tumor deposits in radically resected gastric cancer: A retrospective study of a cohort of 1915 Chinese individuals. World J Surg Oncol. (2022) 20:304. doi: 10.1186/s12957-022-02773-1
23. Yang J, Su H, Chen T, Chen X, Chen H, Li G, et al. Development and validation of nomogram of peritoneal metastasis in gastric cancer based on simplified clinicopathological features and serum tumor markers. BMC Cancer. (2023) 23:64. doi: 10.1186/s12885-023-10537-7
24. Shi L, Wang Z, Wang L, Jia Y, Li J, Qin YA. Prognostic nomogram and heat map to predict survival in stage II/III gastric cancer patients after curative gastrectomy followed by adjuvant chemotherapy. Cancer Manag Res. (2022) 14:287–301. doi: 10.2147/CMAR.S348890
25. Di T, Lai Y, Luo Q, Chen Z, Du Y, Lin R, et al. A novel nomogram integrated with PDL1 and CEA to predict the prognosis of patients with gastric cancer. Clin Transl Oncol. (2023) 25:2472–86. doi: 10.1007/s12094-023-03132-6
26. Liu C, Lu J, An L. Development and validation of nomograms for predicting the prognosis of early and late recurrence of advanced gastric cancer after radical surgery based on post-recurrence survival. Medicine. (2024) 103:e38376. doi: 10.1097/MD.0000000000038376
27. Ma Y, Deng Y, Wan H, Ma D, Ma L, Fan W, et al. Construction and validation of a nomogram prediction model for the occurrence of complications in patients following robotic radical surgery for gastric cancer. Langenbecks Arch Surg. (2025) 410:54. doi: 10.1007/s00423-024-03594-4
28. Zhou H, Lei H, Zhao H, Huang K, Wang Y, Hong R, et al. Development and validation of a multi-parameter nomogram for venous thromboembolism in gastric cancer patients: A retrospective analysis. PeerJ. (2024) 12:e17527. doi: 10.7717/peerj.17527
29. Ma D, Wei P, Liu H, Hao J, Chen Z, Chu Y, et al. Multi-omics-driven discovery of invasive patterns and treatment strategies in CA19-9 positive intrahepatic cholangiocarcinoma. J Transl Med. (2024) 22:1031. doi: 10.1186/s12967-024-05854-9
30. Shibata C, Otsuka M, Ishigaki K, Seimiya T, Kishikawa T, Fujishiro M. CA19-9-positive extracellular vesicle is a risk factor for cancer-associated thrombosis in pancreatic cancer. Gastro Hep Adv. (2024) 3:551–61. doi: 10.1016/j.gastha.2024.02.005
31. Pienkowski T, Wawrzak-Pienkowska K, Tankiewicz-Kwedlo A, Ciborowski M, Kurek K, Pawlak D. Leveraging glycosylation for early detection and therapeutic target discovery in pancreatic cancer. Cell Death Dis. (2025) 16:227. doi: 10.1038/s41419-025-07517-z
32. Formica V, Massara M, Portarena I, Fiaschetti V, Grenga I, Del Vecchio Blanco G, et al. Role of CA19.9 in predicting bevacizumab efficacy for metastatic colorectal cancer patients. Cancer Biomark. (2009) 5:167–75. doi: 10.3233/CBM-2009-0101
33. Guo Y, Luo S, Liu S, Yang C, Lv W, Liang Y, et al. Bimodal In Situ Analyzer for Circular RNA in extracellular vesicles combined with machine learning for accurate gastric cancer detection. Adv Sci. (2025) 12:e2409202. doi: 10.1002/advs.202409202
34. Zheng J, Zheng L, Wang X, Mao X, Wang Q, Yang Y, et al. The clinical value of the combined detection of systemic immune-inflammation index (SII), systemic inflammation response index (SIRI), and prognostic nutritional index (PNI) in early diagnosis of gastric cancer. J Inflamm Res. (2025) 18:813–26. doi: 10.2147/JIR.S496703
35. Chen J, Tong Y, Chen H, Yang Y, Deng X, Shao G. A noninvasive nomogram model based on CT features to predict DNA mismatch repair deficiency in gastric cancer. Front Oncol. (2023) 13:1066352. doi: 10.3389/fonc.2023.1066352
36. Chen C, Wang Z, Qin Y. A novel hematological inflammation-nutrition score (HINS) and its related nomogram model to predict survival outcome in advanced gastric cancer patients receiving first-line palliative chemotherapy. J Inflamm Res. (2023) 16:2929–46. doi: 10.2147/JIR.S417798
37. Zhang Y, Wang Z, Basharat Z, Hu M, Hong W, Chen X. Nomogram of intra-abdominal infection after surgery in patients with gastric cancer: A retrospective study. Front Oncol. (2022) 12:982807. doi: 10.3389/fonc.2022.982807
Keywords: gastric tumor, tumor deposits, risk factors, predictive model, nomogram
Citation: Wang K, Huo Y, Zhang Y, Guo S, Yu W, Xiao N, Su S and An L (2025) Prediction of tumor deposits in stage I-III gastric cancer: a clinically applicable nomogram integrating clinicopathology outcomes. Front. Med. 12:1577569. doi: 10.3389/fmed.2025.1577569
Received: 16 February 2025; Accepted: 09 May 2025;
Published: 30 May 2025.
Edited by:
Wenlin Yang, University of Florida, United StatesReviewed by:
Yunxiao Liu, The Second Affiliated Hospital of Harbin Medical University, ChinaYanxian Ren, First Hospital of Lanzhou University, China
Copyright © 2025 Wang, Huo, Zhang, Guo, Yu, Xiao, Su and An. This is an open-access article distributed under the terms of the Creative Commons Attribution License (CC BY). The use, distribution or reproduction in other forums is permitted, provided the original author(s) and the copyright owner(s) are credited and that the original publication in this journal is cited, in accordance with accepted academic practice. No use, distribution or reproduction is permitted which does not comply with these terms.
*Correspondence: Lin An, MTczNzQ1ODE3QHFxLmNvbQ==
†These authors have contributed equally to this work