 Riken Chen1†
 Yuan Zhang1†
 Weilong Ye1†
 Zhaojun Chen1†
 Weifeng Liao1
 Huizhao Liao2
 Tingting Sun2Huan Li1Junfen Cheng1
 Wang Liu1*
 Weimin Yao1*
 Yitian Yang1*
- 1The Second Affiliated Hospital of Guangdong Medical University, Zhanjiang, China
- 2State Key Laboratory of Respiratory Disease, National Clinical Research Center for Respiratory Disease, Guangzhou Institute of Respiratory Health, The First Affiliated Hospital of Guangzhou Medical University, Guangzhou, China
Objective: To compare the predictive value of the STOP-Bang questionnaire, the Epworth Sleepiness Scale (ESS), and the Berlin questionnaire, while evaluating the combined application of these tools in a three-step screening strategy for obstructive sleep apnea (OSA).
Methods: From September 1, 2016, to October 31, 2020, at the Sleep Medicine Center of the First Affiliated Hospital of Guangzhou Medical University, 2,208 suspected OSA patients completed the ESS, STOP-Bang, and Berlin questionnaires and underwent polysomnography (PSG). The sensitivity, specificity, positive predictive value (PPV), negative predictive value (NPV), and receiver operating characteristic (ROC) curves were calculated for each questionnaire, and the accuracy and predictive value of combining the STOP-Bang, ESS, and Berlin questionnaires for OSA screening were analyzed.
Results: Among the individual scales, the Berlin questionnaire had the highest area under the curve (AUC), demonstrating the best diagnostic performance and the highest PPV. The ESS had the smallest AUC and the highest specificity, but the lowest sensitivity and NPV. The STOP-Bang had the highest sensitivity and NPV but the lowest specificity and PPV. When the scales were combined, the AUCs of all combinations were less than 0.7, indicating that the diagnostic performance of the combined scales slightly decreased compared to the individual scales. However, among the combined scales, the AUC of the three-scale combination was higher than that of the two-scale combinations. After combining the questionnaires, specificity and PPV increased, but sensitivity and NPV decreased. Among the two-questionnaire combinations, the sensitivity and NPV of the ESS and STOP-Bang combination were higher than those of the ESS and Berlin questionnaire combination, while specificity and PPV were lower. The combination of all three questionnaires resulted in the highest specificity and PPV, but the lowest sensitivity and NPV.
Conclusion: As the number of scales increases, sensitivity and NPV decrease, while specificity and PPV increase. Therefore, we recommend a three-step strategy, combining a STOP-Bang score of 3, an ESS score of 9, and the Berlin questionnaire to improve the specificity and PPV in screening for OSA.
1 Introduction
Obstructive sleep apnea (OSA) is a common sleep disorder characterized by the complete or partial obstruction of the airway during sleep, leading to reduced oxygen levels and disrupted sleep (1). OSA is often caused by obesity and upper airway dysfunction, leading to repeated narrowing or collapse of the throat during sleep, which results in intermittent hypoxia and hypercapnia (2). Increasing evidence indicates that OSA is linked to the development and progression of diseases such as coronary artery disease, heart failure, and stroke (3). Additionally, it also increases the risk of Alzheimer’s disease (AD) (4), and diabetes (5). Reports indicate that globally, 936 million adults aged 30 to 69 years have OSA, with 425 million suffering from moderate to severe forms of the condition (6). Insufficient awareness of OSA among the public and healthcare professionals leads to delayed diagnosis, with studies showing that the vast majority (>80%) of moderate to severe OSA cases remain undiagnosed (7). Untreated OSA patients are at increased risk of cardiovascular diseases and impairments in neurocognitive function and mental health (3, 8–10), and OSA significantly reduces patients’ quality of life (11), potentially leading to premature death (12, 13). However, it is concerning that a large number of OSA cases remain undiagnosed (14, 15), and the prevalence of OSA increases with age (16, 17). Therefore, timely and effective diagnosis and treatment of OSA are crucial to mitigating its adverse health effects, improving quality of life, and reducing mortality.
The gold standard for diagnosing OSA is in-laboratory PSG. However, this method requires a sleep laboratory and skilled personnel to conduct overnight monitoring, making it expensive, technically complex, and time-consuming. Therefore, it is not suitable for widespread use, especially in hospitals in small to medium-sized cities where many patients require testing for suspected OSA (2). Consequently, several simple and efficient screening tools have been developed to identify the risk of OSA, including the NoSAS score (18, 19), STOP-Bang questionnaire (20), GOAL questionnaire (21), Berlin questionnaire (22), and ESS score (23). Previous studies have shown that combining the STOP-Bang questionnaire with the ESS score (24)or the NoSAS score with the ESS score (25) can improve the specificity of OSA diagnosis. However, to date, no studies have investigated the diagnostic performance of combining three commonly used sleep-related questionnaires. Given that the STOP-Bang and Berlin questionnaires emphasize objective clinical features (e.g., snoring, BMI, hypertension), while the ESS reflects subjective daytime sleepiness, we hypothesized that integrating these complementary tools may enhance overall screening efficiency and reduce missed diagnoses. Therefore, the primary objective of this study was to evaluate the predictive performance of combining the STOP-Bang, Berlin, and ESS questionnaires for OSA screening, and to determine whether a stepwise screening approach could provide better diagnostic value than individual questionnaires alone. Given that individual questionnaires often prioritize either objective clinical traits (e.g., STOP-Bang, Berlin) or subjective symptoms (e.g., ESS), this study aims to evaluate whether integrating these complementary tools into a stepwise strategy enhances OSA screening efficiency in high-risk populations, particularly under resource-limited conditions.
2 Materials and methods
2.1 Selection of study subjects
The study included 2,208 subjects from the Sleep Medicine Center at the First Affiliated Hospital of Guangzhou Medical University, with research conducted from September 1, 2016, to October 31, 2020. The study received ethical approval from the Ethics Committee of the First Affiliated Hospital of Guangzhou Medical University on December 5, 2017 (Ethics Number: 201705), and all subjects signed informed consent forms. Inclusion criteria (must meet all four of the following): (1) Age 18 years or older. (2) Total sleep time greater than 4 h. (3) Ability to act independently and have awareness. (4) Ability to complete the questionnaire. Exclusion criteria (any one of the following results in exclusion): (1) History of psychiatric or psychological disorders. (2) Epilepsy or brain tumors. (3) Long-term or current use of benzodiazepines, barbiturates, or other sedatives and hypnotics. (4) Severe organ failure preventing completion of the test. (5) Previous diagnosis of obstructive sleep apnea hypoventilation syndrome (OSA). (6) Failure to complete the questionnaire. (7) Total sleep time less than 4 h. (8) Patients with predominantly central or mixed apneas were excluded. (9) Daytime sleepiness primarily attributable to external factors such as shift work, fatigue, or irregular sleep schedules.
2.2 Study content and procedures
In this study, we collected basic information from 2,208 subjects, including: anthropometric data, demographic data, body measurement data, medical history, personal history, and sleep-related breathing activity. We first assessed the subjects using various scales, and then conducted PSG for further diagnostic clarification. All questionnaires were administered prior to polysomnography (PSG) through face-to-face interviews conducted by trained research staff. Patients were actively guided in completing the questionnaires to ensure accuracy and consistency. This approach helped minimize potential misunderstandings and ensured uniform interpretation of each item across participants. Only participants with a STOP-Bang score ≥3 were subsequently administered the Berlin questionnaire and the Epworth Sleepiness Scale (ESS), in line with our stepwise screening strategy. This design aimed to enhance efficiency and reduce unnecessary burden on low-risk individuals, but may limit the generalizability of Berlin and ESS performance to high-risk populations. Based on the PSG results, subjects were categorized into four groups: AHI <5 events/h (normal group); 5 ≤ AHI < 15 events/h (mild OSA group); 15 ≤ AHI < 30 events/h (moderate OSA group); AHI ≥30 events/h (severe OSA group).
2.3 Questionnaires
This study employed five validated screening questionnaires: the Epworth Sleepiness Scale (ESS), Berlin questionnaire, STOP, STOP-Bang, and NoSAS. The Epworth Sleepiness Scale (ESS) consists of 8 items assessing the subject’s likelihood of dozing off in common daily situations. Each item is scored from 0 to 3 (0 = would never doze, 1 = slight chance of dozing, 2 = moderate chance, 3 = high chance), yielding a total score ranging from 0 to 24. A score of 9 or higher indicates a potential risk of obstructive sleep apnea (OSA) (23, 26). The Berlin questionnaire comprises 11 items grouped into three categories: (1) snoring severity and witnessed apneas; (2) daytime sleepiness or fatigue; and (3) history of hypertension or a body mass index (BMI) ≥30 kg/m2. A positive score in two or more categories classifies the individual as high risk for OSA. The questionnaire was originally developed for screening OSA in general population settings (27, 28). The STOP questionnaire includes four yes/no items assessing: (1) snoring, (2) tiredness during daytime, (3) observed apnea, and (4) high blood pressure. Each “Yes” response scores 1 point, and a total score of ≥2 suggests a high risk for OSA (29, 30). The STOP-Bang questionnaire expands on the STOP tool by adding four additional demographic and anthropometric factors: B (BMI >35 kg/m2), A (age >50 years), N (neck circumference >40 cm), and G (male gender). Each of the eight items is scored as 1 for “Yes” and 0 for “No.” A total score of ≥3 is indicative of high OSA risk (20, 31). The NoSAS score comprises five components: 4 points for neck circumference >40 cm; 3 points for BMI 25–30 kg/m2, and 5 points for BMI ≥30 kg/m2; 2 points for snoring; 4 points for age >55 years; and 2 points for male gender. The maximum score is 17, and a total of ≥8 points suggests a high likelihood of OSA (32, 33).
2.4 PSG
All patients were monitored for at least 7 h using the Alice 5 system (Philips Respironics, United States). On the day of monitoring, patients were instructed to avoid caffeine, alcohol, sedatives, and sleeping pills. The monitoring parameters included EEG—electroencephalogram, EMG—electromyogram, oxygen saturation, EOG—electrooculogram, ECG—electrocardiogram, snoring, oral airflow, nasal airflow, thoracic breathing, and body position. The raw data collected by the machine were then manually analyzed by professional sleep specialists according to the guidelines in the “Manual for the Scoring of Sleep and Associated Events” published by the American Academy of Sleep Medicine (AASM) in 2012 to obtain parameters such as sleep architecture and respiratory events. According to the diagnostic guidelines for OSA, a patient can be diagnosed with OSA if they exhibit primarily obstructive respiratory events and have an AHI of 5 or more events per hour. Based on the AHI, patients were divided into four groups: AHI <5 events/h (normal group); 5 ≤ AHI < 15 events/h (mild OSA group); 15 ≤ AHI < 30 events/h (moderate OSA group); and AHI ≥30 events/h (severe OSA group).
2.5 Statistical analysis methods
All data analyses were performed using IBM SPSS Statistics version 29.0.1.0. For continuous data, we used one-way analysis of variance (ANOVA) and post-hoc multiple comparisons for descriptive statistics and between-group comparisons, with results presented as mean ± standard deviation. For categorical data, we used the chi-square test for descriptive statistics and between-group comparisons, with results presented as percentages and counts of categorical variables. To evaluate the diagnostic performance of the five questionnaires and their combinations, we plotted ROC curves and calculated the AUC. Based on the diagnostic results of the five questionnaires and PSG, confusion matrices were constructed, from which sensitivity, specificity, PPV, NPV, and diagnostic odds ratio (DOR) were calculated.
3 Results
3.1 Baseline data analysis
Descriptive statistics provided an overview of the 2,208 participants (Table 1). Their mean age was 47.68 ± 13.94 years; mean BMI was 26.43 ± 4.08 kg/m2; neck circumference (NC) was 38.36 ± 3.92 cm; waist circumference (WC) was 95.13 ± 11.36 cm; AHI was 24.54 ± 26.03 events/h; and minimum oxygen saturation was 78.19 ± 13.48%. The average scores for the five questionnaires (NoSAS, ESS, Berlin, STOP, STOP-Bang) were 8.61 ± 3.86, 7.9 ± 5.76, 1.52 ± 0.90, 1.89 ± 1.07, and 3.52 ± 1.49, respectively. Through intergroup comparisons, we found statistically significant differences among the four groups in terms of age, BMI, NC, WC, AHI, minimum oxygen saturation, and the scores of NoSAS, ESS, Berlin, STOP, and STOP-Bang. However, pairwise comparisons revealed no statistically significant differences in age between normal group and moderate OSA group, normal group and severe OSA group, and mild OSA group and moderate OSA group; no significant difference in BMI between mild OSA group and moderate OSA group; and no significant difference in ESS scores between mild OSA group and moderate OSA group.
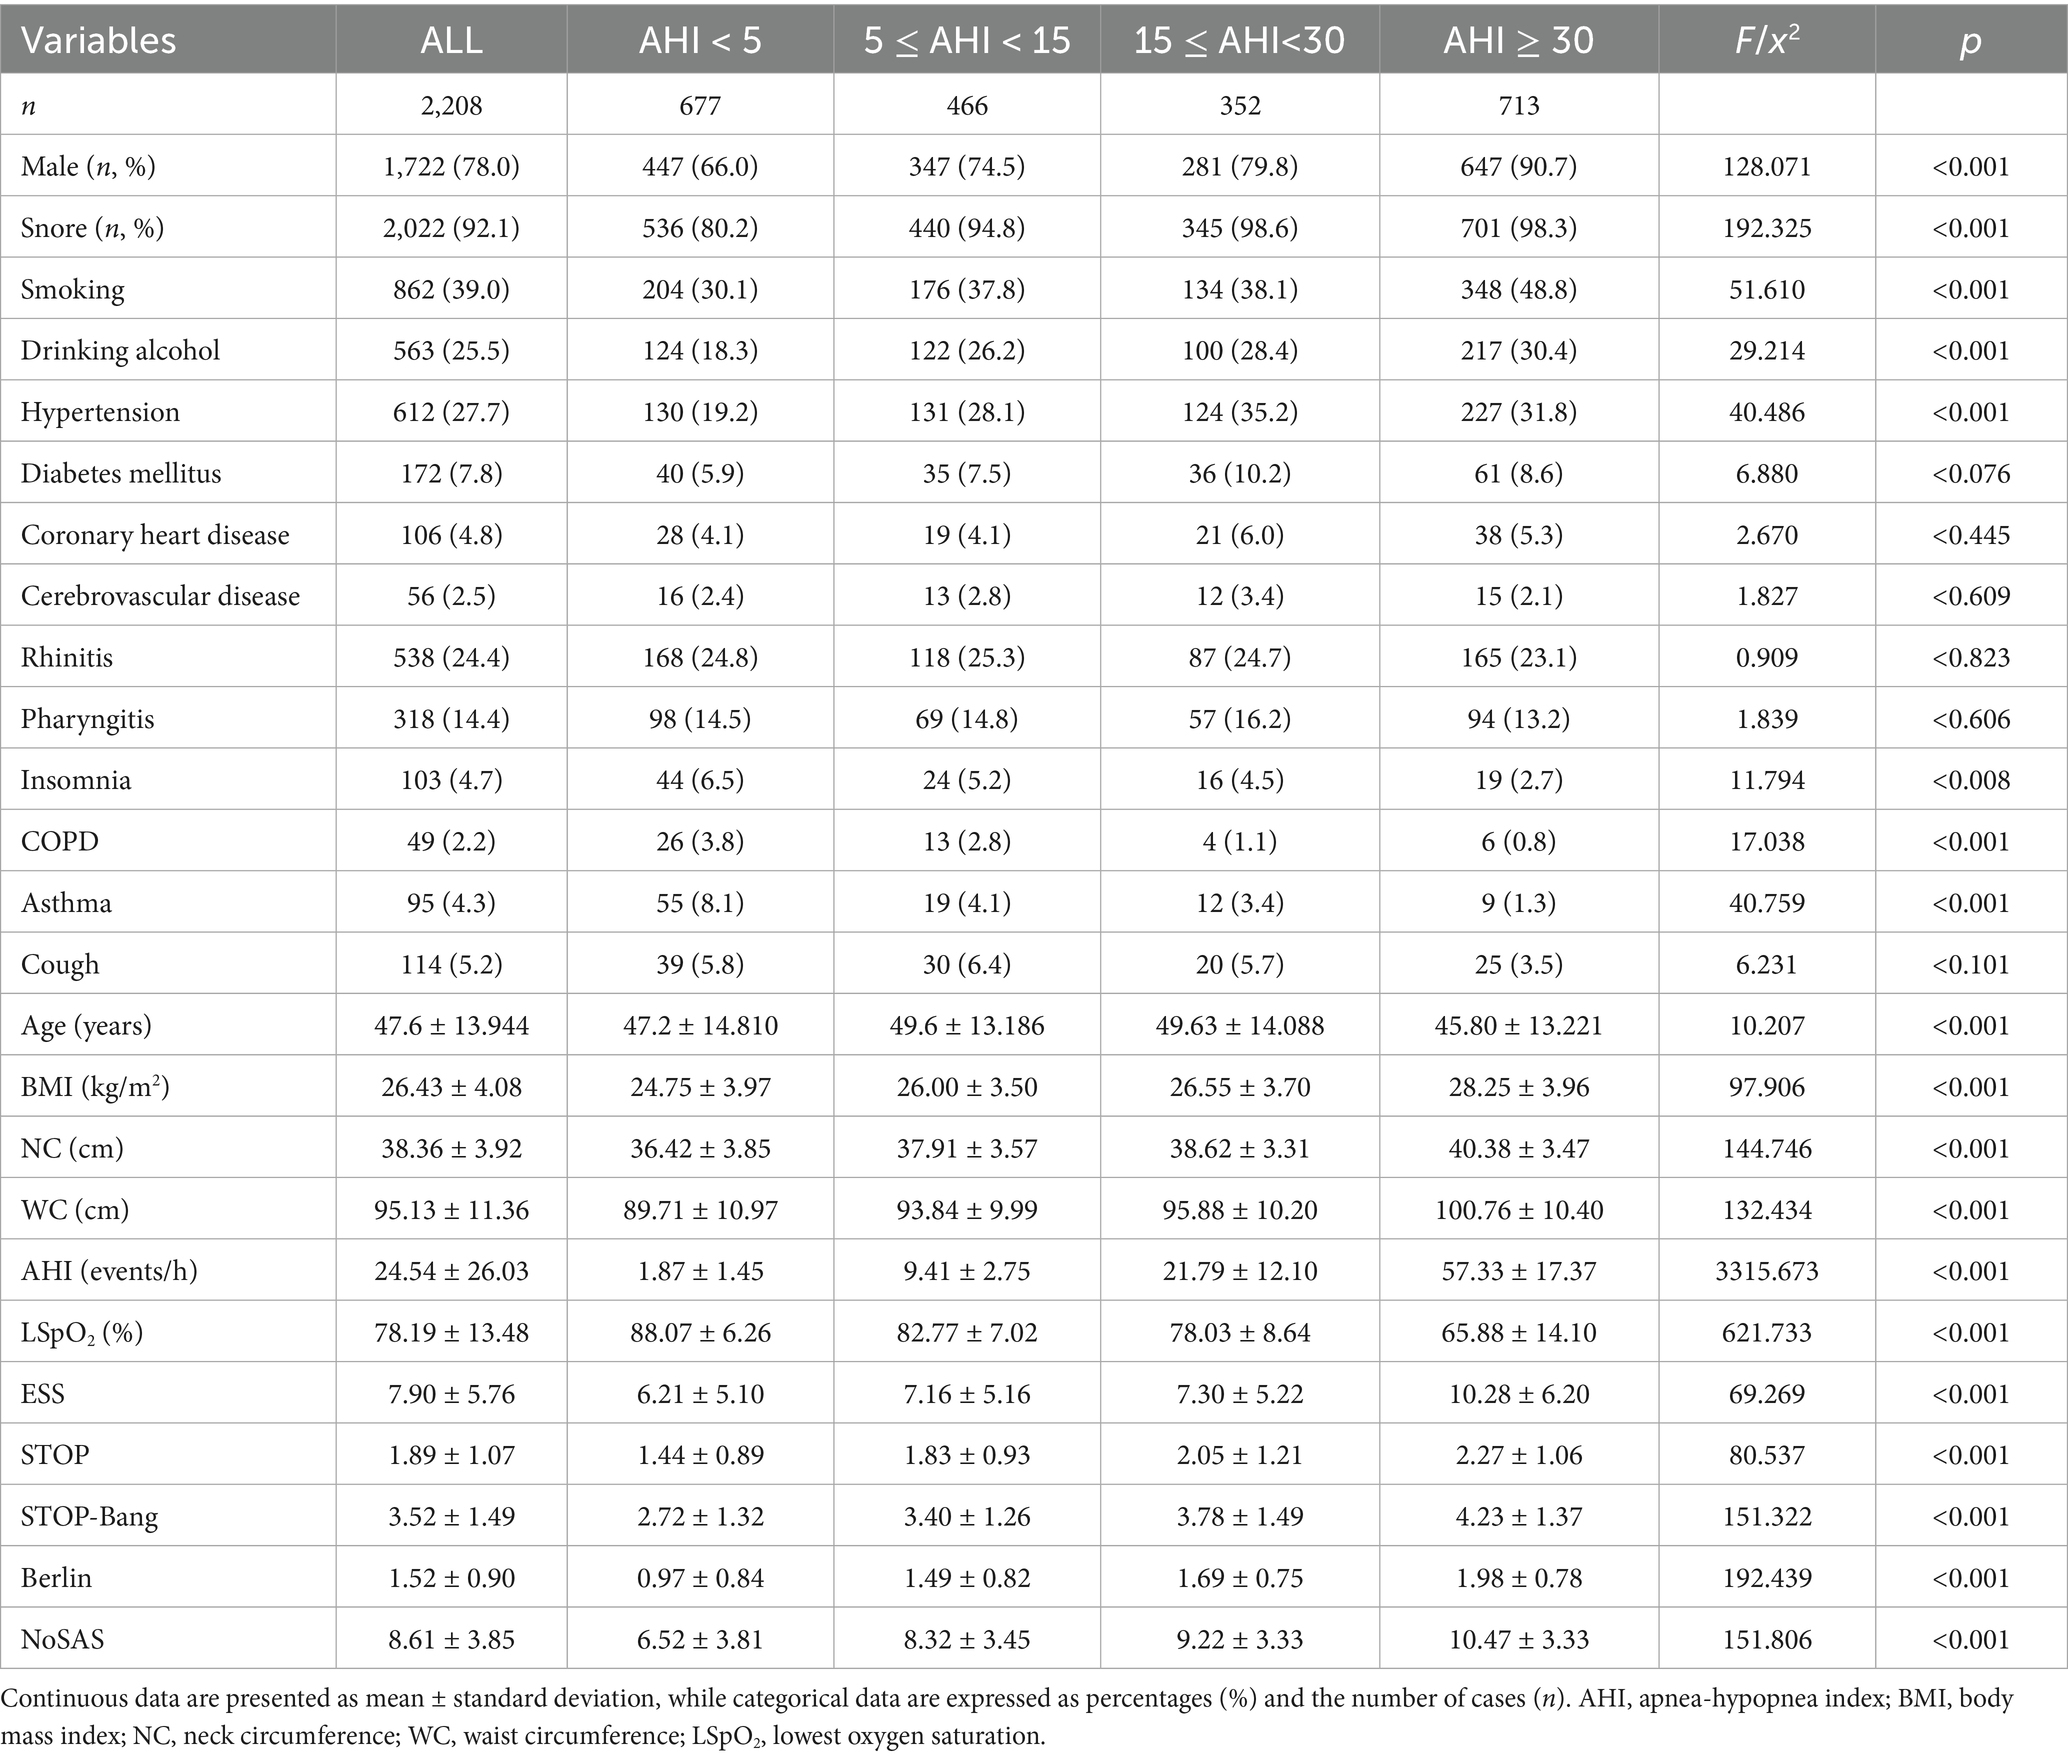
Table 1. Baseline characteristics.
3.2 Diagnostic performance analysis of individual scales
The AUC was determined by plotting the ROC curves (Table 2 and Figures 1A–D). When the apnea-hypopnea index (AHI) is ≥5, ≥15, and ≥30 respectively, the area under the curve (AUC) values of the NoSAS questionnaire are 0.718, 0.708, and 0.706; the AUC values of the Epworth Sleepiness Scale (ESS) are 0.625, 0.631, and 0.668 respectively; the AUC values of the Berlin questionnaire are 0.734, 0.705, and 0.701 respectively; the AUC values of the STOP questionnaire are 0.672, 0.658, and 0.653 respectively; and the AUC values of the STOP-Bang questionnaire are 0.717, 0.704, and 0.700, respectively. Among them, the AUC values of the NoSAS, Berlin, and STOP-Bang questionnaires are all greater than 0.7; the cut-off values of the ESS and STOP questionnaires are all greater than 0.6 and less than 0.7. The larger the cut-off value of the AHI, the smaller the AUC values of the NoSAS, Berlin, STOP, and STOP-Bang questionnaires. The AUC value of the ESS increases as the cut-off value of the AHI increases. When the AHI is ≥5, the AUC value of the Berlin questionnaire is the largest, which is 0.734; when the cut-off values of the AHI are ≥15 and 30, the AUC values of the NoSAS questionnaire are the largest, which are 0.708 and 0.706, respectively. Thus, the Berlin questionnaire demonstrated the best diagnostic performance when AHI was greater than or equal to the threshold of 5, while NoSAS performed best when AHI was greater than or equal to thresholds of 15 and 30.
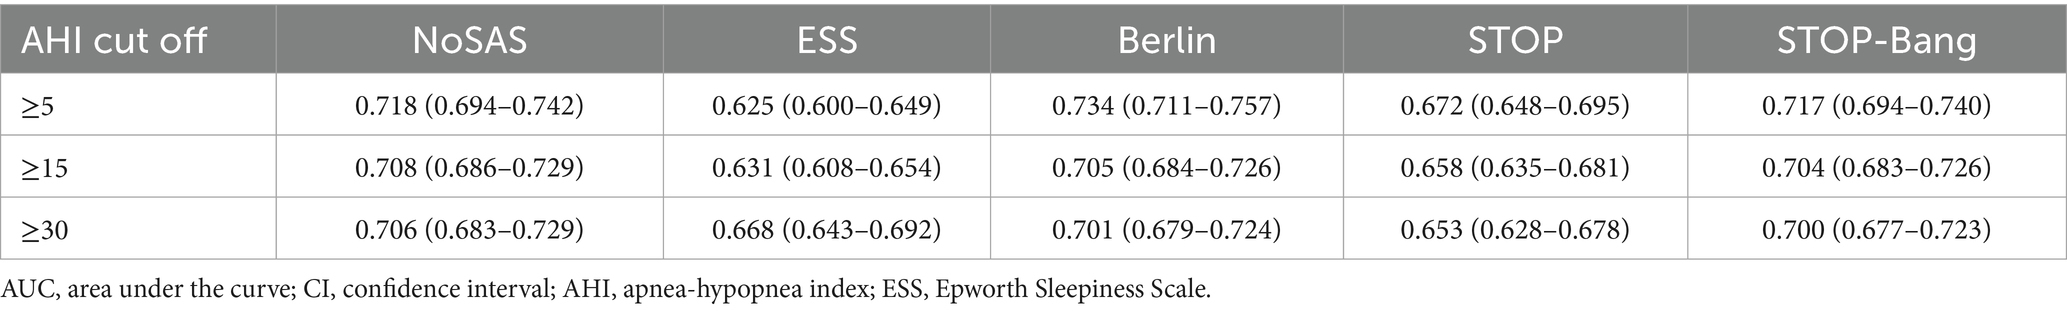
Table 2. Independent scale AUC (95% confidence interval).
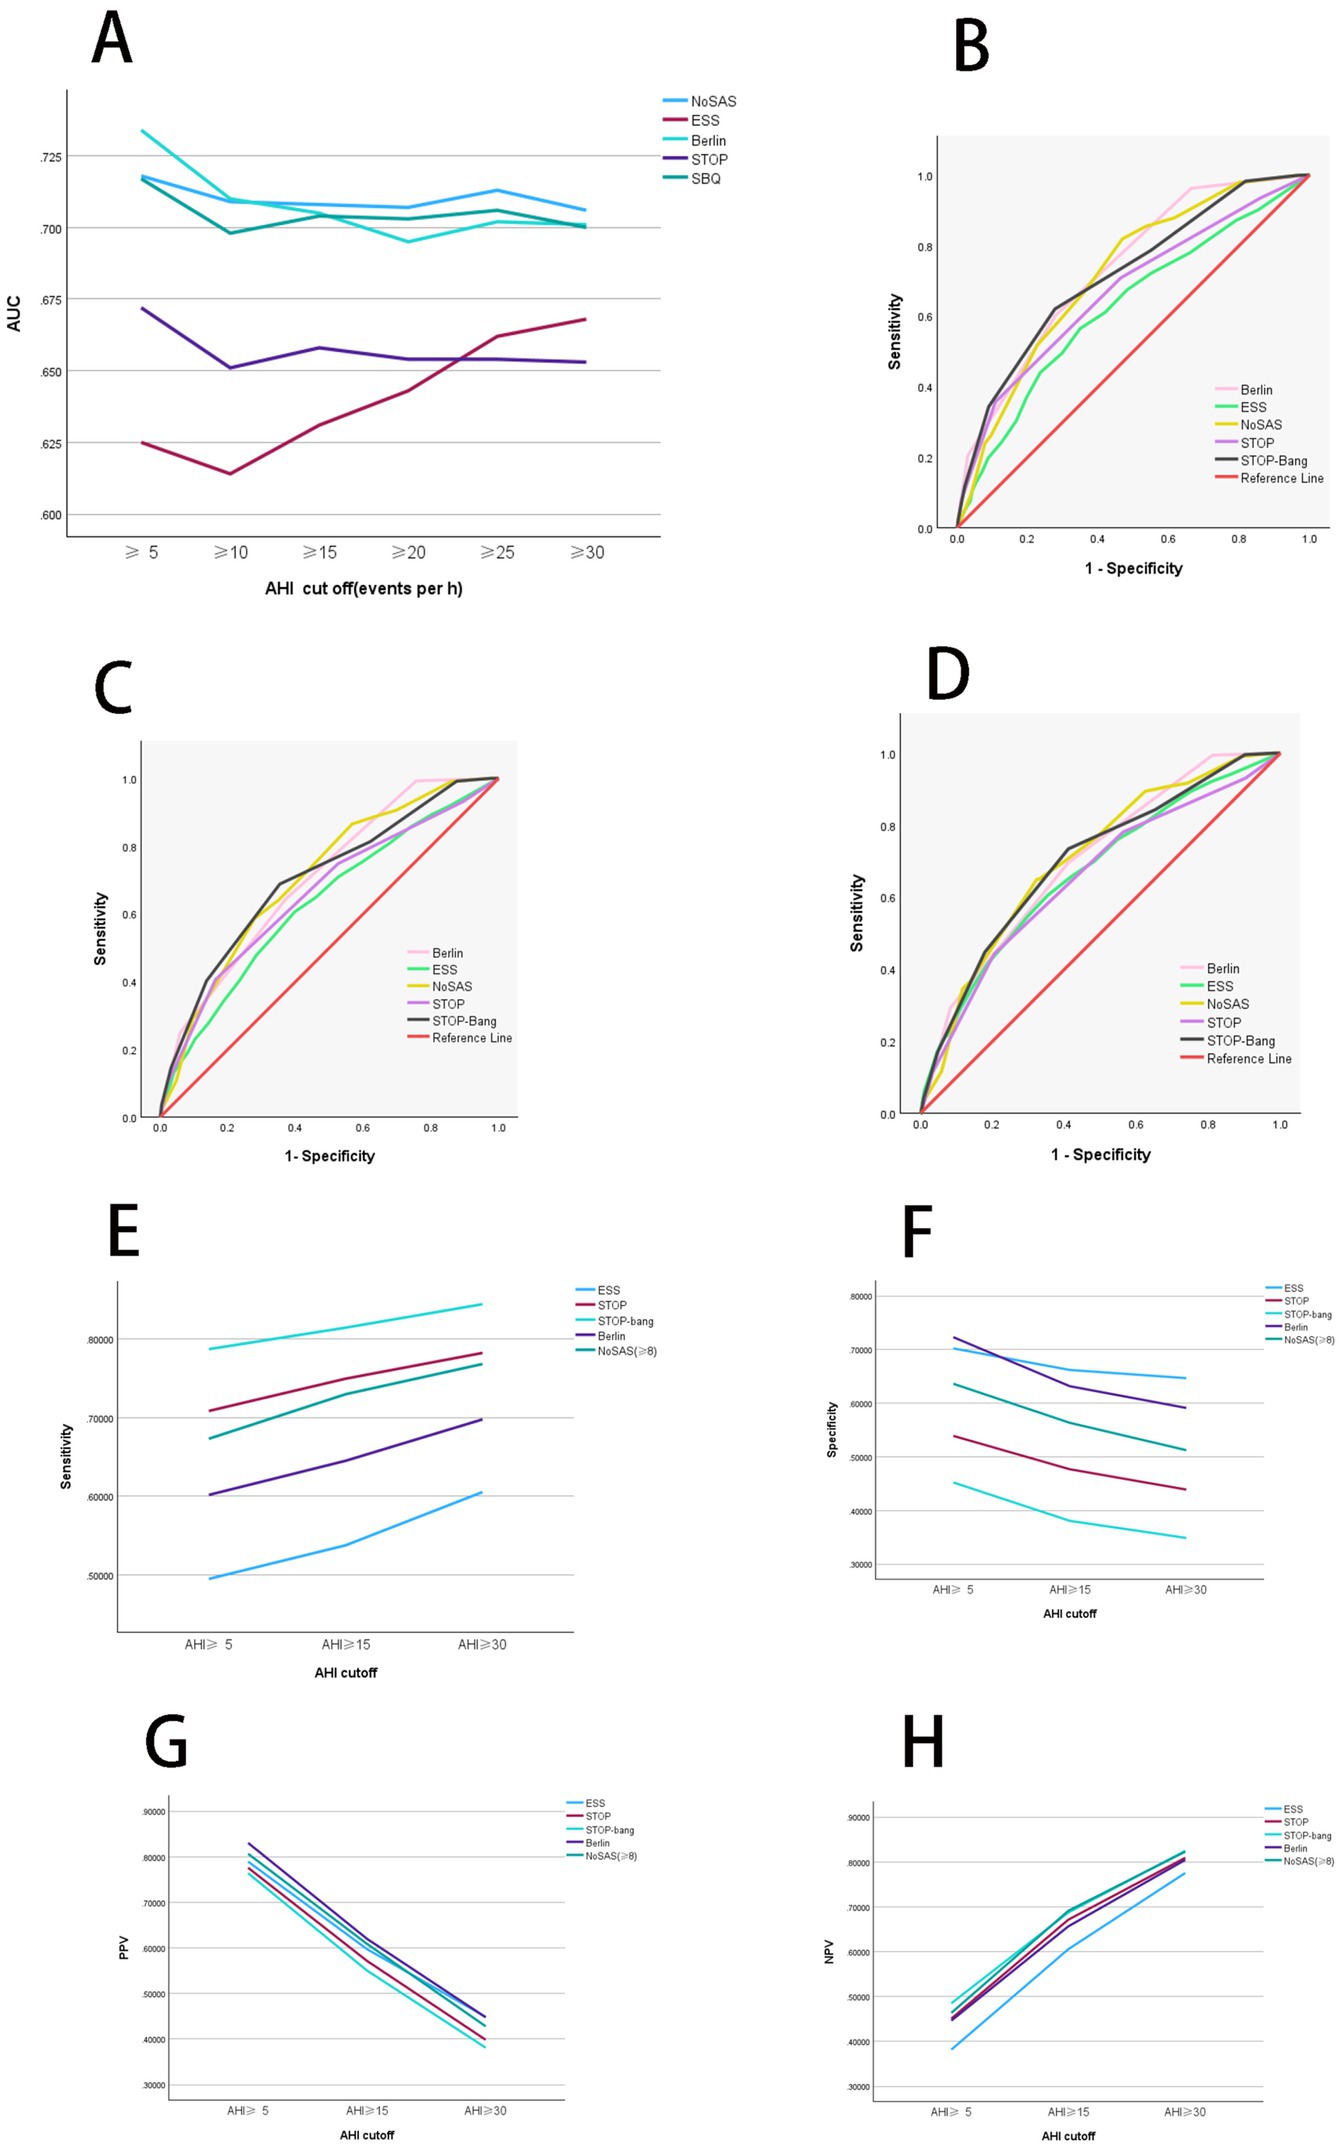
Figure 1. Diagnostic performance analysis of individual scales. (A) Comparison of diagnostic performance among independent scales. When AHI was greater than or equal to thresholds of 5 and 10, Berlin shows the highest AUC values. Conversely, AHI was greater than or equal to thresholds of 15, 20, 25, and 30, NoSAS demonstrates the highest AUC values. Thus, Berlin exhibits the best diagnostic performance when AHI was greater than or equal to thresholds of 5 and 10, whereas NoSAS performs best AHI was greater than or equal to thresholds of 15, 20, 25, and 30. (B) ROC curves of independent scales at an AHI threshold of 5. When AHI was greater than the threshold of 5, Berlin exhibits superior diagnostic performance compared to other scales. (C) ROC curves of independent scales at an AHI threshold of 15. When AHI was greater than the threshold of 15, NoSAS exhibits superior diagnostic performance compared to other scales. (D) ROC curves of independent scales at an AHI threshold of 30. When AHI was greater than the threshold of 30, NoSAS exhibits superior diagnostic performance compared to other scales. (E) Comparison of sensitivity of independent scales. When AHI was greater than or equal to thresholds of 5, 15, and 30, the sensitivity in descending order is STOP-Bang, Berlin, and ESS. Additionally, as the AHI increases, the sensitivity of the scales also increases. (F) Comparison of specificity of independent scales. When AHI was greater than or equal to thresholds of 5, 15, and 30, the specificity in descending order is ESS, Berlin, and STOP-Bang. Additionally, as the AHI increases, the specificity of the scales decreases. (G) Comparison of PPV of independent scales. When AHI was greater than or equal to thresholds of 5, 15, and 30, the PPV in descending order is Berlin, ESS, and STOP-Bang. Additionally, as the AHI increases, the PPV of the scales decreases. (H) Comparison of NPV of independent scales. When AHI was greater than or equal to thresholds of 5, 15, and 30, the NPV in descending order is STOP-Bang, Berlin, and ESS. Additionally, as the AHI increases, the NPV of the scales increases. AHI, apnea-hypopnea index; PPV, positive predictive value; NPV, negative predictive value; SBQ, STOP-Bang questionnaire; ESS, Epworth Sleepiness Scale; ROC, receiver operating characteristic curve; AUC, area under the curve.
After organizing the confusion matrix and calculating, the sensitivity, specificity, PPV, and NPV are obtained (Table 3). When AHI was greater than or equal to thresholds of 5, 15, and 30, the sensitivity of ESS is 0.495, 0.538, and 0.605, respectively; for Berlin, the sensitivity is 0.602, 0.645, and 0.698; for STOP-Bang, the sensitivity is 0.787, 0.814, and 0.844. Sensitivity decreases in the following order: STOP-Bang, Berlin, ESS. Additionally, sensitivity increases with higher AHI values (Figure 1E).
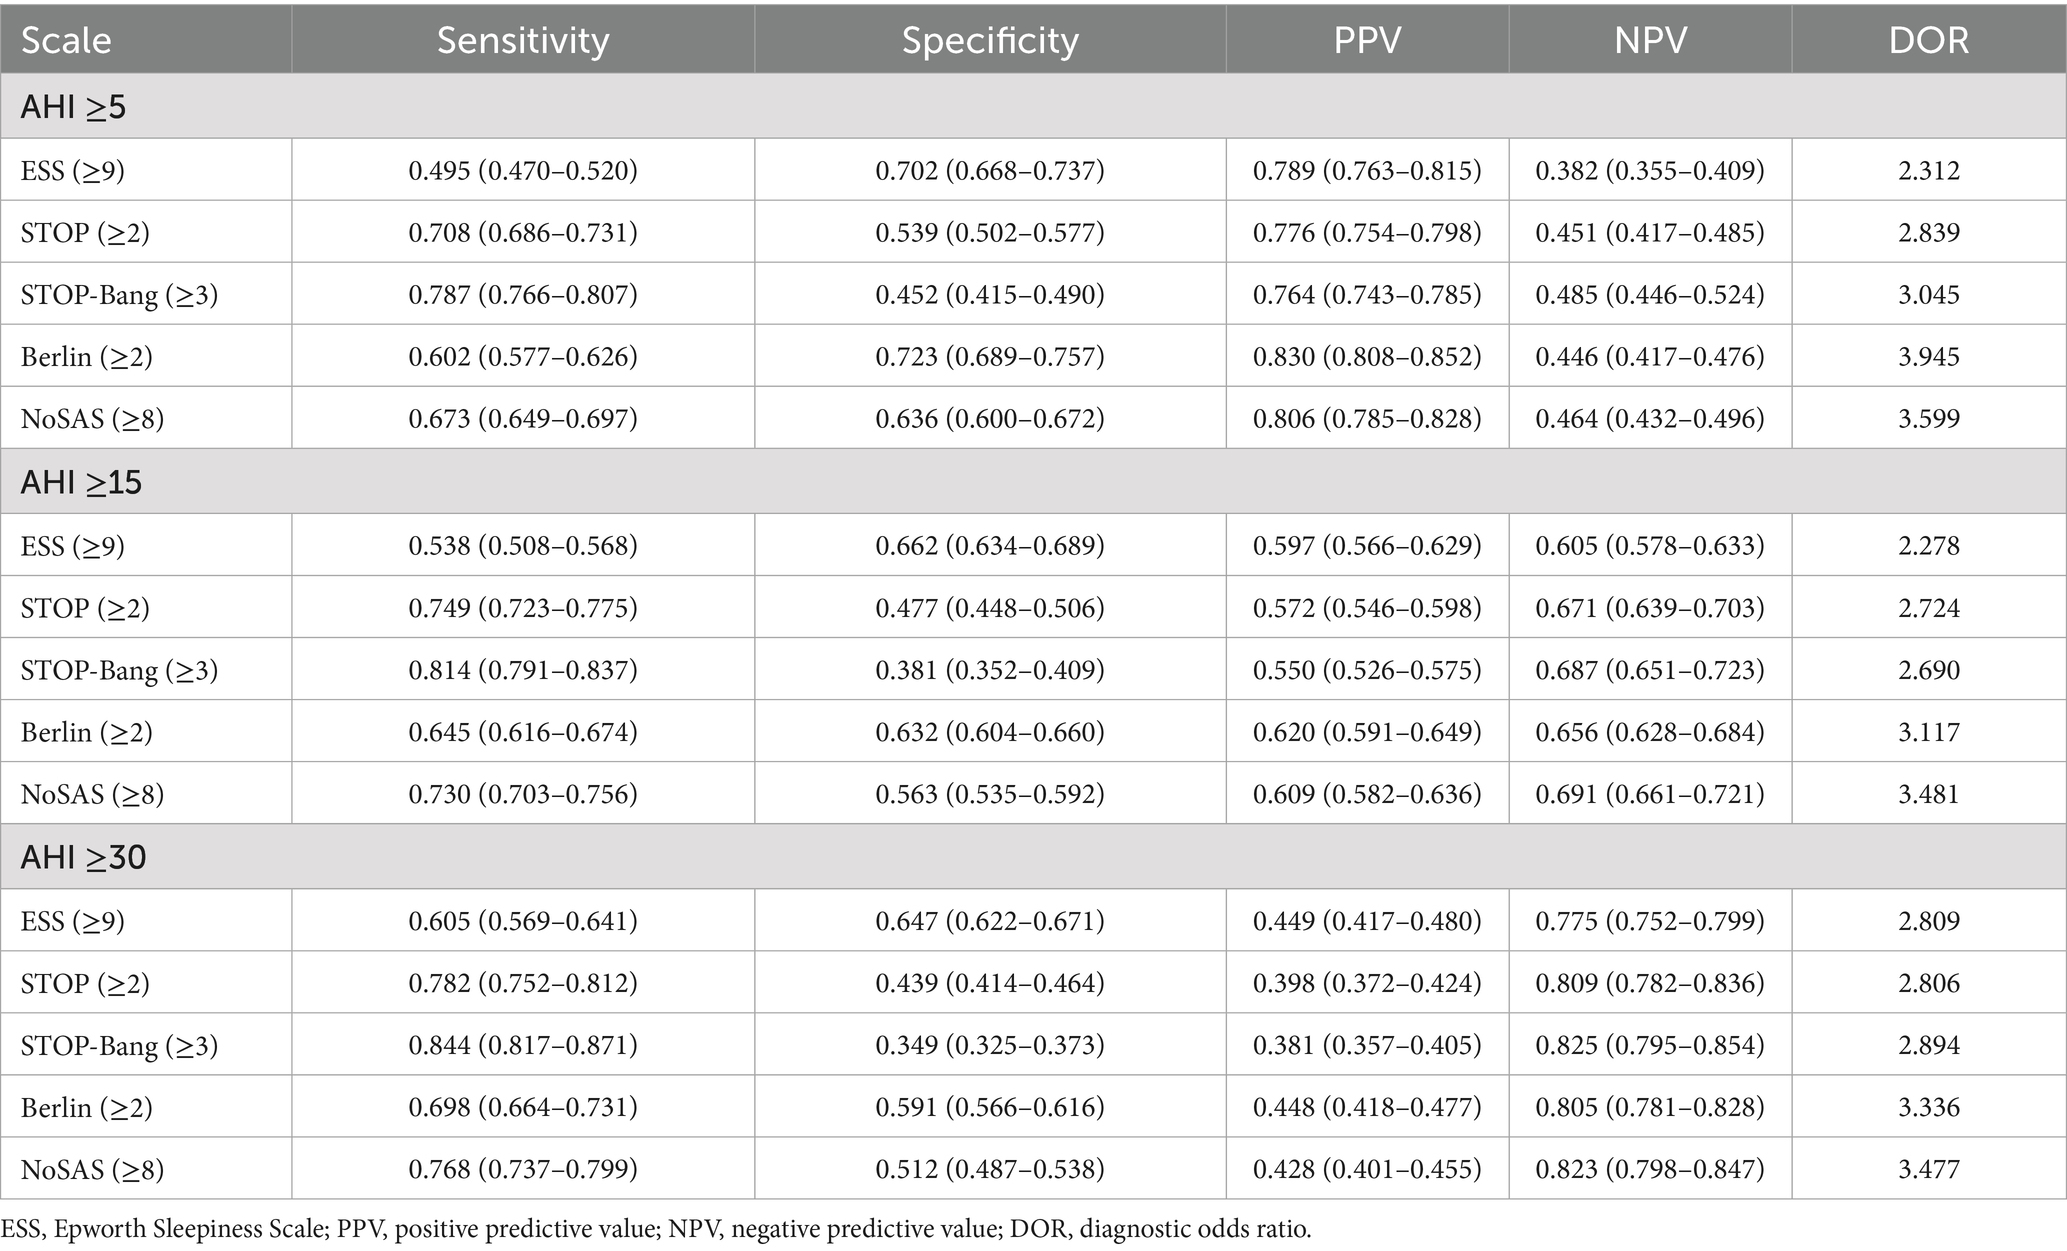
Table 3. Predictive parameters of independent scales.
When AHI was greater than or equal to thresholds of 5, 15, and 30, the specificity of ESS is 0.702, 0.662, and 0.647, respectively; Berlins specificity is 0.723, 0.632, and 0.591; STOP-Bangs specificity is 0.452, 0.381, and 0.349. Thus, the specificity is highest for ESS, followed by Berlin, and lowest for STOP-Bang. Additionally, specificity decreases with increasing AHI values (Figure 1F).
When AHI was greater than or equal to thresholds of 5, 15, and 30, the PPV of ESS is 0.789, 0.597, and 0.449, respectively; Berlins PPV is 0.830, 0.620, and 0.448; STOP-Bangs PPV is 0.764, 0.550, and 0.381. Therefore, the PPV is highest for Berlin, followed by ESS, and lowest for STOP-Bang. Additionally, PPV decreases with increasing AHI values (Figure 1G).
When AHI was greater than or equal to thresholds of 5, 15, and 30, the NPV of ESS is 0.382, 0.605, and 0.775, respectively; Berlins NPV is 0.446, 0.656, and 0.805; STOP-Bangs NPV is 0.485, 0.687, and 0.825. Thus, the NPV is highest for STOP-Bang, followed by Berlin, and lowest for ESS. Additionally, NPV increases with higher AHI values (Figure 1H).
Overall, ESS exhibits the lowest sensitivity and NPV but the highest specificity. Berlin shows the highest PPV. STOP-Bang demonstrates the highest sensitivity and NPV, but the lowest specificity and PPV.
3.3 Diagnostic performance of combined scales
The ROC curves were used to determine the AUC values for the combinations of three scales (ESS, STOP-Bang, and Berlin). The results are illustrated in Figures 2A–D, and summarized in Table 4. The AUC values for all combined scales were found to be greater than 0.6 but less than 0.7.
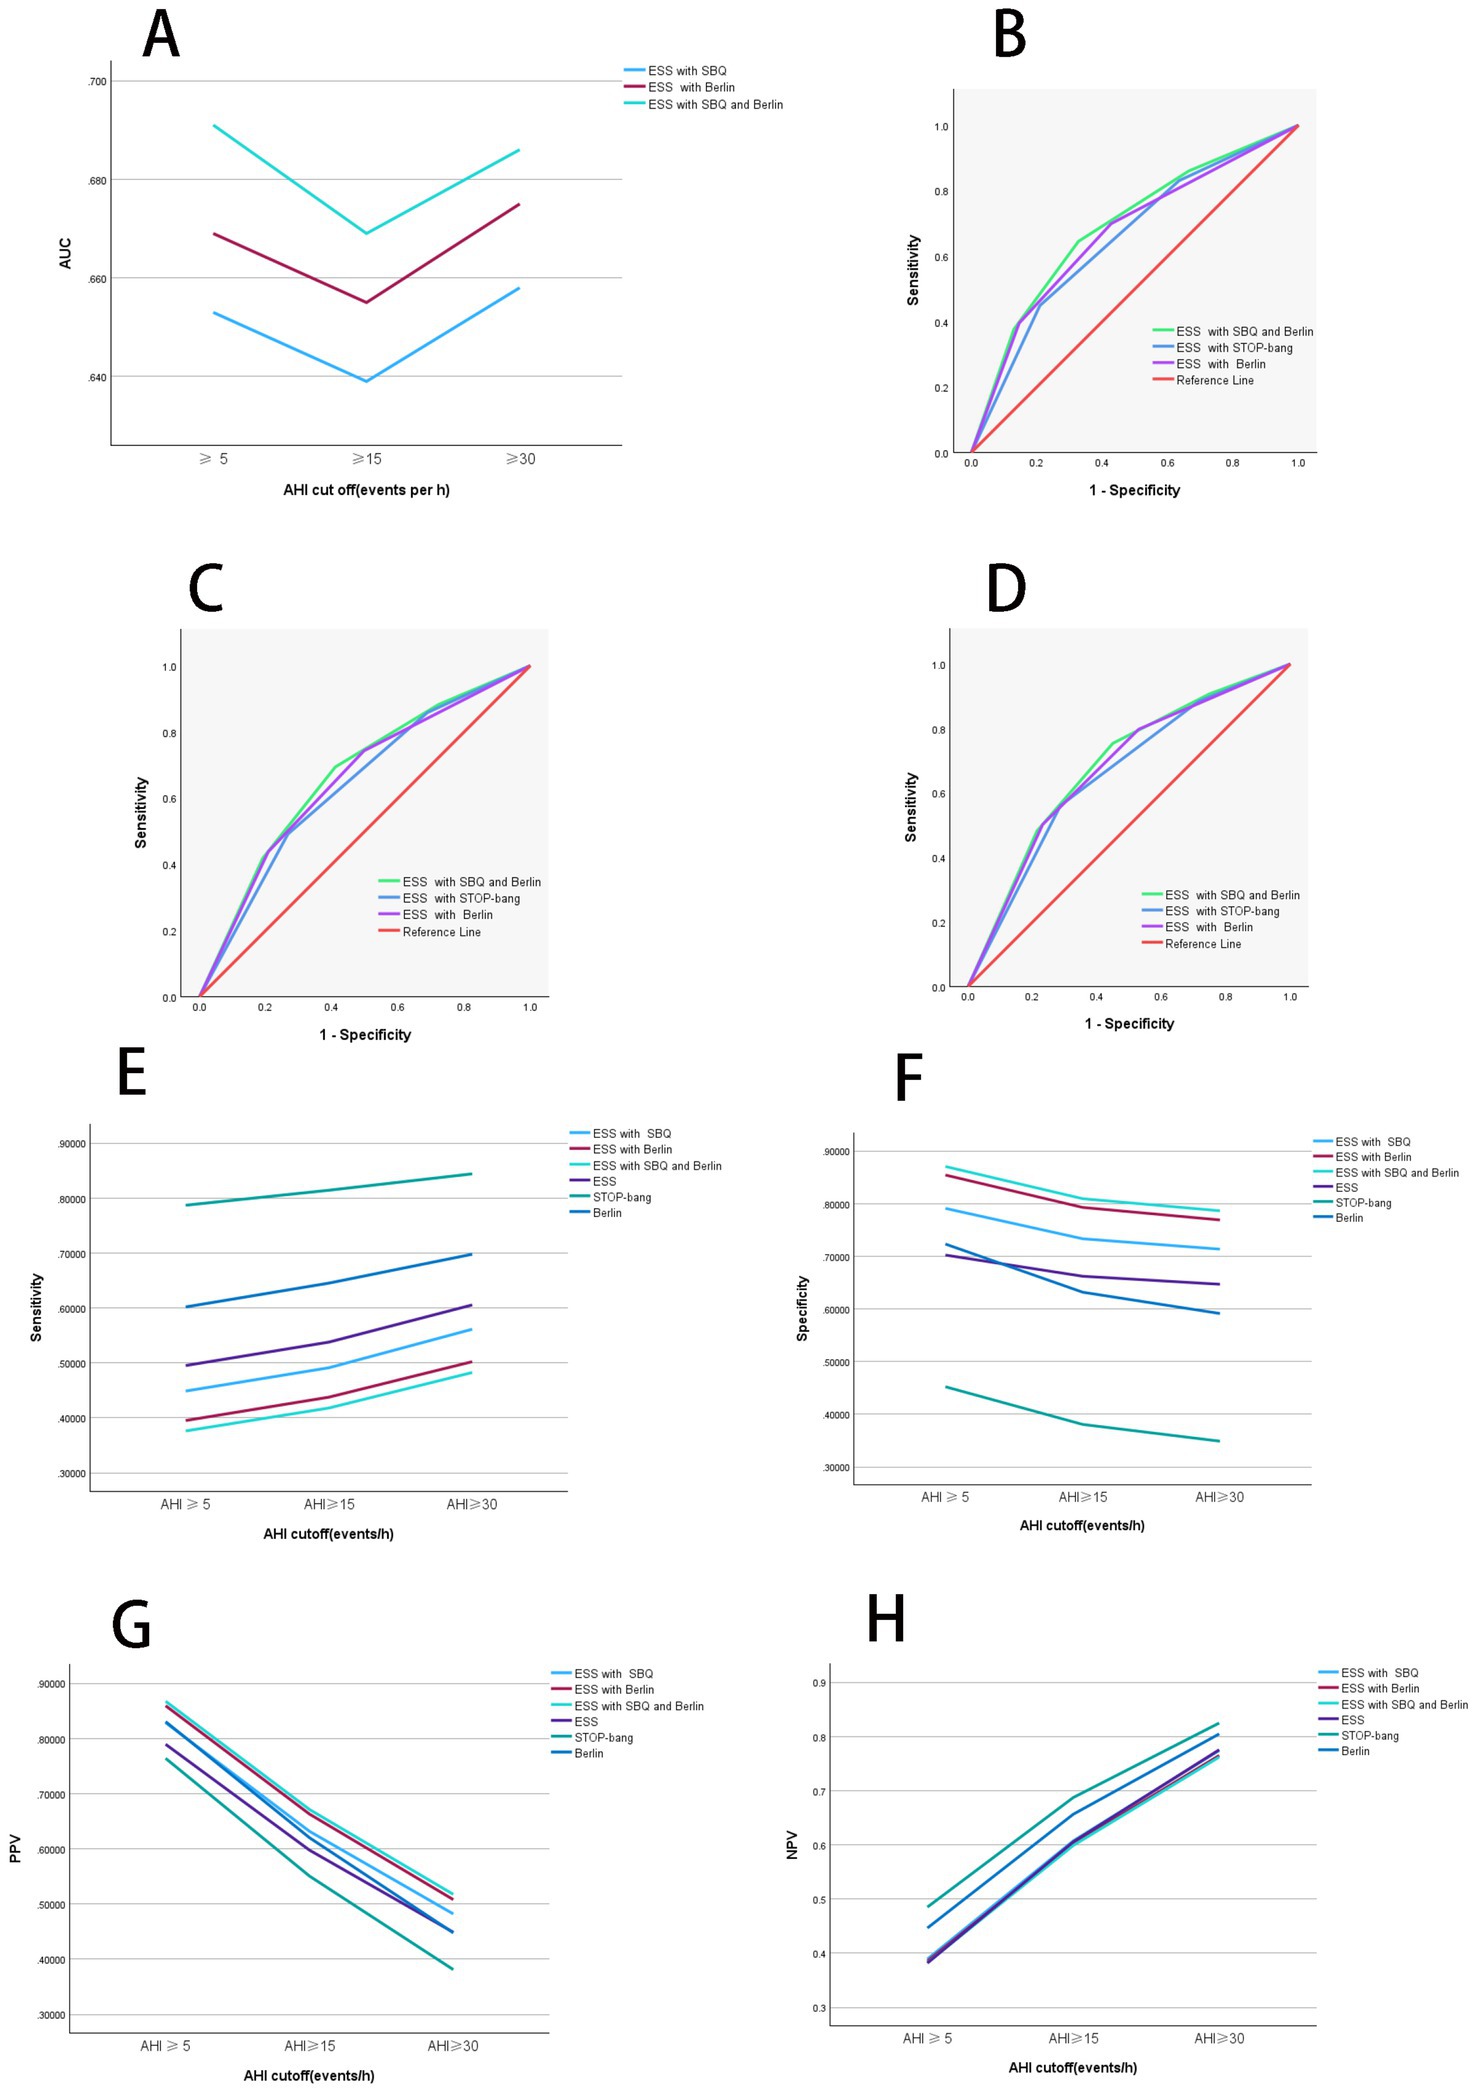
Figure 2. Diagnostic performance of combined scales. (A) Diagnostic performance comparison of combined scales. When AHI was greater than or equal to thresholds of 5, 15, and 30, the AUC values rank from highest to lowest as follows: ESS combined with STOP-Bang questionnaire (SBQ), ESS combined with Berlin, and ESS combined with both STOP-Bang and Berlin. At an AHI threshold of 15, the AUC values for all combined scales are lower compared to those at other AHI thresholds. (B) ROC curves of combined scales with AHI at 5. When AHI was greater than or equal to the threshold of 5, the combined scales of ESS with Berlin and STOP-Bang show the highest AUC values, indicating the best diagnostic performance. (C) ROC curves of combined scales with AHI at 15. When AHI was greater than or equal to the threshold of 15, the combined scales of ESS with Berlin and STOP-Bang exhibit the highest AUC values, indicating the best diagnostic performance. (D) ROC curves of combined scales with AHI at 30. When AHI was greater than or equal to the threshold of 30, the combined scales of ESS with Berlin and STOP-Bang exhibit the highest AUC values, indicating the best diagnostic performance. (E) Comparison of sensitivity for combined scales. When AHI was greater than or equal to thresholds of 5, 15, and 30, the sensitivity from highest to lowest is ESS, ESS combined with Berlin, and ESS combined with Berlin and STOP-Bang. Sensitivity increases with higher AHI values. (F) Comparison of specificity for combined scales. When AHI was greater than or equal to thresholds of 5, 15, and 30, the specificity from highest to lowest is ESS combined with STOP-Bang and Berlin, ESS combined with Berlin, and ESS. Specificity decreases as the AHI increases. (G) Comparison of positive predictive value for combined scales. When AHI was greater than or equal to thresholds of 5, 15, and 30, the PPV from highest to lowest is ESS combined with Berlin and STOP-Bang, ESS combined with Berlin, and ESS. PPV decreases with increasing AHI values. (H) Comparison of negative predictive value for combined scales. When AHI was greater than or equal to thresholds of 5, 15, and 30, the NPV from highest to lowest is ESS, ESS combined with Berlin, and ESS combined with Berlin and STOP-Bang. NPV increases with increasing AHI values. AHI, apnea-hypopnea index; ESS, Epworth Sleepiness Scale; SBQ, STOP-Bang questionnaire; PPV, positive predictive value; NPV, negative predictive value; ROC, receiver operating characteristic curve; AUC, area under the curve. Summary: In the two-scale combinations, ESS combined with STOP-Bang demonstrates higher sensitivity and NPV compared to ESS combined with Berlin, while showing lower specificity and PPV. When combining all three scales, both specificity and PPV improve, but sensitivity and NPV decrease.
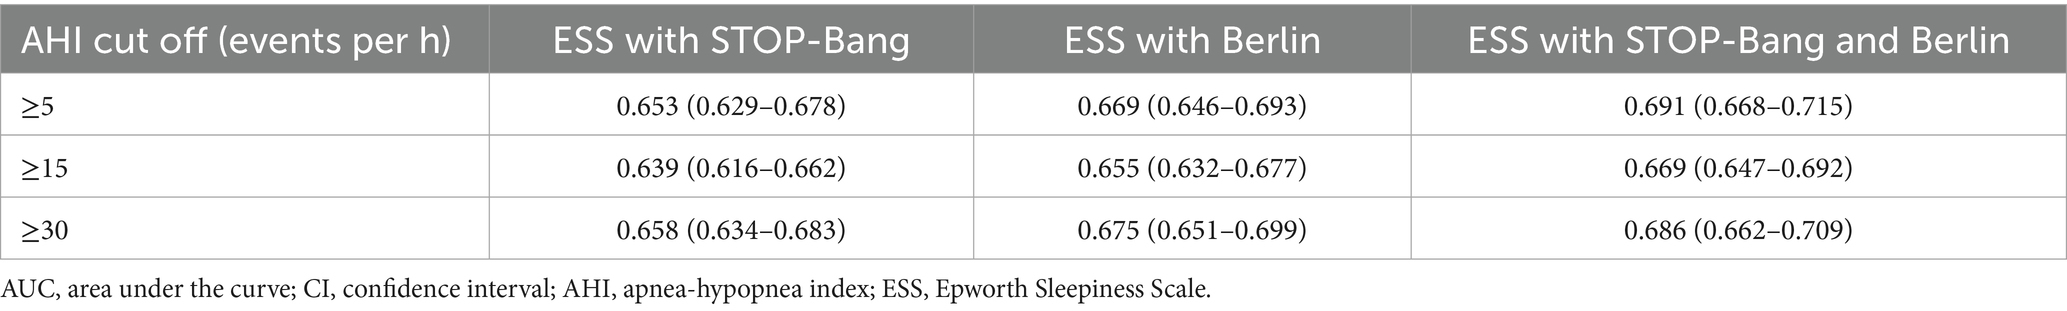
Table 4. Combined scales AUC (95% confidence interval).
When AHI was greater than or equal to thresholds of 5, 15, and 30, the AUC values for the ESS combined with STOP-Bang were 0.653, 0.639, and 0.658, respectively. The AUC values for the ESS combined with Berlin were 0.669, 0.655, and 0.675 for the same thresholds. The AUC values for the combination of ESS, STOP-Bang, and Berlin were 0.691, 0.669, and 0.686, respectively. The AUC values were ranked from smallest to largest as follows: ESS combined with STOP-Bang, ESS combined with Berlin, and the combination of ESS, STOP-Bang, and Berlin. Notably, the AUC values were lowest When AHI was greater than or equal to threshold of 15.
The sensitivity, specificity, PPV, and NPV of the combined scales were calculated from the confusion matrix (Table 5).
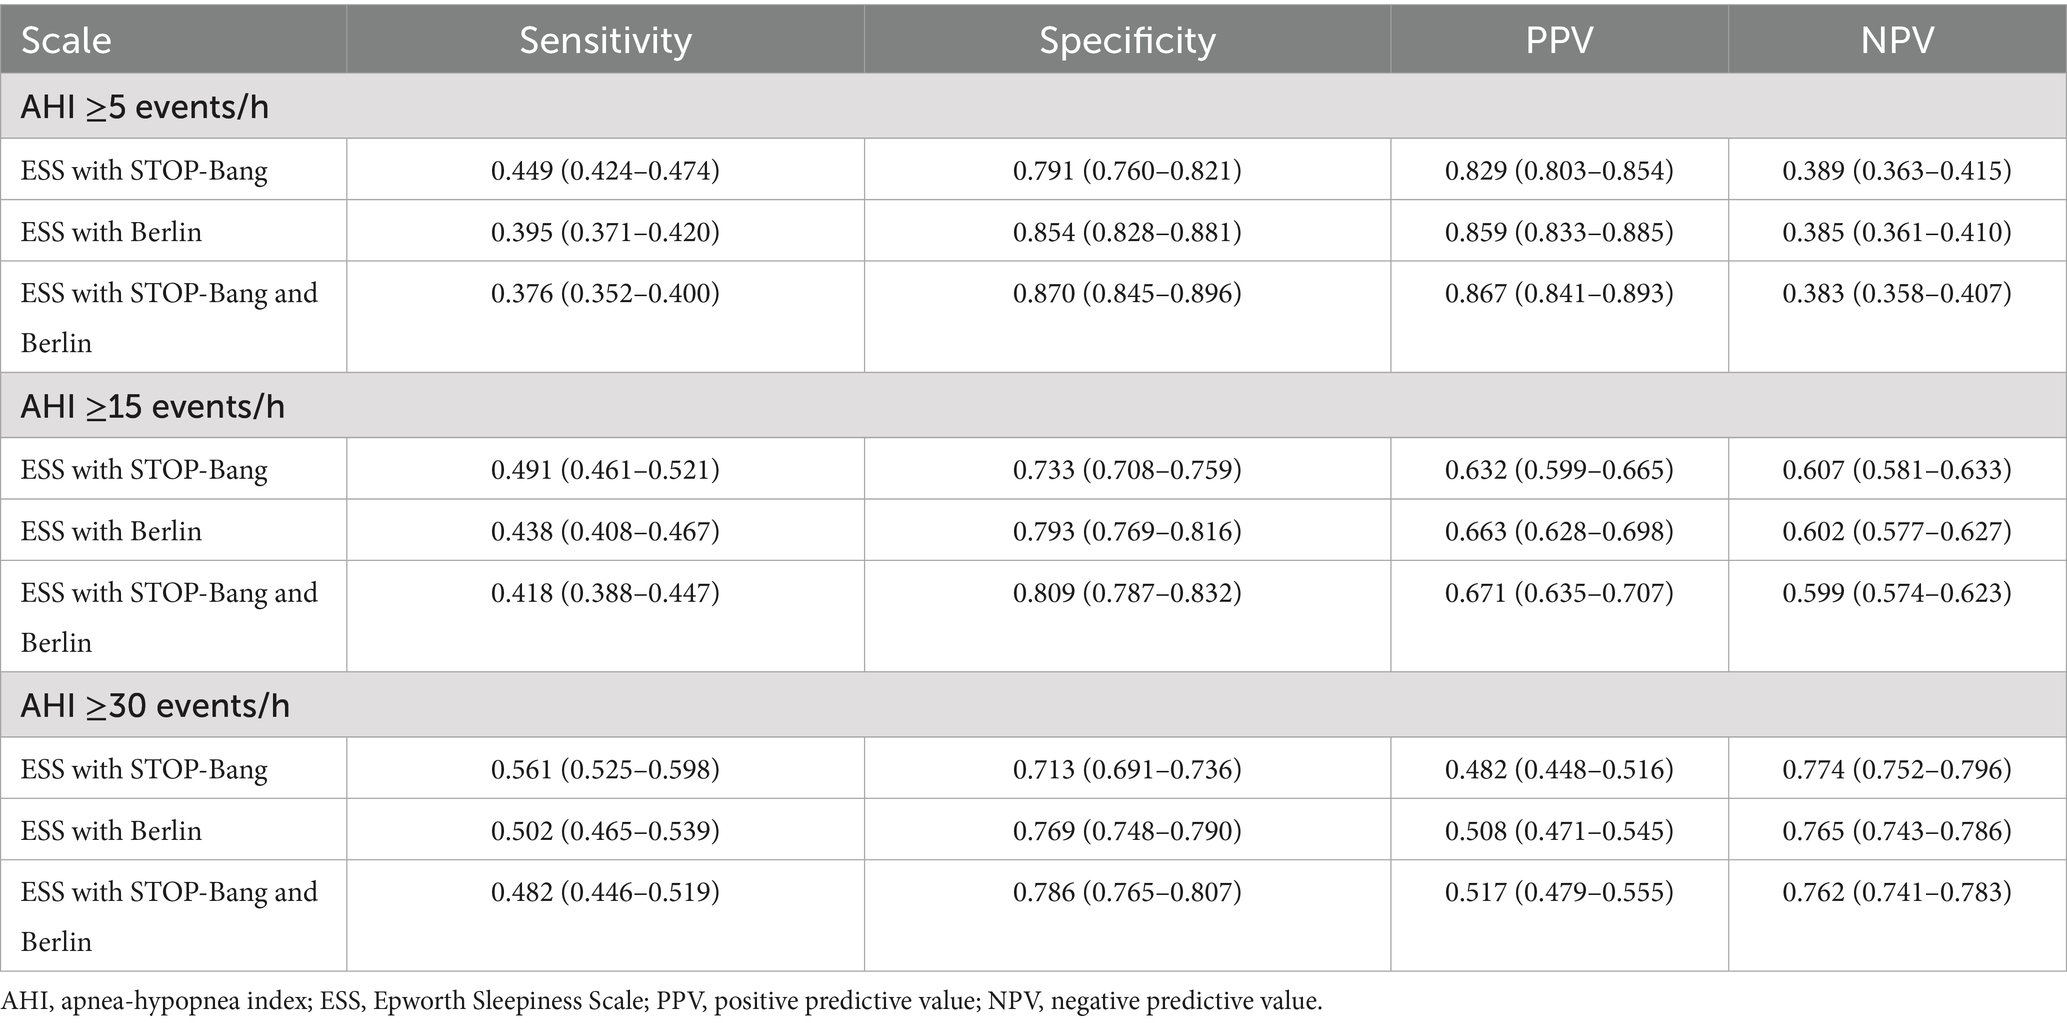
Table 5. Predictive value of diagnostic performance for combined scales.
When AHI was greater than or equal to thresholds of 5, 15, and 30, the sensitivities of the combined scales are as follows: ESS combined with STOP-Bang showed sensitivities of 0.449, 0.491, and 0.561, respectively; ESS combined with Berlin showed sensitivities of 0.395, 0.438, and 0.502, respectively; and ESS combined with both STOP-Bang and Berlin showed sensitivities of 0.376, 0.418, and 0.482, respectively. The sensitivity ranks from highest to lowest are as follows: ESS combined with STOP-Bang, ESS combined with Berlin, and ESS combined with STOP-Bang and Berlin. It is evident that the sensitivity of the independent scales is higher than that of the two-combination scales, and the sensitivity of the two-combination scales is higher than that of the three-combination scale. Additionally, the sensitivity increases as the AHI threshold increases (Figure 2E).
When AHI was greater than or equal to thresholds of 5, 15, and 30, the specificities of the combined scales are as follows: ESS combined with STOP-Bang showed specificities of 0.791, 0.733, and 0.713, respectively; ESS combined with Berlin showed specificities of 0.854, 0.793, and 0.769, respectively; and ESS combined with both STOP-Bang and Berlin showed specificities of 0.870, 0.809, and 0.786, respectively. The specificity ranks from highest to lowest are as follows: ESS combined with both STOP-Bang and Berlin, ESS combined with Berlin, and ESS combined with STOP-Bang. The three-combination scale shows higher specificity than the two-combination scales, and the two-combination scales show higher specificity than the independent scales (Figure 2F).
When AHI was greater than or equal to thresholds of 5, 15, and 30, the positive predictive values (PPVs) for the combination of ESS and STOP-Bang are 0.829, 0.632, and 0.482, respectively; for ESS combined with Berlin, they are 0.859, 0.663, and 0.508; and for the combination of ESS, STOP-Bang, and Berlin, they are 0.867, 0.671, and 0.517. The PPVs, ranked from highest to lowest, are as follows: ESS combined with STOP-Bang and Berlin, ESS combined with Berlin, and ESS combined with STOP-Bang. The PPV for the triple combination is higher than that for the dual combinations, and the PPV for the dual combinations is higher than that for the individual scales. Additionally, the PPV decreases as the AHI increases (Figure 2G).
When AHI was greater than or equal to thresholds of 5, 15, and 30, the negative predictive values (NPVs) for the combination of ESS and STOP-Bang are 0.389, 0.607, and 0.774, respectively; for ESS combined with Berlin, they are 0.385, 0.602, and 0.765; and for the combination of ESS, STOP-Bang, and Berlin, they are 0.383, 0.599, and 0.762. The NPVs, ranked from highest to lowest, are as follows: ESS combined with STOP-Bang, ESS combined with Berlin, and ESS combined with STOP-Bang and Berlin. The NPV for the individual scales is higher than that for the dual combinations, and the NPV for the dual combinations is higher than that for the triple combination. Additionally, the NPV increases as the AHI increases (Figure 2H).
3.4 “Three-step strategy” for screening OSA patients
Initially, all 2,208 patients completed the STOP-Bang questionnaire. Among them, 1,575 patients had a score of ≥3. Of these, 76% had an AHI ≥5, 55% had an AHI ≥15, and 38% had an AHI ≥30. Conversely, 633 patients scored <3; among them, 52% had an AHI ≥5, 31% had an AHI ≥15, and 18% had an AHI ≥30.
Subsequently, patients with a STOP-Bang score ≥3 were asked to complete the ESS questionnaire. Out of these, 836 patients had a score ≥9. Among this group, 83% had an AHI ≥5, 63% had an AHI ≥15, and 48% had an AHI ≥30. The remaining 739 patients scored <9; of these, 61% had an AHI ≥5, 39% had an AHI ≥15, and 23% had an AHI ≥30.
Finally, the 836 patients with both STOP-Bang scores ≥3 and ESS scores ≥9 completed the Berlin questionnaire. Among these, 662 patients scored ≥2. In this group, 87% had an AHI ≥5, 67% had an AHI ≥15, and 51% had an AHI ≥30. The remaining 168 patients scored <2; of these, 62% had an AHI ≥5, 40% had an AHI ≥15, and 24% had an AHI ≥30 (Figure 3).
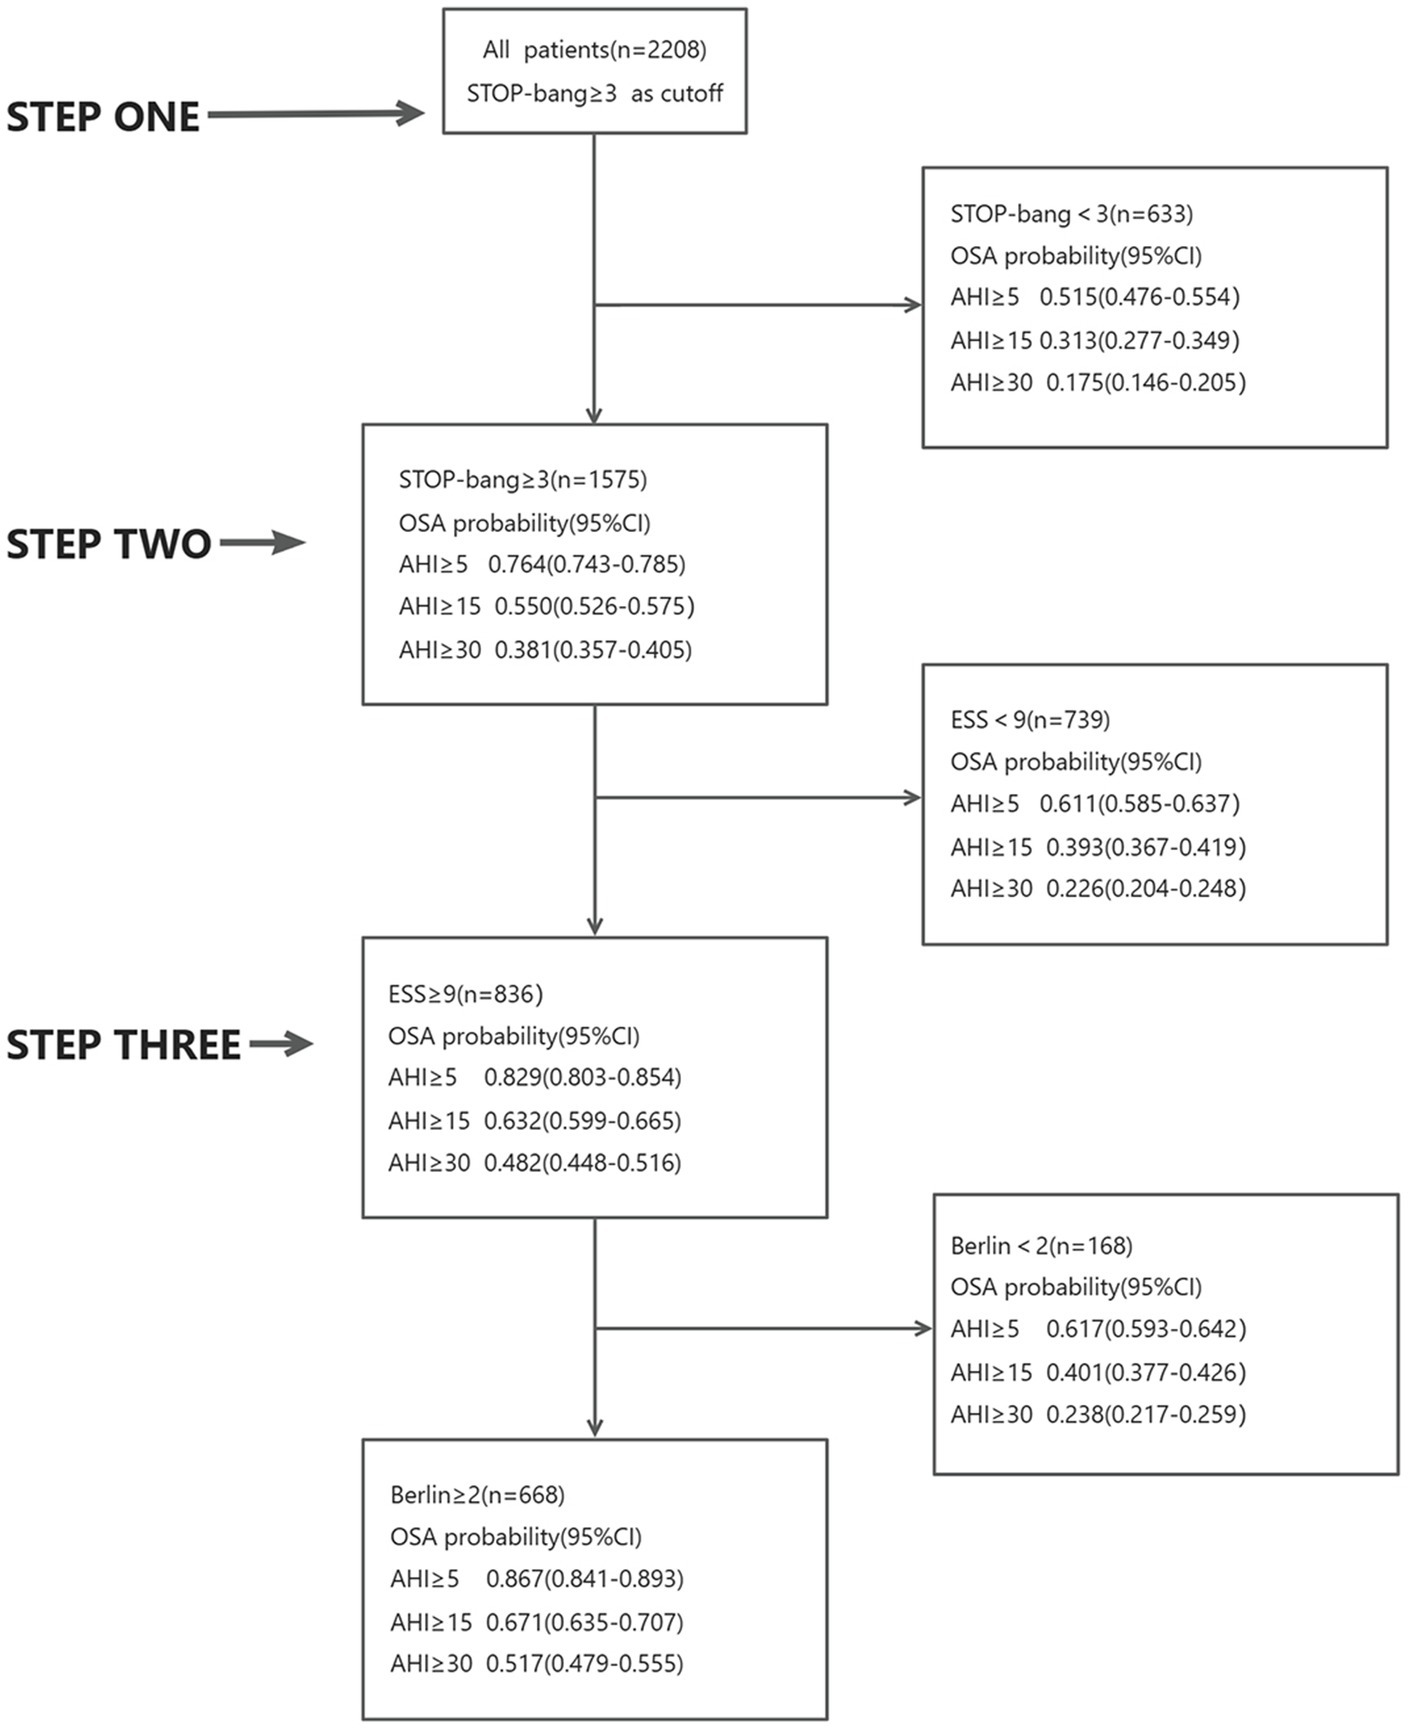
Figure 3. Three-step diagnostic strategy.
4 Discussion
OSA is a condition with a high prevalence and low diagnostic rate. Currently, PSG is considered the gold standard for diagnosing the presence and severity of OSA. However, it is associated with significant time consumption, high costs, and poor patient compliance (34). Therefore, several simple sleep monitoring devices and screening questionnaires have been developed to screen for OSA (35). Factors such as age, gender, body mass index (BMI), neck circumference (NC), waist circumference (WC), hypertension, and coronary artery disease have been shown to be significantly associated with the occurrence of OSA (36). In a meta-analysis, the Berlin questionnaire (BQ), STOP-Bang, STOP, and ESS were found to have relatively low specificity when detecting different severities of OSA (26). Consequently, the search for straightforward screening tools to identify OSA patients has become increasingly important. It has been reported that compared to STOP or ESS, the STOP-Bang questionnaire is more suitable for screening OSA, and it was originally developed for preoperative screening of OSA in surgical patients (26). The Berlin questionnaire was developed by a group of respiratory and primary care physicians to screen high-risk OSA patients (37). An ideal screening tool should have high sensitivity and specificity, as well as a high AUC (38).
In this study, among the 2,208 suspected OSA patients, 1,531 were diagnosed with the condition, with a significantly higher proportion of males compared to females, which aligns with the epidemiological characteristics of OSA. The ROC curve analysis indicated that the AUC values for STOP and ESS were slightly lower than those for NoSAS, Berlin, and STOP-Bang scores. These findings suggest that NoSAS is a simple and effective tool for risk assessment in suspected OSA patients, consistent with previous studies (39–41). By analyzing the confusion matrix, we calculated the sensitivity, specificity, PPV, and NPV. Overall, ESS demonstrated the lowest sensitivity and NPV but the highest specificity; Berlin had the highest PPV; STOP-Bang showed the highest sensitivity and NPV but the lowest specificity and PPV. Our objective was to evaluate the effectiveness of screening suspected OSA patients using single scoring systems, two-combined scoring systems, and three-combined scoring systems. Based on the AUC results and metrics of sensitivity and specificity, we selected the combination of STOP-Bang, ESS, and Berlin scores. In our three-step screening strategy, we initially used STOP-Bang, which had the highest sensitivity among the three scores, and concluded with ESS, which had the highest specificity. This approach was designed to optimize the screening effectiveness for suspected OSA patients.
Interestingly, our analysis showed that the AUC values for each questionnaire remained relatively stable across different AHI thresholds. This may be explained by the fact that the core risk factors assessed—such as snoring, daytime sleepiness, BMI, and hypertension—are prevalent and consistently associated with OSA regardless of severity level. These symptoms may not intensify linearly with increasing AHI, leading to similar discriminative power across severity groups.
Furthermore, we did not perform formal statistical comparisons of AUCs between questionnaires. Since only a single AUC value was derived per ROC curve without repeated measurements or resampling, conventional significance testing (e.g., t-tests or ANOVA) was not feasible. Robust statistical comparison of AUCs typically requires bootstrap methods or cross-validation to estimate variability and allow for inference, which was beyond the scope of this study. Future studies could consider such techniques to better compare diagnostic performance across tools.
This study has several advantages. First, our research benefits from a large sample size. Second, all predictive indicators used are common demographic and anthropometric measurements that can be completed in an outpatient setting without requiring additional equipment, invasive procedures, or tests. This significantly reduces the burden on both doctors and patients and helps improve patient adherence to medical advice. Third, the use of these scales allows patients to clearly see the risk factors for their condition, making it easier for them to make lifestyle changes, such as quitting smoking and controlling weight, thus serving as a potential educational tool. Fourth, combining multiple screening questionnaires such as STOP-Bang, ESS, and Berlin can improve the specificity and positive predictive value (PPV) of OSA screening. Each tool has its own strengths and limitations, and using them together allows for a more balanced and accurate assessment. This approach helps reduce missed diagnoses and false positives by compensating for the weaknesses of individual questionnaires. Fifth, all questionnaires employed in this study were validated Chinese versions with demonstrated reliability and diagnostic performance in Chinese populations. Although these instruments were originally developed for western, English-speaking populations, previous studies, including our own work, have confirmed that the translated versions exhibit comparable sensitivity and specificity to those reported in the original validation cohorts (24, 42). This supports their linguistic equivalence and cultural adaptability, and reinforces the applicability of our findings in the Chinese clinical setting. Additionally, although the Epworth Sleepiness Scale (ESS) is not specifically designed as a screening tool for OSA, it remains a widely used instrument to assess excessive daytime sleepiness, which is a key symptom in many sleep disorders. In this study, ESS was used in combination with standard OSA screening questionnaires to provide a more comprehensive assessment of the patient’s sleep-related symptoms. Previous studies have shown that ESS, when used alongside other tools such as STOP-Bang or Berlin, can offer added diagnostic value by capturing subjective symptoms not addressed by the structural components of standard questionnaires (26, 42). Therefore, while ESS alone may lack specificity for OSA, its integration into a multi-dimensional screening approach helps enhance overall predictive accuracy.
However, this study also has certain limitations. Firstly, it is a retrospective study conducted at a single center rather than a multi-center trial. Secondly, patients were originally referred to the sleep medicine center for PSG due to sleep-related breathing disorders, which may have inflated the PPV and affected the evaluation of our predictive parameters. Thirdly, the construction of our nomogram is based solely on demographic and anthropometric data, without considering atypical clinical features, genetic factors, medical history, and other variables. Fourthly, the Berlin and ESS questionnaires were administered only to participants with a STOP-Bang score ≥3. While this stepwise design aligns with clinical logic and helps improve specificity in high-prevalence settings, it may introduce selection bias and limit generalizability to broader populations. Excluding those with STOP-Bang ≤3 could miss mild OSA cases. Future studies should consider applying all questionnaires to the entire cohort to enable unbiased comparison and validate this approach in general populations. Finally, while this study adopted widely recommended cut-off values for each questionnaire based on prior literature, future research should consider exploring optimal cut-off thresholds using ROC-based analyses within specific populations. Such an approach could help refine the sensitivity-specificity balance and improve the screening performance of these tools in clinical practice.
Lastly, although the three-step strategy was intended to improve specificity and prioritization in screening, the added value of the third step—the Berlin questionnaire—may be limited. Our data showed that a proportion of patients excluded at this stage still had moderate-to-severe OSA, indicating a potential risk of underdiagnosis. Future prospective studies are needed to determine whether the marginal benefit of this additional step justifies its use, or if a simplified two-step model might offer comparable effectiveness with greater simplicity.
5 Conclusion
The “three-step strategy,” which combines the STOP-Bang score of ≥3, the ESS score of ≥9, and the Berlin questionnaire, significantly improves the specificity and PPV of screening for OSA patients. This approach demonstrates promising potential for clinical implementation.
Data availability statement
The raw data supporting the conclusions of this article will be made available by the authors, without undue reservation.
Ethics statement
The studies involving humans were approved by the Ethics Committee of the First Affiliated Hospital of Guangzhou Medical University on December 5, 2017 (Ethics Number: 201705). The studies were conducted in accordance with the local legislation and institutional requirements. The participants provided their written informed consent to participate in this study.
Author contributions
RC: Conceptualization, Data curation, Formal analysis, Writing – original draft. YZ: Data curation, Formal analysis, Writing – original draft. WY: Data curation, Formal analysis, Writing – review & editing. ZC: Data curation, Formal analysis, Writing – review & editing. WLia: Project administration, Software, Writing – review & editing. HZL: Investigation, Writing – review & editing. TS: Investigation, Writing – review & editing. HL: Project administration, Writing – review & editing. JC: Visualization, Writing – review & editing. WLiu: Resources, Validation, Writing – review & editing. WMY: Funding acquisition, Supervision, Validation, Writing – review & editing. YY: Funding acquisition, Methodology, Supervision, Writing – review & editing.
Funding
The author(s) declare that financial support was received for the research and/or publication of this article. This study was funded by the Natural Science Foundation of Basic and Applied Basic Research Fund of Guangdong Province (No. 2022A1515012375), the Guangdong Medical Research Fund Project (Nos. A2024728 and A2024723), the Science and Technology Development Special Project of Zhanjiang City (Nos. 2022A01142, 2022A01110, 2021A05086, and 2021A05088), and the Special Project for Clinical and Basic Sci & Tech Innovation of Guangdong Medical University (GDMULCJC2024075, GDMULCJC2024076, and GDMULCJC2024083).
Acknowledgments
We would also like to thank everyone who has helped with our research.
Conflict of interest
The authors declare that the research was conducted in the absence of any commercial or financial relationships that could be construed as a potential conflict of interest.
Generative AI statement
The authors declare that no Gen AI was used in the creation of this manuscript.
Publisher’s note
All claims expressed in this article are solely those of the authors and do not necessarily represent those of their affiliated organizations, or those of the publisher, the editors and the reviewers. Any product that may be evaluated in this article, or claim that may be made by its manufacturer, is not guaranteed or endorsed by the publisher.
References
1. Zinchuk, A, and Yaggi, HK. Phenotypic subtypes of OSA: a challenge and opportunity for precision medicine. Chest. (2020) 157:403–20. doi: 10.1016/j.chest.2019.09.002
2. Lévy, P, Kohler, M, WT, MN, Barbé, F, RD, ME, Somers, VK, et al. Obstructive sleep apnoea syndrome. Nat Rev Dis Primers. (2015) 1:15015. doi: 10.1038/nrdp.2015.15
3. Drager, LF, McEvoy, R, Barbe, F, Lorenzi-Filho, G, and Redline, S INCOSACT Initiative (International Collaboration of Sleep Apnea Cardiovascular Trialists). Sleep apnea and cardiovascular disease: lessons from recent trials and need for team science. Circulation. (2017) 136:1840–50. doi: 10.1161/CIRCULATIONAHA.117.029400
4. Leng, Y, McEvoy, CT, Allen, IE, and Yaffe, K. Association of sleep-disordered breathing with cognitive function and risk of cognitive impairment: a systematic review and meta-analysis. JAMA Neurol. (2017) 74:1237–45. doi: 10.1001/jamaneurol.2017.2180
5. Huang, T, Lin, BM, Stampfer, MJ, Tworoger, SS, Hu, FB, and Redline, S. A population-based study of the bidirectional association between obstructive sleep apnea and type 2 diabetes in three prospective U.S. cohorts. Diabetes Care. (2018) 41:2111–9. doi: 10.2337/dc18-0675
6. Benjafield, AV, Ayas, NT, Eastwood, PR, Heinzer, R, Ip, MSM, Morrell, MJ, et al. Estimation of the global prevalence and burden of obstructive sleep apnoea: a literature-based analysis. Lancet Respir Med. (2019) 7:687–98. doi: 10.1016/S2213-2600(19)30198-5
7. Swanson, LM, Arnedt, JT, Rosekind, MR, Belenky, G, Balkin, TJ, and Drake, C. Sleep disorders and work performance: findings from the 2008 National Sleep Foundation sleep in America poll. J Sleep Res. (2011) 20:487–94. doi: 10.1111/j.1365-2869.2010.00890.x
8. Hirotsu, C, Haba-Rubio, J, Togeiro, SM, Marques-Vidal, P, Drager, LF, Vollenweider, P, et al. Obstructive sleep apnoea as a risk factor for incident metabolic syndrome: a joined Episono and Hypno Laus prospective cohorts study. Eur Respir J. (2018) 52:1801150. doi: 10.1183/13993003.01150-2018
9. Davies, CR, and Harrington, JJ. Impact of obstructive sleep apnea on neurocognitive function and impact of continuous positive air pressure. Sleep Med Clin. (2016) 11:287–98. doi: 10.1016/j.jsmc.2016.04.006
10. Lang, CJ, Appleton, SL, Vakulin, A, McEvoy, RD, Vincent, AD, Wittert, GA, et al. Associations of undiagnosed obstructive sleep apnea and excessive daytime sleepiness with depression: an Australian population study. J Clin Sleep Med. (2017) 13:575–82. doi: 10.5664/jcsm.6546
11. Baldwin, CM, Griffith, KA, Nieto, FJ, O’Connor, GT, Walsleben, JA, and Redline, S. The association of sleep-disordered breathing and sleep symptoms with quality of life in the sleep heart health study. Sleep. (2001) 24:96–105. doi: 10.1093/sleep/24.1.96
12. Gooneratne, NS, Richards, KC, Joffe, M, Lam, RW, Pack, F, Staley, B, et al. Sleep disordered breathing with excessive daytime sleepiness is a risk factor for mortality in older adults. Sleep. (2011) 34:435–42. doi: 10.1093/sleep/34.4.435
13. Punjabi, NM, Caffo, BS, Goodwin, JL, Gottlieb, DJ, Newman, AB, O’Connor, GT, et al. Sleep-disordered breathing and mortality: a prospective cohort study. PLoS Med. (2009) 6:e1000132. doi: 10.1371/journal.pmed.1000132
14. Torres, G, Sanchez-de-la-Torre, M, and Barbe, F. Relationship between OSA and hypertension. Chest. (2015) 148:824–32. doi: 10.1378/chest.15-0136
15. Zeng, L, Chen, R, Hu, L, Wang, D, Chen, M, Lai, Y, et al. Concern about sleep disorders in underresourced settings is imminent. J Clin Sleep Med. (2021) 17:2339–40. doi: 10.5664/jcsm.9590
16. Senaratna, CV, Perret, JL, Lodge, CJ, Lowe, AJ, Campbell, BE, Matheson, MC, et al. Prevalence of obstructive sleep apnea in the general population: a systematic review. Sleep Med Rev. (2017) 34:70–81. doi: 10.1016/j.smrv.2016.07.002
17. Testelmans, D, Spruit, MA, Vrijsen, B, Sastry, M, Belge, C, Kalkanis, A, et al. Comorbidity clusters in patients with moderate-to-severe OSA. Sleep Breath. (2022) 26:195–204. doi: 10.1007/s11325-021-02390-4
18. Marti-Soler, H, Hirotsu, C, Marques-Vidal, P, Vollenweider, P, Waeber, G, Preisig, M, et al. The NoSAS score for screening of sleep-disordered breathing: a derivation and validation study. Lancet Respir Med. (2016) 4:742–8. doi: 10.1016/S2213-2600(16)30075-3
19. Hong, C, Chen, R, Qing, S, Kuang, A, Yang, HJ, Su, X, et al. Validation of the NoSAS score for the screening of sleep-disordered breathing: a hospital-based retrospective study in China. J Clin Sleep Med. (2018) 14:191–7. doi: 10.5664/jcsm.6930
20. Chung, F, Abdullah, HR, and Liao, P. STOP-bang questionnaire: a practical approach to screen for obstructive sleep apnea. Chest. (2016) 149:631–8. doi: 10.1378/chest.15-0903
21. Duarte, RL, Magalhães-da-Silveira, FJ, Oliveira-e-Sá, TS, Silva, JA, Mello, FCQ, and Gozal, D. Obstructive sleep apnea screening with a 4-item instrument, named GOAL questionnaire: development, validation and comparative study with no-apnea, STOP-bang, and NoSAS. Nat Sci Sleep. (2020) 12:57–67. doi: 10.2147/NSS.S238255
22. Tan, A, Yin, JDC, Tan, LWL, van Dam, RM, Cheung, YY, and Lee, CH. Using the Berlin questionnaire to predict obstructive sleep apnea in the general population. J Clin Sleep Med. (2017) 13:427–32. doi: 10.5664/jcsm.6496
23. Johns, MW. A new method for measuring daytime sleepiness: the Epworth Sleepiness Scale. Sleep. (1991) 14:540–5. doi: 10.1093/sleep/14.6.540
24. Zheng, Z, Zhang, Y, Chen, M, Chen, X, Li, C, Wang, C, et al. Application value of joint STOP-bang questionnaire and Epworth Sleepiness Scale in screening for obstructive sleep apnea. Front Public Health. (2022) 10:950585. doi: 10.3389/fpubh.2022.950585
25. Chen, R, Zhang, Y, Luo, Y, Wang, D, Zheng, Z, Su, X, et al. Application value of joint NoSAS score and Epworth Sleepiness Scale for assessment of obstructive sleep apnea hypopnea syndrome. Sleep Med. (2022) 97:36–42. doi: 10.1016/j.sleep.2022.05.845
26. Chiu, HY, Chen, PY, Chuang, LP, Chen, NH, Tu, YK, Hsieh, YJ, et al. Diagnostic accuracy of the Berlin questionnaire, STOP-BANG, STOP, and Epworth Sleepiness Scale in detecting obstructive sleep apnea: a bivariate meta-analysis. Sleep Med Rev. (2017) 36:57–70. doi: 10.1016/j.smrv.2016.10.004
27. Netzer, NC, Stoohs, RA, Netzer, CM, Clark, K, and Strohl, KP. Using the Berlin questionnaire to identify patients at risk for the sleep apnea syndrome. Ann Intern Med. (1999) 131:485–91. doi: 10.7326/0003-4819-131-7-199910050-00002
28. Ahmadi, N, Chung, SA, Gibbs, A, and Shapiro, CM. The Berlin questionnaire for sleep apnea in a sleep clinic population: relationship to polysomnographic measurement of respiratory disturbance. Sleep Breath. (2008) 12:39–45. doi: 10.1007/s11325-007-0125-y
29. Chung, F, Yegneswaran, B, Liao, P, Chung, SA, Vairavanathan, S, Islam, S, et al. STOP questionnaire: a tool to screen patients for obstructive sleep apnea. Anesthesiology. (2008) 108:812–21. doi: 10.1097/ALN.0b013e31816d83e4
30. Patel, D, Tsang, J, Saripella, A, Nagappa, M, Islam, S, Englesakis, M, et al. Validation of the STOP questionnaire as a screening tool for OSA among different populations: a systematic review and meta-regression analysis. J Clin Sleep Med. (2022) 18:1441–53. doi: 10.5664/jcsm.9820
31. Nagappa, M, Liao, P, Wong, J, Auckley, D, Ramachandran, SK, Memtsoudis, S, et al. Validation of the STOP-bang questionnaire as a screening tool for obstructive sleep apnea among different populations: a systematic review and meta-analysis. PLoS One. (2015) 10:e0143697. doi: 10.1371/journal.pone.0143697
32. Chen, X. Meeting report for 2015 metabolic engineering summit Beijing. Biotechnol J. (2016) 11:995–7. doi: 10.1002/biot.201500664
33. Georgakopoulou, VE, Pantazis, N, Tsiafaki, X, Nena, E, Amfilochiou, A, and Steiropoulos, P. Validation of NoSAS score for the screening of obstructive sleep apnea. Med Int. (2023) 3:14. doi: 10.3892/mi.2023.74
34. Veugen, C, Teunissen, EM, den Otter, LAS, Kos, MP, Stokroos, RJ, and Copper, MP. Prediction of obstructive sleep apnea: comparative performance of three screening instruments on the apnea-hypopnea index and the oxygen desaturation index. Sleep Breath. (2021) 25:1267–75. doi: 10.1007/s11325-020-02219-6
35. Xu, H, Zhao, X, Shi, Y, Li, X, Qian, Y, Zou, J, et al. Development and validation of a simple-to-use clinical nomogram for predicting obstructive sleep apnea. BMC Pulm Med. (2019) 19:18. doi: 10.1186/s12890-019-0782-1
36. Yeghiazarians, Y, Jneid, H, Tietjens, JR, Redline, S, Brown, DL, El-Sherif, N, et al. Obstructive sleep apnea and cardiovascular disease: a scientific statement from the American Heart Association. Circulation. (2021) 144:e56–67. doi: 10.1161/CIR.0000000000000988
37. Ng, SS, Tam, W, Chan, TO, To, KW, Ngai, J, Chan, KKP, et al. Use of Berlin questionnaire in comparison to polysomnography and home sleep study in patients with obstructive sleep apnea. Respir Res. (2019) 20:40. doi: 10.1186/s12931-019-1009-y
38. Duarte, RLM, Magalhaes-da-Silveira, FJ, and Gozal, D. Prediction of obstructive sleep apnea using GOAL questionnaire in adults with or without excessive daytime sleepiness: a cross-sectional study. Sleep Health. (2021) 7:212–8. doi: 10.1016/j.sleh.2021.01.003
39. Tan, A, Hong, Y, Tan, LWL, van Dam, RM, Cheung, YY, and Lee, CH. Validation of NoSAS score for screening of sleep-disordered breathing in a multiethnic Asian population. Sleep Breath. (2017) 21:1033–8. doi: 10.1007/s11325-016-1455-4
40. Rong, Y, Wang, S, Wang, H, Wang, F, Tang, J, Kang, X, et al. Validation of the NoSAS score for the screening of sleep-disordered breathing in a sleep clinic. Can Respir J. (2020) 2020:4936423. doi: 10.1155/2020/4936423
41. Peng, M, Chen, R, Cheng, J, Li, J, Liu, W, and Hong, C. Application value of the NoSAS score for screening sleep-disordered breathing. J Thorac Dis. (2018) 10:4774–81. doi: 10.21037/jtd.2018.07.46
Keywords: obstructive sleep apnea (OSA), Berlin questionnaires, diagnosis, Epworth Sleepiness Scale (ESS), STOP-Bang questionnaires
Citation: Chen R, Zhang Y, Ye W, Chen Z, Liao W, Liao H, Sun T, Li H, Cheng J, Liu W, Yao W and Yang Y (2025) Improving OSA screening efficiency with subjective questionnaires: integrating STOP-Bang, ESS, and Berlin. Front. Med. 12:1581904. doi: 10.3389/fmed.2025.1581904
Edited by:
Andrew E. Beaudin, University of Calgary, CanadaReviewed by:
Matiram Pun, University of Calgary, CanadaFabrizio Tritapepe, University of Studies G. d’Annunzio Chieti and Pescara, Italy
Copyright © 2025 Chen, Zhang, Ye, Chen, Liao, Liao, Sun, Li, Cheng, Liu, Yao and Yang. This is an open-access article distributed under the terms of the Creative Commons Attribution License (CC BY). The use, distribution or reproduction in other forums is permitted, provided the original author(s) and the copyright owner(s) are credited and that the original publication in this journal is cited, in accordance with accepted academic practice. No use, distribution or reproduction is permitted which does not comply with these terms.
*Correspondence: Wang Liu, bHdoZWxsbzIwMDJAMTI2LmNvbQ==; Weimin Yao, NDkwMjk2NDQzQHFxLmNvbQ==; Yitian Yang, MjU2MDM2NDc2MUBxcS5jb20=
†These authors have contributed equally to this work