Abstract
Background:
The growing burden of chronic disease multimorbidity in an aging population highlights the need to promote physical activity as a key strategy for disease management. This study aimed to explore the patterns of chronic comorbidities and their association with physical activity in Chinese middle-aged and older adults.
Methods:
A cross-sectional study was conducted using data from the 2020 China Health and Retirement Longitudinal Study. Latent class analysis was applied to identify distinct multimorbidity patterns among middle-aged and older adults, whereas multivariate logistic regression was used to analyze the influencing factors. The χ2 test was performed to compare 10 categorical variables between the patterns. A total of 18,697 participants were included.
Results:
Chronic disease multimorbidities were categorized into three classes: Class 1 (Metabolic Pattern), Class 2 (Multisystem Pattern), and Class 3 (Hypertension-Digestive-Musculoskeletal Pattern). Engagement in moderate-intensity physical activity was associated with a lower odds of Multisystem Pattern (OR = 0.74, 95% CI: 0.70∼0.91). Engagement in high-intensity physical activity was linked to a lower odds of both Metabolic Pattern (OR = 0.75, 95% CI: 0.68∼0.83) and Multisystem Pattern (OR = 0.75, 95% CI: 0.67∼0.84) diseases but was associated with a higher odds of Hypertension-Digestive-Musculoskeletal Pattern (OR = 1.46, 95% CI: 1.34∼1.59) diseases.
Conclusion:
Moderate physical activity reduces the risk of Multisystem Pattern and plays an essential role in preventing and managing metabolic disorders. Although high-intensity physical activity can reduce the risk of metabolic disorders and Multisystem Pattern, excessive physical activity may increase the risk of Hypertension-Digestive-Musculoskeletal Pattern.
1 Introduction
As the global population ages, the prevalence of chronic diseases is increasing, and as is the co-occurrence of multiple long-term conditions (1). This can lead to reduced quality of life for patients (2), increased utilization of inpatient and outpatient services (3), and increased complexity for clinical care and patient management strategies (4). The situation is particularly true in low- and middle-income countries (5). The current research mostly focus on how exercise can help prevent single diseases (6). It is no longer to address the current situation of In response, China recently launched a plan to prevent and control chronic diseases, aiming to restructure the health service system to better manage multimorbiditiy chronic diseases (7). Exploring the prevalence trends and factors related to chronic diseases in middle and older adults, especially the influence of low-cost physical activity (PA) on chronic diseases, can help to improve strategies for the prevention and control of chronic diseases.
The World Health Organization guidelines strongly recommend that older adults engage in 150–300 min of moderate-intensity PA/week or 75–150 min of high-intensity PA or an equivalent combination (8). PA not only effectively prevents cardiovascular diseases, metabolic diseases and respiratory diseases, but also improves the health conditions of patients suffering from these chronic diseases (9). Therefore, reaching the recommended levels of PA is a key in strategies for managing chronic diseases. The previous study was conducted in high-income countries, with findings ranging from an inverse correlation to no effect between PA and multimorbidity (10). However, the patterns of PA, disease prevalence rates and healthcare systems are quite different from other countries (9), especially in the context aging population and the increasing burden of chronic diseases (11). Therefore, exploring the association between multimorbidity patterns in the middle-aged and older adults in China is necessary to provide more precise guidance for effective interventions (10).
In this study, data from the China Health and Retirement Longitudinal Study (CHARLS) were used to examine the current state of chronic multimorbidity in middle-aged and older Chinese adults. Our main aim was to understand the impact of varying PA levels on multimorbidity patterns within this population. The findings would provide a theoretical basis for chronic disease prevention and offer guidance for the development of related health policies and optimization of intervention measures.
2 Materials and methods
2.1 Data sources
We used data from the CHARLS, a large interdisciplinary survey conducted by Wuhan and Peking universities. The national baseline survey of CHARLS was conducted in 2011, and since then, national follow-up surveys have continued in 2013, 2015, 2018, and 2020, covering 450 villages and 28 provinces in China (11).
Detailed variable definitions and coding schemes used in this study were based on the CHARLS 2020 dataset. The supplementary codebook (see Supplementary material) provides an overview of the variable labels, coding strategies, and construction of physical activity measures according to the IPAQ guidelines.
The data used in this study were from the fifth round of surveys that took place in 2020. The questions including information on the living habits and chronic diseases of middle-aged and older adults in this survey. The inclusion criteria for participants were: (1) age of ≥ 45 years at the time of the baseline survey; (2) available data on smoking, alcohol consumption, education level, cohabitation status, self-reported sleep duration, level of PA, and physician-diagnosed chronic diseases. After screening, 18,697 participants were included.
2.2 Data collection
2.2.1 Chronic disease and multimorbidity measurements
The demographic background, health status, and functioning data were taken from the CHARLS 2020 questionnaire. The prevalence of chronic diseases could be identified by asking, “Have you been diagnosed by a doctor with [the following diseases]?” to assess the presence of diseases including hypertension; dyslipidemia (elevated low-density lipoprotein, triglycerides, and total cholesterol, or decreased high-density lipoprotein); diabetes or hyperglycemia; cancer or malignant tumors (excluding minor skin cancer); chronic lung diseases (such as chronic bronchitis or emphysema, excluding tumors or cancers); liver diseases (excluding fatty liver, tumors and cancers); heart disease (including coronary heart disease, angina pectoris, congestive heart failure or other heart diseases); stroke; kidney diseases (excluding tumors or cancers); diseases of the stomach or other digestive systems (excluding tumors or cancers); emotional, neurological, or mental problems; memory-related diseases (such as dementia, brain atrophy, Parkinson’s disease, etc.); arthritis or rheumatism, and asthma. A total of 14 common chronic diseases were included.
2.2.2 Physical activity measurements
The physical activity section of the questionnaire directly used the short version of the International Physical Activity Questionnaire (IPAQ) (12), a global questionnaire designed to measure total PA across all areas. According to the questionnaire, the daily PA time of the respondents was divided into five groups: 0, 10–29, 30–119, 120–239 min, and > 4 h. The duration of each intensity level was replaced by the median of each group (the > 4 h group was replaced by 4 h) (13). Metabolic equivalent (MET), an indicator of the intensity of PA, was used to calculate the amount of moderate to vigorous PA (14). Based on the IPAQ criteria (15), the MET is 3.3 for walking, for moderate-intensity PA is 4.0, and for high-intensity PA is 8.0. The PA was calculated as follows:
Total PA (METs/week) = 8.0 × total weekly duration of high-intensity PA + 4.0 × total weekly duration of moderate PA + 3.3 × total weekly duration of walking
According to the IPAQ, weekly levels of PA were categorized as low-intensity < 600 (METs/week), moderate-intensity 600–3,000 (METs/week), and high-intensity > 3,000 (METs/week) (16).
2.2.3 Covariates
In previous studies the effects associated with kidney disease and sarcopenia include personal factors such as gender, age and comorbidities, and also socioeconomic factors and living standards (17–19). Meta-analyses indicate that smoking is an independent risk factor for the development of chronic diseases (20) and sarcopenia (21). The effects of alcohol on the kidney in comparison to smoking remain controversial in the scientific community (22). Study has shown that the relationship between sleep and chronic diseases is not a simple linear one (23). The duration of sleep at night shows a U-shaped relationship with the risk of cardiovascular or cerebrovascular diseases. Those who sleep for approximately 7.5 h each night have the lowest risk of developing such diseases (24). Therefore, our research collected information on sociodemographic conditions and health-related factors. These factors included age, sex, education level, spouse status, smoking, alcohol drinking, and sleep duration.
Based on existing evidence (25), sleep duration of < 7 h is associated with cardiovascular diseases, diabetes, and poor self-rated health. Therefore, sleep duration was categorized as < 7 or ≥ 7 h. Educational level was categorized into high school and above and below high school based on China’s compulsory education policy.
2.3 Statistical analysis
2.3.1 Comparison of covariates across multimorbidity patterns
The χ2 test was used to compare the distribution of covariates across the three chronic disease multimorbidity patterns.
2.3.2 Regression analysis of physical activity and multimorbidity
Separate binary logistic regression models were conducted for each latent class to examine the association between physical activity and multimorbidity patterns identified through latent class analysis (LCA). In each model, the outcome variable was coded as 1 if the individual belonged to the specified class and 0 if not. Level of physical activity (moderate intensity and high intensity) was used as the main exposure variable, and the types of chronic diseases (Class 1, Class 2, Class 3) were the outcome variables. The regression model controlled for multiple potential confounding factors, including age, gender, history of smoking and drinking, sleep duration, educational level, and whether living with a spouse.
2.3.3 Latent class analysis
Latent class analysis (LCA) is a cross-sectional latent variable mixture modeling approach (26). It does this by analyzing the behavior patterns of individuals, and finding common types called classes (27). The LCA model calculates the conditional probability of each disease within each latent class based on the presence or absence of chronic diseases among participants, thereby identifying distinct multimorbidity patterns. This leads to individual subgroups where they are most similar to each other and most different from those in other classes (28). The key advantage of model-based techniques over heuristic clustering techniques (e.g., K-means) is that they provide appropriate statistical data (29). Model selection was based on commonly used LCA fit statistics, including Akaike information criteria (AIC), Bayesian information criteria (BIC), and sample size-adjusted BIC (saBIC) (30). These criteria are used to compare competing models, with lower values indicating better model fit. Among them, BIC is often preferred for its stricter penalty on model complexity, especially in larger samples. Lower AIC and BIC values indicate better model fit. Classification accuracy was evaluated using entropy, which ranges from 0 to 1. The closer the entropy is to 1, the more accurate the classification is. When the entropy index is 0.6, the classification accuracy exceeds 80% (31). Lastly, LMR and BLRT were used to evaluate the fitting differences of the LCA model. These tests evaluate fitting differences, whether the k-class model fits significantly better than the k–1 class model (32). Fit statistics help researchers select the most suitable model for the data, and can be used to compare models for hypothesis testing. Therefore, LCA is an effective tool for understanding the multiple chronic disease conditions of middle-aged and elderly people, and identifying multimorbidity patterns. Supplementary Table 2 provides the definitions and functions of the LCA model fit indices.
Latent class analysis of comorbidity chronic diseases in middle-aged and older adults was conducted using Mplus software (version 8.3). SPSS (version 22.0) was used to analyze the factors that influenced decisions and compare the groups in each category. All statistical tests were two-sided with a significance level of α = 0.05.
3 Results
3.1 Participants characteristics
Of the 18,697 participants, 47.62% were male and 52.38% were female. Overall, 37.84% of participants were aged ≥ 65 years, and 62.16% were aged < 65 years. The proportion of participants who drank alcohol was 36.22%, and the proportion of those who did not was 63.78%. Smokers accounted for 39.22%, and non-smokers accounted for 60.78%.
In terms of sleep duration, 60.11% of participants slept for less than 7 h each night, and 39.89% slept for 7 h or more. With respect to educational attainment, 13.07% had a high school education or above, and 86.93% had a junior high school education or below. In terms of living conditions, 84.10% of the residents lived with their spouse, and 15.90% did not (Table 1).
TABLE 1
| Variables | Total participants | Low-intensity PA | Moderate-intensity PA | High-intensity PA |
| (N = 18,697) | (N = 3,151) | (N = 4,987) | (N = 10,559) | |
| Gender, N (%) | ||||
| Male | 8,904 (47.62) | 1,433 (45.47) | 2,399 (48.11) | 5,072 (48.07) |
| Female | 9,793 (52.38) | 1,718 (54.53) | 2,588 (51.89) | 5,487 (51.93) |
| Age, N (%) | ||||
| ≥ 65 | 7,076 (37.84) | 1,679 (53.28) | 2,069 (41.48) | 3,328 (31.52) |
| 45 ≤ and < 65 | 11,621 (62.16) | 1,472 (46.72) | 2,918 (58.52) | 7,231 (68.48) |
| Drinking, N (%) | ||||
| Yes | 6,772 (36.22) | 896 (28.43) | 1,758 (35.25) | 4,118 (39.00) |
| No | 11,925 (63.78) | 2,255 (71.57) | 3,229 (64.75) | 6,441 (61.00) |
| Smoking, N (%) | ||||
| Yes | 7,333 (39.22) | 1,264 (40.11) | 1,964 (39.38) | 4,105 (38.88) |
| No | 1,1364 (60.78) | 1,887 (59.89) | 3,023 (60.62) | 6,454 (61.12) |
| Sleep time, N (%) | ||||
| ≥ 7 h | 7,459 (39.89) | 1,299 (41.22) | 1,961 (39.32) | 4,199 (39.77) |
| < 7 h | 11,238 (60.11) | 1,852 (58.77) | 3,026 (60.68) | 6,360 (60.23) |
| Education level, N (%) | ||||
| High school and above | 2,445 (13.07) | 282 (8.95) | 937 (18.79) | 1,226 (11.61) |
| Below high school | 16,252 (86.93) | 2,869 (91.05) | 4,050 (81.21) | 9,333 (88.39) |
| Living with spouse, N (%) | ||||
| With a spouse | 15,725 (84.10) | 2,373 (75.31) | 4,121 (82.63) | 9,231 (87.42) |
| Without a spouse | 2,972 (15.90) | 778 (24.69) | 866 (17.37) | 1,328 (12.58) |
Characteristics of the participants.
The prevalence rates of various chronic diseases were hypertension 40.12%, arthritis 38.55%, digestive system diseases 31.57%, dyslipidemia 26.74%, and heart disease 20.89% (Figure 1).
FIGURE 1

Descriptive of chronic disease probability.
3.2 Classification of chronic disease multimorbidity patterns in middle-aged and older Chinese adults
Fitting index data are shown in Table 2. Entropy values of the latent category model were 0.641 for two categories, 0.681 for three categories, 0.632 for four categories, 0.656 for five categories, and 0.633 for six categories, and in LMR and BLRT the significance of this observation was p < 0.001. Chronic disease multimorbidities were divided into three classes based on 14 chronic diseases. Thus, models with three categories were selected as the best model due to high entropy values and better-represented groups of chronic disease multimorbidity.
TABLE 2
| Cluster | AIC | BIC | SaBIC | Entropy | LMRT (P) | BLRT (P) | Latent class distribution rate (%) | |||||
| 1 | 2 | 3 | 4 | 5 | 6 | |||||||
| 2-class | 192933.571 | 193160.819 | 193068.658 | 0.641 | P < 0.001 | P < 0.001 | 0.300 | 0.700 | ||||
| 3-class | 190759.729 | 191104.518 | 190964.688 | 0.681 | P < 0.001 | P < 0.001 | 0.217 | 0.130 | 0.652 | |||
| 4-class | 189767.060 | 190229.398 | 190041.899 | 0.632 | P < 0.001 | P < 0.001 | 0.053 | 0.232 | 0.137 | 0.578 | ||
| 5-class | 188896.007 | 189475.880 | 189240.71 | 0.656 | P < 0.001 | P < 0.001 | 0.036 | 0.052 | 0.228 | 0.526 | 0.158 | |
| 6-class | 188728.141 | 189425.556 | 189142.719 | 0.633 | 0.116 | P < 0.001 | 0.168 | 0.055 | 0.055 | 0.033 | 0.176 | 0.514 |
Fit indices of latent class analysis and the distribution rates of chronic disease multimorbidity patterns.
Class 1 had 4,066 participants, with a high prevalence of hypertension, dyslipidemia, and diabetes; thus, class 1 was named “Metabolic Pattern.” Class 2 had 2,433 participants, with a high prevalence of hypertension, dyslipidemia, diabetes, arthritis, and lung, liver, heart, kidney, digestive, and psychiatric diseases. Class 2 involved several systems and was defined as a “Multisystem Pattern.” Class 3 contained 12,198 samples, with a high prevalence of hypertension, digestive diseases, and arthritis, and it was defined as a “Hypertension-Digestive-Musculoskeletal Pattern” (33).
The conditional probability distributions for each class are shown in Figure 2. Metabolic Pattern was characterized by a high probability of hypertension, dyslipidemia, and diabetes, but low probabilities for other conditions. Multisystem Pattern showed moderate-to-high probabilities across a wide range of conditions, including cancer, heart disease, digestive disorders, arthritis, and psychiatric disorders, indicating a complex multimorbidity profile. Hypertension-Digestive-Musculoskeletal Pattern had the highest proportion of participants and was mainly marked by elevated probabilities of hypertension, digestive disorders, and arthritis.
FIGURE 2
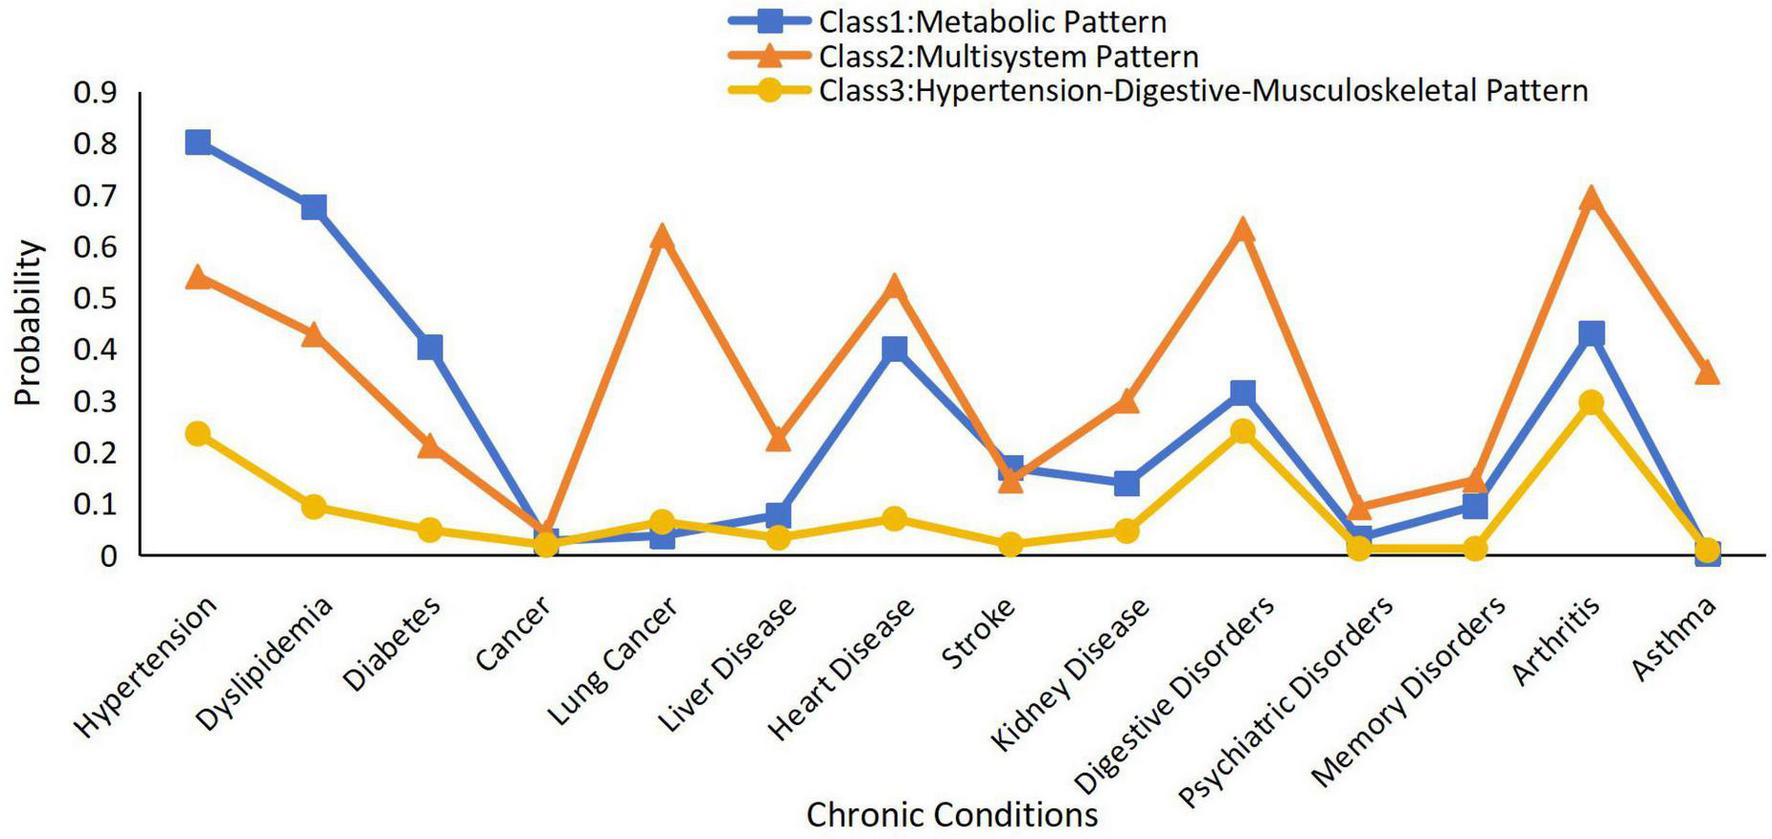
Patterns of chronic multimorbidity by latent classes analysis.
The results of the latent class analysis are summarized in Supplementary Table 1, which presents the conditional item-response probabilities of reporting each chronic condition within the three identified classes.
3.3 Comparison of demographic and PA characteristics across different categories
Participants engaging in moderate-intensity PA had the highest proportion of Class 1 multimorbidities (31.65%). Participants engaging in high-intensity PA had the highest proportion of Class 3 multimorbidities (60.19%).
Sociodemographic and health-related factors varied across the classes. Class 1 had the highest proportion of females (55.51%), and it also had the highest proportion of participants with an educational level ≥ high school (15.69%). Class 2 had the highest proportion of participants aged ≥ 65 years (52.60%), and it also had the highest proportion of participants with a history of smoking (43.00%). Class 3 had the highest proportion of participants with a history of alcohol consumption (39.00%). Participants living with spouses had the highest proportion of multimorbidities in Class 3 (85.67%) (Table 3).
TABLE 3
| Variables | Class 1 (n = 4,066) | Class 2 (n = 2,433) | Class 3 (n = 12,198) | χ2 | P | |
| Personal characteristics | ||||||
| Sex | Male | 1,809 (44.49) | 1,139 (46.81) | 5,956 (48.82) | 23.73 | 0 < 0.001 |
| Female | 2,257 (55.51) | 1,294 (53.19) | 6,242 (51.18) | |||
| Age (years) | ≥ 65 | 1,862 (45.79) | 1,280 (52.60) | 3,934 (32.25) | 496.98 | 0 < 0.001 |
| < 65 and ≥ 45 | 2,204 (54.21) | 1,153 (47.40) | 8,264 (67.75) | |||
| Drink | Yes | 1,298 (31.92) | 713 (29.30) | 4,761 (39.00) | 124.57 | 0 < 0.001 |
| No | 2,768 (68.08) | 1,720 (70.70) | 7,437 (61.00) | |||
| Smoke | Yes | 1,444 (35.51) | 1,045 (43.00) | 4,844 (39.71) | 38.87 | 0 < 0.001 |
| No | 2,622 (64.49) | 1,388 (57.00) | 7,354 (60.29) | |||
| Sleep time (h) | ≥ 7 | 1,484 (36.49) | 688 (28.27) | 5,287 (43.34) | 216.99 | 0 < 0.001 |
| < 7 | 2,582 (63.51) | 1,745 (71.73) | 6,911 (56.66) | |||
| Education level | High school and above | 649 (15.96) | 243 (10.00) | 1,553 (12.73) | 51.47 | 0 < 0.001 |
| Below high school | 3,417 (84.04) | 2,190 (90.00) | 10,645 (87.27) | |||
| Living with spouse | Yes | 3,368 (82.83) | 1907 (78.38) | 10,450 (85.67) | 86.90 | 0 < 0.001 |
| No | 698 (17.17) | 526 (21.62) | 1,748 (14.33) | |||
| Low-intensity PA | Yes | 791 (19.45) | 549 (22.56) | 1,811 (14.85) | 111.31 | 0 < 0.001 |
| No | 3,275 (80.55) | 1,884 (77.44) | 10,387 (85.15) | |||
| Moderate-intensity PA | Yes | 1,287 (31.65) | 654 (26.88) | 3,046 (25.00) | 69.67 | 0 < 0.001 |
| No | 2,779 (68.35) | 1,779 (73.12) | 9,152 (75.00) | |||
| High-intensity PA | Yes | 1,988 (48.89) | 1,230 (50.55) | 7,341 (60.18) | 197.97 | 0 < 0.001 |
| No | 2,078 (51.11) | 1,203 (49.45) | 4,857 (39.82) | |||
Comparison of characteristics among latent classes in middle-aged and older Chinese adults (n, %).
Class 1: Metabolic Pattern. Class 2: Multisystem Pattern. Class 3: Hypertension-Digestive-Musculoskeletal Pattern.
3.4 Logistic regression analysis of potential factors of chronic disease multimorbidity patterns
When investigating associations between participant characteristics and multimorbidity classes, distinct patterns emerged across classes (Table 4). In Class 1, aged ≥ 65 years was associated with increased odds of classification (OR = 1.53, 95% CI: 1.42∼1.65), as was living with a spouse (OR = 1.49, 95% CI: 1.35∼1.65). High-intensity PA was associated with decreased odds of classification (OR = 0.75, 95% CI: 0.68∼0.83). In Class 2, aged ≥ 65 years was associated with increased odds of classification (OR = 1.77, 95% CI: 1.62∼1.94), as was sleep duration of ≥ 7 h (OR = 1.47, 95%CI: 1.29∼1.67). Both moderate-intensity PA (OR = 0.74, 95% CI: 0.70∼0.90) and high-intensity PA (OR = 0.75, 95% CI: 0.60∼0.84) were associated with decreased odds of Class 2. In Class 3, history of smoking (OR = 1.35, 95% CI: 1.26∼1.45) and educational level of high school or above (OR = 1.53, 95% CI: 1.43∼1.63) were associated with increased odds of this pattern. High-intensity PA was associated with increased odds of classification Class 3 (OR = 1.46, 95% CI: 1.34∼1.59).
TABLE 4
| Variables | Class 1 | Class 2 | Class 3 | |||
| OR | 95% CI | OR | 95% CI | OR | 95% CI | |
| Sex (ref. = female) | 0.97 | 0.87∼1.07 | 0.91 | 0.79∼1.03 | 1.08 | 0.98∼1.18 |
| Age (ref. = < 65 years) | 1.53** | 1.42∼1.65 | 1.77** | 1.62∼1.94 | 0.54** | 0.50∼0.58 |
| Drink (ref. = no) | 1.10 | 0.99∼1.21 | 0.85* | 0.76∼0.95 | 1.03 | 0.94∼1.12 |
| Smoke (ref. = no) | 0.85** | 0.79∼0.93 | 0.70** | 0.63∼0.77 | 1.35** | 1.26∼1.45 |
| Sleep time (ref. = < 7 h) | 0.86* | 0.77∼0.95 | 1.47** | 1.29∼1.67 | 0.93 | 0.85∼1.01 |
| Education level (ref. = below high school) | 0.84** | 0.78∼0.90 | 0.55** | 0.50∼0.61 | 1.53** | 1.43∼1.63 |
| Living with spouse (ref. = no) | 1.49** | 1.35∼1.65 | 0.85* | 0.74∼0.99 | 0.78** | 0.71∼0.85 |
| Moderate–intensity PA (ref. = no) | 1.05 | 0.95∼1.17 | 0.74** | 0.70∼0.90 | 1.09 | 1.00∼1.20 |
| High–intensity PA (ref. = no) | 0.75** | 0.68∼0.83 | 0.75** | 0.67∼0.84 | 1.46** | 1.34∼1.59 |
Logistic regression models of latent class analysis of chronic disease multimorbidity patterns.
**P < 0.001;
*P < 0.01; OR, odds ratio; 95% CI, 95% confidence interval.
4 Discussion
4.1 Effect of PA on chronic disease multimorbidity patterns
This study revealed that individuals who engaged more frequently in moderate-intensity PA were less likely to exhibit a multimorbidity pattern. Previous studies have reported that moderate-intensity PA can effectively reduce systemic inflammation levels and improve metabolic indicator (34–36), furthermore, such PA can significantly control the risk of all-cause mortality, especially among middle-aged and elderly people (37).
Participants who engaged in high-intensity PA were less likely to exhibit the Metabolic Pattern or the Multisystem Pattern (Class 3). However, participants who engaged in high-intensity PA were more likely to exhibit the Hypertension-Digestive-Musculoskeletal Pattern. A previous study revealed that regular high-intensity PA can reduce the risks of cancer, obesity and all-cause mortality and improve the overall health status of elderly individuals (38). However, some studies have reported that high-intensity PA can increase cardiovascular load among elderly individuals (39), which in turn can lead to abnormal arterial function (40). In addition, during high-intensity PA, the musculoskeletal load increases significantly. As elderly individuals have a degenerated skeletal system, they may thus be more susceptible to the induction or aggravation of bone diseases (41). Therefore, the recommendation of high-intensity PA should be based on a scientific assessment of individual health conditions, especially among middle-aged and elderly individuals. The functional status of their cardiovascular and skeletal systems should be considered with the aims of minimizing exercise-related risks and maximizing their health-promoting benefits.
In conclusion, PA plays a significant role in the prevention and control of chronic diseases among middle-aged and elderly people; however, an appropriate intensity of activity should be selected on the basis of individual health conditions. Moderate-intensity PA is more suitable for most elderly people and can be used as a routine intervention method. Although high-intensity PA offers certain benefits, it should be performed under professional guidance and monitoring, especially among individuals with cardiovascular or skeletal diseases, and caution should be exercised in this context.
4.2 Effects of participant’s characteristics and lifestyles on chronic disease multimorbidity patterns
In the current study, participants aged ≥ 65 years exhibited significantly lower odds of inclusion in the hypertension-digestive-musculoskeletal pattern group, thus suggesting that such chronic conditions may be more common among individuals between the ages of 45 and 65 years. This finding is consistent with the extant research on hypertension and musculoskeletal disease (42). Previous studies have reported that hormonal fluctuations in women between the ages of 45 and 60 years can significantly affect both systolic and diastolic blood pressure; furthermore, these effects are more notable among individuals who experience the onset of menopause earlier (43, 44). Therefore, more attention should be given to blood pressure monitoring among individuals in this age group.
Smoking was a significant variable among individuals in the hypertension-digestive-musculoskeletal pattern group in our study. This finding is consistent with the results reported by previous studies that have indicated that smoking is a risk factor for chronic diseases such as hypertension and arthritis (45). Harmful substances such as the nicotine in tobacco can increase the risk of cardiovascular diseases (46) and related multimorbidities by damaging the vascular endothelium and promoting atherosclerosis (47).
Participants who had obtained higher levels of education were more likely to be classified as part of the hypertension-digestive-musculoskeletal pattern group. This finding is consistent with the results of some studies that have been conducted in developing countries (48), thus suggesting that relationships between level of education and chronic diseases may vary depending on the individual’s socioeconomic background or the stage of epidemiological transition, and these relationships may involve complex interactions among factors such as health behaviors, resource acquisition paths, and the ability to transform health knowledge (49).
Compared with individuals who lived alone, participants who lived with a spouse were less likely to be assigned to the hypertension-digestive-musculoskeletal pattern group, which is consistent with the findings of previous research on spousal care in the United States (50). The reason for this situation could be that a spouse can provide humanistic care and support efforts to maintain a healthy diet, thereby contributing to improved control of blood pressure, blood glucose, and other health metrics among older adults with chronic diseases (51).
The results of the present study indicate that PA recommendations should be formulated for people of different ages and with different educational backgrounds to delay the progression of comorbidities.
4.3 Limitations and strengths
First, although the CHARLS 2020 data provided sampling weights, we did not adopt weighted processing in our analysis. This study is a cross-sectional one, with the main aim of evaluating the internal association between physical activity and the comorbidity patterns of chronic diseases. Existing methodological studies have suggested that if the model already includes key sampling design variables (such as age, sex, and region), the unweighted regression model can still obtain effective inferences while avoiding the increase in estimated variance caused by weighting.
Second, although this study controlled for multiple sociodemographic and behavioral variables based on previous research, it did not use the directed acyclic graph (DAG) method to systematically identify potential confounding factors. Therefore, some important but unobserved variables (such as stress, depression, social support, and other psychosocial factors) were not included in the analysis model (52). This may affect the completeness and explanatory power of the results (53, 54).
Finally, this study utilized the cross-sectional data from CHARLS 2020. As a result, it was impossible to infer a causal relationship between physical activity and comorbidities of chronic diseases. Longitudinal studies are still needed in the future to further verify the directionality and sustainability of this association.
This study had several strengths. First, it used the LCA method, which, can identify potential sub-populations with different disease combination characteristics. LCA breaks through the previous comorbidity assessment approach based solely on the number of diseases, helping to classify multiple coexisting chronic diseases into guided recommendations for chronic disease management based on expert interpretation. Secondly, the study was based on large-scale, nationally representative survey data of the middle-aged and elderly populations. Lastly, the study subdivided physical activity into moderate-intensity and high-intensity, and investigated its association with different coexistence patterns of multiple diseases, providing a basis for personalized and stratified intervention strategies and theoretical support for the comprehensive management of chronic diseases.
5 Conclusion
This study revealed associations between different levels of PA on different types of chronic disease multimorbidity patterns. The study suggests that moderate PA is associated with a lower risk of Multisystem Pattern and may be beneficial in the prevention and management of metabolic conditions. Although high-intensity PA may reduce the risk of metabolic and multisystem diseases, excessive PA may increase the risk for patients with high blood pressure, digestive disorders, and skeletal disorders. For middle -aged adults with chronic diseases in China, the intensity of PA should be reasonably adjusted according to their specific disease types and health conditions to maximize the health level and reduce the occurrence and progress of chronic diseases. These findings can inform future directions for effective interventions for managing chronic diseases, especially regarding the formulation of PA prescriptions, which requires further exploration of the appropriate intensity of PA under different disease patterns.
Statements
Data availability statement
Publicly available datasets were analyzed in this study. This data can be found here: the data for this study were extracted from CHARLS, a publicly available database provided by Peking University (https://charls.pku.edu.cn/).
Ethics statement
The studies involving humans were approved by the Institutional Review Committee of Peking University has approved all CHARLS rounds with the approval number IRB00001052-11015. The studies were conducted in accordance with the local legislation and institutional requirements. Written informed consent for participation was not required from the participants or the participants’ legal guardians/next of kin in accordance with the national legislation and institutional requirements.
Author contributions
XW: Conceptualization, Project administration, Visualization, Writing – original draft. XY: Conceptualization, Methodology, Supervision, Writing – review & editing.
Funding
The author(s) declare that financial support was received for the research and/or publication of this article. This study was supported by Fujian Health College (Grant Number MWY2025-5-01).
Acknowledgments
We would like to offer our thanks to the Peking University CHARLS team.
Conflict of interest
The authors declare that the research was conducted in the absence of any commercial or financial relationships that could be construed as a potential conflict of interest.
Generative AI statement
The authors declare that Generative AI was used in the creation of this manuscript. During the preparation of this work the authors used AI-assisted technologies in order to translation and ChatGPT-4 in order to improve language and readability. All writing presented here is original and derives solely from the authors. We confirm that the data processing, result interpretation and conclusion derivation in this study were all completed manually by the research team. We did not use any AI tools or algorithms for data analysis or result generation, thus ensuring the authenticity and originality of the research. After using this tool, the authors reviewed and edited the content as needed and take full responsibility for the content of the publication.
Any alternative text (alt text) provided alongside figures in this article has been generated by Frontiers with the support of artificial intelligence and reasonable efforts have been made to ensure accuracy, including review by the authors wherever possible. If you identify any issues, please contact us.
Publisher’s note
All claims expressed in this article are solely those of the authors and do not necessarily represent those of their affiliated organizations, or those of the publisher, the editors and the reviewers. Any product that may be evaluated in this article, or claim that may be made by its manufacturer, is not guaranteed or endorsed by the publisher.
Supplementary material
The Supplementary Material for this article can be found online at: https://www.frontiersin.org/articles/10.3389/fmed.2025.1582846/full#supplementary-material
References
1.
Forman D Maurer M Boyd C Brindis R Salive M Horne F et al Multimorbidity in older adults with cardiovascular disease. J Am Coll Cardiol. (2018) 71:2149–61. 10.1016/j.jacc.2018.03.022
2.
Tyack Z Frakes K Barnett A Cornwell P Kuys S McPhail S . Predictors of health-related quality of life in people with a complex chronic disease including multimorbidity: a longitudinal cohort study.Qual Life Res. (2016) 25:2579–92. 10.1007/s11136-016-1282-x
3.
Salisbury C Johnson L Purdy S Valderas J Montgomery A . Epidemiology and impact of multimorbidity in primary care: a retrospective cohort study.Br J Gen Pract. (2011) 61:e12–21. 10.3399/bjgp11X548929
4.
Banatvala N Akselrod S Bovet P Mendis S. The Who Global Action Plan for the Prevention and Control of Ncds 2013–2030. Noncommunicable Diseases. Milton Park, MA: Routledge (2023). p. 234–9.
5.
Mair F Gallacher K . Multimorbidity: what next?Br J Gen Pract. (2017) 67:248–9. 10.3399/bjgp17X690965
6.
Sherrington C Michaleff Z Fairhall N Paul S Tiedemann A Whitney J et al Exercise to prevent falls in older adults: an updated systematic review and meta-analysis. Br J Sports Med. (2017) 51:1750–8. 10.1136/bjsports-2016-096547
7.
Zhai T Goss J . Health system reform in china: the challenges of multimorbidity.Lancet Glob Health. (2020) 8:e750–1. 10.1016/S2214-109X(20)30225-4
8.
Bull F Al-Ansari S Biddle S Borodulin K Buman M Cardon G et al World health organization 2020 guidelines on physical activity and sedentary behaviour. Br J Sports Med. (2020) 54:1451–62. 10.1136/bjsports-2020-102955
9.
Lee I Shiroma E Lobelo F Puska P Blair S Katzmarzyk P . Effect of physical inactivity on major non-communicable diseases worldwide: an analysis of burden of disease and life expectancy.Lancet. (2012) 380:219–29. 10.1016/S0140-6736(12)61031-9
10.
Chudasama Y Khunti K Zaccardi F Rowlands A Yates T Gillies C et al Physical activity, multimorbidity, and life expectancy: a uk biobank longitudinal study. BMC Med. (2019) 17:108. 10.1186/s12916-019-1339-0
11.
He L Biddle S Lee J Duolikun N Zhang L Wang Z et al The prevalence of multimorbidity and its association with physical activity and sleep duration in middle aged and elderly adults: a longitudinal analysis from china. Int J Behav Nutr Phys Act. (2021) 18:77. 10.1186/s12966-021-01150-7
12.
Albuquerque A Borges-Silva F Da Silva Borges EG Pereira AP Dantas EHM . Physical activity: relationship to quality of life and memory in older people.Sci Sports. (2017) 32:259–65. 10.1016/j.scispo.2016.09.006
13.
Zeng Z Bian Y Cui Y Yang D Wang Y Yu C . Physical activity dimensions and its association with risk of diabetes in middle and older aged chinese people.Int J Environ Res Public Health. (2020) 17:7803. 10.3390/ijerph17217803
14.
Li S Zhang J Yang Y . Correlation between the physical activity volume and cognitive and mental capacity among older adult people in china: a cross-sectional study based on the 2020 charls database.Front Public Health. (2024) 12:1462570. 10.3389/fpubh.2024.1462570
15.
IPAQ. Guidelines for Data Processing and Analysis of the International Physical Activity Questionnaire (IPAQ) - Short Form . (2004). Available online at: https://www.physio-pedia.com/images/c/c7/Quidelines_for_interpreting_the_IPAQ.pdf(accessed September 18, 2025).
16.
Li X Zhang W Zhang W Tao K Ni W Wang K et al Level of physical activity among middle-aged and older chinese people: evidence from the china health and retirement longitudinal study. BMC Public Health. (2020) 20:1682. 10.1186/s12889-020-09671-9
17.
Chen L Woo J Assantachai P Auyeung T Chou M Iijima K et al Asian working group for sarcopenia: 2019 consensus update on sarcopenia diagnosis and treatment. J Am Med Dir Assoc. (2020) 21:300–7. 10.1016/j.jamda.2019.12.012
18.
Gansevoort R Correa-Rotter R Hemmelgarn B Jafar T Heerspink H Mann J et al Chronic kidney disease and cardiovascular risk: epidemiology, mechanisms, and prevention. Lancet. (2013) 382:339–52. 10.1016/S0140-6736(13)60595-4
19.
Porter A Lash J Xie D Pan Q DeLuca J Kanthety R et al Predictors and outcomes of health–related quality of life in adults with ckd. Clin J Am Soc Nephrol. (2016) 11:1154–62. 10.2215/CJN.09990915
20.
Xia J Wang L Ma Z Zhong L Wang Y Gao Y et al Cigarette smoking and chronic kidney disease in the general population: a systematic review and meta-analysis of prospective cohort studies. Nephrol Dial Transplant. (2017) 32:475–87. 10.1093/ndt/gfw452
21.
Yuan S Larsson S . Epidemiology of sarcopenia: prevalence, risk factors, and consequences.Metabolism. (2023) 144:155533. 10.1016/j.metabol.2023.155533
22.
Hu E Lazo M Rosenberg S Grams M Steffen L Coresh J et al Alcohol consumption and incident kidney disease: results from the atherosclerosis risk in communities study. J Ren Nutr. (2020) 30:22–30. 10.1053/j.jrn.2019.01.011
23.
Lo C Lee P . Prevalence and impacts of poor sleep on quality of life and associated factors of good sleepers in a sample of older chinese adults.Health Qual Life Outcomes. (2012) 10:1–07. 10.1186/1477-7525-10-72
24.
Huang Y Xia W Ge Y Hou J Tan L Xu W et al Sleep duration and risk of cardio-cerebrovascular disease: a dose-response meta-analysis of cohort studies comprising 3.8 million participants. Front Cardiovasc Med. (2022) 9:907990. 10.3389/fcvm.2022.907990
25.
Da Silva A de Mello R Schaan C Fuchs F Redline S Fuchs S . Sleep duration and mortality in the elderly: a systematic review with meta-analysis.Bmj Open. (2016) 6:e8119. 10.1136/bmjopen-2015-008119
26.
Petersen K Qualter P Humphrey N . The application of latent class analysis for investigating population child mental health: a systematic review.Front Psychol. (2019) 10:1214. 10.3389/fpsyg.2019.01214
27.
Collins L Lanza S. Latent Class and Latent Transition Analysis: With Applications in the Social, Behavioral, and Health Sciences. Hoboken, NJ: John Wiley & Sons (2009).
28.
Berlin K Williams N Parra G . An introduction to latent variable mixture modeling (part 1): overview and cross-sectional latent class and latent profile analyses.J Pediatr Psychol. (2014) 39:174–87. 10.1093/jpepsy/jst084
29.
Miettunen J Nordström T Kaakinen M Ahmed A . Latent variable mixture modeling in psychiatric research – a review and application.Psychol Med. (2016) 46:457–67. 10.1017/S0033291715002305
30.
Xu L Xue C Yang K Chen L Chen X Xie X et al A latent class analysis of community-based rehabilitation needs among chinese older adults: a mixed study protocol. Front Public Health. (2024) 11:1301752. 10.3389/fpubh.2023.1301752
31.
Wang M Deng Q Bi X Ye H Yang W . Performance of the entropy as an index of classification accuracy in latent profile analysis: a monte carlo simulation study.Xin Li Xue Bao. (2017) 49:1473–82. 10.3724/SP.J.1041.2017.01473
32.
Sen S Cohen A . An evaluation of fit indices used in model selection of dichotomous mixture irt models.Educ Psychol Meas. (2024) 84:481–509. 10.1177/00131644231180529
33.
Wang M Chai P . Study on the chronic disease comorbidities pattern and the distribution of catastrophic health expenditure among the elderly in china.Chinese Health Economics. (2024) 43:47–50.
34.
Cerqueira É Marinho DA Neiva HP Lourenço O . Inflammatory effects of high and moderate intensity exercise—a systematic review.Front Physiol. (2020) 10:489354. 10.3389/fphys.2019.01550
35.
Son W Park H Jeon B Ha M . Moderate intensity walking exercises reduce the body mass index and vascular inflammatory factors in postmenopausal women with obesity: a randomized controlled trial.Sci Rep. (2023) 13:20172. 10.1038/s41598-023-47403-2
36.
Arem H Moore S Patel A Hartge P Berrington D Visvanathan K et al Leisure time physical activity and mortality: a detailed pooled analysis of the dose-response relationship. JAMA Intern Med. (2015) 175:959–67. 10.1001/jamainternmed.2015.0533
37.
Perissiou M Borkoles E Kobayashi K Polman R . The effect of an 8 week prescribed exercise and low-carbohydrate diet on cardiorespiratory fitness, body composition and cardiometabolic risk factors in obese individuals: a randomised controlled trial.Nutrients. (2020) 12:482. 10.3390/nu12020482
38.
Ahmadi M Clare P Katzmarzyk P Del P Lee I Stamatakis E . Vigorous physical activity, incident heart disease, and cancer: how little is enough?Eur Heart J. (2022) 43:4801–14. 10.1093/eurheartj/ehac572
39.
Kokkinos P Faselis C Franklin B Lavie C Sidossis L Moore H et al Cardiorespiratory fitness, body mass index and heart failure incidence. Eur J Heart Fail. (2019) 21:436–44. 10.1002/ejhf.1433
40.
Franklin B Eijsvogels TM . A narrative review on exercise and cardiovascular disease: physical activity thresholds for optimizing health outcomes.Heart and Mind. (2023) 7:34–9. 10.4103/hm.hm_1_23
41.
Rader E Naimo M Ensey J Baker B . High-intensity stretch-shortening contraction training modifies responsivity of skeletal muscle in old male rats.Exp Gerontol. (2018) 104:118–26. 10.1016/j.exger.2018.02.009
42.
Kerkhoff A Moreira L Fuchs F Fuchs S . Association between hypertension and musculoskeletal complaints: a population-based study.J Hypertens. (2012) 30:2112–7. 10.1097/HJH.0b013e3283588268
43.
Coylewright M Reckelhoff J Ouyang P . Menopause and hypertension: an age-old debate.Hypertension. (2008) 51:952–9. 10.1161/HYPERTENSIONAHA.107.105742
44.
Zanchetti A Facchetti R Cesana G Modena M Pirrelli A Sega R . Menopause-related blood pressure increase and its relationship to age and body mass index: the simona epidemiological study.J Hypertens. (2005) 23:2269–76. 10.1097/01.hjh.0000194118.35098.43
45.
Guo X Zhao B Chen T Hao B Yang T Xu H . Multimorbidity in the elderly in china based on the china health and retirement longitudinal study.PLoS One. (2021) 16:e255908. 10.1371/journal.pone.0255908
46.
Chen Y Chen Z Lu Y Zheng Y Wang W . Analysis of differences in smoking types among resident of quanzhou city in 2020.Chinese J Health Educ. (2025) 41:421–5. 10.16168/j.cnki.issn.10029982.2025.05.007
47.
Wang C Xiao D . 2020 report on health hazards of smoking in china: an updated summary.Chin Circulation J. (2021) 36:937–52. 10.3969/j.issn.1000-3614.2021.10.001
48.
Jeon H Salinas D Baker D . Non-linear education gradient across the nutrition transition: mothers’ overweight and the population education transition.Public Health Nutr. (2015) 18:3172–82. 10.1017/S1368980015001640
49.
Smith W Anderson E Salinas D Horvatek R Baker DP . A meta-analysis of education effects on chronic disease: the causal dynamics of the population education transition curve.Soc Sci Med. (2015) 127:29–40. 10.1016/j.socscimed.2014.10.027
50.
Capistrant B Moon J Glymour M . Spousal caregiving and incident hypertension.Am J Hypertens. (2012) 25:437–43. 10.1038/ajh.2011.232
51.
Liu L Xu N Wang L . Moderating role of self-efficacy on the associations of social support with depressive and anxiety symptoms in chinese patients with rheumatoid arthritis.Neuropsychiatr Dis Treat. (2017) 13:2141–50. 10.2147/NDT.S137233
52.
Sharma R Dow-Fleisner S Struik L . Preventing and addressing youth vaping in british columbia, canada: evidence from triangulation of a scoping review of vaping policy and qualitative interviews with school-aged youth.Prev Med Rep. (2025) 51:102988. 10.1016/j.pmedr.2025.102988
53.
Gelman A . Struggles with survey weighting and regression modeling.Stat Sci. (2007) 22:153–64. 10.1214/088342306000000691
54.
Winship C Radbill L . Sampling weights and regression analysis.Sociol Methods Res. (1994) 23:230–57. 10.1177/0049124194023002004
Summary
Keywords
physical activity, chronic disease, multimorbidity pattern, middle-aged and older adults, China
Citation
Wen X and Yang X (2025) Association between physical activity and chronic disease multimorbidity patterns in Chinese middle-aged and older adults. Front. Med. 12:1582846. doi: 10.3389/fmed.2025.1582846
Received
25 February 2025
Accepted
15 September 2025
Published
29 September 2025
Volume
12 - 2025
Edited by
Marios Kyriazis, National Gerontology Centre, Cyprus
Reviewed by
Soham Al Snih, University of Texas Medical Branch at Galveston, United States
Sorina Eftim, ICF, United States
Updates
Copyright
© 2025 Wen and Yang.
This is an open-access article distributed under the terms of the Creative Commons Attribution License (CC BY). The use, distribution or reproduction in other forums is permitted, provided the original author(s) and the copyright owner(s) are credited and that the original publication in this journal is cited, in accordance with accepted academic practice. No use, distribution or reproduction is permitted which does not comply with these terms.
*Correspondence: Xinmei Yang, yangxinmei@fjwzy.edu.cn
Disclaimer
All claims expressed in this article are solely those of the authors and do not necessarily represent those of their affiliated organizations, or those of the publisher, the editors and the reviewers. Any product that may be evaluated in this article or claim that may be made by its manufacturer is not guaranteed or endorsed by the publisher.