 Haoran Mu1†
 Qilun Zhang2†Wenyao Huang1Qiang Pan1
 Yan Zhang3Yanyan Lu4Zhangxiang Zhu1Xu Jiang1
 Guojuan Wang1Mao Zheng5*
 Li Chen1*
- 1Department of Endocrinology, The Third Affiliated Hospital of Anhui Medical University (The First People's Hospital of Hefei), Hefei, Anhui, China
- 2Department of Central Laboratory, The Third People's Hospital of Bengbu Affiliated to Bengbu Medical University (Bengbu Central Hospital), Bengbu, Anhui, China
- 3Department of Health Service Management, Anhui Medical University, Hefei, Anhui, China
- 4Department of Laboratory, The Third Affiliated Hospital of Anhui Medical University (The First People’s Hospital of Hefei), Hefei, Anhui, China
- 5Department of Endocrinology, The First Affiliated Hospital of USTC, Division of Life Sciences and Medicine, University of Science and Technology of China, Hefei, Anhui, China
Background: To evaluate the potential of the serum uric acid to serum creatinine ratio (SUA/SCr) as a diagnostic biomarker for normoalbuminuric diabetic kidney disease (NADKD).
Methods: We retrospectively analyzed demographic and biochemical data from 3,101 type 2 diabetes patients. Patients were stratified into non-diabetic kidney disease (non-DKD), albuminuric diabetic kidney disease (ADKD), and NADKD groups according to their estimated glomerular filtration rate (eGFR), urinary albumin creatinine ratio (UACR), and urinary albumin excretion rate (UAER). We employed multivariate logistic regression analyses using a stepwise forward-LR method to develop a nomogram. Both area under the curve (AUC) from receiver operating characteristic (ROC), and calibration curves were employed to assess the predictive accuracy of the nomogram. A decision curve analysis (DCA) was conducted to assess the clinical utility of the nomogram.
Results: SUA/SCr, along with glycosylated hemoglobin A1c (HbA1C) and fasting plasma glucose (FPG), showed significant associations with NADKD, both pre- and post-propensity score matching (PSM). Seven variables were incorporated into the risk nomogram. The calibration plots indicated strong agreement between predicted and observed outcomes in both training and validation cohorts. The NADKD risk model demonstrated robust performance, as evidenced by the AUC from ROC analysis and DCA.
Conclusion: SUA/SCr is a significant and independent predictor of NADKD risk. The developed nomograms offer valuable tools for clinical decision-making, potentially enhancing diagnostic accuracy for NADKD in type 2 diabetes patients.
1 Introduction
Diabetes represents a significant public health challenge worldwide. Among its complications, diabetic kidney disease (DKD) stands out as a predominant microvascular issue that can progress to end-stage renal disease (ESRD) (1–5). Approximately 20–40% of diabetes patients with concurrent DKD face heightened risks of cardiovascular events, including sudden cardiac death, myocardial infarction, and diabetic cardiomyopathy (6–11). Classical DKD is characterized by glomerular hyperfiltration, microalbuminuria, overt proteinuria, and a progressive decline in the estimated glomerular filtration rate (eGFR), ultimately leading to ESRD (12, 13). The severity of albuminuria correlates with increased risks of cardiovascular disease, chronic kidney disease progression, and mortality (10).
In recent years, epidemiological studies have reported a growing prevalence of normoalbuminuric diabetic kidney disease (NADKD) in patients with type 2 diabetes (5, 14–18). Patients with NADKD face a high risk of mortality and vascular events (16, 19–22), particularly those under 65 years of age (23). Moreover, NADKD serves as a robust predictor of all-cause mortality in type 2 diabetes patients (16), underscoring the importance of early diagnosis and intervention.
Serum uric acid to serum creatinine ratio (SUA/SCr) assesses serum uric acid (SUA) levels after standardizing the degree of renal function and reflects the net production of uric acid which is significantly correlated with the metabolic syndrome (24, 25) and is regarded as a novel risk factor for cardiovascular disease (26, 27). Recent studies have found SUA/SCr to be an independent risk factor for DKD (28), which was associated with a future decline in renal function in diabetes patients (25, 29). In our previous study, we observed that within the normal urinary albumin creatinine ratio (UACR) group of type 2 diabetes patients, SUA/SCr was lower in those with reduced eGFR compared to those with normal eGFR (28). This led us to hypothesize that SUA/SCr could potentially serve as a practical biomarker for identifying NADKD. However, due to limitations in sample size and other factors, the relationship between SUA/SCr and NADKD was not fully elucidated. To address this gap, we have expanded the sample size and collected comprehensive clinical data and biochemical parameters of diabetes patients treated at the Third Affiliated Hospital of Anhui Medical University during 2010–2023 in current study.
2 Materials and methods
2.1 Patients and procedures
The inclusion criteria consisted of patients diagnosed with type 2 diabetes in accordance with the diagnostic and classification criteria of the American Diabetes Association (ADA) (2024 edition) (30). Exclusion criteria encompassed type 1 diabetes, gestational diabetes, other specific types of diabetes, malignant tumors, liver disease, primary renal disease, acute and chronic infections, severe cardiac abnormalities, cases with incomplete data and those taking medications which affect uric acid and urinary protein levels including uric acid lowering agents, diuretics, sodium-glucose cotransporter 2 inhibitors and finelidone.
2.2 Data collection
We selected possible risk factors and indicators associated with NADKD from previous studies (14, 19, 28, 31–33). So, demographic data, including age, gender, height, weight, smoking history, family history of diabetes (with at least one first-degree relative affected), duration of diabetes, history of hypertension, and previous medication use, were collected from the electronic medical record system of the Third Affiliated Hospital of Anhui Medical University.
Laboratory data comprised measurements of blood urea nitrogen (BUN), serum uric acid (SUA), serum creatinine (SCr), serum cystatin-C (SCysc), glycosylated hemoglobin A1c (HbA1C), fasting plasma glucose (FPG), triglycerides (TG), total cholesterol (TCH), high-density lipoprotein (HDL), low-density lipoprotein (LDL), alanine transaminase (ALT), and aspartate transaminase (AST). Blood samples were obtained following an 8–10 h overnight fast for biochemical analysis. These parameters were measured using standard enzymatic methods with the Beckman Coulter Unicel DxC800 system (Anhui SenaiChi Hospital Management Co., Ltd.). HbA1C was assessed using high-performance liquid chromatography with the Arkray HA-1880 system (Anhui Guoke Kangyi Medical Technology Co., Ltd.). Morning spot urine samples were collected for the urinary albumin creatinine ratio (UACR) test, estimated via the dry immunomarker scattering quantitative method using the Abbott AFINION 2 system (Anhui Shunkang Medical Equipment Co., Ltd.).
2.3 Definition, groups, and assignment
DKD was defined as a UACR ≥30 mg/g and/or an eGFR <60 mL/(min 1.73 m2) persisting for over 3 months, absent other renal impairment causes in type 2 diabetes patients (3, 10). NADKD was defined based on previous study (5, 17, 34–36) as: (1) eGFR <60 mL/(min 1.73 m2); (2) at least 2 instances of urinary protein excretion <20 μg/min within 6 months, or a UAER <30 mg/24 h (under normal antihypertensive drug use), or UACR <30 mg/g; (3) exclusion of acute kidney injury, other causes of reduced eGFR, and secondary renal diseases. Albuminuric diabetic kidney disease (ADKD) was defined as DKD with UACR ≥30 mg/g sustained for over 3 months, irrespective of eGFR status.
2.4 eGFR collaboration formula
The eGFR was calculated using the standard Chronic Kidney Disease Epidemiology (CKD-EPI) Collaboration formula (37):
Note:
a value: 130 for women, 135 for men.
b value: 0.7 for women, 0.9 for men.
c value: −0.248 for women with SCr ≤ 0.7 mg/dL and −0.601 for women with SCr > 0.7 mg/dL; −0.207 for men with SCr ≤ 0.9 mg/dL and −0.601 for men with SCr > 0.9 mg/dL.
d value: −0.375 for SCysc ≤ 0.8 mg/dL and −0.711 for SCysc > 0.8 mg/dL.
2.5 Statistical analysis
To mitigate the influence and imbalance of variables such as age, gender, duration of diabetes, body mass index (BMI), family history of diabetes, history of hypertension, and smoking history, propensity score matching (PSM) was employed. The NADKD group was matched with the ADKD group using a 1:2 nearest neighbor matching method without replacement, with a caliper value set at 0.02. Balance of control variables was assessed before and after matching.
Statistical analyses were conducted using R version: 3.5.1 and IBM SPSS 26.0. Data with normal distribution were expressed as mean ± standard deviation, while non-normally distributed data were presented as median and interquartile range (IQR, 25–75%). Categorical variables were expressed as percentages or ratios. Differences between groups were analyzed using chi-square tests or t-tests for normally distributed data, and Kruskal-Wallis or Mann–Whitney U tests for non-normally distributed data. Binary logistic regression analyses were performed to evaluate the correlation between SUA/SCr and NADKD, adjusting for other covariates. Multivariate logistic regression analyses were conducted using a stepwise regression method (forward-LR) to construct the nomogram. Nomogram were developed using the “rms” package based on independent predictors, with calibration plots assessing calibration ability. Receiver operating characteristic (ROC) curves were generated, and the area under the curve (AUC) was calculated to evaluate discrimination. Decision curve analysis (DCA) was also utilized to assess nomogram performance. A p-value of <0.05 was considered statistically significant.
3 Results
3.1 Clinical characteristics of type 2 diabetes patients grouped according to the SUA/SCr tertiles
We reviewed data from 3,101 patients with type 2 diabetes at the Third Affiliated Hospital of Anhui Medical University, spanning from 2010 to 2023 (Figure 1). Based on their tertiles of SUA/SCr, patients were divided into three groups of Tertile 1, Tertile 2, and Tertile 3 (Table 1). Many parameters, including age, gender, duration of diabetes, BMI, BUN, Cysc, HbA1c, and eGFR, as well as the proportions of HBP history and smoking history, showed significant differences between the three groups. The eGFR values were lowest in the Tertile 1 group and highest in the Tertile 3 group, accompanied by an SUA/SCr increase, and we also observed that the prevalence of NADKD were highest in the Tertile 1 group and lowest in the Tertile 3 group.
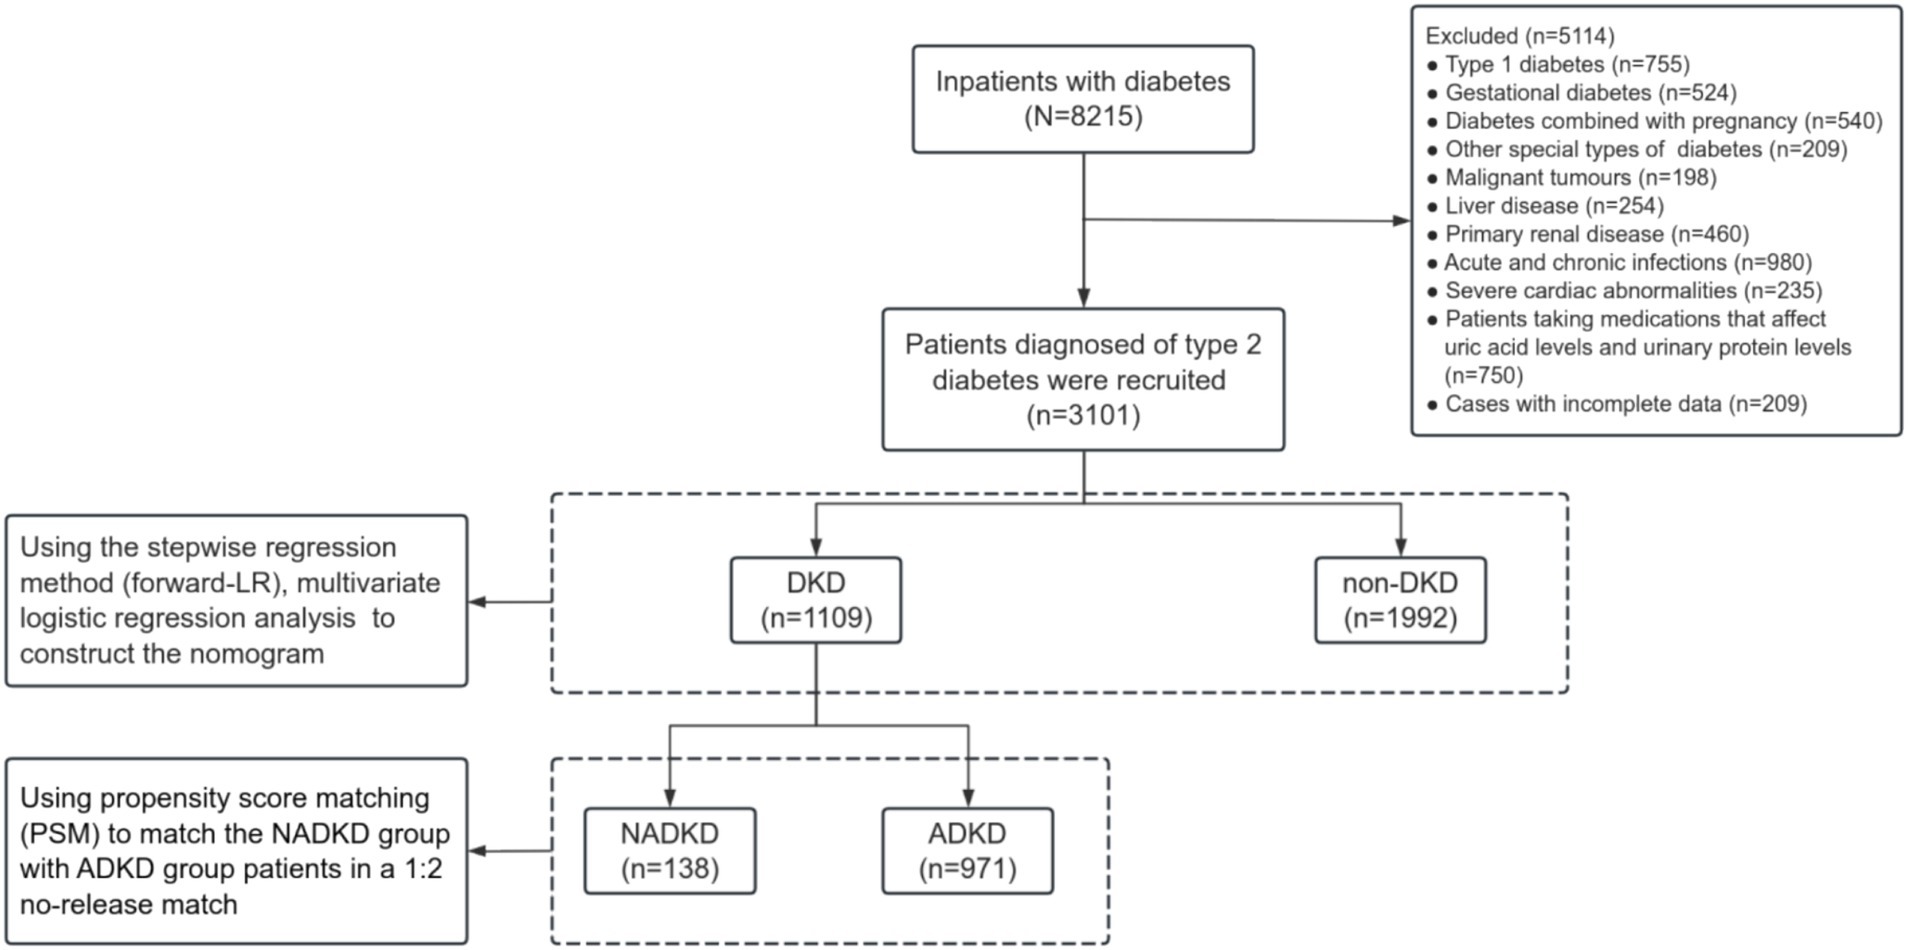
Figure 1. The workflow of this study.
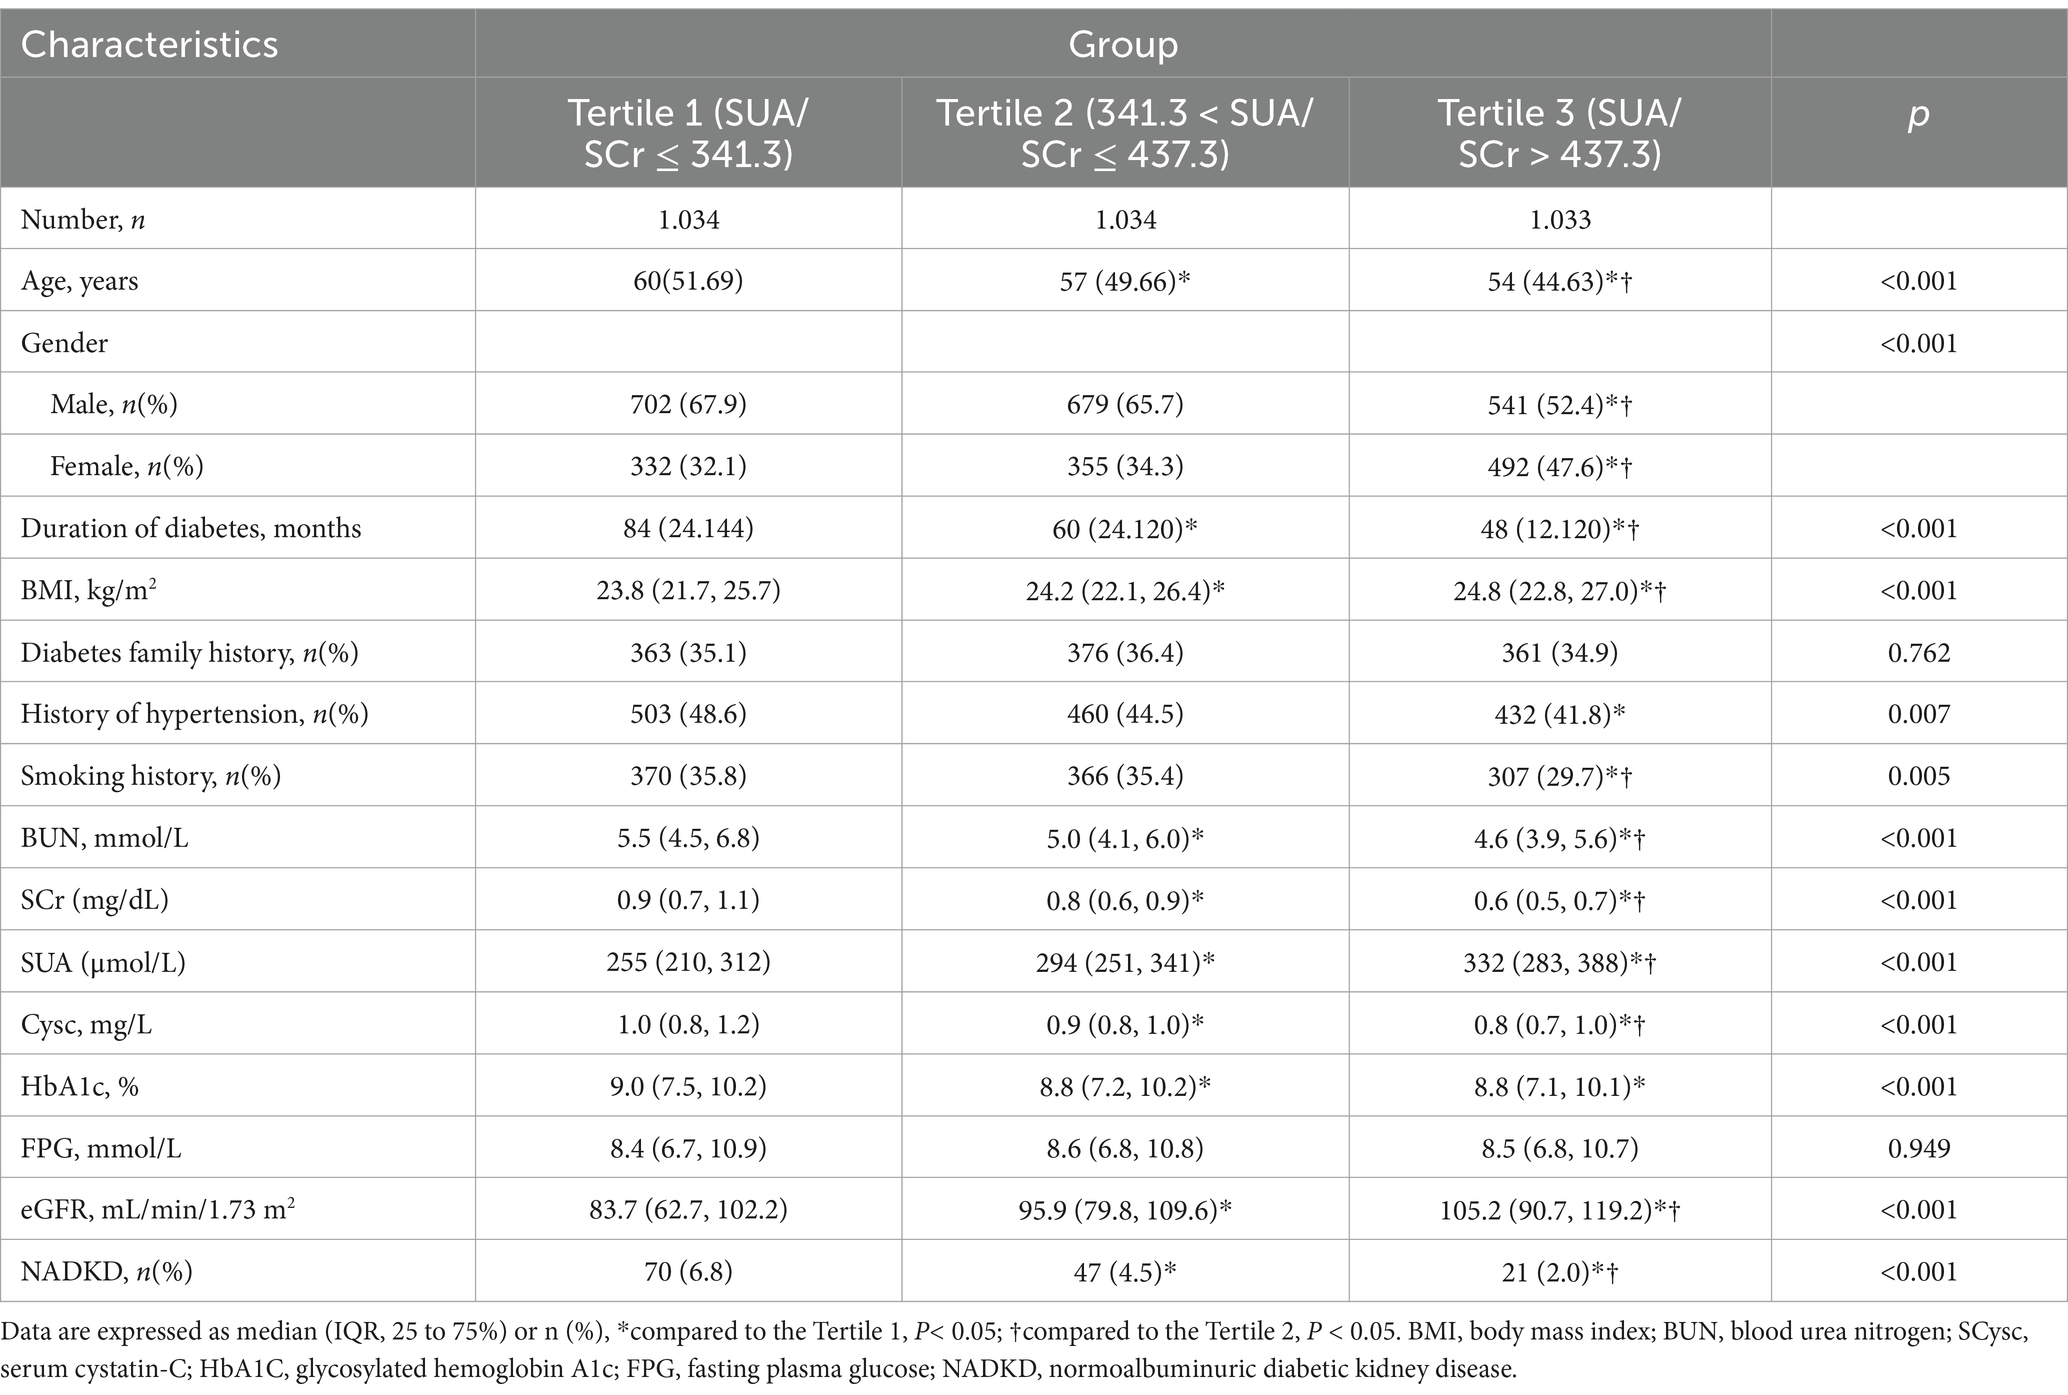
Table 1. Characteristics of T2DM patients according to the SUA/SCr tertiles.
3.2 The correlation between SUA/SCr and eGFR
To explore the relationship between SUA/SCr and eGFR, we conducted a visual analysis using a scatter plot. Figure 2 displays the scatter plot of SUA/SCr versus eGFR. From the plot, it is evident that the data points exhibit a clear upward trend (p < 0.0001, r = 0.4368).
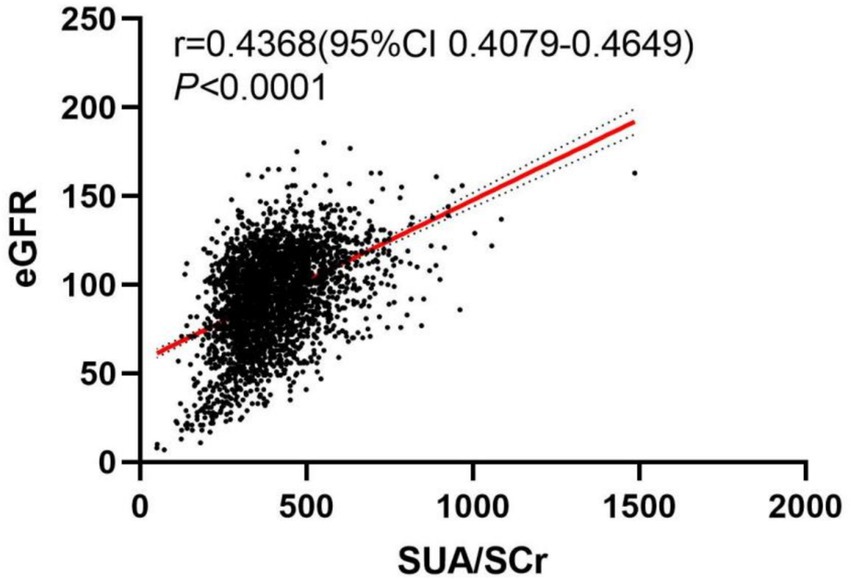
Figure 2. The scatter plot between SUA/SCr and eGFR.
3.3 Clinical characteristics of NADKD and ADKD
Based on eGFR, UACR, or UAER, patients were classified into NADKD (n = 138), ADKD, (n = 971), and non-DKD (n = 1992) groups (Supplementary Table S1). NADKD accounted for 12.4% of all DKD cases (138/1109). As shown in Figure 3, SUA/SCr exhibits significant differences among three groups.
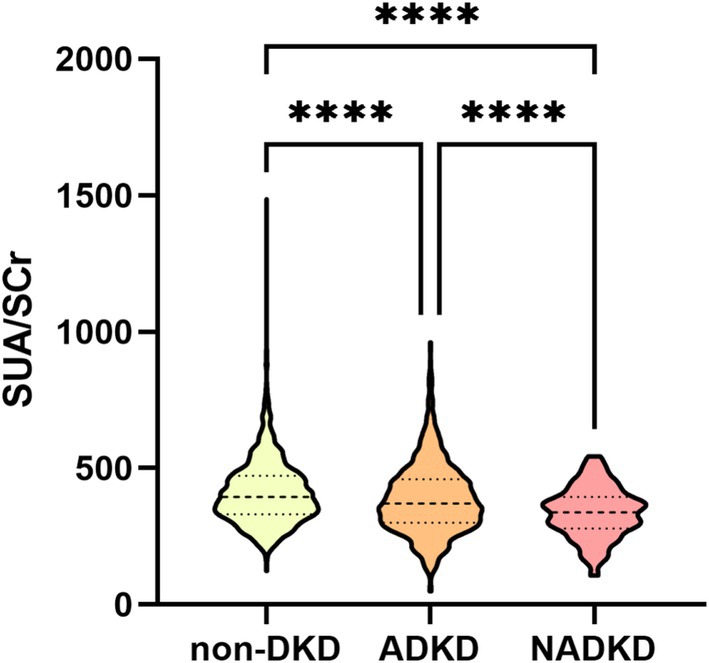
Figure 3. Violin plot of SUA/SCr between non-DKD, ADKD and NADKD groups.
Post-matching analysis revealed that, compared to the ADKD group, the NADKD group had significantly lower levels of HbA1c, FPG, SUA/SCr, and eGFR (p < 0.05), while age, BUN, SUA, SCr, and Cysc were significantly higher (p < 0.05) (Table 2).
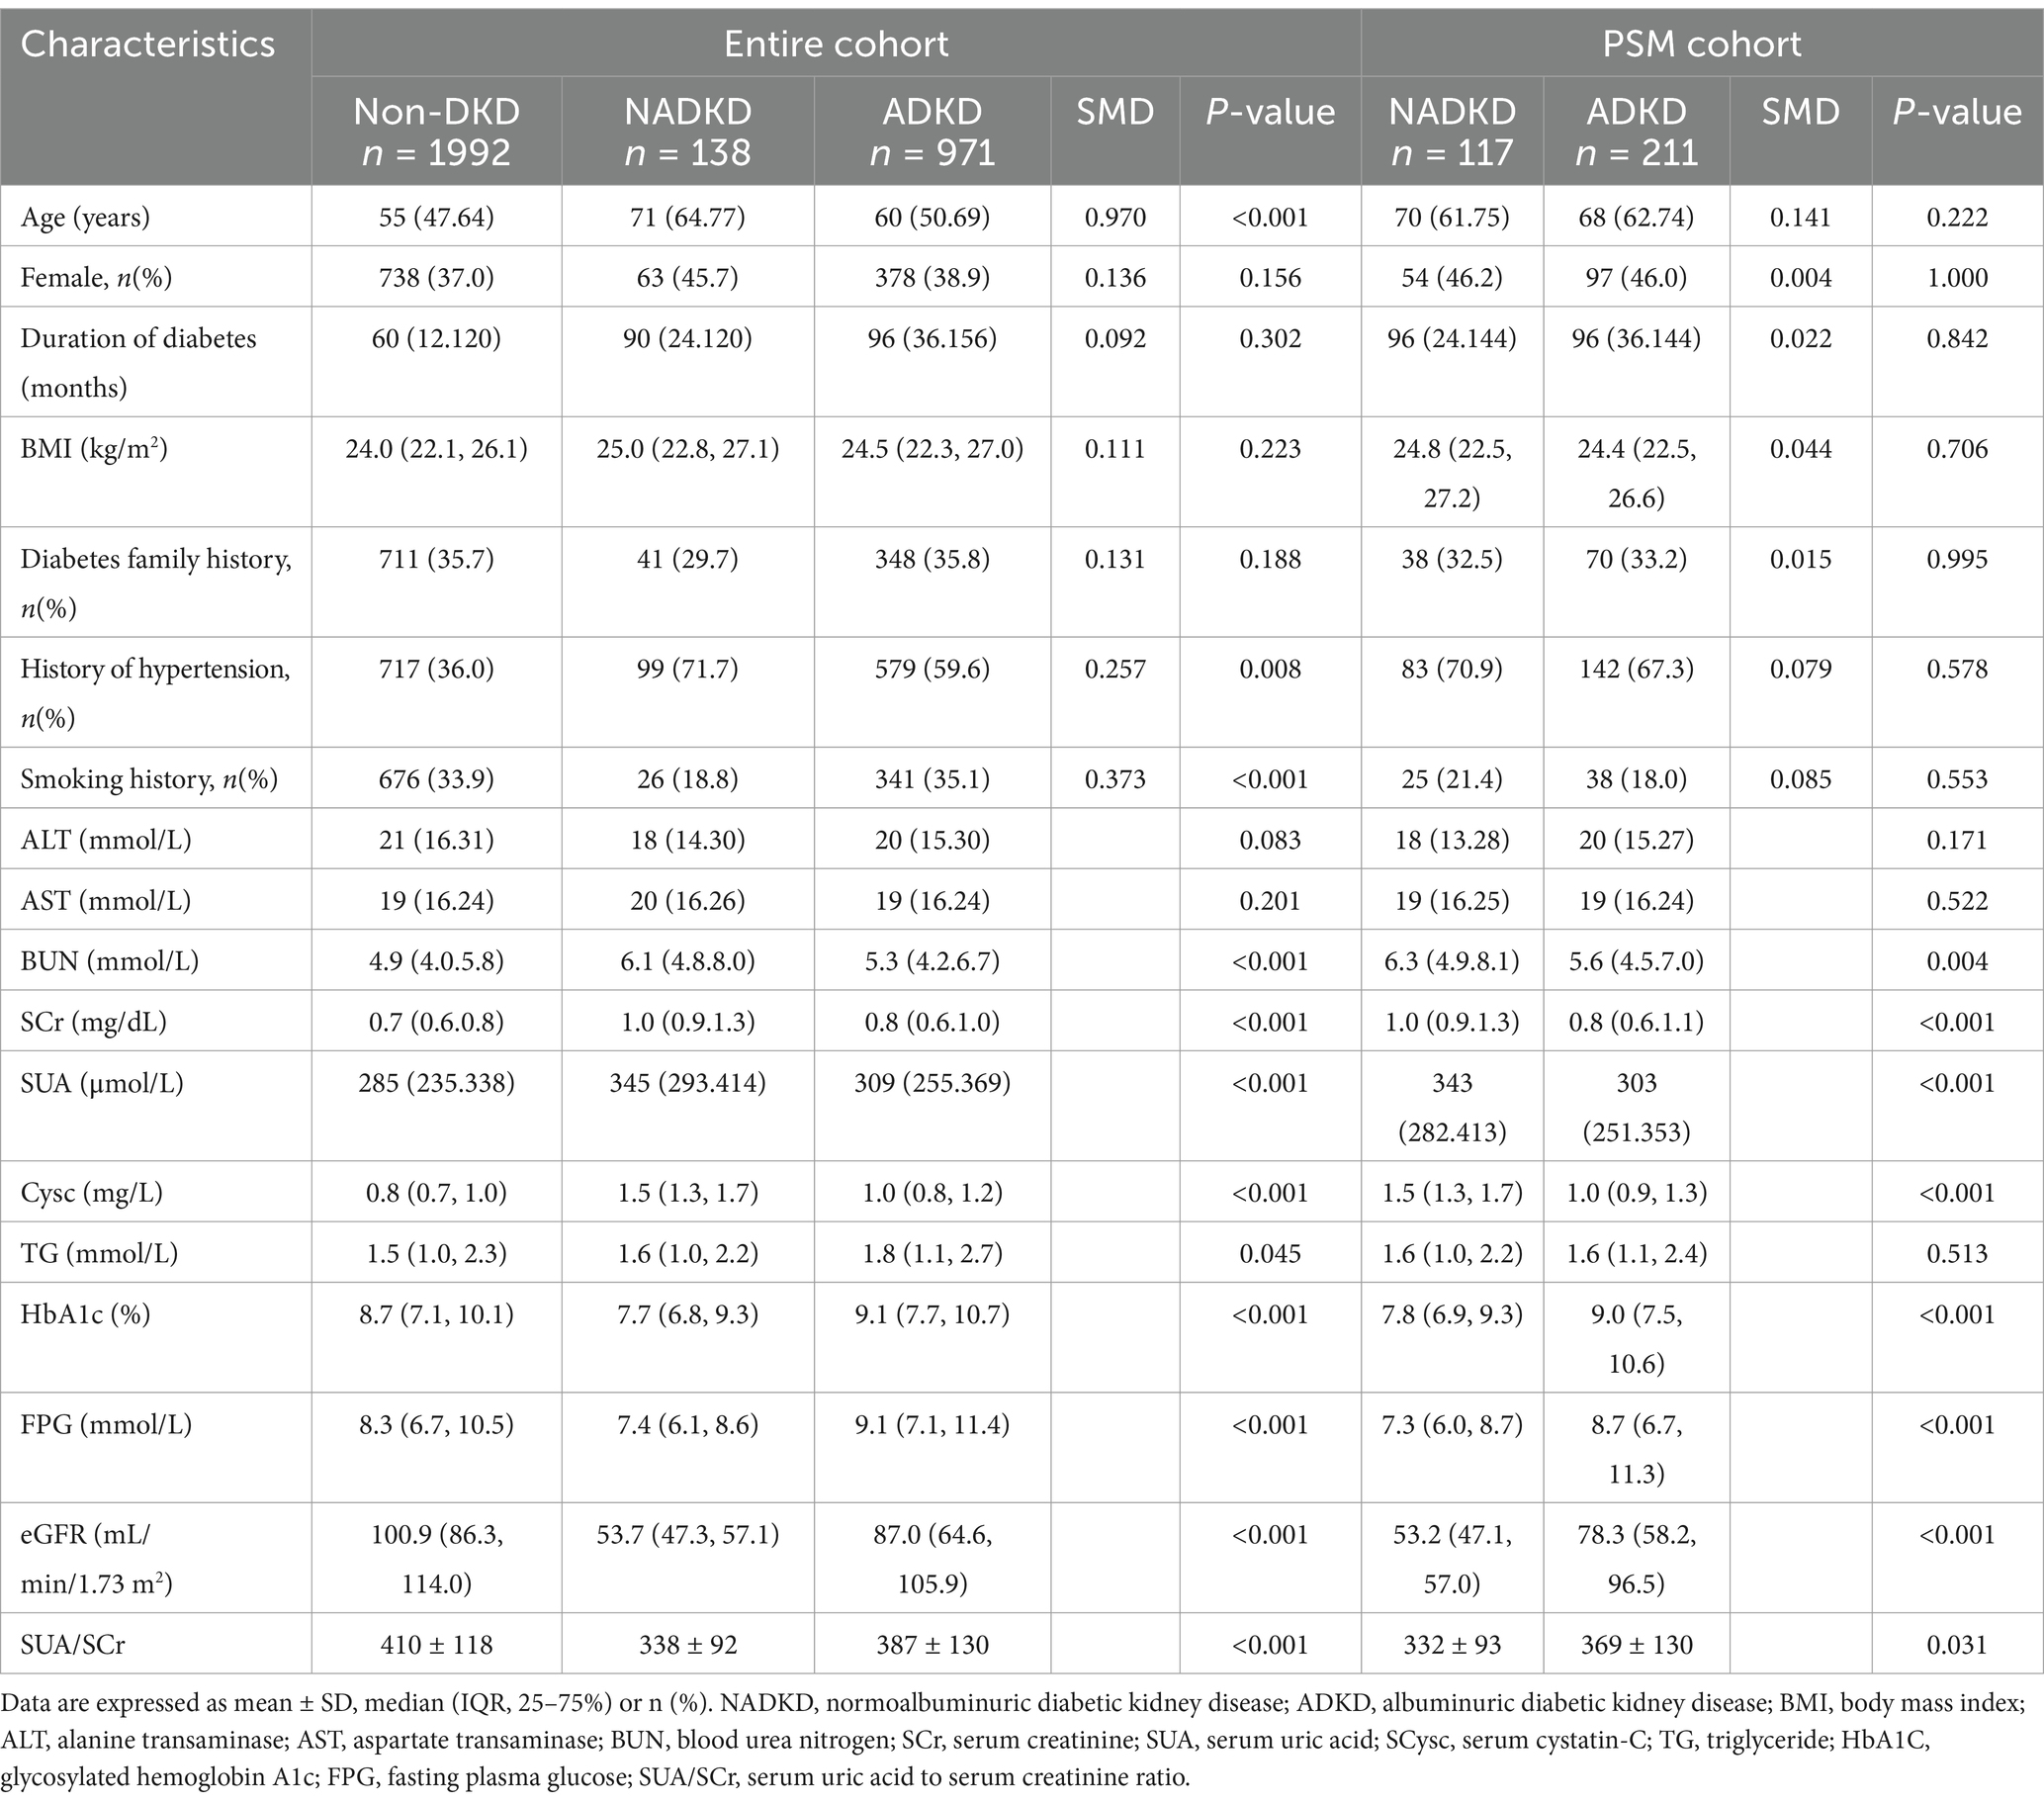
Table 2. Baseline clinical characteristics before and after propensity score matching between the NADKD and ADKD groups.
3.4 SUA/SCr as an independent risk predictor for NADKD
In our logistic regression analysis, we identified SUA/SCr as significantly associated with NADKD, even after adjusting for potential confounders (Table 3). Through stepwise regression, we further identified seven independent risk predictors for NADKD: age, HbA1c, BUN, SUA/SCr, BMI, duration of diabetes, and smoking history (Table 4). According to the results in the Supplementary Table S2, the P-value for SUA/SCr in the multivariable logistic regression is greater than 0.05, so SUA/SCr cannot be used as a diagnostic factor for ADKD (Supplementary Table S2).
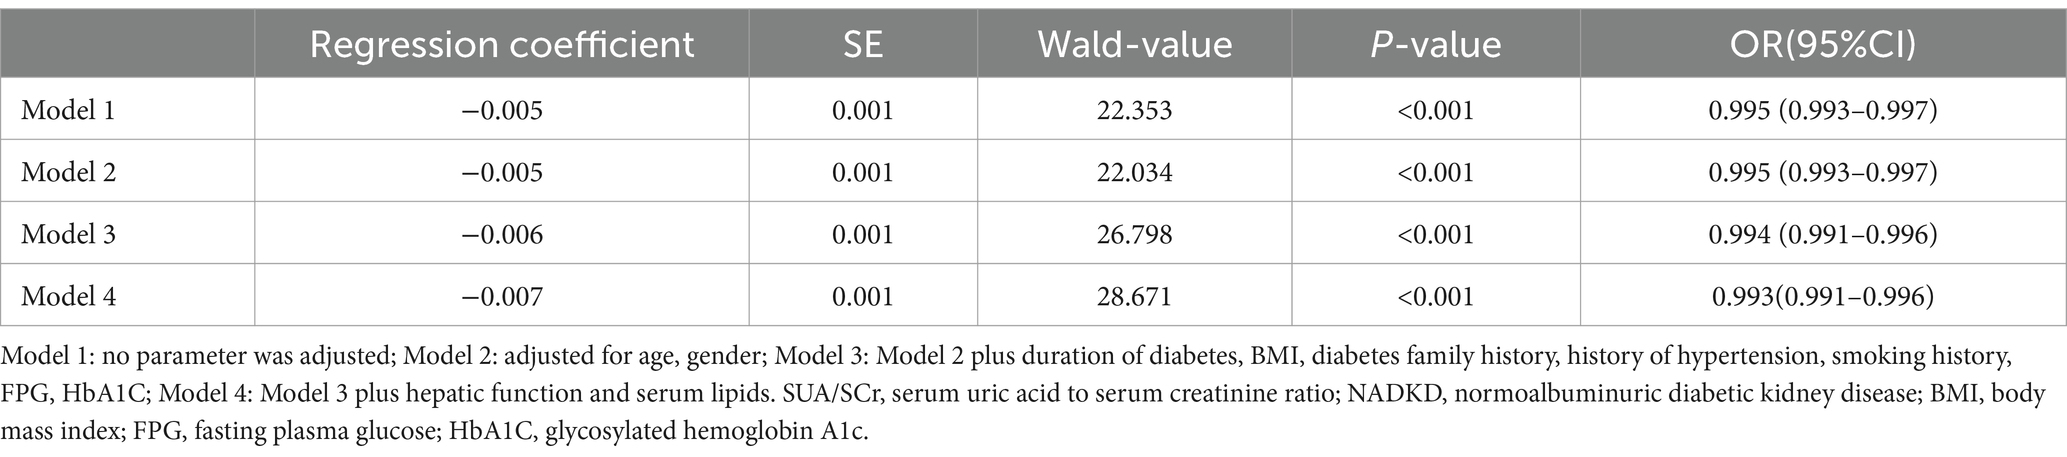
Table 3. Correlation between SUA/SCr and NADKD in type 2 diabetes patients.
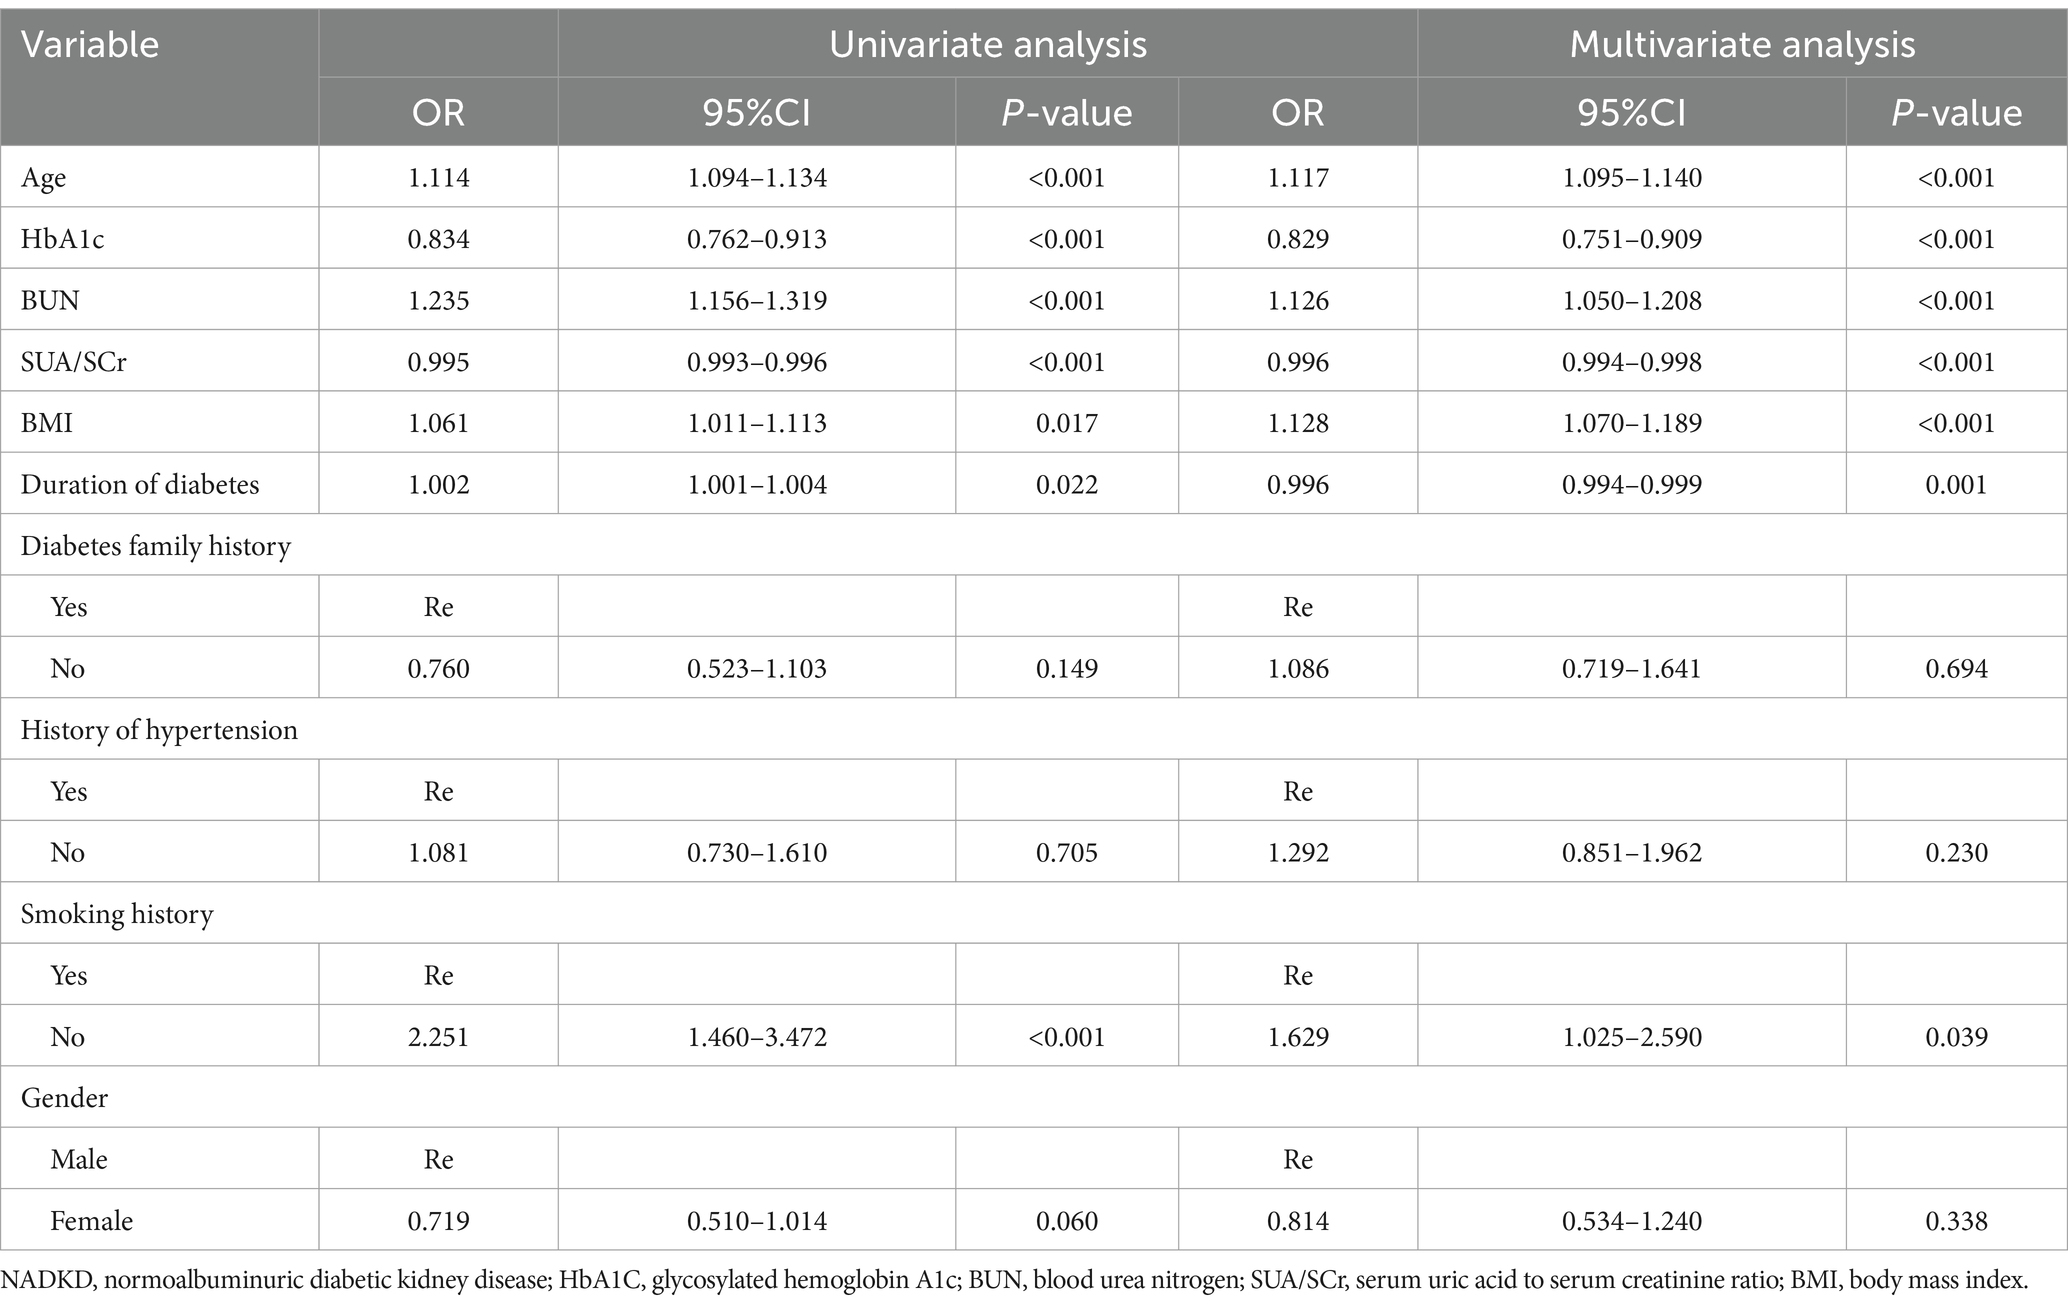
Table 4. Univariate and multivariate logistic analyses associated with NADKD.
3.5 Diagnostic nomogram model establishment and validation
Using these independent predictors, we developed a diagnostic nomogram to assess NADKD risk (Figure 4). We randomly divided the 3,101 type 2 diabetes patients into training (70%) and validation cohorts (30%). Our ROC curves demonstrated AUC values of 0.867 (95% CI: 0.835–0.900) for the training cohort and 0.874 (95% CI: 0.834–0.915) for the validation cohort. In the training cohort, we found a cutoff value of 0.028, with sensitivity and specificity of 0.905 and 0.690, respectively, resulting in a Youden index of 0.595. For the validation cohort, the cutoff was 0.046, with sensitivity and specificity of 0.907 and 0.726, resulting in a Youden index of 0.633. The results demonstrate a consistent level of accuracy (Figures 5A,B). The calibration curve showed that the bias-corrected lines for the training and validation cohorts were close to the ideal lines (Figures 5C,D). DCA depicted the clinical net benefit achievable across varying risk thresholds (Figures 5E,F). The threshold ranges for DCA were derived from the training and validation cohorts based on the sensitivity and specificity of the model. Interventions were undertaken on patients whose assessed risk fell within the defined threshold range. Compared to the alternative of either intervening or not intervening on all patients, this approach yielded a superior net benefit.
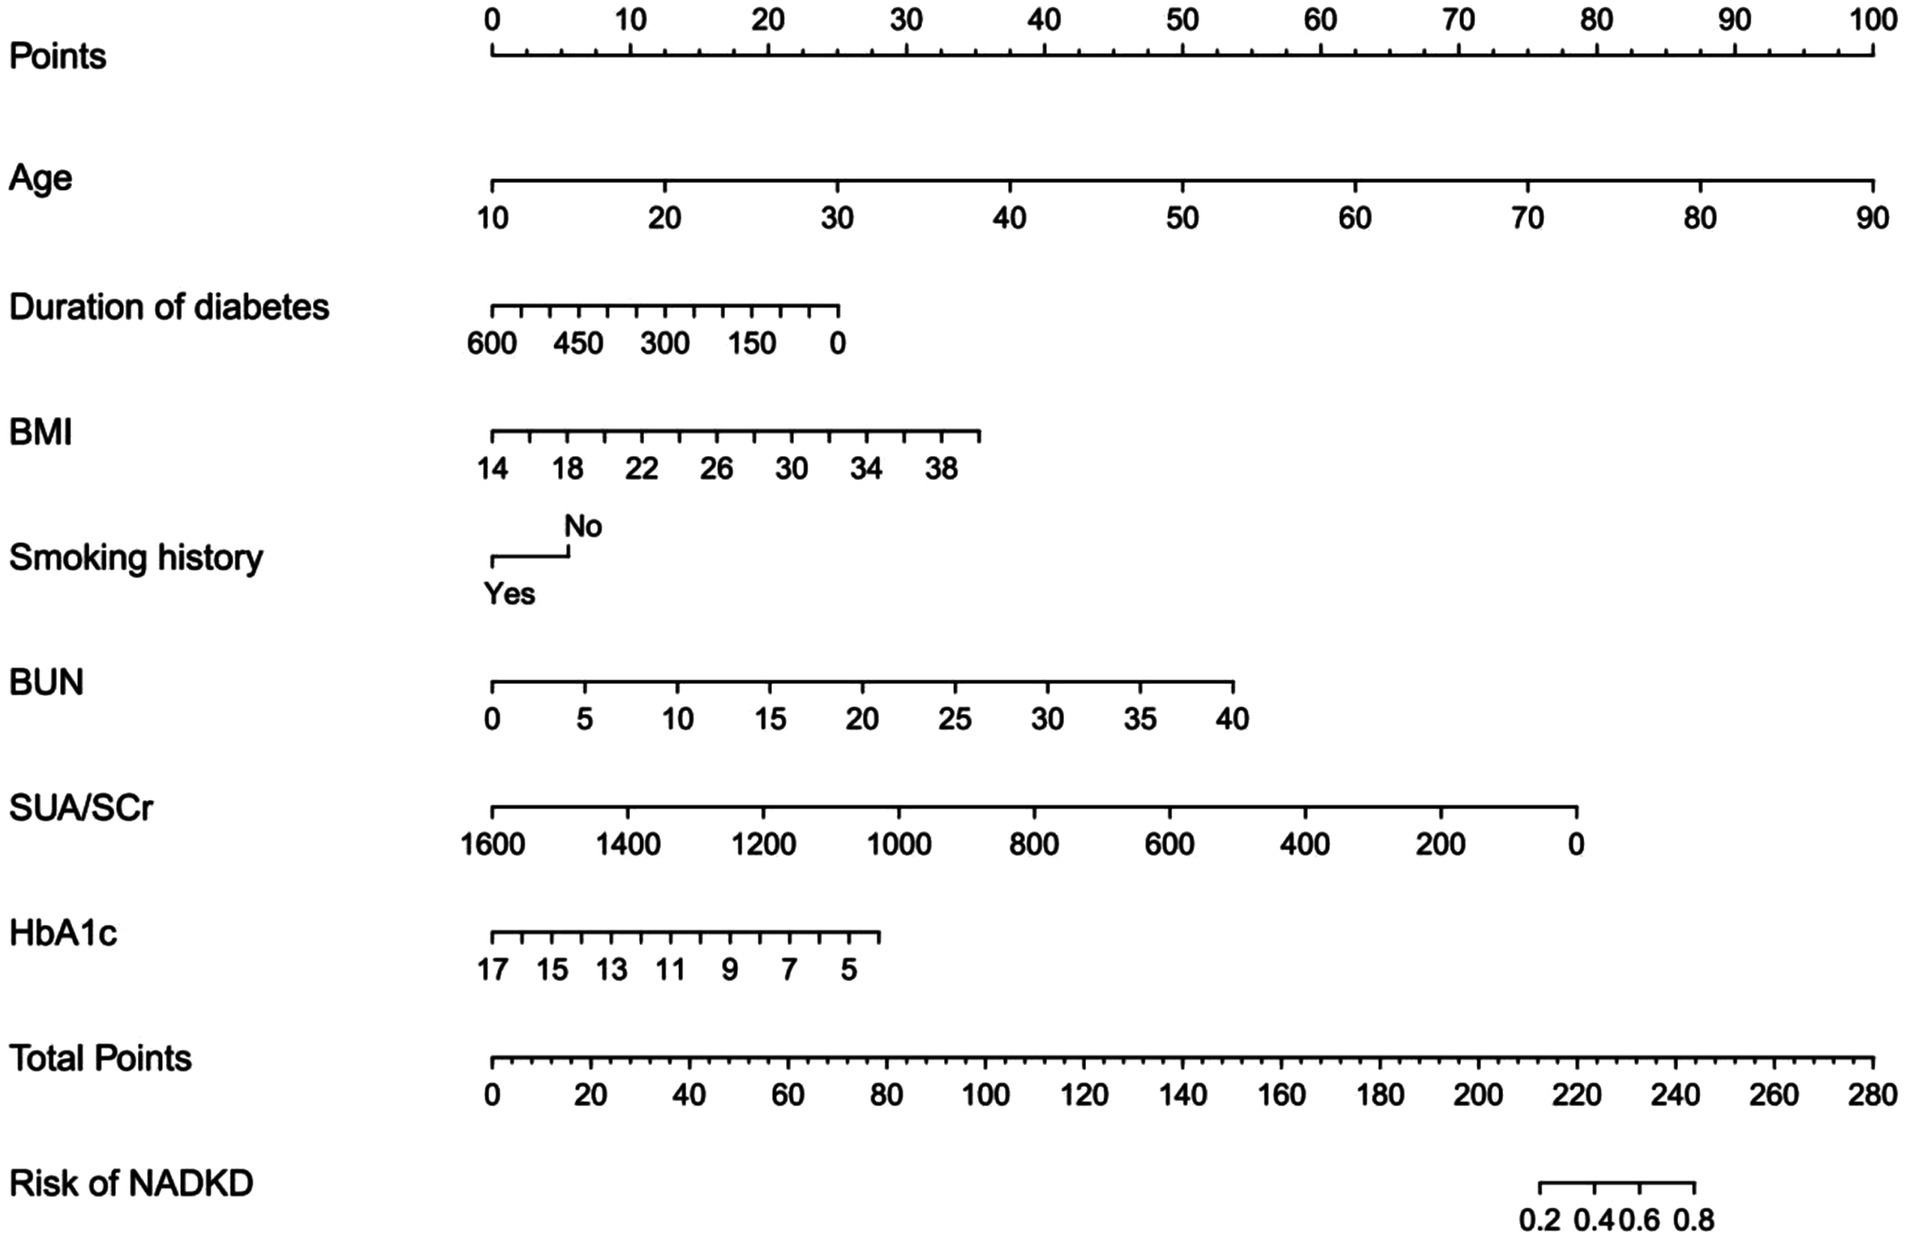
Figure 4. Diagnostic nomogram for the risk of NADKD. Nomogram including age, duration of diabetes (months), BMI, smoking history, BUN, SUA/SCr, HbA1c, and the risk of NADKD in type 2 diabetes patients. The nomogram allows the user to obtain the probability of the risk of NADKD corresponding to a patient’s combination of covariates.
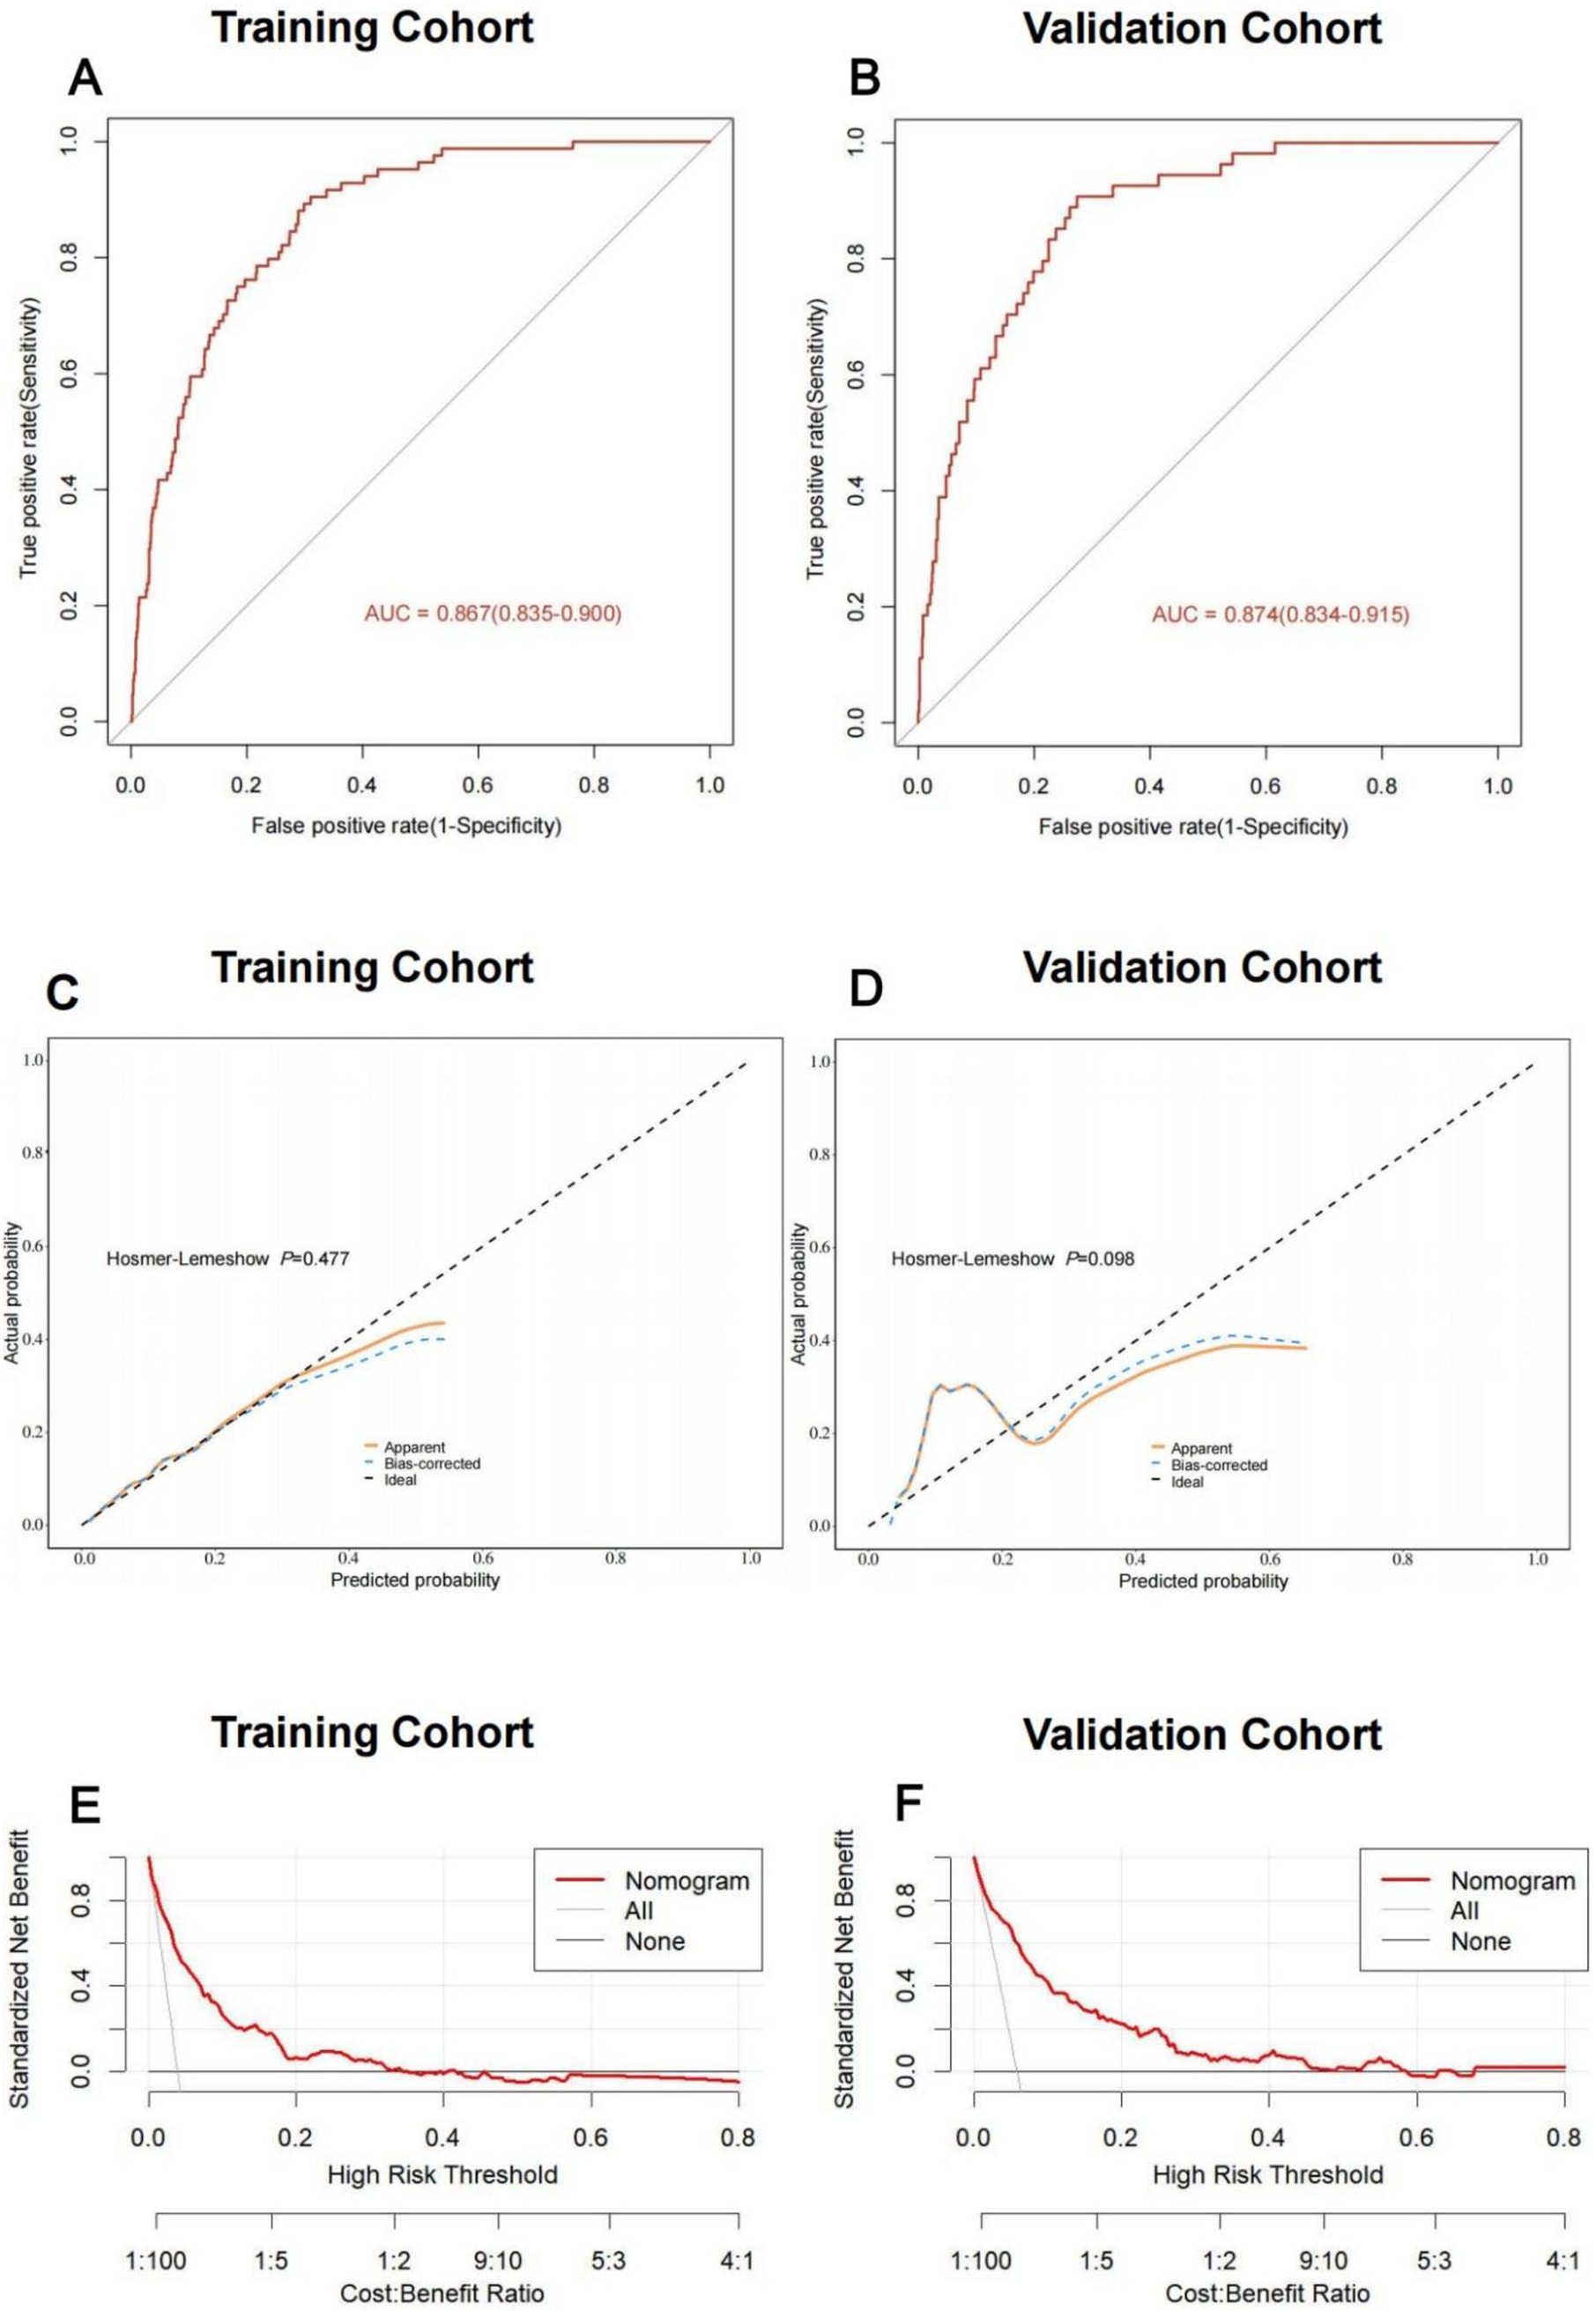
Figure 5. Discriminative ability and clinical usefulness of the predict model for the risk of NADKD. The ROC curves of nomogram in the training cohort (A), validation cohort (B). The calibration curves of nomogram in the training cohort (C), validation cohort (D). Actual the risk of NADKD is plotted on the y-axis; nomogram predicted probability for the risk of NADKD is plotted on the x-axis. The DCA curves of nomogram in the training cohort (E), validation cohort (F).
4 Discussion
DKD is a prevalent complication of diabetes, traditionally characterized by the onset of proteinuria preceding a decline in GFR. However, recent studies have identified a subset of patients with diabetes who experience a reduction in GFR without proteinuria, termed NADKD (5, 13–16, 21, 38). These patients are at an elevated risk for mortality and vascular events (16, 19–23). Current diagnostic approaches, reliant on GFR and UAER/UACR, are influenced by various factors and present accessibility challenges (5, 17). Gold-standard GFR measurement techniques, such as inulin clearance and renal Emission Computed Tomography, are not routinely available in clinical settings. Instead, eGFR is commonly used but is also influenced by many factors and is less accurate in the early stages of DKD (38, 39). Additionally, urinary albumin levels can be affected by conditions such as fever, infection, and hypertension (10, 40, 41). Currently, biomarkers such as neutrophil gelatinase-associated lipocalin (NGAL), retinol binding protein (RBP), monocyte chemoattractant protein-1 (MCP-1) and kidney injury molecule-1 (KIM-1) play a significant role in the early diagnosis and monitoring of kidney damage progression and hold diagnostic value for NADKD (42, 43). However, these biomarkers are more expensive, have complex detection methods, are not widely used in clinical practice, and have limited applicability. Therefore, there is a pressing need for simple and practical biomarkers for NADKD prediction and diagnosis, particularly in resource-limited areas.
In this study, we retrospectively analyzed data from 8,215 diabetes patients at our center from 2010 to 2023, ultimately including 3,101 patients after stringent screening. PSM analysis revealed a significant difference in SUA/SCr between NADKD and ADKD groups. Logistic regression analysis confirmed the significant association of SUA/SCr with NADKD after adjusting for confounders. Multivariate analysis identified age, smoking history, HbA1c, BUN, diabetes duration, BMI, and SUA/SCr as independent predictors of NADKD. We constructed and validated a nomogram based on these factors to predict NADKD risk in type 2 diabetes patients, demonstrating acceptable predictive performance through ROC and DCA.
SUA is the most abundant aqueous antioxidant in the human body. It has antioxidant properties, protects against DNA damage, participates in redox reactions, and scavenges oxygen free radicals, contributing to over 50% of the antioxidant capacity in human blood circulation. On the other hand, SUA may also induce pro-oxidant stress, primarily within cells, potentially involving free radicals, nitric oxide, and myeloperoxidase. However, SUA levels are closely related to renal excretion. The SUA/SCr ratio, as a novel biomarker of kidney function, can be used to evaluate the next generation of SUA (24, 25).
The prevalence of NADKD within DKD in type 2 diabetes patients has been reported to range from 7 to 50% (14, 16–18, 31, 32, 34, 44). Consistent with these findings, our study found that NADKD constituted 12.4% of DKD cases among type 2 diabetes inpatients. Remarkably, the prevalence of NADKD varied widely across different studies, which may be attributed to the difference of inclusion criteria, geography, diet, ethnicity, evaluation formula of eGFR and other factors.
The present study demonstrated significantly lower HbA1c levels in NADKD patients compared to the ADKD group, which is in accordance with previous studies (16–19, 31, 33). This may be attributed to deterioration in renal function, which increases the risk of anemia in patients (10). Previous research has indicated that anemic patients have lower HbA1c levels (45). Furthermore, as the severity of anemia increases, the reduction in HbA1c becomes more pronounced.
The etiology of NADKD remains uncertain, with a number of potential factors implicated in its pathogenesis including vascular factors, inflammatory response factors, drug-related factors, and so forth (43, 46, 47). Classical renal structural changes were seen less frequently in NADKD patients (48). Interstitial fibrosis exerts a more pronounced impact on the deterioration of renal function than glomerular injury and is not influenced by the quantity of albumin present in the urine (49). NADKD is distinguished by a reduction in renal function that is not accompanied by the presence of albuminuria. SUA/SCr reflects net uric acid production, we observed that the level of SUA did not show an entirely consistent manifestation with SCr. This phenomenon may be theoretically explained by impaired renal tubules. So, we postulate that interstitial injury is associated with NADKD. Furthermore, in instances of extensive tubulo-interstitial injury, the reabsorption of SUA is reduced, resulting in an elevation of SCr and a decline in the SUA/SCr ratio (50, 51). The above evidence may explain the use of SUA/SCr as a biomarker and diagnostic marker for NADKD.
This study has some limitations. Firstly, being a single-center retrospective study, it establishes associations rather than causality. Secondly, while PSM analysis minimized bias, prospective studies are needed further elucidate the SUA/SCr-NADKD relationship. Thirdly, Multicenter clinical validation is necessary to assess the external utility of our nomograms. Finally, the pathogenesis of NADKD remains to be elucidated, and the need for further animal and cellular studies is evident.
5 Conclusion
In summary, SUA/SCr has been identified as an independent risk factor and a diagnostic indicator for NADKD. The nomogram developed from SUA/SCr demonstrated strong predictive performance. These tools can aid clinicians in accurately identifying high-risk patients, allowing for tailored interventions that can improve patient outcomes.
Data availability statement
The raw data supporting the conclusions of this article will be made available by the authors, without undue reservation.
Ethics statement
The studies involving humans were approved by the Research Ethics Committee of the Third Affiliated Hospital of Anhui Medical University (No.2024–083-01). The studies were conducted in accordance with the local legislation and institutional requirements. Written informed consent for participation was not required from the participants or the participants’ legal guardians/next of kin in accordance with the national legislation and institutional requirements.
Author contributions
HM: Data curation, Formal analysis, Resources, Visualization, Writing – original draft. QZ: Data curation, Software, Supervision, Writing – original draft. WH: Methodology, Supervision, Validation, Writing – review & editing. QP: Data curation, Supervision, Validation, Writing – review & editing. YZ: Investigation, Supervision, Validation, Writing – review & editing. YL: Resources, Software, Data curation, Writing – review & editing. ZZ: Data curation, Formal analysis, Writing – review & editing. XJ: Data curation, Investigation, Supervision, Writing – review & editing. GW: Conceptualization, Supervision, Validation, Writing – review & editing. MZ: Writing – original draft, Writing – review & editing. LC: Funding acquisition, Project administration, Resources, Supervision, Validation, Writing – review & editing, Writing – original draft.
Funding
The author(s) declare that financial support was received for the research and/or publication of this article. This research was supported by the 2022 Basic and Clinical Collaborative Research Enhancement Plan of the Third Affiliated Hospital of Anhui Medical University (2022sfy005), the Scientific Project of the Anhui Provincial Health Commission (AHWJ2022a039) and the 2023 Anhui University Research Establishment Programme Major Projects (2023AH040402).
Conflict of interest
The authors declare that the research was conducted in the absence of any commercial or financial relationships that could be construed as a potential conflict of interest.
Generative AI statement
The author(s) declare that no Gen AI was used in the creation of this manuscript.
Publisher’s note
All claims expressed in this article are solely those of the authors and do not necessarily represent those of their affiliated organizations, or those of the publisher, the editors and the reviewers. Any product that may be evaluated in this article, or claim that may be made by its manufacturer, is not guaranteed or endorsed by the publisher.
Supplementary material
The Supplementary material for this article can be found online at: https://www.frontiersin.org/articles/10.3389/fmed.2025.1584049/full#supplementary-material
References
1. Cheng, H-T, Xu, X, Lim, PS, and Hung, K-Y. Worldwide epidemiology of diabetes-related end-stage renal disease, 2000-2015. Diabetes Care. (2021) 44:89–97. doi: 10.2337/Dc20-1913
2. Tuttle, KR, Bakris, GL, Bilous, RW, Chiang, JL, De Boer, IH, Goldstein-Fuchs, J, et al. Diabetic kidney disease: a report from An Ada consensus conference. Diabetes Care. (2014) 37:2864–83. doi: 10.2337/Dc14-1296
3. de Boer, IH, Rue, TC, Hall, YN, Heagerty, PJ, Weiss, NS, and Himmelfarb, J. Temporal trends in the prevalence of diabetic kidney disease in the United States. JAMA. (2011) 305:2532–9. doi: 10.1001/Jama.2011.861
4. Danaei, G, Finucane, MM, Lu, Y, Singh, GM, Cowan, MJ, Paciorek, CJ, et al. National, regional, and global trends in fasting plasma glucose and diabetes prevalence since 1980: systematic analysis of health examination surveys and epidemiological studies with 370 country-years and 2·7 million participants. Lancet. (2011) 378:31–40. doi: 10.1016/S0140-6736(11)60679-X
5. Afkarian, M, Zelnick, LR, Hall, YN, Heagerty, PJ, Tuttle, K, Weiss, NS, et al. Clinical manifestations of kidney disease among us adults with diabetes, 1988-2014. JAMA. (2016) 316:602–10. doi: 10.1001/Jama.2016.10924
6. Navaneethan, SD, Schold, JD, Jolly, SE, Arrigain, S, Winkelmayer, WC, and Nally, JVJ. Diabetes control and the risks of Esrd and mortality in patients with Ckd. Am J Kidney Dis. (2017) 70:191–8. doi: 10.1053/J.Ajkd.2016.11.018
7. Gregg, EW, Cheng, YJ, Srinivasan, M, Lin, J, Geiss, LS, Albright, AL, et al. Trends in cause-specific mortality among adults with and without diagnosed diabetes in the USA: an epidemiological analysis of linked National Survey and Vital Statistics Data. Lancet. (2018) 391:2430–40. doi: 10.1016/S0140-6736(18)30314-3
8. American Diabetes Association Professional Practice Committee. Cardiovascular disease and risk management: standards of care in diabetes-2024. Diabetes Care. (2024) 47:S179–218. doi: 10.2337/Dc24-S010
9. Zheng, Y, Ley, SH, and Hu, FB. Global Aetiology and epidemiology of type 2 diabetes mellitus and its complications. Nat Rev Endocrinol. (2018) 14:88–98. doi: 10.1038/Nrendo.2017.151
10. American Diabetes Association Professional Practice Committee. 11. Chronic kidney disease and risk management: standards of care in Diabetes-2024. Diabetes Care. (2024) 47:S219–30. doi: 10.2337/Dc24-S011
11. Alicic, RZ, Rooney, MT, and Tuttle, KR. Diabetic kidney disease: challenges, Progress, and possibilities. Clin J Am Soc Nephrol. (2017) 12:2032–45. doi: 10.2215/Cjn.11491116
12. Coresh, J, Heerspink, HJL, Sang, Y, Matsushita, K, Arnlov, J, Astor, BC, et al. Change in albuminuria and subsequent risk of end-stage kidney disease: An individual participant-level consortium Meta-analysis of observational studies. Lancet Diabetes Endocrinol. (2019) 7:115–27. doi: 10.1016/S2213-8587(18)30313-9
13. Koye, DN, Magliano, DJ, Reid, CM, Jepson, C, Harold, F I, Herman, WH, et al. Risk of progression of Nonalbuminuric Ckd to end-stage kidney disease in people with diabetes: the Cric (chronic renal insufficiency cohort) study. Am J Kidney Dis. (2018) 72:653–61. doi: 10.1053/J.Ajkd.2018.02.364
14. Klimontov, VV, and Korbut, AI. Albuminuric and non-Albuminuric patterns of chronic kidney disease in type 2 diabetes. Diabetes Metab Syndr. (2019) 13:474–9. doi: 10.1016/J.Dsx.2018.11.014
15. Kramer, H, Boucher, RE, Leehey, D, Fried, L, Wei, G, Greene, T, et al. (2018) Increasing mortality in adults with diabetes and low estimated glomerular filtration rate in the absence of albuminuria. Diabetes Care 41: 775–781. doi: 10.2337/Dc17-1954, PMCID: PMC5860846
16. Penno, G, Solini, A, Orsi, E, Bonora, E, Fondelli, C, Trevisan, R, et al. Non-Albuminuric renal impairment is a strong predictor of mortality in individuals with type 2 diabetes: the renal insufficiency and cardiovascular events (Riace) Italian multicentre study. Diabetologia. (2018) 61:2277–89. doi: 10.1007/S00125-018-4691-2
17. Yokoyama, H, Araki, S-I, Kawai, K, Yamazaki, K, Shirabe, S-I, Sugimoto, H, et al. The prognosis of patients with type 2 diabetes and Nonalbuminuric diabetic kidney disease is not always poor: implication of the effects of coexisting macrovascular complications (Jddm 54). Diabetes Care. (2020) 43:1102–10. doi: 10.2337/Dc19-2049
18. Vistisen, D, Andersen, GS, Hulman, A, Persson, F, Rossing, P, and Jørgensen, ME. Progressive decline in estimated glomerular filtration rate in patients with diabetes after moderate loss in kidney function-even without albuminuria. Diabetes Care. (2019) 42:1886–94. doi: 10.2337/Dc19-0349
19. Penno, G, Solini, A, Bonora, E, Fondelli, C, Orsi, E, Zerbini, G, et al. Clinical significance of Nonalbuminuric renal impairment in type 2 diabetes. J Hypertens. (2011) 29:1802–9. doi: 10.1097/Hjh.0b013e3283495cd6
20. Buyadaa, O, Magliano, DJ, Salim, A, Koye, DN, and Shaw, JE. Risk of rapid kidney function decline, all-cause mortality, and major cardiovascular events in Nonalbuminuric chronic kidney disease in type 2 diabetes. Diabetes Care. (2020) 43:122–9. doi: 10.2337/Dc19-1438
21. Jin, Q, Luk, AO, Lau, ESH, Tam, CHT, Ozaki, R, Lim, CKP, et al. Nonalbuminuric diabetic kidney disease and risk of all-cause mortality and cardiovascular and kidney outcomes in type 2 diabetes: findings from the Hong Kong diabetes biobank. Am J Kidney Dis. (2022) 80:196-206.E1. doi: 10.1053/J.Ajkd.2021.11.011
22. Di Marco, M, Scilletta, S, Miano, N, Marrano, N, Natalicchio, A, Giorgino, F, et al. Cardiovascular risk and renal injury profile in subjects with type 2 diabetes and non-Albuminuric diabetic kidney disease. Cardiovasc Diabetol. (2023) 22:344. doi: 10.1186/S12933-023-02065-2
23. Niu, J, Zhang, X, Li, M, Wu, S, Zheng, R, Chen, L, et al. Risk of cardiovascular disease, death, and renal progression in diabetes according to albuminuria and estimated glomerular filtration rate. Diabetes Metab. (2023) 49:101420. doi: 10.1016/J.Diabet.2023.101420
24. Tikhonoff, V, and Casiglia, E. Metabolic syndrome: nothing more than a constellation. Eur Heart J. (2007) 28:780–1. doi: 10.1093/Eurheartj/Ehm024
25. Al-Daghri, NM, Al-Attas, OS, Wani, K, Sabico, S, and Alokail, MS. Serum uric acid to creatinine ratio and risk of metabolic syndrome in Saudi type 2 diabetic patients. Sci Rep. (2017) 7:12104. doi: 10.1038/S41598-017-12085-0
26. Wang, A, Tian, X, Wu, S, Zuo, Y, Chen, S, Mo, D, et al. Metabolic factors mediate the association between serum uric acid to serum creatinine ratio and cardiovascular disease. J Am Heart Assoc. (2021) 10:E023054. doi: 10.1161/Jaha.121.023054
27. Mazidi, M, Katsiki, N, and Banach, M. Α higher ratio of serum uric acid to serum creatinine could predict the risk of Total and cause specific mortality- insight from a us national survey. Int J Cardiol. (2021) 326:189–93. doi: 10.1016/J.Ijcard.2020.05.098
28. Chen, L, Zhu, Z, Ye, S, and Zheng, M. The serum uric acid to serum creatinine ratio is An independent risk factor for diabetic kidney disease. Diabetes Metab Syndr Obes. (2022) 15:3693–703. doi: 10.2147/Dmso.S387426
29. Kawamoto, R, Ninomiya, D, Kikuchi, A, Akase, T, Kasai, Y, Ohtsuka, N, et al. Serum uric acid to creatinine ratio is a useful predictor of renal dysfunction among diabetic persons. Diabetes Metab Syndr. (2019) 13:1851–6. doi: 10.1016/J.Dsx.2019.04.023
30. Diagnosis And Classification Of Diabetes: Standards of care in Diabetes-2024. Diabetes Care 47: S20–S42. (2024) doi: 10.2337/Dc24-S002
31. Du, R, Zhang, Y, Li, Q, and Li, L. Clinical features of Normoalbuminuric diabetic kidney disease in patients with type 2 diabetes. Chin J Diabetes Mellitus. (2017) 9:494–8. doi: 10.3760/Cma.J.Issn.1674-5809.2017.08.006
32. Gong, W, He, M, Yu, Y, Wang, M, Yang, Y, Sun, F, et al. Clinical features and risk factors of Normoalbuminuric chronic kidney disease in hospitalized patients with type 2 diabetes mellitus. Chin J Diabetes Mellitus. (2018) 10:269–73. doi: 10.3760/Cma.J.Issn.1674-5809.2018.04.007
33. Shi, S, Ni, L, Gao, L, and Wu, X. Comparison of Nonalbuminuric and Albuminuric diabetic kidney disease among patients with type 2 diabetes: a systematic review and Meta-analysis. Front Endocrinol. (2022) 13:871272. doi: 10.3389/Fendo.2022.871272
34. Kramer, HJ, Nguyen, QD, Curhan, G, and Hsu, CY. Renal insufficiency in the absence of albuminuria and retinopathy among adults with type 2 diabetes mellitus. JAMA. (2003) 289:3273–7. doi: 10.1001/Jama.289.24.3273
35. Doshi, SM, and Friedman, AN (2017) Diagnosis and management of type 2 diabetic kidney disease. Clin J Am Soc Nephrol 12: 1366–1373. doi: 10.2215/Cjn.11111016, PMCID: PMC5544517
36. Chen, C, Wang, C, Hu, C, Han, Y, Zhao, L, Zhu, X, et al. Normoalbuminuric diabetic kidney disease. Front Med. (2017) 11:310–8. doi: 10.1007/S11684-017-0542-7
37. Inker, Lesley A, Schmid, Christopher H, Tighiouart, Hocine, Eckfeldt, John H, Harold, Feldman I, Greene, Tom, Kusek, John W, Manzi, Jane, Van Lente, Frederick, Zhang, Yaping Lucy, Coresh, Josef, Levey, Andrew S; CKD-EPI Investigators (2012) Estimating glomerular filtration rate from serum creatinine and cystatin C. N Engl J Med 367: 20–29. doi: 10.1056/Nejmoa1114248, PMCID: PMC4398023
38. Coresh, J, Selvin, E, Stevens, LA, Manzi, J, Kusek, JW, Eggers, P, et al. Prevalence of chronic kidney disease in the United States. JAMA. (2007) 298:2038–47. doi: 10.1001/Jama.298.17.2038
39. Van Rijn, M, Metzger, M, Flamant, M, Houillier, P, Haymann, J-P, van den Brand, JAJG, et al. Performance of creatinine-based equations for estimating glomerular filtration rate changes over time. Nephrol Dial Transplant. (2020) 35:819–27. doi: 10.1093/Ndt/Gfy278
40. Leehey, DJ, Zhang, JH, Emanuele, NV, Whaley-Connell, A, Palevsky, PM, Reilly, RF, et al. (2015) Bp and renal outcomes in diabetic kidney disease: the veterans affairs nephropathy in diabetes trial. Clin J Am Soc Nephrol 10: 2159–2169. doi: 10.2215/Cjn.02850315, PMCID: PMC4670761
41. Sokolski, M, Zymliński, R, and Biegus, J. Urinary levels of novel kidney biomarkers and risk of true worsening renal function and mortality in patients with acute heart failure. Eur J Heart Fail. (2017) 19:760–7. doi: 10.1002/Ejhf.746
42. Li, A, Yi, B, Liu, Y, Wang, J, Dai, Q, Huang, Y, et al. Urinary Ngal and Rbp are biomarkers of Normoalbuminuric renal insufficiency in type 2 diabetes mellitus. J Immunol Res. (2019) 2019:5063089. doi: 10.1155/2019/5063089
43. Nowak, N, Skupien, J, Smiles, AM, Yamanouchi, M, Niewczas, MA, Galecki, AT, et al. (2018) Markers of early progressive renal decline in type 2 diabetes suggest different implications for etiological studies and prognostic tests development. Kidney Int 93: 1198–1206. doi: 10.1016/J.Kint.2017.11.024
44. Jia, X, Zang, L, Pang, P, Jiang, L, Du, J, Gu, W, et al. (2022) A study on the status of Normoalbuminuric renal insufficiency among type 2 diabetes mellitus patients: a multicenter study based on a Chinese population. J Diabetes 14: 15–25. doi: 10.1111/1753-0407.13230
45. Çetinkaya Altuntaş, S, Evran, M, Gürkan, E, Sert, M, and Tetiker, T. Hba1c level decreases in Iron deficiency Anemia. Wien Klin Wochenschr. (2021) 133:102–6. doi: 10.1007/S00508-020-01661-6
46. Rodríguez-Rodríguez, R, Hojs, R, Trevisani, F, Morales, E, Fernández, G, Bevc, S, et al. (2021) The role of vascular lesions in diabetes across a Spectrum of clinical kidney disease. Kidney Int Rep 6: 2392–2403. doi: 10.1016/J.Ekir.2021.06.001
47. Schievink, B, Kröpelin, T, Mulder, S, Parving, H-H, Remuzzi, G, Dwyer, J, et al. Early renin-angiotensin system intervention is more beneficial than late intervention in delaying end-stage renal disease in patients with type 2 diabetes. Diabetes Obes Metab. (2016) 18:64–71. doi: 10.1111/Dom.12583
48. Ekinc, EI, Jerums, G, Skene, A, Crammer, P, Power, D, Cheong, KY, et al. (2013) Renal structure in Normoalbuminuric and Albuminuric patients with type 2 diabetes and impaired renal function. Diabetes Care 36: 3620–3626. doi: 10.2337/Dc12-2572
49. Taft, JL, Nolan, CJ, Yeung, SP, Hewitson, TD, and Martin, FI. Clinical and histological correlations of decline in renal function in diabetic patients with proteinuria. Diabetes. (1994) 43:1046–51. doi: 10.2337/diab.43.8.1046
50. Zhou, J, Chen, Y, Liu, Y, Han, J, Shi, S, Wang, S, et al. Clinical value of serum uric acid/serum creatinine ratio for the degree of Tubulointerstitial damage. Beijing Med J. (2012) 34:253–6. doi: 10.15932/J.0253-9713.2012.04.015
Keywords: glomerular filtration rate, normoalbuminuric diabetic kidney disease, serum uric acid creatinine ratio, type 2 diabetes mellitus, urinary albumin creatinine ratio
Citation: Mu H, Zhang Q, Huang W, Pan Q, Zhang Y, Lu Y, Zhu Z, Jiang X, Wang G, Zheng M and Chen L (2025) The serum uric acid to creatinine ratio as a diagnostic biomarker for normoalbuminuric diabetic kidney disease. Front. Med. 12:1584049. doi: 10.3389/fmed.2025.1584049
Edited by:
Laura Schnackenberg, National Center for Toxicological Research (FDA), United StatesReviewed by:
Lu Yu, First Affiliated Hospital of Zhengzhou University, ChinaJinchun Sun, National Center for Toxicological Research (FDA), United States
Copyright © 2025 Mu, Zhang, Huang, Pan, Zhang, Lu, Zhu, Jiang, Wang, Zheng and Chen. This is an open-access article distributed under the terms of the Creative Commons Attribution License (CC BY). The use, distribution or reproduction in other forums is permitted, provided the original author(s) and the copyright owner(s) are credited and that the original publication in this journal is cited, in accordance with accepted academic practice. No use, distribution or reproduction is permitted which does not comply with these terms.
*Correspondence: Mao Zheng, emhlbmdtYW8xOTk5QGZveG1haWwuY29t; Li Chen, ZGFpc3kxOTgyQGZveG1haWwuY29t
†These authors share first authorship