Abstract
Background:
Early detection of subclinical atherosclerosis progression is crucial for preventing atherosclerotic cardiovascular disease (ASCVD). Carotid intima–media thickness (CIMT) is a recognized surrogate marker for atherosclerosis, but accurate prediction of its progression remains challenging. This study aimed to develop and validate machine learning models for predicting CIMT progression via routine clinical biomarkers.
Methods:
In this three-year prospective cohort study, we analyzed data from 904 participants from the Third Xiangya Hospital of Central South University Health Examination Cohort who underwent three consecutive annual CIMT measurements. The participants were categorized into CIMT thickening and nonthickening groups on the basis of a final CIMT ≥1.0 mm or an increase ≥0.1 mm across consecutive measurements. We evaluated seven machine learning algorithms: logistic regression, random forest, XGBoost, support vector machine (SVM), elastic net, decision tree, and neural network. Model performance was assessed through discrimination (AUC, sensitivity, specificity) and calibration metrics, with Platt scaling applied to optimize probability estimates. Clinical utility was evaluated through decision curve analysis.
Results:
Compared with the more complex algorithms, the elastic net model demonstrated superior performance (AUC 0.754). Baseline CIMT, absolute monocyte count, sex, age, and LDL-C were identified as the most influential predictors. After Platt scaling, the calibration improved significantly across all the models. Decision curve analysis revealed a positive net benefit across a wide threshold range (0.01–0.5). On the basis of calibrated probabilities, we developed a three-tier risk stratification framework that identified distinct groups with progressively higher event rates: medium-risk (13.9%), high-risk (50.0%), and very-high-risk (60.0%). Subgroup analysis revealed better predictive performance in younger participants (<50 years), those with lower baseline CIMT (<0.8 mm), and females.
Conclusion:
Machine learning approaches, particularly the elastic net model, can effectively identify individuals at high risk for CIMT progression via routine clinical biomarkers. The superior performance of simpler models suggests predominantly linear relationships between predictors and CIMT progression. Following appropriate calibration, the model demonstrated strong clinical utility across diverse decision thresholds, supporting a stratified approach to atherosclerosis prevention.
1 Introduction
Atherosclerotic cardiovascular disease (ASCVD) remains the leading cause of mortality and morbidity worldwide, with atherosclerosis as its primary pathophysiological mechanism (1). Early detection and intervention of subclinical atherosclerosis represent key strategies for reducing the global burden of ASCVD. Carotid intima–media thickness (CIMT), measured by ultrasonography, has emerged as a recognized surrogate marker for atherosclerosis and a powerful predictor of future cardiovascular events (2).
CIMT measurement offers multiple advantages as a clinical tool: it is noninvasive, relatively cost-effective, widely available, and highly reproducible when standardized protocols are followed (3, 4). Numerous longitudinal studies have confirmed that increased CIMT is independently associated with elevated risks of myocardial infarction, stroke, and cardiovascular mortality (5). Moreover, some studies suggest that baseline CIMT measurements provide valuable prognostic information for cardiovascular risk prediction (6, 7).
Despite these advantages, the clinical application of CIMT remains limited by challenges in predicting individual progression over time. Current approaches typically rely on established risk factors and scoring systems designed to predict cardiovascular events rather than CIMT progression (8). These methods generally demonstrate moderate predictive performance and fail to capture complex nonlinear relationships between risk factors and subclinical atherosclerosis progression (9). Consequently, more accurate predictive tools are urgently needed to identify individuals at highest risk for CIMT progression who might benefit most from intensified preventive interventions (10).
Machine learning (ML) methods offer promising solutions to these challenges through their ability to model complex nonlinear relationships and interactions among multiple predictors (11). Some studies suggest that ML algorithms have the potential to improve cardiovascular risk prediction compared with traditional statistical methods (12–14). However, most ML applications in cardiovascular medicine have focused on predicting clinical events rather than subclinical markers of disease progression (15). Although it is a valuable predictor of ASCVD, no ML-related studies exist.
In this three-year prospective cohort study, we aimed to develop and validate ML models for predicting CIMT progression via readily available clinical and laboratory parameters from the Xiangya Third Hospital of Central South University Health Examination Cohort. We evaluated multiple ML algorithms, including logistic regression, random forest, XGBoost, support vector machine, elastic net, decision tree, and neural network methods. We assessed model performance through comprehensive metrics of discrimination and calibration and applied Platt scaling to optimize probability estimates. Finally, we evaluated the potential clinical utility of these models at different threshold probabilities through decision curve analysis.
By establishing accurate CIMT progression prediction models, this study aims to facilitate early identification of individuals at high risk for atherosclerosis, allowing for targeted preventive interventions before the development of clinical cardiovascular disease by extending the prediction window for ASCVD. This approach aligns with the evolving paradigm of precision medicine and may contribute to more efficient allocation of cardiovascular prevention resources.
2 Materials and methods
2.1 Study population
The present study utilized biochemical and hematological indices from 128,938 individuals enrolled in the “Third Xiangya Hospital of Central South University Health Examination Cohort” established in 2015. Following preliminary screening, 54,212 records were included in the cohort, while the remainder were excluded because of incomplete documentation. This cohort underwent annual health examinations, with 31,158 individuals enrolled between 2015 and 2023. The cohort encompasses not only biochemical parameters but also carotid intima–media thickness (CIMT) measurements at four anatomical locations (left/right carotid bifurcation and distal left/right common carotid artery). Our predictive model was developed on the basis of the mean CIMT values across these four locations.
2.2 Patient selection
From the initial database of 31,158 participants, we established a longitudinal cohort with regular follow-up intervals to assess carotid intima–media thickness (CIMT) progression. We first screened patients who completed three independent CIMT measurements during health examinations and had baseline CIMT values <1 mm (n = 3,544). To ensure standardized follow-up intervals, only participants with adjacent examinations spaced 300–430 days apart (approximately annual intervals) were included (n = 904). This time window allows reasonable scheduling flexibility while maintaining the periodicity of annual assessments. Among these 904 participants, in accordance with clinical guidelines and previous research, we divided the population into CIMT thickening and nonthickening groups according to the following criteria: a final examination of CIMT ≥1.0 mm (3, 16–18) or increase ≥0.1 mm (19–21) across consecutive measurements (Figure 1).
Figure 1

Study cohort selection process for CIMT progression analysis.
After completing the subject screening, we first evaluated the proportion of missing values for all the variables. Variables with >20% missing data were excluded. Correlation analysis was performed on retained variables to identify multicollinearity, eliminating the clinically less significant variable from highly correlated variable pairs (correlation coefficient >0.7).
For the remaining variables, missing data were imputed via predictive mean matching (PMM), generating five imputed datasets (m = 5, maxit = 50), with the first complete dataset selected for subsequent analysis. Near-zero variance predictors were identified and removed via the nearZeroVar function from the caret package.
Feature selection was conducted via the random forest-based Boruta algorithm, which identifies statistically significant variables for classification tasks through the shadow attribute method. The algorithm runs for 100 iterations (maxRuns = 100), retaining variables confirmed as “important” by Boruta and “tentative” variables. Additionally, age and sex were forcibly included as clinically important variables regardless of Boruta analysis results.
2.3 Model development and performance evaluation
The dataset was divided into training and testing sets at a 7:3 ratio via stratified sampling to maintain a consistent class distribution. To address class imbalance in the training set, a mixed sampling strategy from the ROSE package was employed (method = “both,” p = 0.5), which simultaneously oversamples the minority class and undersamples the majority class. All the models were optimized through 5-fold cross-validation (repeated 3 times), with the area under the receiver operating characteristic curve (AUC) as the primary metric for model selection during cross-validation.
We developed models via seven machine learning algorithms: logistic regression, random forest, XGBoost, support vector machine with a radial basis function (SVM) kernel, elastic net, decision tree, and neural network.
To validate model performance, we assessed the following metrics: area under the curve (AUC), sensitivity, specificity, positive predictive value (PPV), negative predictive value (NPV), F1-score, expected calibration error (ECE), Brier score, and log loss.
Model calibration was performed via Platt scaling, which involves fitting a logistic regression to transform the original model outputs. We tested three regularization methods (ridge L2, lasso L1, and elastic net) combined with stratified k-fold cross-validation for calibration model development. Calibration performance was assessed via the expected calibration error (ECE), Brier score, and log-loss metrics. Calibration curves were generated to visually evaluate the alignment between the predicted probabilities and actual outcomes before and after Platt scaling.
To evaluate model stability and data efficiency, we created learning curves by training models on increasing fractions (5, 10, 20, 50, and 100%) of the training dataset. For each fraction, we performed five iterations and calculated the mean AUC and standard deviation to assess performance stability across different training data volumes.
For subgroup analysis, we stratified the test set by age (≤35 years, 35–50 years, >50 years), sex (male, female), and baseline CIMT level (low: <0.6 mm, medium: 0.6–0.8 mm, high: >0.8 mm). Model performance and calibration effectiveness were evaluated separately for each subgroup via the same metrics applied to the overall population. This analysis helped assess whether model performance remained consistent across different demographic and clinical subgroups.
For feature importance analysis, we compared the coefficient magnitudes and significance from both elastic net and logistic regression models to provide comprehensive insights into predictor relevance. This comparative approach allowed for more robust identification of key predictors for CIMT thickening.
Finally, we conducted decision curve analysis (DCA) using the calibrated models. DCA estimates the net benefit of using prediction models to guide clinical decisions at different threshold probabilities. The DCA curve of the best-performing model was compared with two default strategies: “treat all” and “treat none.” This analysis helps identify the range of threshold probabilities where the model provides clinical value beyond these baseline strategies.
The optimal thresholds were determined via Youden index analysis, which identifies the point that maximizes the sum of sensitivity and specificity. On the basis of the DCA results and clinical considerations, we developed a risk stratification approach to classify patients into risk categories (medium, high, and very high risk) with corresponding intervention recommendations. Risk thresholds were determined on the basis of a combination of the Youden index, maximum net benefit point, and clinically significant event rates.
The DCA curve of the best-performing model was compared with two default strategies: “treat all” and “treat none” (22). This analysis helps identify the range of threshold probabilities where the model provides clinical value beyond these baseline strategies (23). In clinical decision analysis, “treat all” and “treat none” represent two extreme baseline strategies used as reference benchmarks to measure the clinical utility of prediction models: treating all ensures coverage of all patients needing treatment but leads to overtreatment (high false positives); treating none completely avoids overtreatment but misses all patients requiring treatment (high false negatives) (24). Through decision curve analysis, if a model’s net benefit curve exceeds both baselines within a specific threshold range, it indicates that selective treatment based on model predictions better balances treatment benefits and risks (25), delineating the clinical value interval for practical model application (26).
2.4 Statistical analysis
All analyses were conducted via R version 4.4.2. Statistical significance was set at p < 0.05.
3 Results
3.1 Baseline characteristics
On the basis of our thickening criteria (final examination CIMT ≥1.0 mm or increase ≥0.1 mm across consecutive measurements), 904 individuals from the “Third Xiangya Hospital of Central South University Health Examination Cohort” of 31,158 participants were included for model development (Figure 1).
No significant differences in age (42.0 vs. 43.0 years, p = 0.119), sex distribution (male: 63.1% vs. 68.3%, p = 0.181), or BMI (24.20 vs. 24.12 kg/m2, p = 0.568) were detected between the nonthickened and thickened groups. Blood pressure parameters were comparable between the groups: systolic pressure (122.0 vs. 121.0 mmHg, p = 0.919) and diastolic pressure (75.0 vs. 76.0 mmHg, p = 0.324). Lipid metabolism indices were not significantly different: total cholesterol (4.93 vs. 5.01 mmol/L, p = 0.319), triglycerides (1.40 vs. 1.44 mmol/L, p = 0.292), HDL-C (1.26 vs. 1.29 mmol/L, p = 0.625), and LDL-C (2.87 vs. 2.88 mmol/L, p = 0.386). The white blood cell count (6.09 vs. 5.95 × 10⁹/L, p = 0.916) and absolute monocyte count (0.36 vs. 0.38 × 10⁹/L, p = 0.140) were similarly distributed between the groups.
The most notable difference between the groups was the baseline CIMT: 0.75 mm (IQR: 0.65–0.80) in the nonthickened group versus 0.65 mm (IQR: 0.60–0.75) in the thickened group (p < 0.001, SMD = 0.509). These findings suggest that individuals with lower baseline CIMT may be overlooked by conventional risk assessments despite having higher actual progression risk. The absence of differences in traditional risk factors (e.g., age, lipid profiles) between the two groups may indicate limited predictive performance of these factors for CIMT progression in populations with normal baseline CIMT (Supplementary material 1).
3.2 Feature selection
Through the Boruta algorithm, we screened all 47 features (Figure 2). In terms of the calculated Z values, SBP, DBP, TG, HDL, LDL, CR, WBC, Monocyte_ABS, sex, age, and CIMT visit 1 were identified as variables closely associated with CIMT thickening.
Figure 2
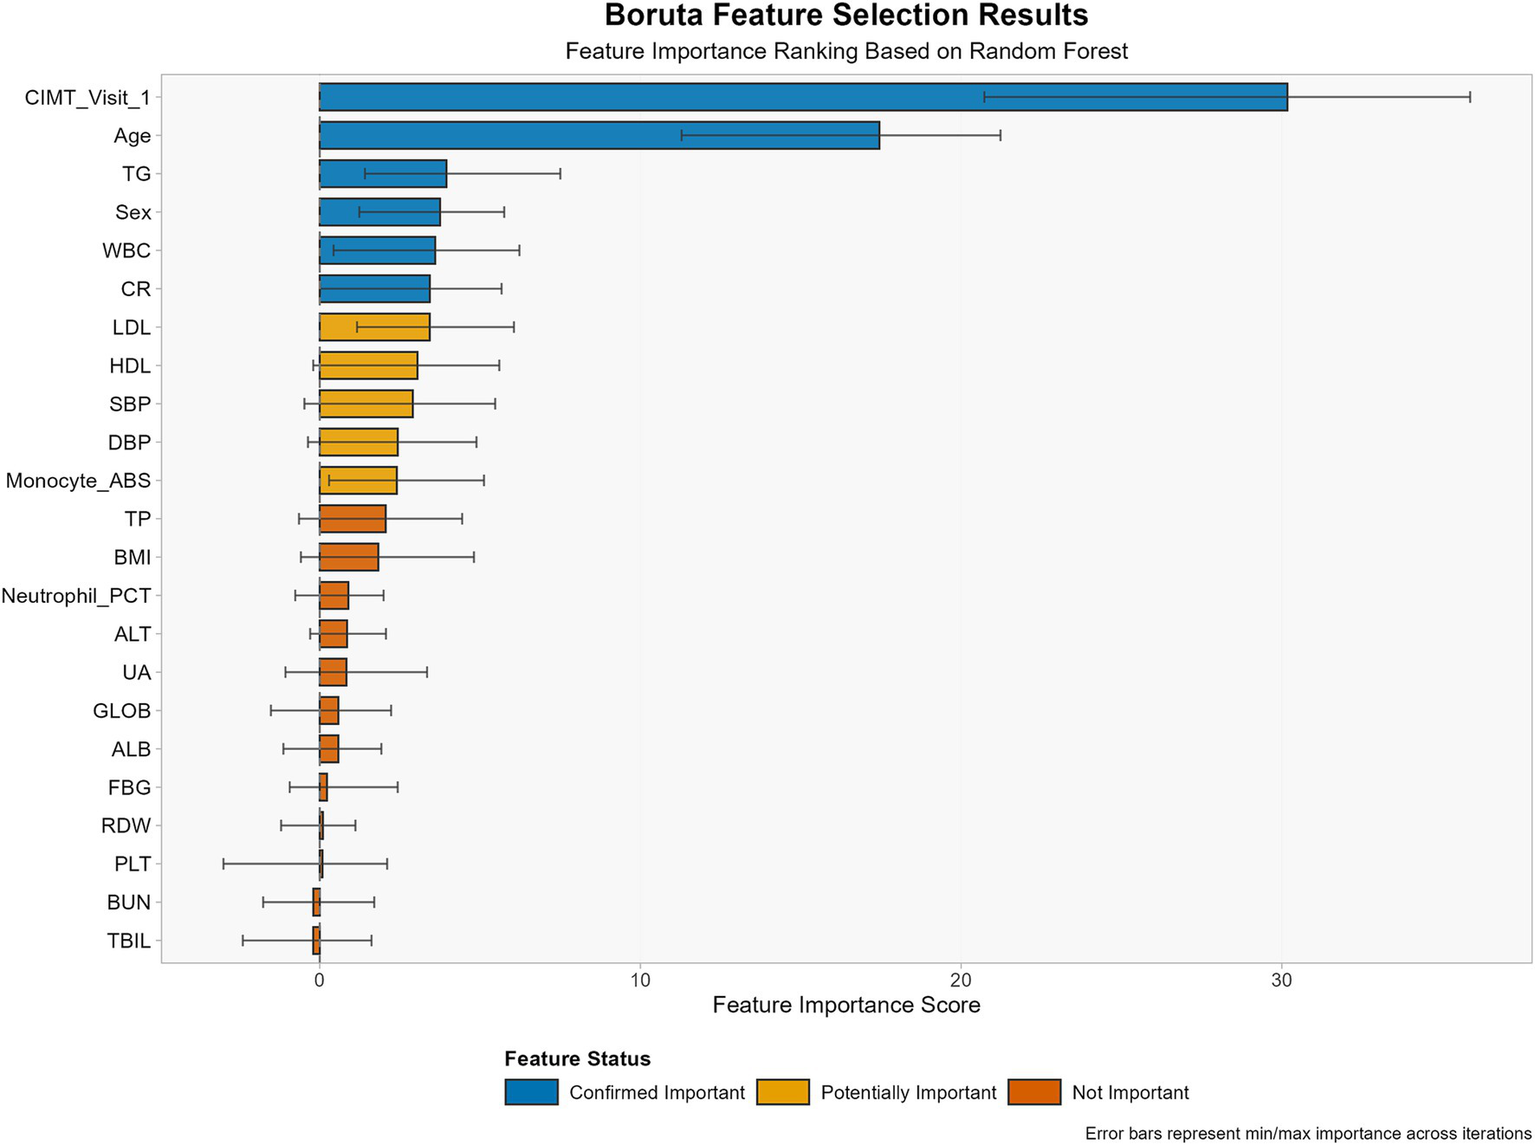
Feature selection results using the Boruta algorithm for CIMT thickening prediction.
3.3 Assessment of dataset covariate shift
To evaluate potential covariate shifts between the training and test datasets, we conducted Kolmogorov–Smirnov tests for all the input features (Figure 3). The results revealed that eight out of nine features presented no significant distributional differences between the training and test datasets. Only age demonstrated a statistically significant distributional discrepancy (p = 0.0183).
Figure 3

Kolmogorov–Smirnov tests for training and testing sets.
Notably, despite this age distribution difference, our model maintained robust performance in the test set (AUC >0.7), indicating a degree of resilience to age-related covariate shifts. This result strengthens our confidence in the model’s generalizability, suggesting that it may maintain stable predictive performance when confronted with minor population distribution differences in real-world scenarios.
3.4 Model performance comparison
We generated seven ML algorithms to predict patient CIMT thickening within three years. Figure 4 and Table 1 show the discriminative performance of the nine models in terms of their ROC curves.
Figure 4
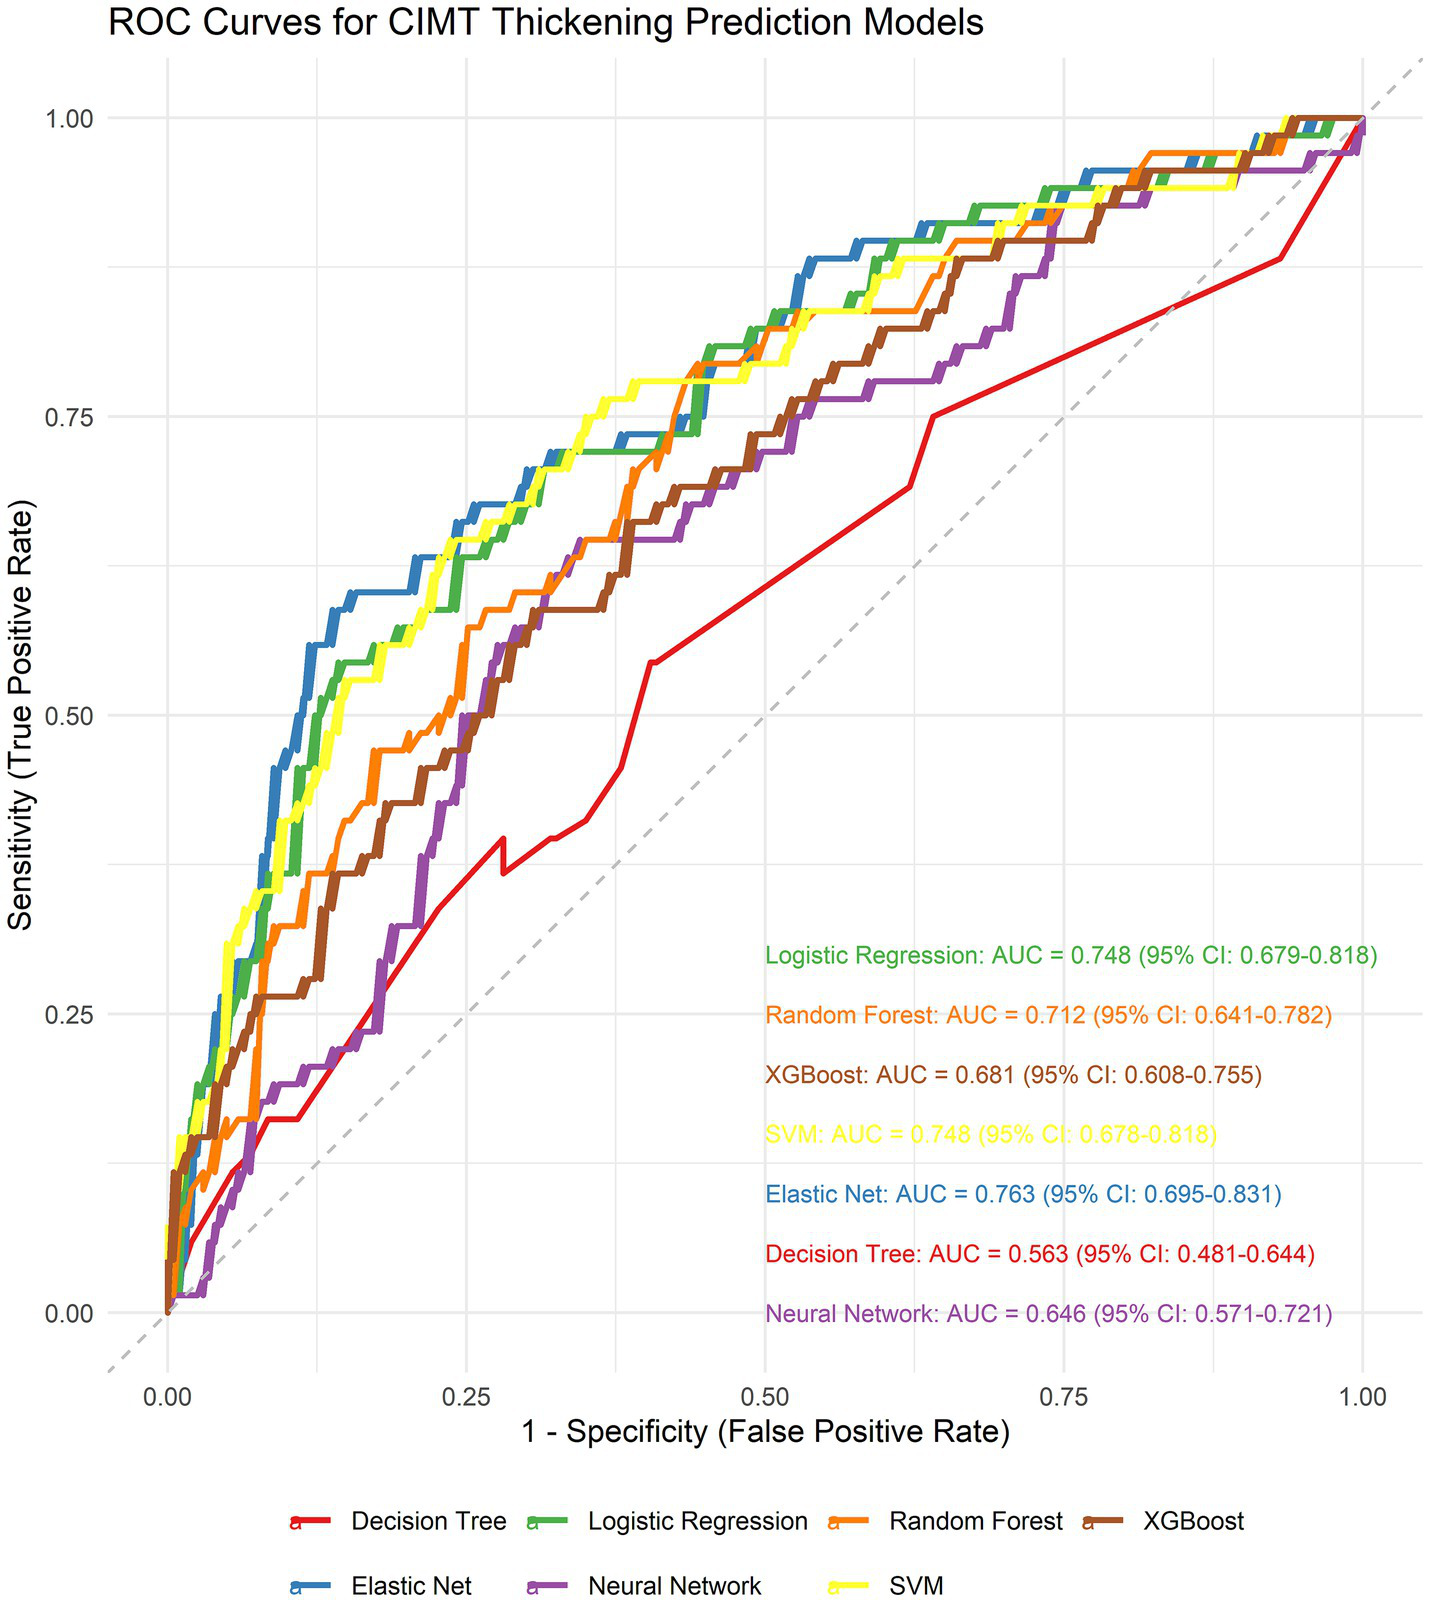
Receiver operating characteristic (ROC) curves comparing the discriminative performance of seven machine learning models.
Table 1
| Model | AUC (lower CI–upper CI) | Accuracy (lower CI–upper CI) | Sensitivity (lower CI–upper CI) | Specificity (lower CI–upper CI) | PPV (lower CI–upper CI) | NPV (lower CI–upper CI) | F 1 (lower CI–upper CI) | LogLoss (lower CI–upper CI) |
|---|---|---|---|---|---|---|---|---|
| Elastic Net | 0.763 (0.695–0.831) | 0.701 (0.646–0.753) | 0.706 (0.603–0.814) | 0.700 (0.638–0.763) | 0.440 (0.345–0.535) | 0.877 (0.827–0.923) | 0.542 (0.446–0.622) | 0.603 (0.576–0.636) |
| Logistic Regression | 0.748 (0.679–0.818) | 0.694 (0.631–0.745) | 0.676 (0.558–0.790) | 0.700 (0.627–0.758) | 0.430 (0.330–0.525) | 0.866 (0.815–0.914) | 0.526 (0.432–0.617) | 0.589 (0.539–0.652) |
| SVM | 0.748 (0.678–0.818) | 0.731 (0.679–0.779) | 0.647 (0.523–0.750) | 0.759 (0.699–0.814) | 0.473 (0.375–0.568) | 0.865 (0.815–0.912) | 0.547 (0.446–0.631) | 0.575 (0.501–0.657) |
| Random Forest | 0.712 (0.641–0.782) | 0.734 (0.675–0.786) | 0.471 (0.356–0.590) | 0.823 (0.760–0.871) | 0.471 (0.352–0.587) | 0.823 (0.769–0.873) | 0.471 (0.364–0.563) | 0.556 (0.516–0.602) |
| XGBoost | 0.681 (0.608–0.755) | 0.694 (0.633–0.749) | 0.456 (0.344–0.574) | 0.773 (0.708–0.833) | 0.403 (0.289–0.515) | 0.809 (0.756–0.865) | 0.428 (0.315–0.526) | 0.685 (0.583–0.802) |
| Neural Network | 0.646 (0.571–0.721) | 0.661 (0.605–0.720) | 0.588 (0.469–0.701) | 0.685 (0.619–0.746) | 0.385 (0.290–0.473) | 0.832 (0.769–0.886) | 0.465 (0.359–0.555) | 0.893 (0.745–1.056) |
| Decision Tree | 0.563 (0.481–0.644) | 0.579 (0.520–0.638) | 0.456 (0.324–0.580) | 0.621 (0.545–0.690) | 0.287 (0.197–0.369) | 0.773 (0.712–0.835) | 0.352 (0.253–0.439) | 2.309 (1.470–3.164) |
Performance comparison of seven machine learning models for predicting CIMT thickening.
To identify the optimal model, we performed DeLong tests (Figure 5). The results revealed no statistically significant differences in the AUC among the elastic net, logistic regression, and SVM methods (p = 0.623 and p = 0.992, respectively), suggesting the need for further comprehensive analysis.
Figure 5
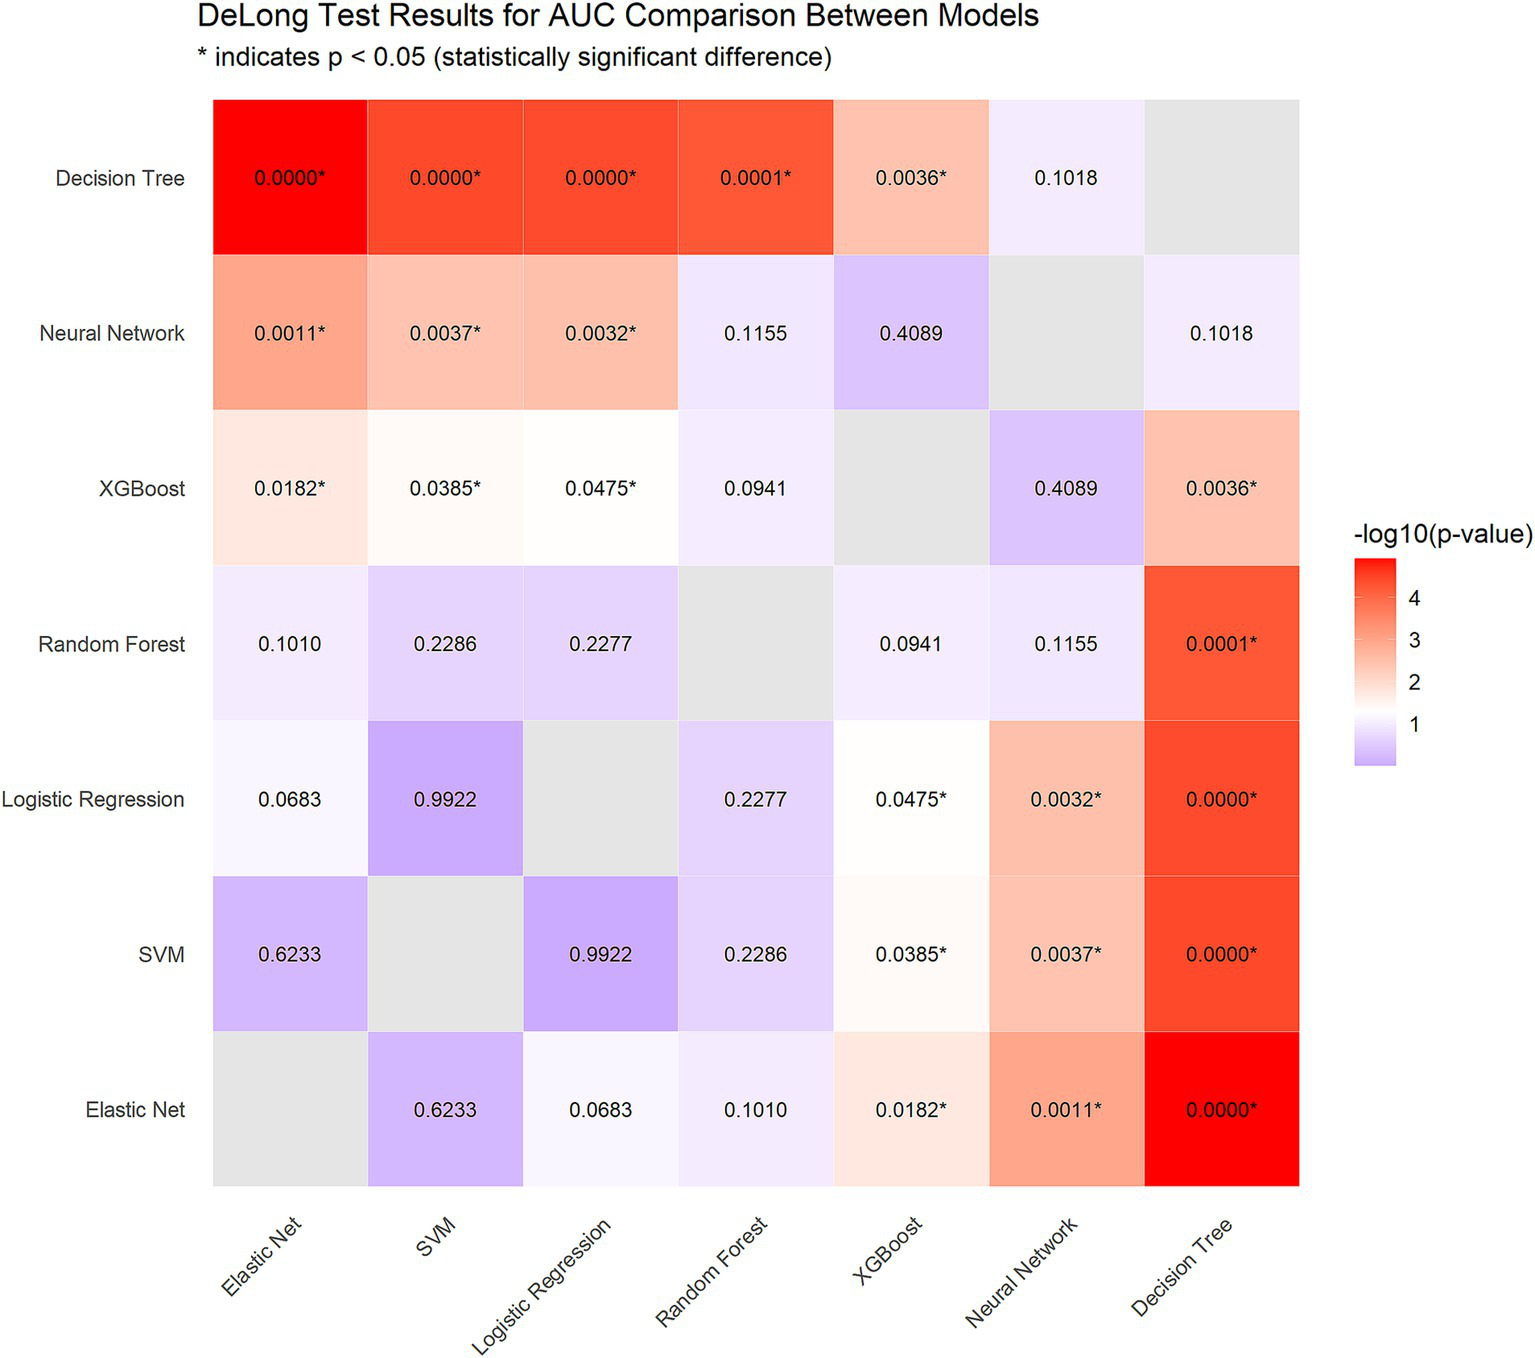
DeLong test results for AUC comparison between models.
Using paired bootstrap t-tests (1,000 resamples), we calculated the performance differences between the models. For the AUC, Elastic Net outperformed logistic regression by an average of 0.0140 (p < 0.001) and SVM by 0.0146 (p < 0.001). In terms of sensitivity, Elastic Net demonstrated superiority over logistic regression by 0.0294 (p < 0.001) and over SVM by 0.0579 (p < 0.001).
To comprehensively evaluate the three models, we implemented a multimetric weighted scoring approach, assigning weights to the AUC, sensitivity, F1-score, and log loss according to clinical relevance (30, 30, 20, and 20%, respectively). Elastic Net achieved the highest score (0.628), followed by logistic regression (0.615) and SVM (0.613).
Considering statistical significance testing, weighted scoring results, and Elastic Net’s intrinsic feature selection capabilities, we selected Elastic Net as the optimal model for subsequent analyses.
To address potential overfitting and underfitting concerns, we constructed learning curves (Figure 6). Analysis revealed that Elastic Net consistently demonstrated superior performance across all training data volumes (AUC improvement from 0.634 with 5% data to 0.754 with 100% data). Notably, the three top-performing models—Elastic Net, logistic regression, and SVM—achieved AUCs exceeding 0.70 even with minimal data (10%), indicating excellent data efficiency. This analysis further validated Elastic Net’s stability and superiority while confirming that the current data volume was sufficient for model training (Table 2).
Figure 6
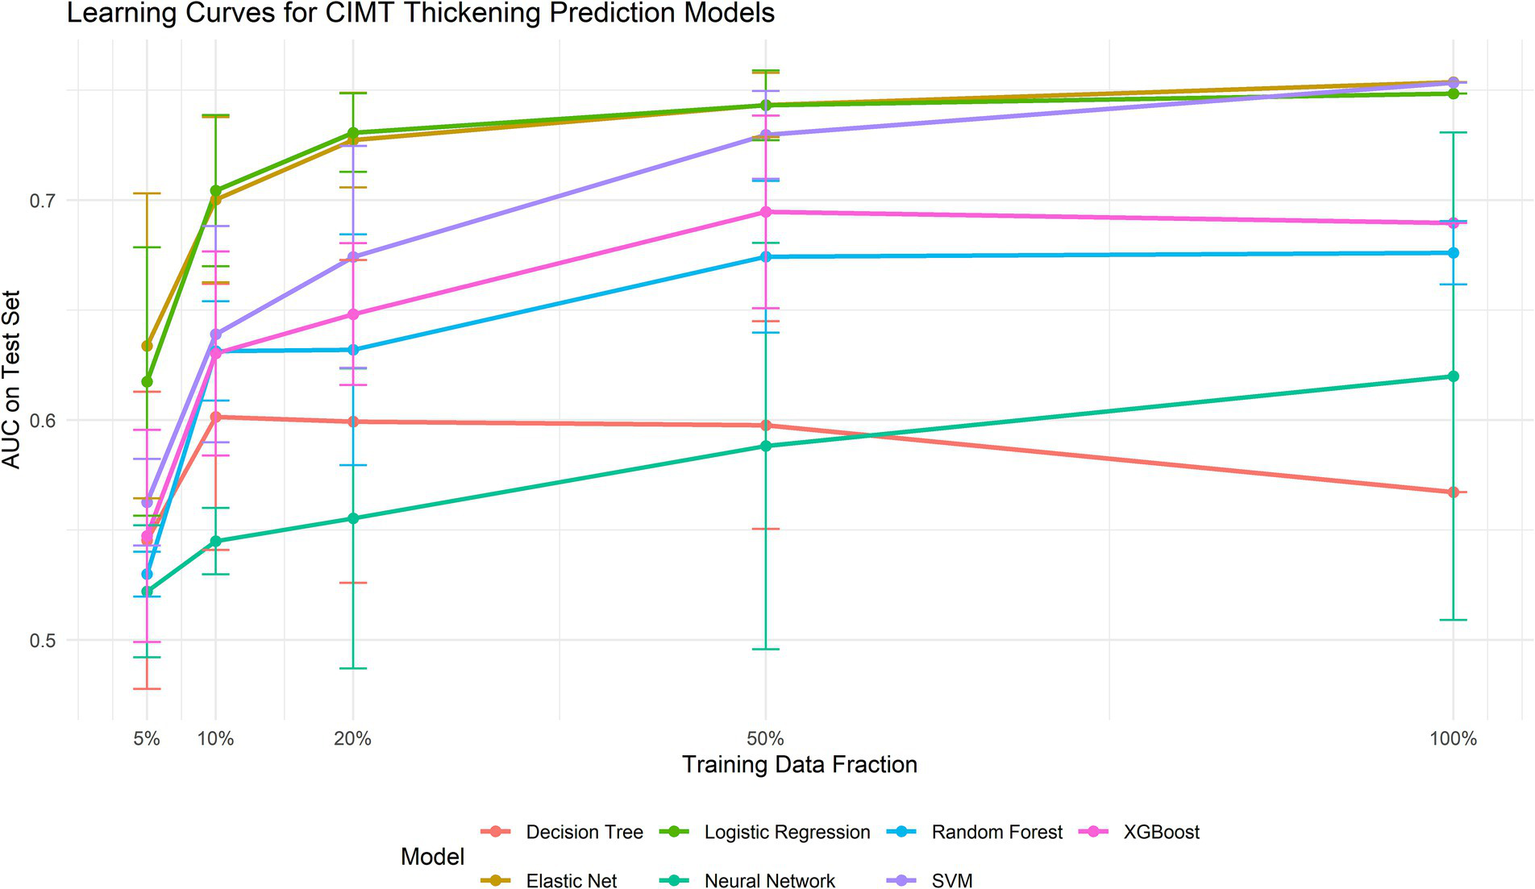
Learning curves for each model.
Table 2
| Model | 5% training data (32 samples) | 10% training data (63 samples) | 20% training data (127 samples) | 50% training data (316 samples) | 100% training data (633 samples) |
|---|---|---|---|---|---|
| Elastic Net | 0.634 ± 0.069 | 0.700 ± 0.038 | 0.727 ± 0.022 | 0.743 ± 0.015 | 0.754 ± 0.000 |
| SVM | 0.563 ± 0.020 | 0.639 ± 0.049 | 0.674 ± 0.050 | 0.730 ± 0.020 | 0.753 ± 0.000 |
| Logistic Regression | 0.617 ± 0.061 | 0.704 ± 0.034 | 0.731 ± 0.018 | 0.743 ± 0.016 | 0.748 ± 0.000 |
| XGBoost | 0.547 ± 0.048 | 0.630 ± 0.046 | 0.648 ± 0.032 | 0.695 ± 0.044 | 0.690 ± 0.000 |
| Random Forest | 0.530 ± 0.010 | 0.631 ± 0.023 | 0.632 ± 0.052 | 0.674 ± 0.034 | 0.676 ± 0.014 |
| Neural Network | 0.522 ± 0.030 | 0.545 ± 0.015 | 0.555 ± 0.068 | 0.588 ± 0.092 | 0.620 ± 0.111 |
| Decision Tree | 0.545 ± 0.068 | 0.601 ± 0.061 | 0.599 ± 0.073 | 0.598 ± 0.047 | 0.567 ± 0.000 |
Learning curve performance of machine learning models with varying training data volumes.
Model performance on test set with varying training data sizes. Test set performance measured by AUC (area under ROC curve).
3.5 Model calibration performance
To increase the reliability of the predictive probabilities, we implemented Platt scaling across all the models via three regularization methods (ridge L2, lasso L1, and elastic net) combined with stratified k-fold cross-validation to prevent overfitting. The optimal calibration methods varied by model: both elastic net and logistic regression performed best with ridge regularization, whereas SVM yielded superior results with lasso regularization, highlighting the influence of model characteristics on the selection of the calibration method. Calibration not only improved the ECE but also significantly enhanced metrics such as the Brier score and log loss (see Table 3). Figure 7 shows the calibration curves of each model before and after Platt scaling.
Figure 7
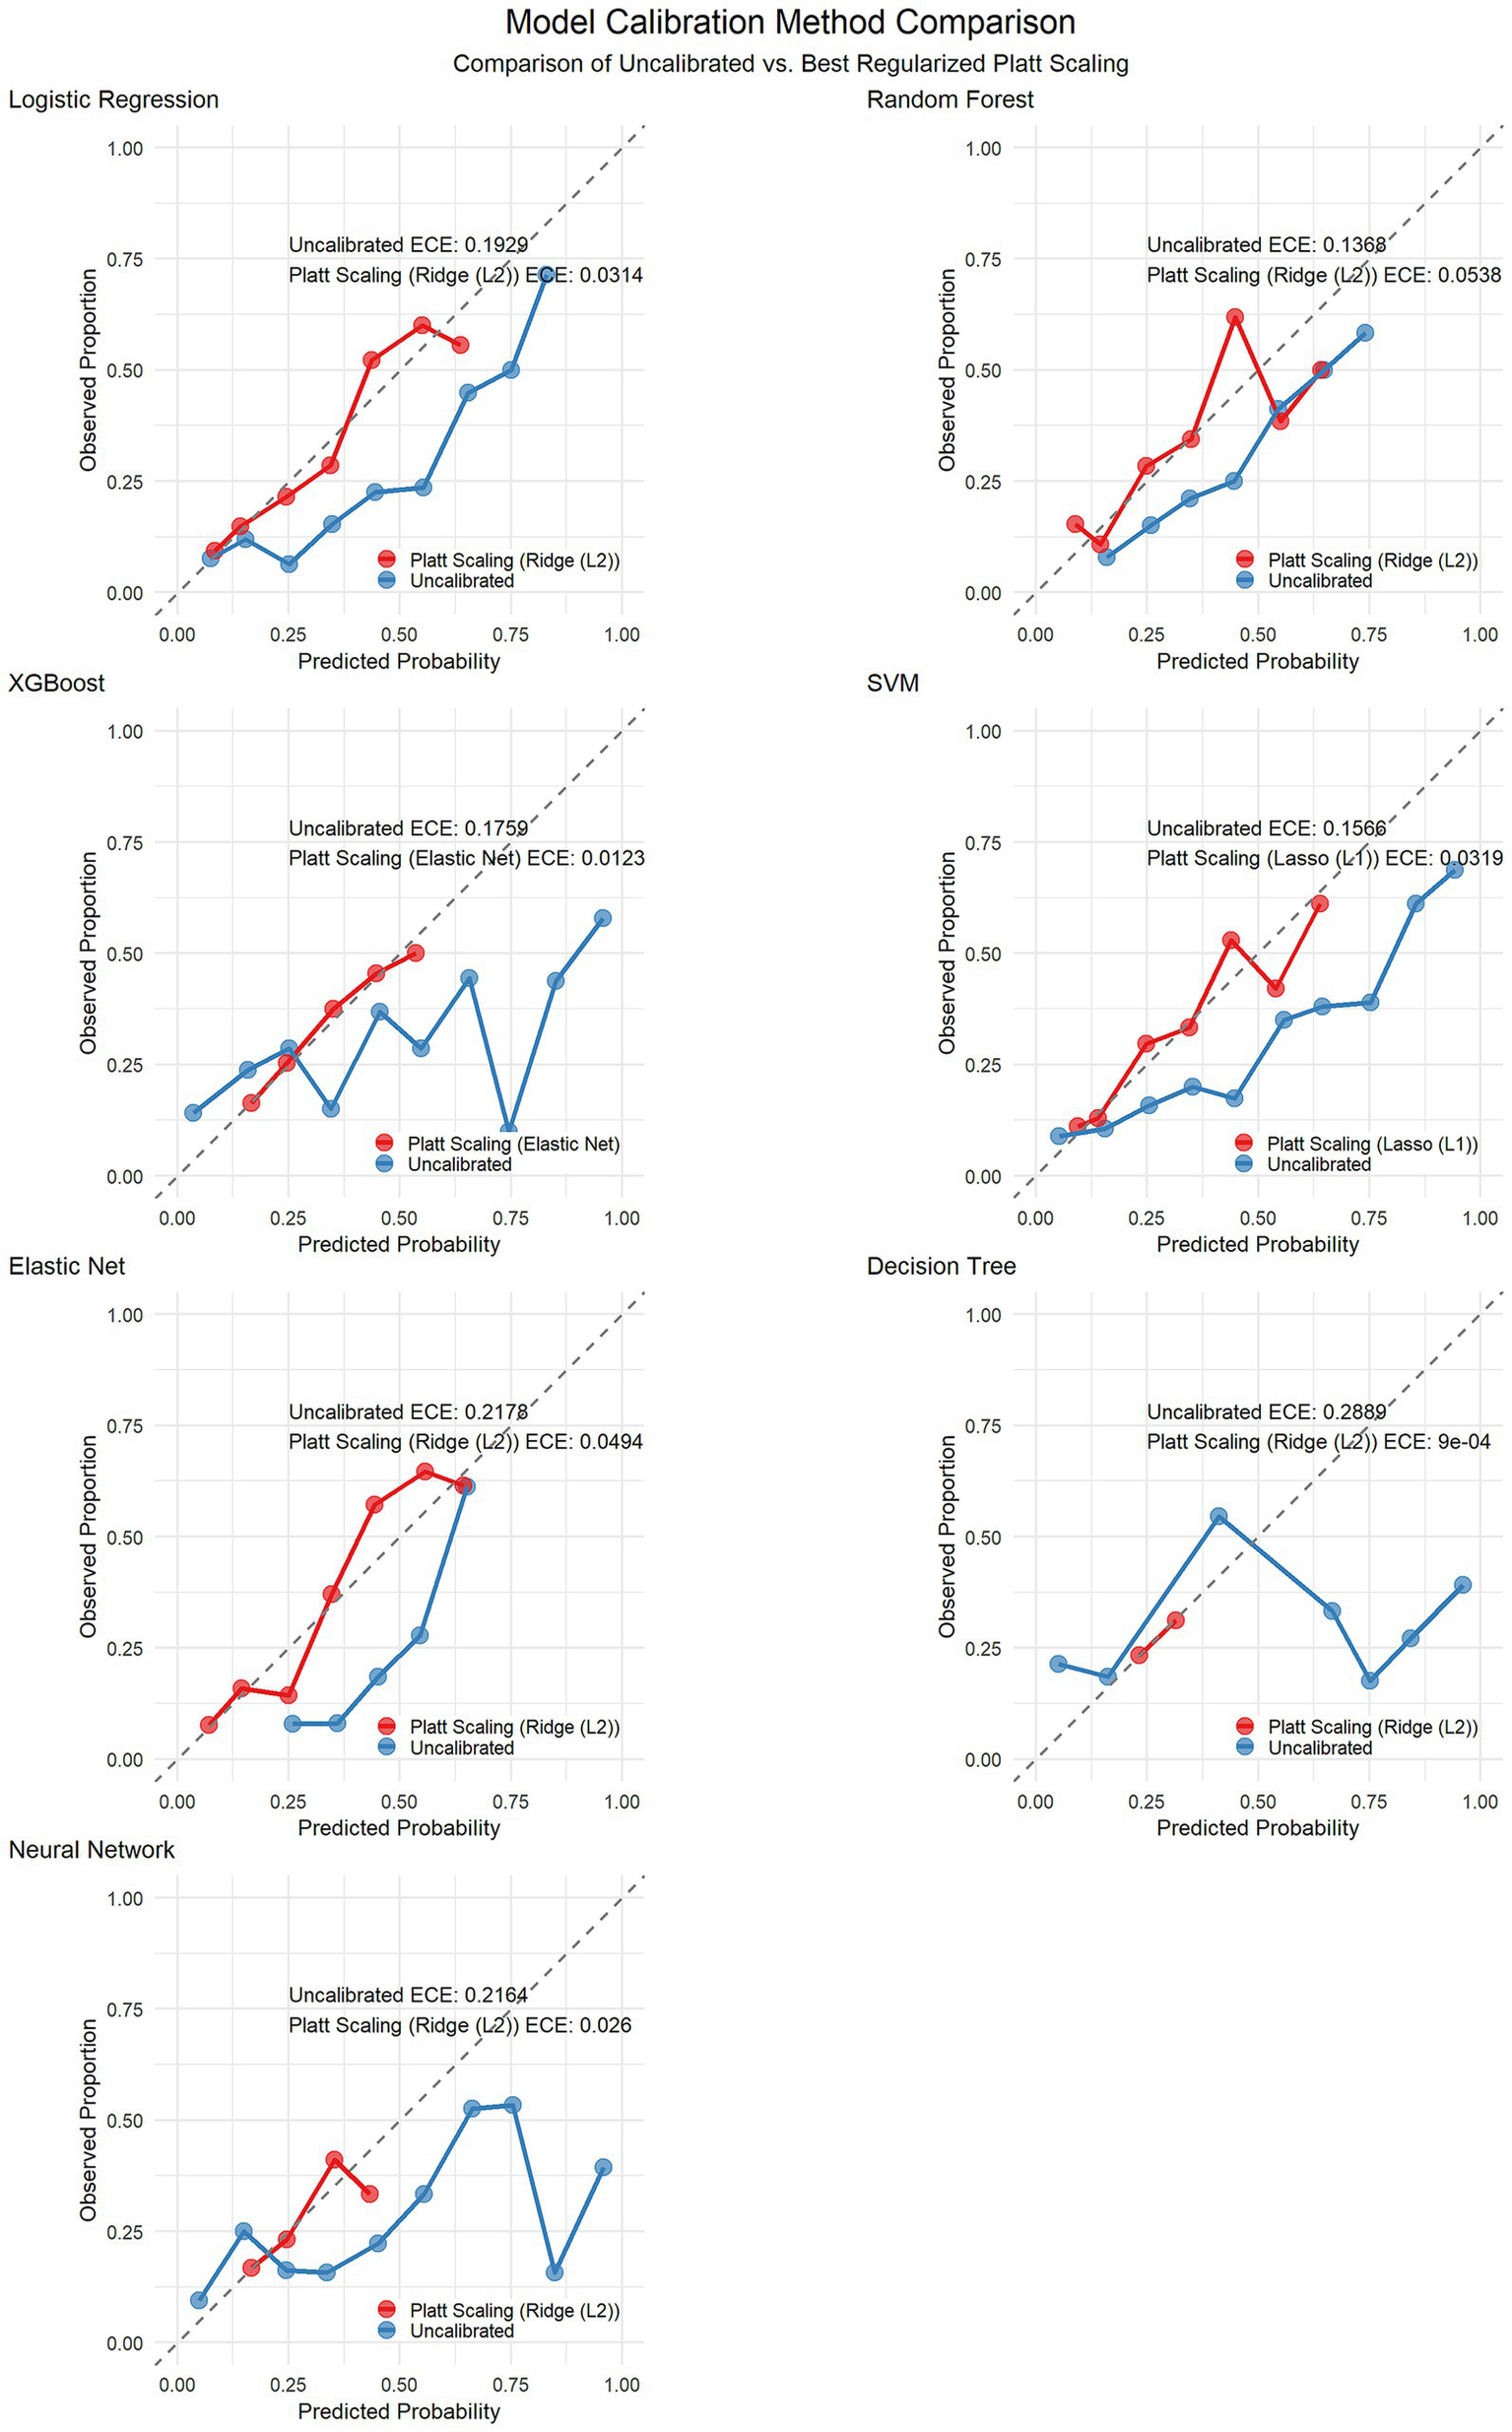
Calibration curves before and after Platt scaling correction for seven machine learning models.
Table 3
| Model | Best calibration method | ECE (before calibration) | ECE (after calibration) | ECE improvement rate (%) | Brier score (before calibration) | Brier score (after calibration) | Brier score improvement rate (%) | LogLoss (before calibration) | LogLoss (after calibration) | LogLoss improvement rate (%) |
|---|---|---|---|---|---|---|---|---|---|---|
| Logistic Regression | Ridge (L2) | 0.1929 | 0.0314 | 83.7 | 0.2008 | 0.16 | 20.3 | 0.5891 | 0.4921 | 16.5 |
| Random Forest | Ridge (L2) | 0.1368 | 0.0538 | 60.7 | 0.1874 | 0.1709 | 8.8 | 0.5564 | 0.5172 | 7 |
| XGBoost | Elastic Net | 0.1759 | 0.0123 | 93 | 0.2166 | 0.1771 | 18.2 | 0.6847 | 0.5353 | 21.8 |
| SVM | Lasso (L1) | 0.1566 | 0.0319 | 79.6 | 0.191 | 0.1587 | 16.9 | 0.575 | 0.4888 | 15 |
| Elastic Net | Ridge (L2) | 0.2178 | 0.0494 | 77.3 | 0.2069 | 0.1556 | 24.8 | 0.6031 | 0.4819 | 20.1 |
| Decision Tree | Ridge (L2) | 0.2889 | 0.0009 | 99.7 | 0.3148 | 0.1864 | 40.8 | 2.3094 | 0.5594 | 75.8 |
| Neural Network | Ridge (L2) | 0.2164 | 0.026 | 88 | 0.2567 | 0.1805 | 29.7 | 0.8926 | 0.5425 | 39.2 |
Calibration performance metrics of the models before and after Platt scaling.
3.6 Feature importance analysis
Although Elastic Net was identified as the optimal model, we conducted a comparative feature importance analysis between Elastic Net and logistic regression (both linear models) to provide more comprehensive feature selection insights. Both models identified the following variables as important predictors: baseline CIMT, absolute monocyte count, sex, age, and LDL-C (Figure 8).
Figure 8
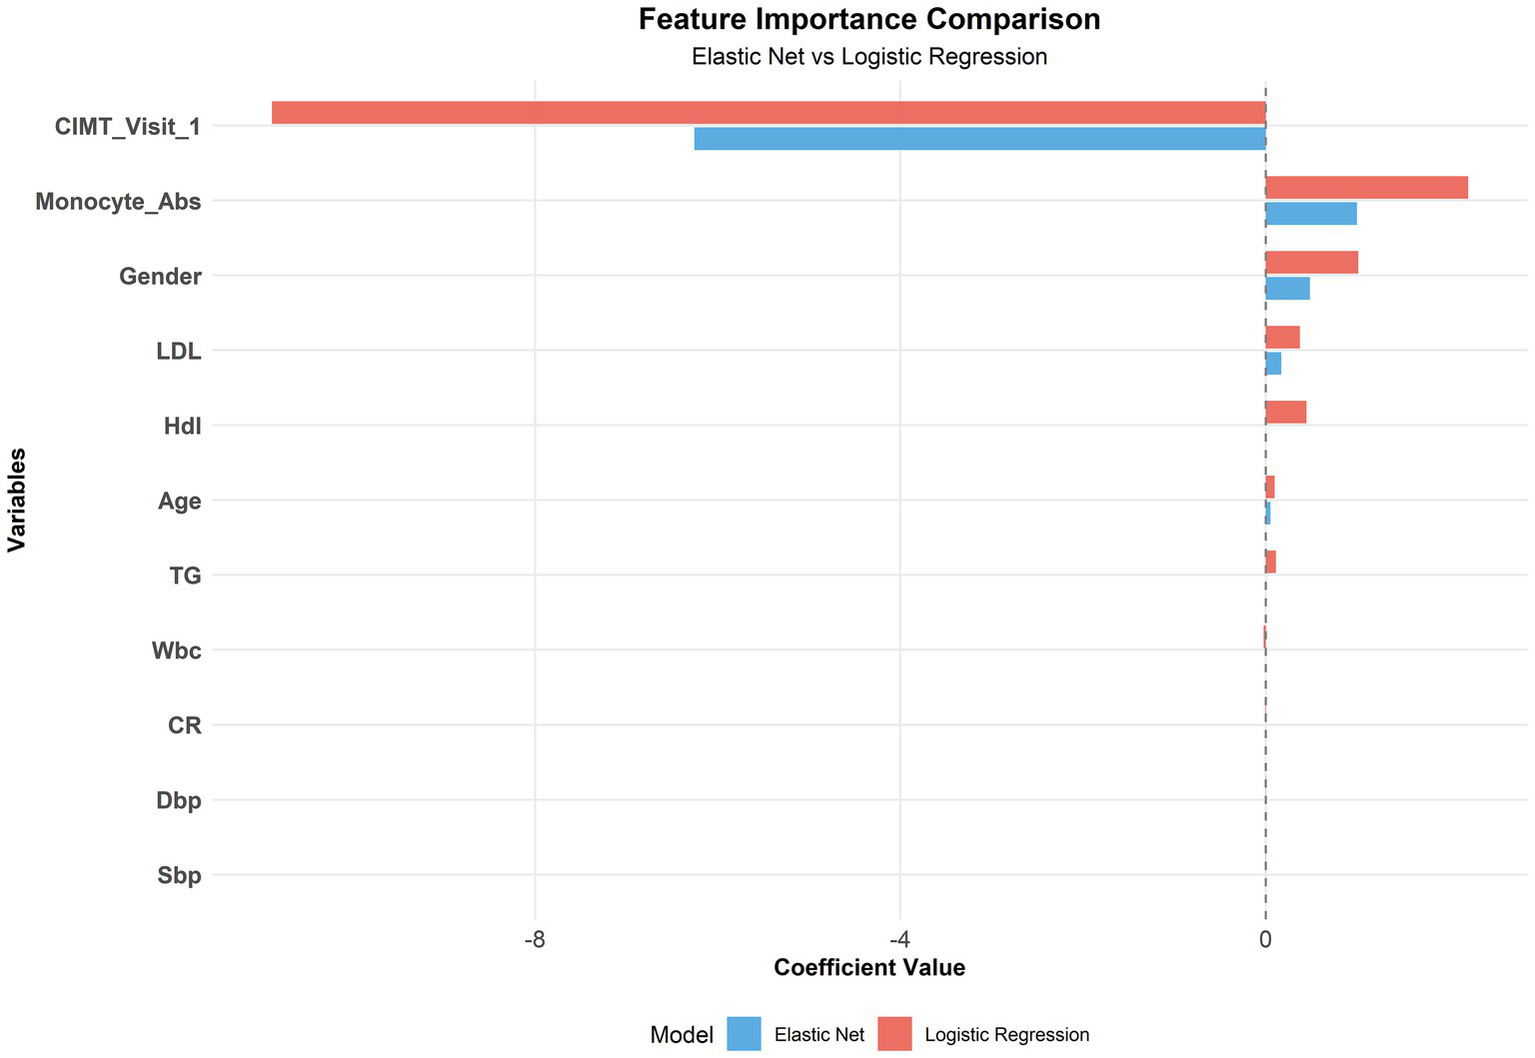
Comparison of the feature importance between the elastic net and logistic regression.
3.7 Subgroup performance analysis
To assess model performance consistency across different patient populations, we conducted stratified analyses of the test set by age (≤35 years, 35–50 years, >50 years), sex (male, female), and baseline CIMT level (low: <0.6 mm, medium: 0.6–0.8 mm, high: >0.8 mm). The sample size distribution across subgroups is presented in Table 4.
Table 4
| Subgroup | Model | N | AUC | Sensitivity | Specificity |
|---|---|---|---|---|---|
| Age group = 35–50 | Decision Tree | 124 | 0.592 | 0.436 | 0.694 |
| Elastic Net | 0.821 | 0.846 | 0.729 | ||
| Logistic Regression | 0.812 | 0.769 | 0.718 | ||
| Neural Network | 0.69 | 0.641 | 0.729 | ||
| Random Forest | 0.761 | 0.59 | 0.918 | ||
| SVM | 0.805 | 0.769 | 0.776 | ||
| XGBoost | 0.744 | 0.513 | 0.894 | ||
| Age group = >50 | Decision Tree | 71 | 0.51 | 0.375 | 0.473 |
| Elastic Net | 0.598 | 0.5 | 0.582 | ||
| Logistic Regression | 0.583 | 0.562 | 0.509 | ||
| Neural Network | 0.615 | 0.5 | 0.655 | ||
| Random Forest | 0.574 | 0.25 | 0.709 | ||
| SVM | 0.637 | 0.375 | 0.764 | ||
| XGBoost | 0.547 | 0.375 | 0.636 | ||
| Age group = ≤35 | Decision Tree | 76 | 0.633 | 0.615 | 0.651 |
| Elastic Net | 0.779 | 0.538 | 0.762 | ||
| Logistic Regression | 0.761 | 0.538 | 0.841 | ||
| Neural Network | 0.57 | 0.538 | 0.651 | ||
| Random Forest | 0.712 | 0.385 | 0.794 | ||
| SVM | 0.731 | 0.615 | 0.73 | ||
| XGBoost | 0.669 | 0.385 | 0.73 | ||
| CIMT group = High | Decision Tree | 65 | 0.479 | 0.3 | 0.673 |
| Elastic Net | 0.484 | 0.1 | 0.855 | ||
| Logistic Regression | 0.529 | 0.1 | 0.782 | ||
| Neural Network | 0.502 | 0.1 | 0.745 | ||
| Random Forest | 0.577 | 0.1 | 0.818 | ||
| SVM | 0.538 | 0.2 | 0.818 | ||
| XGBoost | 0.609 | 0.1 | 0.745 | ||
| CIMT group = Low | Decision Tree | 49 | 0.629 | 0.611 | 0.613 |
| Elastic Net | 0.801 | 1 | 0.419 | ||
| Logistic Regression | 0.79 | 0.944 | 0.516 | ||
| Neural Network | 0.642 | 0.833 | 0.419 | ||
| Random Forest | 0.741 | 0.611 | 0.742 | ||
| SVM | 0.767 | 0.889 | 0.516 | ||
| XGBoost | 0.647 | 0.5 | 0.581 | ||
| CIMT group = Medium | Decision Tree | 157 | 0.535 | 0.425 | 0.598 |
| Elastic Net | 0.786 | 0.725 | 0.701 | ||
| Logistic Regression | 0.775 | 0.7 | 0.709 | ||
| Neural Network | 0.654 | 0.6 | 0.726 | ||
| Random Forest | 0.754 | 0.5 | 0.846 | ||
| SVM | 0.776 | 0.65 | 0.795 | ||
| XGBoost | 0.755 | 0.525 | 0.838 | ||
| Sex = Female | Decision Tree | 98 | 0.606 | 0.591 | 0.632 |
| Elastic Net | 0.827 | 0.727 | 0.803 | ||
| Logistic Regression | 0.824 | 0.682 | 0.816 | ||
| Neural Network | 0.755 | 0.727 | 0.75 | ||
| Random Forest | 0.812 | 0.409 | 0.882 | ||
| SVM | 0.782 | 0.682 | 0.789 | ||
| XGBoost | 0.737 | 0.409 | 0.816 | ||
| Sex = Male | Decision Tree | 173 | 0.541 | 0.391 | 0.614 |
| Elastic Net | 0.73 | 0.696 | 0.638 | ||
| Logistic Regression | 0.712 | 0.674 | 0.63 | ||
| Neural Network | 0.589 | 0.522 | 0.646 | ||
| Random Forest | 0.662 | 0.5 | 0.787 | ||
| SVM | 0.726 | 0.63 | 0.74 | ||
| XGBoost | 0.648 | 0.478 | 0.748 |
Predictive performance of the elastic net model across different subgroups.
To ensure calibration performance across subgroups, we applied Platt scaling to the elastic net model (Table 5). All the subgroups demonstrated improvement. Figure 9 presents the ECE improvement before and after calibration. The predictive performance for the older age and high baseline CIMT subgroups was significantly lower than that for the other groups, suggesting increased prediction difficulty in these populations. Compared with male subjects, female subjects consistently demonstrated superior prediction performance, indicating sex-related prediction bias that warrants consideration in clinical applications. Despite varying initial calibration levels across subgroups, Platt scaling achieved substantial calibration improvements in all subgroups, confirming the robustness of the calibration methodology (see Table 6).
Table 5
| Model | Group | Subgroup | N | ECE_uncalibrated | ECE_calibrated | Improvement |
|---|---|---|---|---|---|---|
| Elastic Net | Age | 35–50 | 124 | 0.2224 | 0.0749 | 66.3 |
| ≤35 | 76 | 0.2719 | 0.0984 | 63.8 | ||
| >50 | 71 | 0.2515 | 0.1401 | 44.3 | ||
| CIMT | High | 65 | 0.2128 | 0.0035 | 98.4 | |
| Low | 49 | 0.2061 | 0.0739 | 64.1 | ||
| Medium | 157 | 0.2433 | 0.0844 | 65.3 | ||
| Sex | Female | 98 | 0.2345 | 0.0485 | 79.3 | |
| Male | 173 | 0.2233 | 0.0872 | 60.9 |
Calibration performance improvement of the elastic net model before and after Platt scaling across different subgroups.
Figure 9
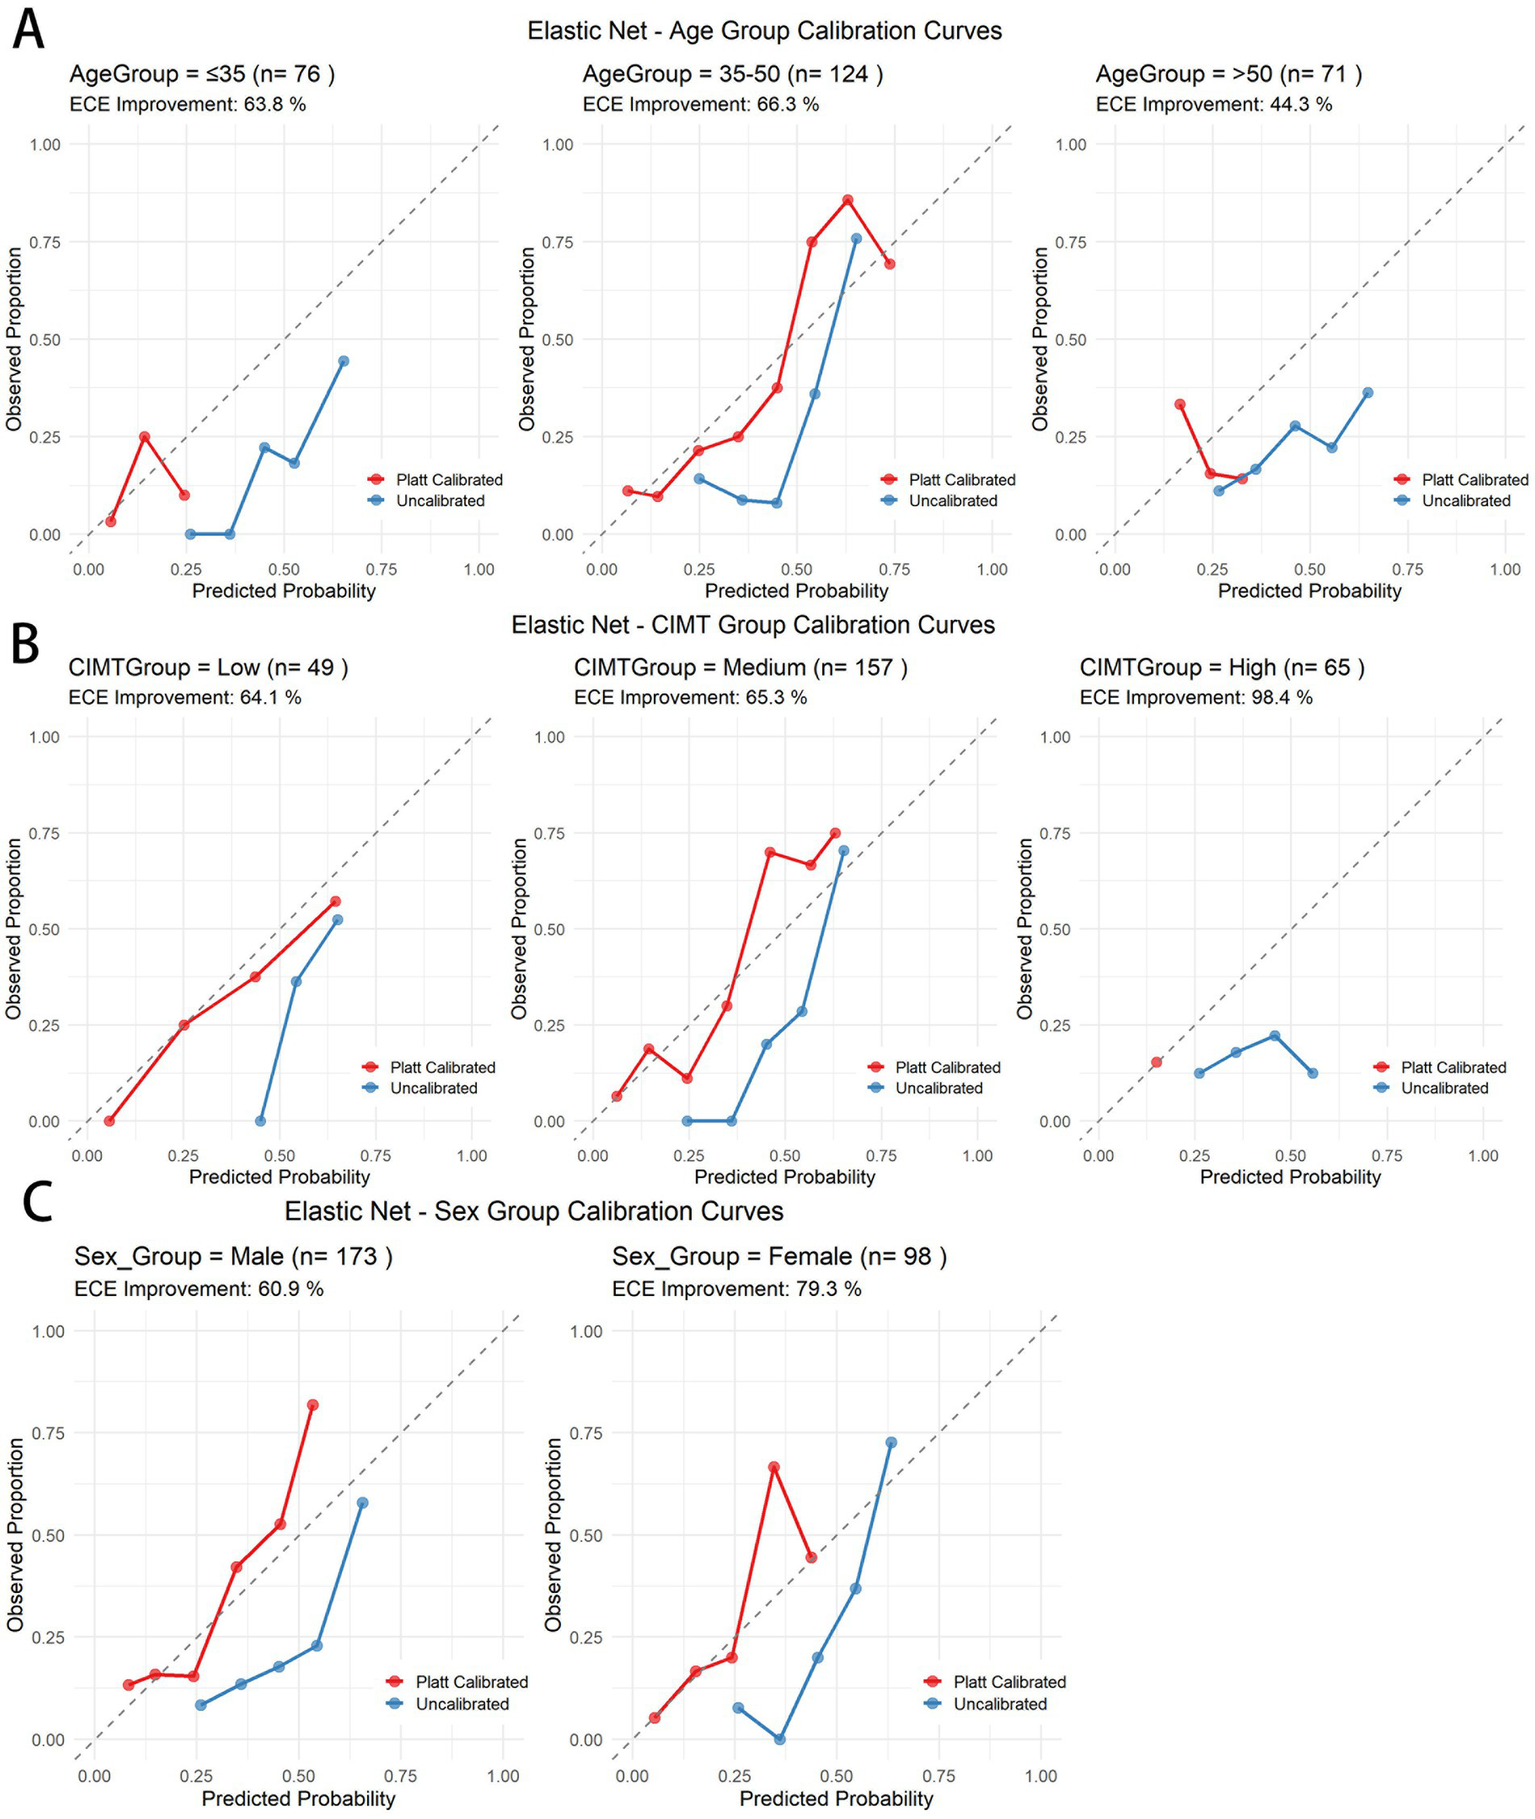
Calibration curves before and after Platt scaling for different subgroups in the elastic net model. (A) Age subgroups. (B) CIMT thickness subgroups. (C) Gender subgroups.
Table 6
| Model | Calibration | Best threshold | Youden index | Sensitivity | Specificity |
|---|---|---|---|---|---|
| Elastic Net | Original | 0.57 | 0.45 | 0.588 | 0.862 |
| Calibrated | 0.36 | 0.445 | 0.588 | 0.857 | |
| SVM | Original | 0.53 | 0.406 | 0.632 | 0.773 |
| Calibrated | 0.3 | 0.406 | 0.632 | 0.773 | |
| Logistic Regression | Original | 0.62 | 0.391 | 0.544 | 0.847 |
| Calibrated | 0.37 | 0.391 | 0.544 | 0.847 | |
| Random Forest | Original | 0.36 | 0.336 | 0.779 | 0.557 |
| Calibrated | 0.2 | 0.346 | 0.794 | 0.552 | |
| Neural Network | Original | 0.48 | 0.297 | 0.618 | 0.68 |
| Calibrated | 0.26 | 0.283 | 0.603 | 0.68 | |
| XGBoost | Original | 0.36 | 0.283 | 0.588 | 0.695 |
| Calibrated | 0.25 | 0.283 | 0.588 | 0.695 | |
| Decision Tree | Original | 0.17 | 0.14 | 0.544 | 0.596 |
| Calibrated | 0.23 | 0.14 | 0.544 | 0.596 |
Comparison of optimal decision thresholds and discriminative metrics before and after Platt scaling across machine learning models.
3.8 Decision curve analysis
To evaluate the clinical utility of the Elastic Net model for predicting CIMT thickening, we conducted decision curve analysis (DCA) and Platt calibration-based risk stratification. See Supplementary material 2 for the DCA graphs of each model.
Youden index analysis revealed that the optimal threshold decreased from 0.57 (sensitivity 0.588, specificity 0.862) in the original model to 0.36 (sensitivity 0.588, specificity 0.857) after calibration, while maintaining similar discriminative ability (Youden index ≈0.45) but providing more accurate probability estimates. The DCA revealed a maximum net benefit threshold of 0.01 (net benefit value 0.243), with positive net benefit maintained across the threshold range of 0.01–0.5, demonstrating the model’s clinical utility across a broad range of thresholds (Figure 10).
Figure 10
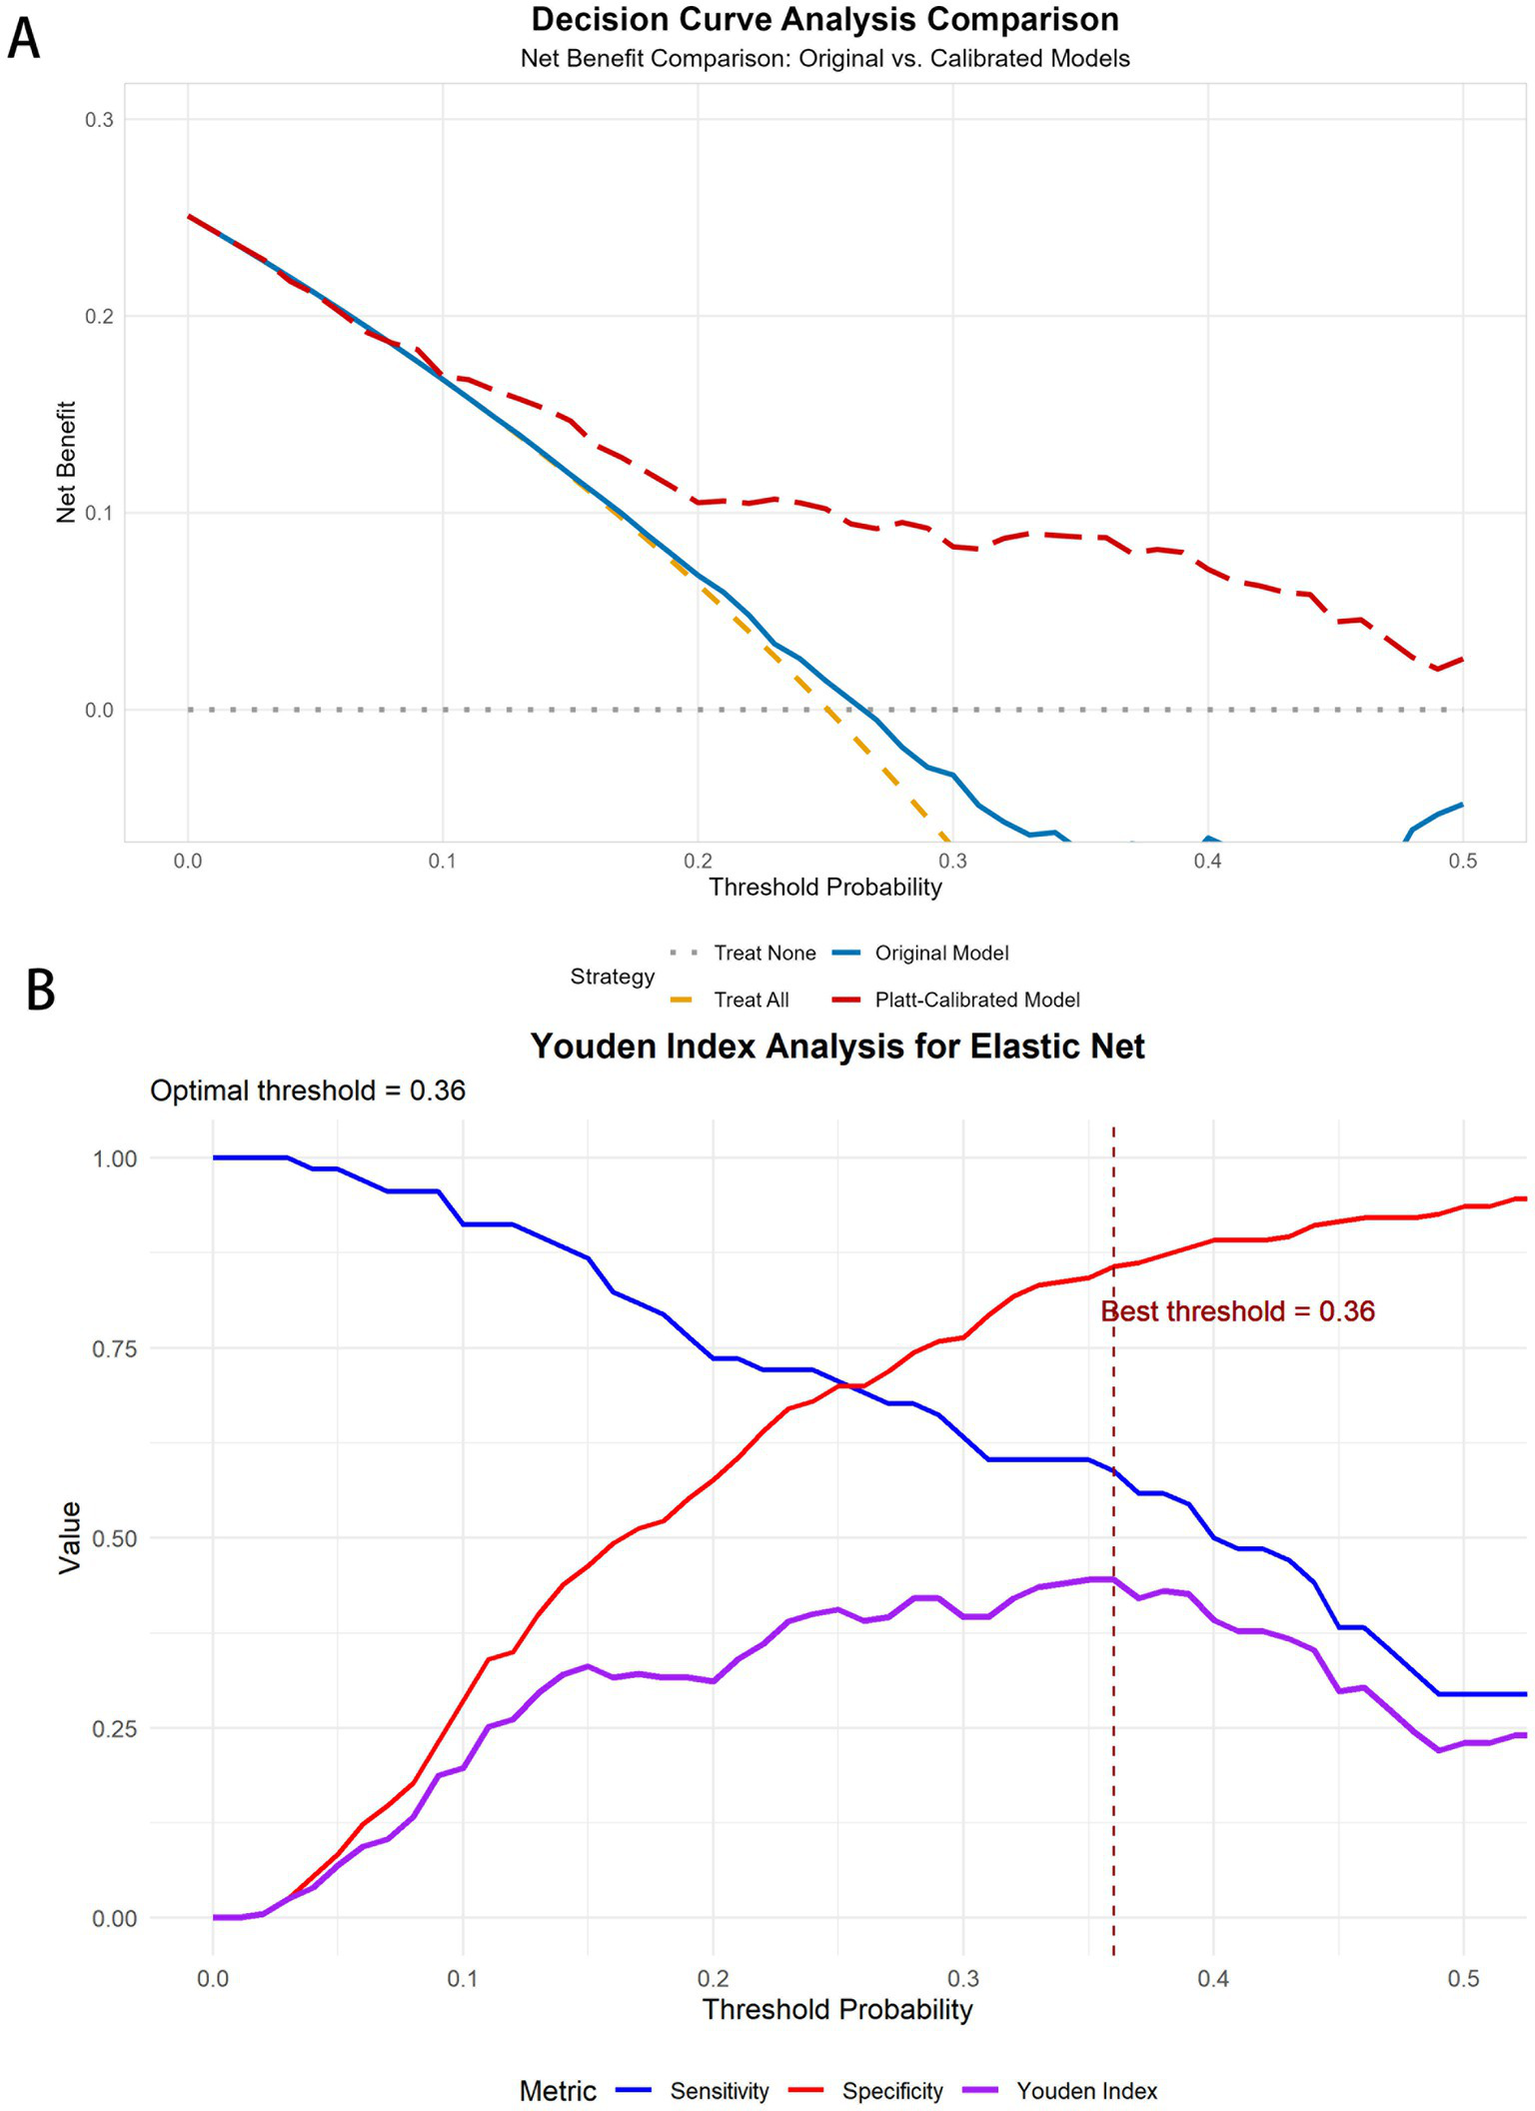
DCA curves and Youden curves for the elastic net. (A) DCA curves for elastic net before and after Platt scaling. (B) Youden index analysis for elastic net.
On the basis of calibrated probabilities and clinical risk stratification, patients were classified into three groups: a medium-risk group (probability <0.36), comprising 202 individuals with an event rate of 13.9%; a high-risk group (probability 0.36–0.41), comprising 14 individuals with an event rate of 50.0%; and a very-high-risk group (probability ≥0.41), comprising 55 individuals with an event rate of 60.0%. This stratification demonstrated a clear risk gradient, providing an objective basis for clinical intervention.
On the basis of these risk stratification results, we recommend differentiated intervention strategies: for the medium-risk group (13.9% event rate), regular follow-up and lifestyle guidance; for the high-risk group (50% event rate), intensified lifestyle interventions and consideration of pharmacological therapy; and for the very-high-risk group (60% event rate), aggressive pharmacological intervention and close monitoring. This stratified intervention approach facilitates the optimization of healthcare resource allocation and enhances cost-effectiveness in preventing and managing CIMT.
4 Discussion
In this three-year prospective cohort study, we developed and validated machine learning models based on routine clinical biomarkers for predicting CIMT progression. Our findings demonstrate that machine learning approaches, particularly the elastic net model, can effectively identify individuals at high risk for CIMT thickening, thereby supporting targeted preventive interventions for atherosclerosis.
Our comprehensive evaluation of seven diverse machine learning algorithms was strategically designed to cover different modeling paradigms. The selection of these specific algorithms was based on several considerations: (1) linear models (logistic regression, elastic net) for interpretability and regularization capabilities; (2) tree-based models (decision tree, random forest, XGBoost) for their ability to capture nonlinear relationships and interactions without requiring extensive feature engineering; (3) kernel-based methods (SVMs) for their effectiveness with high-dimensional data and complex decision boundaries; and (4) neural networks for their potential to model complex patterns through multiple layers of abstraction. This diverse algorithmic approach allowed us to assess whether linear or nonlinear methods were better suited for CIMT progression prediction.
Interestingly, our comparative analysis revealed that simpler models (elastic net, LR, and SVM) outperformed complex algorithms such as random forest and neural networks in our dataset. This finding aligns with previous research indicating that when sample sizes are moderate (as in our study with n = 904) and relationships between predictors and outcomes are predominantly linear, simpler models often perform better than or at least comparably to complex models (27). Additionally, these models have a lower risk of overfitting, which is crucial for ensuring generalizability in clinical applications. The superior performance of the elastic net suggests that the relationship between clinical biomarkers and CIMT progression may be more linear than complex interactions.
A key strength of our study was the implementation of Platt scaling for probability calibration. Our analysis demonstrated that the original models, despite having good discrimination (AUC), produced probability estimates that were not well calibrated, particularly for the neural network and decision tree algorithms, which presented high expected calibration error (ECE) values. By applying Platt scaling with appropriate regularization methods (ridge for elastic net and logistic regression, lasso for SVM), we significantly improved the calibration performance across all the models, with the most dramatic improvements observed in the more complex models.
The significant improvement in the calibration metrics has profound clinical implications. Well-calibrated models provide reliable probability estimates that directly correspond to observed event rates, which is essential for accurate risk stratification in clinical practice (28). When physicians rely on predicted probabilities to guide treatment decisions, poorly calibrated models may lead to inappropriate interventions or missed prevention opportunities (29). Our findings emphasize that when developing clinical prediction tools, attention should be given not only to discrimination metrics such as the AUC but also to ensuring good calibration performance.
Our decision curve analysis (DCA) further validated the clinical utility of the calibrated elastic net model, which demonstrated positive net benefit across a wide range of threshold probabilities (0.01–0.5). The DCA revealed that our model outperformed both the “treat all” and “treat none” strategies within this threshold range, indicating that selective intervention on the basis of our model’s predictions would provide better clinical outcomes than would treating either everyone or no one. The maximum net benefit was observed at a threshold of 0.01 (net benefit value 0.243), suggesting high utility even at low-risk thresholds, while maintaining positive net benefit up to a threshold of 0.5 demonstrated robust clinical applicability across diverse decision-making preferences.
On the basis of our calibrated probability estimates and decision curve analysis, we developed a three-tier risk stratification framework that identified distinct groups with progressively higher event rates: medium-risk (13.9%), high-risk (50.0%), and very-high-risk (60.0%) groups. Youden index analysis revealed that the optimal threshold decreased from 0.57 in the original model to 0.36 after calibration while maintaining similar discriminative ability (Youden index ≈0.45) but providing more accurate probability estimates. This finding underscores the importance of proper calibration for clinical threshold determination.
We combined the absolute threshold cutoff (baseline CIMT ≥1.0 mm) with a dynamic progression warning (increase ≥0.1 mm during follow-up), which, compared with traditional single-dimensional criteria, can both identify structural lesions (baseline values indicating irreversible arterial wall remodeling) and capture active progression (significant increases reflecting accelerated atherosclerotic processes, even when baseline values do not reach the threshold). This integrated criterion better aligns with the ‘cumulative-trigger’ two-stage model of cardiovascular events (30, 31).
CIMT values ≥1.0 mm, as a criterion for thickening, have been recognized in multiple international studies and guidelines (3) and are widely accepted as indicators of subclinical atherosclerosis. An increase of ≥0.1 mm in consecutive measurements reflects progressive changes in arterial wall structure, potentially indicating active progression of vascular lesions even when the absolute value has not reached the 1.0 mm threshold. Multiple prospective studies have shown that rapid CIMT progression is associated with increased cardiovascular event risk. Moreover, evidence suggests that CIMT progression itself (independent of baseline values) is associated with increased cardiovascular event risk (32, 33).
Moreover, the finding that the baseline CIMT is the strongest predictor aligns with previous research suggesting that subclinical atherosclerosis may promote further plaque development through mechanical and inflammatory mechanisms (34). The important contribution of inflammatory markers (monocyte count) in our model supports the increasingly recognized view that inflammation is a key driver of atherosclerotic progression (35–37).
Several limitations of our study warrant consideration. First and foremost, our model was developed and validated with data from a single center (Third Xiangya Hospital of Central South University Health Examination Cohort), which may limit its generalizability. The lack of external validation in diverse populations across different ethnic backgrounds, geographic regions, and healthcare settings represents a significant limitation that may lead to overestimation of the model’s actual applicability and performance in real-world settings. External validation across multiple diverse cohorts should be a priority for future research to establish the model’s true clinical value.
Second, while our comprehensive algorithm selection covered major machine learning paradigms, emerging deep learning approaches specifically designed for longitudinal data, such as recurrent neural networks or transformer models, were not evaluated. These methods might capture temporal patterns in CIMT progression more effectively and could be explored in future studies with larger datasets containing more temporal measurements.
Third, despite conducting subgroup analyses, the sample sizes for certain subgroups (particularly the >50 age group and high baseline CIMT group) were relatively small, which may have contributed to the observed performance limitations. The short and significantly deviating calibration curves in these subgroups reflect this limitation and suggest caution when applying the model to these populations. Future studies with enriched sampling of these challenging subgroups could help develop more robust prediction approaches for these specific populations.
Fourth, our feature set was limited to routinely available clinical and laboratory parameters. The incorporation of additional data modalities, such as genetic markers, advanced imaging features, or novel biomarkers of vascular inflammation, might increase the prediction accuracy, particularly for subgroups in which the current performance is suboptimal.
Finally, while our three-year follow-up period allows for meaningful assessment of CIMT progression, longer-term studies would provide valuable insights into the durability of prediction and the relationship between predicted CIMT progression and hard cardiovascular outcomes. The integration of cardiovascular event data strengthens the clinical relevance of our prediction model.
Statements
Data availability statement
The raw data supporting the conclusions of this article will be made available by the authors, without undue reservation.
Ethics statement
The studies involving humans were approved by Institutional Ethical Review Board (IRB) of the Research Ethics Committee of Xiangya Third Hospital of Central South University (Approval No. R18030). The studies were conducted in accordance with the local legislation and institutional requirements. Written informed consent for participation was not required from the participants or the participants’ legal guardians/next of kin in accordance with the national legislation and institutional requirements.
Author contributions
AZ: Writing – review & editing, Writing – original draft. KC: Writing – original draft. YW: Writing – original draft. QY: Writing – original draft. YX: Writing – original draft. RS: Writing – original draft. JW: Writing – original draft. W-DL: Writing – review & editing.
Funding
The author(s) declare that financial support was received for the research and/or publication of this article. This research was funded by the Key Program of Regional Innovative Development Joint Funds of the National Natural Science Foundation of China (Grant No. U24A20774), the Chinese Cardiovascular Association-ASCVD Fund (2023-CCA-ASCVD-018), and the Project of State Key Clinical Department (Z2023058).
Conflict of interest
The authors declare that the research was conducted in the absence of any commercial or financial relationships that could be construed as a potential conflict of interest.
Generative AI statement
The authors declare that no Gen AI was used in the creation of this manuscript.
Publisher’s note
All claims expressed in this article are solely those of the authors and do not necessarily represent those of their affiliated organizations, or those of the publisher, the editors and the reviewers. Any product that may be evaluated in this article, or claim that may be made by its manufacturer, is not guaranteed or endorsed by the publisher.
Supplementary material
The Supplementary material for this article can be found online at: https://www.frontiersin.org/articles/10.3389/fmed.2025.1593662/full#supplementary-material
References
1.
Li Z Yang Y Wang X Yang N He L Wang J et al . Comparative analysis of atherosclerotic cardiovascular disease burden between ages 20–54 and over 55 years: insights from the Global Burden of Disease Study 2019. BMC Med. (2024) 22:303. doi: 10.1186/s12916-024-03527-4
2.
Olmastroni E Baragetti A Casula M Grigore L Pellegatta F Pirillo A et al . Multilevel models to estimate carotid intima-media thickness curves for individual cardiovascular risk evaluation. Stroke. (2019) 50:1758–65. doi: 10.1161/STROKEAHA.118.024692
3.
Touboul PJ Hennerici MG Meairs S Adams H Amarenco P Bornstein N et al . Mannheim carotid intima-media thickness and plaque consensus (2004-2006-2011). An update on behalf of the advisory board of the 3rd, 4th and 5th watching the risk symposia, at the 13th, 15th and 20th European Stroke Conferences, Mannheim, Germany, 2004, Brussels, Belgium, 2006, and Hamburg, Germany, 2011. Cerebrovasc Dis. (2012) 34:290–6. doi: 10.1159/000343145
4.
Stein JH Korcarz CE Hurst RT Lonn E Kendall CB Mohler ER et al . Use of carotid ultrasound to identify subclinical vascular disease and evaluate cardiovascular disease risk: a consensus statement from the American Society of Echocardiography Carotid Intima-Media Thickness Task Force. Endorsed by the Society for Vascular Medicine. J Am Soc Echocardiogr. (2008) 21:93–111. doi: 10.1016/j.echo.2007.11.011
5.
O’Leary DH Polak JF Kronmal RA Manolio TA Burke GL Wolfson SK . Carotid-artery intima and media thickness as a risk factor for myocardial infarction and stroke in older adults. Cardiovascular Health Study Collaborative Research Group. N Engl J Med. (1999) 340:14–22. doi: 10.1056/NEJM199901073400103
6.
Lorenz MW Markus HS Bots ML Rosvall M Sitzer M . Prediction of clinical cardiovascular events with carotid intima-media thickness: a systematic review and meta-analysis. Circulation. (2007) 115:459–67. doi: 10.1161/CIRCULATIONAHA.106.628875
7.
Polak JF Pencina MJ Pencina KM O’Donnell CJ Wolf PA D’Agostino RB . Carotid-wall intima-media thickness and cardiovascular events. N Engl J Med. (2011) 365:213–21. doi: 10.1056/NEJMoa1012592
8.
Peters SAE den Ruijter HM Bots ML Moons KGM . Improvements in risk stratification for the occurrence of cardiovascular disease by imaging subclinical atherosclerosis: a systematic review. Heart. (2012) 98:177–84. doi: 10.1136/heartjnl-2011-300747
9.
Baber U Mehran R Sartori S Schoos MM Sillesen H Muntendam P et al . Prevalence, impact, and predictive value of detecting subclinical coronary and carotid atherosclerosis in asymptomatic adults: the bioimage study. J Am Coll Cardiol. (2015) 65:1065–74. doi: 10.1016/j.jacc.2015.01.017
10.
Amato M Veglia F de Faire U Giral P Rauramaa R Smit AJ et al . Carotid plaque-thickness and common carotid IMT show additive value in cardiovascular risk prediction and reclassification. Atherosclerosis. (2017) 263:412–9. doi: 10.1016/j.atherosclerosis.2017.05.023
11.
Deo RC . Machine learning in medicine. Circulation. (2015) 132:1920–30. doi: 10.1161/CIRCULATIONAHA.115.001593
12.
Ambale-Venkatesh B Yang X Wu CO Liu K Hundley WG McClelland R et al . Cardiovascular event prediction by machine learning: the multi-ethnic study of atherosclerosis. Circ Res. (2017) 121:1092–101. doi: 10.1161/CIRCRESAHA.117.311312
13.
Arzani A Wang J-X Sacks MS Shadden SC . Machine learning for cardiovascular biomechanics modeling: challenges and beyond. Ann Biomed Eng. (2022) 50:615–27. doi: 10.1007/s10439-022-02967-4
14.
Wang Z Gu Y Huang L Liu S Chen Q Yang Y et al . Construction of machine learning diagnostic models for cardiovascular pan-disease based on blood routine and biochemical detection data. Cardiovasc Diabetol. (2024) 23:351. doi: 10.1186/s12933-024-02439-0
15.
Shameer K Johnson KW Glicksberg BS Dudley JT Sengupta PP . Machine learning in cardiovascular medicine: are we there yet?Heart. (2018) 104:1156–64. doi: 10.1136/heartjnl-2017-311198
16.
Williams B Mancia G Spiering W Agabiti Rosei E Azizi M Burnier M et al . 2018 ESC/ESH guidelines for the management of arterial hypertension. Eur Heart J. (2018) 39:3021–104. doi: 10.1093/eurheartj/ehy339
17.
Yang T Wang Y Zhang X Xiang S Wen J Wang W et al . Prevalence and influencing factors of abnormal carotid artery intima-media thickness in Henan Province in China. Front Endocrinol. (2023) 14:1266207. doi: 10.3389/fendo.2023.1266207
18.
Bytyçi I Shenouda R Wester P Henein MY . Carotid atherosclerosis in predicting coronary artery disease: a systematic review and meta-analysis. Arterioscler Thromb Vasc Biol. (2021) 41:e224. doi: 10.1161/ATVBAHA.120.315747
19.
van den Oord SCH Sijbrands EJG ten Kate GL van Klaveren D van Domburg RT van der Steen AFW et al . Carotid intima-media thickness for cardiovascular risk assessment: systematic review and meta-analysis. Atherosclerosis. (2013) 228:1–11. doi: 10.1016/j.atherosclerosis.2013.01.025
20.
Sievering EM Grosshennig A Kottas M Ernst J Ringlstetter R Koch A et al . Diagnostic value of carotid intima-media thickness and clinical risk scores in determining etiology of ischemic stroke. Eur Stroke J. (2023) 8:738–46. doi: 10.1177/23969873231182492
21.
Salonen JT Salonen R . Ultrasound b-mode imaging in observational studies of atherosclerotic progression. Circulation. (1993) 87:II56–65.
22.
Vickers AJ Elkin EB . Decision curve analysis: a novel method for evaluating prediction models. Med Decis Mak. (2006) 26:565–74. doi: 10.1177/0272989X06295361
23.
Vickers AJ Van Calster B Steyerberg EW . Net benefit approaches to the evaluation of prediction models, molecular markers, and diagnostic tests. BMJ. (2016) 352:i6. doi: 10.1136/bmj.i6
24.
Fitzgerald M Saville BR Lewis RJ . Decision curve analysis. JAMA. (2015) 313:409–10. doi: 10.1001/jama.2015.37
25.
Van Calster B Wynants L Verbeek JF Verbakel JY Christodoulou E Vickers AJ et al . Reporting and interpreting decision curve analysis: a guide for investigators. Eur Urol. (2018) 74:796–804. doi: 10.1016/j.eururo.2018.08.038
26.
Kerr KF Brown MD Zhu K Janes HJ . Assessing the clinical impact of risk prediction models with decision curves: guidance for correct interpretation and appropriate use. J Clin Oncol. (2016) 34:2534–40. doi: 10.1200/JCO.2015.65.5654
27.
Christodoulou E Ma J Collins GS Steyerberg EW Verbakel JY Van Calster B . A systematic review shows no performance benefit of machine learning over logistic regression for clinical prediction models. J Clin Epidemiol. (2019) 110:12–22. doi: 10.1016/j.jclinepi.2019.02.004
28.
Van Calster B McLernon DJ van Smeden M Wynants L Steyerberg EW . Calibration: the Achilles heel of predictive analytics. BMC Med. (2019) 17:230. doi: 10.1186/s12916-019-1466-7
29.
Shah ND Steyerberg EW Kent DM . Big data and predictive analytics: recalibrating expectations. JAMA. (2018) 320:27–8. doi: 10.1001/jama.2018.5602
30.
Libby P Ridker PM Hansson GK . Progress and challenges in translating the biology of atherosclerosis. Nature. (2011) 473:317–25. doi: 10.1038/nature10146
31.
Spence JD Hegele RA . Noninvasive phenotypes of atherosclerosis: similar windows but different views. Stroke. (2004) 35:649–53. doi: 10.1161/01.STR.0000116103.19029.DB
32.
Polak JF Pencina MJ O’Leary DH D’Agostino RB . Common carotid artery intima-media thickness progression as a predictor of stroke in multi-ethnic study of atherosclerosis. Stroke. (2011) 42:3017–21. doi: 10.1161/STROKEAHA.111.625186
33.
Baldassarre D Veglia F Hamsten A Humphries SE Rauramaa R de Faire U et al . Progression of carotid intima-media thickness as predictor of vascular events: results from the improve study. Arterioscler Thromb Vasc Biol. (2013) 33:2273–9. doi: 10.1161/ATVBAHA.113.301844
34.
Wannarong T Parraga G Buchanan D Fenster A House AA Hackam DG et al . Progression of carotid plaque volume predicts cardiovascular events. Stroke. (2013) 44:1859–65. doi: 10.1161/STROKEAHA.113.001461
35.
Ridker PM Everett BM Thuren T Mac Fadyen JG Chang WH Ballantyne C et al . Antiinflammatory therapy with canakinumab for atherosclerotic disease. N Engl J Med. (2017) 377:1119–31. doi: 10.1056/NEJMoa1707914
36.
Herrington W Lacey B Sherliker P Armitage J Lewington S . Epidemiology of atherosclerosis and the potential to reduce the global burden of atherothrombotic disease. Circ Res. (2016) 118:535–46. doi: 10.1161/CIRCRESAHA.115.307611
37.
Libby P Ridker PM Hansson GK . Inflammation in atherosclerosis: from pathophysiology to practice. J Am Coll Cardiol. (2009) 54:2129–38. doi: 10.1016/j.jacc.2009.09.009
Summary
Keywords
carotid intima–media thickness (CIMT), machine learning, atherosclerosis progression, risk prediction, cardiovascular prevention
Citation
Zhou A, Chen K, Wei Y, Ye Q, Xiao Y, Shi R, Wang J and Li W-D (2025) Machine learning-based prediction of carotid intima–media thickness progression: a three-year prospective cohort study. Front. Med. 12:1593662. doi: 10.3389/fmed.2025.1593662
Received
14 March 2025
Accepted
28 May 2025
Published
12 June 2025
Volume
12 - 2025
Edited by
Taminul Islam, Southern Illinois University Carbondale, United States
Reviewed by
Gang Ye, Sichuan Agricultural University, China
Qiaoqiao Xu, Third Affiliated Hospital of Anhui Medical University, China
Updates
Copyright
© 2025 Zhou, Chen, Wei, Ye, Xiao, Shi, Wang and Li.
This is an open-access article distributed under the terms of the Creative Commons Attribution License (CC BY). The use, distribution or reproduction in other forums is permitted, provided the original author(s) and the copyright owner(s) are credited and that the original publication in this journal is cited, in accordance with accepted academic practice. No use, distribution or reproduction is permitted which does not comply with these terms.
*Correspondence: Jiangang Wang, 395896584@qq.comWei-Dong Li, liweidong98@tmu.edu.cn
†These authors have contributed equally to this work
Disclaimer
All claims expressed in this article are solely those of the authors and do not necessarily represent those of their affiliated organizations, or those of the publisher, the editors and the reviewers. Any product that may be evaluated in this article or claim that may be made by its manufacturer is not guaranteed or endorsed by the publisher.