Abstract
Objective:
To explore the predictive value of peak systolic velocity (PSV) ratio, PSV1 and PSV2 of ophthalmic artery Doppler in pregnant women for small for gestational age (SGA) infants and to construct a nomogram prediction model.
Methods:
A total of 201 pregnant women who visited our hospital from March 2022 to June 2024 were selected as the research subjects, and their clinical data and ophthalmic artery Doppler parameters were collected. The data were randomly divided into a training set (n = 295) and a verification set (n = 126) in a 7:3 ratio. The independent risk factors for SGA were screened by univariate and multivariate Logistic regression analysis, and the nomogram model was constructed. The model calibration degree, prediction efficiency and clinical value were evaluated.
Results:
The incidence of SGA in the training and validation sets was 25.42 and 25.31%, respectively. Multivariate Logistic regression analysis showed that PSV ratio of ophthalmic artery, PSV1, PSV2, Pulse index 1 (PI1), PI2, and gestational week were the independent risk factors for SGA (all p < 0.05). The C-index of the nomogram model in the training set and the verification set was 0.858 and 0.835, respectively, the area under the ROC curve (AUC) was 0.858 (95% CI: 0.804–0.912) and 0.835 (95% CI: 0.734–0.936), and the sensitivity and specificity were 0.887, 0.747 and 0.636 and 0.833, respectively. The calibration curve showed good agreement between the predicted and actual values, respectively, which was good by the Hosmer-Lemeshow test. The analysis of decision curve showed that the model had high clinical application value in the range of threshold probability 0.10–0.80.
Conclusion:
The nomogram model based on PSV ratio of ophthalmic artery Doppler, PSV1, and PSV2 has good prediction performance for SGA, and provides a new tool for early clinical recognition of high-risk pregnant women with SGA. However, the accuracy and applicability of the model still need to be further verified in the multi-center large sample study.
1 Introduction
Small for Gestational Age (SGA) is defined as the newborn whose birth weight is lower than the 10th centile of the mean weight for gestational age. Its perinatal morbidity and mortality are high, and it may face the risks of growth retardation and metabolic diseases in the long term (1). Accurately predicting the occurrence of SGA is of great significance for early intervention and improving the prognosis of mother and infant. Ophthalmic artery, a maternal vessel branching from the internal carotid artery, Doppler ultrasound as a non-invasive and repeatable imaging method, its hemodynamic parameters may be associated with fetal growth and development through maternal-placental circulation interactions. Studies have shown that its parameters are closely related to fetal growth restriction. However, there are few studies on the SGA prediction model based on multi-parameters of ophthalmic artery Doppler (2). In addition, the clinical significance of novel parameters such as first peak systolic velocity (PSV1) and second peak systolic velocity (PSV2) in the assessment of maternal ophthalmic artery hemodynamics and their association with SGA has not been completely clarified (3). At present, there are few studies on joint multi-parameter prediction model in China and abroad, and it is lack of verification based on large sample queue. This study was intended to include single-fetus pregnant women who were archived in the obstetrics department of our hospital from March 2022 to June 2024 through a retrospective cohort study, and to collect the ophthalmic artery Doppler ultrasound data at ≥28 weeks of gestation. The study will focus on analyzing the correlation between PSV ratio, PSV1, PSV2 and the centile of neonatal birth weight, screening the independent risk factors using Logistic regression model, and verifying the stability of the model by Bootstrap method. The finally constructed nomogram prediction model will integrate clinical indicators with ultrasound parameters, aiming to achieve layered early warning for SGA. The innovation of this study lies in the combination of ophthalmic artery blood flow parameters and placental function indicators for the first time, which provides a quantifiable prediction tool for clinical practice and is expected to promote the change of SGA prevention and control strategy from empirical intervention to precise management (4).
2 Materials and methods
2.1 Subjects
A total of 421 pregnant women who visited the obstetrics department of our hospital from March 2022 to June 2024 were selected as the research subjects. Inclusion criteria: ① single pregnancy; ② Gestation week ≥28 weeks (determined by last menstrual period and confirmed by first-trimester ultrasound biometry); ③ Doppler examination of ophthalmic artery was performed before delivery; ④ Sign informed consent form. Exclusion criteria: ① Patients with severe pregnancy complications (such as preeclampsia and gestational diabetes mellitus); ② The fetus has structural deformity or chromosome abnormality; ③ Smoking and alcohol abuse during pregnancy; ④ those with incomplete data. The patients were divided into a training set (n = 295) and a verification set (n = 126) using random number table. This study was approved by the Hospital Ethics Committee.
2.2 Data collection
Demographic data including maternal age, pre-pregnancy BMI (calculated as kg/m2), and ethnicity (all participants in this study were Han Chinese) were collected. The ophthalmic artery was examined using a Philips EPIQ 5 color Doppler ultrasound system (Philips Healthcare, Amsterdam, the Netherlands) equipped with a 7.5 MHz linear transducer. The patient was in a supine position after a 5-min rest period with eyes closed (5). The artery was identified medial and superior to the optic nerve via color flow imaging, and pulsed-wave Doppler was applied with a 2 mm sample gate, 125 kHz pulse repetition frequency, 50 Hz high-pass filter, and insonation angle <20 degrees. Three to four consecutive waveforms were recorded for each eye, and parameters were averaged from two measurements per eye to minimize variability (6). Specifically, the following parameters were measured: ① PSV1: The highest velocity of blood flow during systole in the ipsilateral ophthalmic artery, reflecting the arterial blood flow velocity during ventricular contraction.; ② End diastolic flow velocity (EDV1): The lowest velocity of blood flow during diastole in the ipsilateral ophthalmic artery, reflecting the residual blood flow during ventricular relaxation. ③ Pulse index 1 (PI1): Calculated as (PSV1 − EDV1)/mean flow velocity, which reflects the resistance to blood flow and is influenced by vascular compliance and peripheral resistance ④ Resistance index 1(RI1): Calculated as (PSV1 − EDV1)/PSV1, a marker of vascular resistance; higher values indicate increased resistance. For each ophthalmic artery, three to four consecutive waveforms were recorded, and parameters were derived from the same artery: PSV1 (first peak systolic velocity), PSV2 (second peak systolic velocity), EDV1/EDV2 (corresponding end diastolic velocities), PI1/PI2 (pulsatility indices), and RI1/RI2 (resistance indices), and the PSV ratio (PSV1/PSV2) was calculated. Neonatal birth weight, length, head circumference and other indicators were recorded, and whether SGA was determined according to the gestational age and gender reference standard growth curve.
2.3 Diagnostic criteria
The SGA was diagnosed as having a birth weight less than the 10th percentile of the weight of a gestational age, sex-matched newborn (using a Fenton growth curve).
2.4 Estimation of sample size
Sample size calculation was performed using PASS 15.0 software based on previous literature and preliminary data. Considering the incidence of SGA as approximately 25% in the target population, with a significance level (α) set at 0.05 (two-tailed) and statistical power (1-β) at 80%, the minimum required sample size was estimated to be 385 cases. Accounting for potential loss to follow-up (10%), a total of 421 pregnant women were enrolled in this study, which met the statistical requirements.
2.5 Statistical analysis
SPSS25.0 and R4.0.3 software were used for data analysis. When the measurement data conforms to the normal distribution, the measurement data were expressed as mean ± standard deviation (SD), and the comparison between the two groups is made by t-test. M (Q1, Q3) is used when it does not conform to the normal distribution, and Mann–Whitney U test is used for comparison between groups. The count data were expressed as number of cases and percentage (n, %), and the comparison between groups was performed by χ test. Logistic regression analysis was used to screen the independent risk factors affecting the curative effect of treatment. Application of r software to construct nomograph prediction model based on independent risk factors. The receiver operating characteristic (ROC) curve was used to evaluate the prediction performance of the model, and the Area Under Curve (AUC) and 95% Confidence Interval (CI) were calculated. A calibration curve was used to evaluate the consistency of the model predictions with the actual observations. p < 0.05 was considered as the difference with statistical significance.
3 Results
3.1 Comparison of general clinical characteristics between training set and verification set
There was no significant difference in general clinical characteristics such as age, gestational week, pre-pregnancy BMI, history of hypertension and diabetes between the two groups (all p > 0.05) (Table 1).
Table 1
| Index | Training set (n = 295) | Validation set (n = 126) | Statistical values | P | |
|---|---|---|---|---|---|
| Age (years) | 28.89 ± 3.25 | 28.49 ± 3.35 | 1.146 | 0.253 | |
| Gestational weeks | 37.88 ± 1.44 | 38.01 ± 1.23 | 0.885 | 0.377 | |
| Pre-pregnancy BMI (kg/m2) | 23.82 ± 2.63 | 24.16 ± 2.56 | 1.224 | 0.222 | |
| Uterine artery PI | 1.75 ± 0.25 | 1.71 ± 0.26 | 0.371 | 0.711 | |
| Body weight gain during pregnancy (kg) | 11.61 ± 2.82 | 11.73 ± 3.05 | 0.391 | 0.697 | |
| History of hypertension | Have | 32(10.85) | 16(12.69) | 0.299 | 0.584 |
| Without | 263(89.15) | 110(87.31) | |||
| History of diabetes | Have | 17(5.76) | 13(10.32) | 2.768 | 0.096 |
| Without | 278(94.24) | 113(89.68) | |||
| Family history of disease | Have | 40(13.56) | 26(20.64) | 3.344 | 0.068 |
| Without | 255(86.44) | 100(79.36) | |||
| PSV ratio | 1.15 ± 0.24 | 1.14 ± 0.25 | 0.387 | 0.699 | |
| PSV1 (cm/s) | 33.82 ± 4.96 | 32.93 ± 4.72 | 1.711 | 0.088 | |
| PSV2 (cm/s) | 29.54 ± 4.55 | 30.21 ± 5.01 | 1.342 | 0.181 | |
| PI1 | 1.82 ± 0.31 | 1.79 ± 0.30 | 0.918 | 0.359 | |
| RI1 | 0.71 ± 0.09 | 0.70 ± 0.08 | 1.078 | 0.282 | |
| PI2 | 1.72 ± 0.28 | 1.73 ± 0.35 | 0.311 | 0.756 | |
| RI2 | 0.72 ± 0.09 | 0.71 ± 0.08 | 1.078 | 0.282 | |
Comparison of general clinical features between training set and validation set.
3.2 Training set SGA single factor analysis of risk factors
In the training set, 75 cases (25.42%) of SGA31 were diagnosed. Univariate analysis showed that there were significant differences in Gestational weeks, PSV ratio, PSV1, PSV2, PI1 and PI2of ophthalmic artery between the SGA group and the non-SGA group (all p < 0.05) (Table 2).
Table 2
| Index | SGA group (n = 75) | Non-SGA group (n = 220) | Statistical values | P | |
|---|---|---|---|---|---|
| Age (years) | 29.21 ± 3.55 | 28.49 ± 3.15 | 1.654 | 0.099 | |
| Gestational weeks | 37.48 ± 1.62 | 38.11 ± 1.43 | 3.183 | 0.002 | |
| Pre-pregnancy BMI (kg/m2) | 23.52 ± 3.03 | 24.06 ± 2.71 | 1.445 | 0.149 | |
| Uterine artery PI | 1.79 ± 0.35 | 1.72 ± 0.28 | 1.749 | 0.081 | |
| Body weight gain during pregnancy (kg) | 11.21 ± 2.52 | 11.83 ± 3.15 | 1.544 | 0.124 | |
| History of hypertension | Have | 12(16.00) | 20(9.09) | 2.761 | 0.096 |
| Without | 63(84.00) | 200(90.91) | |||
| History of diabetes | Have | 7(9.33) | 10(4.54) | 1.562 | 0.211 |
| Without | 68(90.67) | 210(95.46) | |||
| Family history of disease | Have | 10(13.33) | 30(13.64) | 0.004 | 0.947 |
| Without | 65(86.67) | 190(86.36) | |||
| PSV ratio | 1.25 ± 0.24 | 1.04 ± 0.23 | 6.625 | 0.001 | |
| PSV1(cm/s) | 35.62 ± 5.26 | 31.93 ± 4.82 | 5.592 | 0.001 | |
| PSV2(cm/s) | 28.44 ± 4.15 | 30.51 ± 5.03 | 3.211 | 0.002 | |
| PI1 | 1.89 ± 0.32 | 1.76 ± 0.28 | 3.345 | 0.001 | |
| RI1 | 0.72 ± 0.10 | 0.69 ± 0.12 | 1.946 | 0.053 | |
| PI2 | 1.76 ± 0.29 | 1.61 ± 0.25 | 4.303 | 0.001 | |
| RI2 | 0.72 ± 0.11 | 0.69 ± 0.12 | 1.909 | 0.057 | |
Univariate analysis of risk factors for SGA in training set.
3.3 Multivariate logistic regression analysis
SGA was used as the dependent variable (1 = Yes, 0 = No), and the variable p < 0.05 in the single factor analysis was used as the independent variable for Multivariate Logistic regression analysis. The results showed that PSV ratio of ophthalmic artery, PSV1, PSV2, PI1, PI2 and gestational week were the independent risk factors for SGA (all p < 0.05) (Table 3).
Table 3
| Project | B | Standard error | Wald | P | OR | 95% confidence interval |
|---|---|---|---|---|---|---|
| PSV ratio | 3.430 | 0.747 | 21.080 | 0.001 | 30.867 | 7.139–133.460 |
| PSV1 | 0.138 | 0.034 | 16.368 | 0.001 | 1.148 | 1.074–1.227 |
| PSV2 | −0.072 | 0.035 | 4.236 | 0.040 | 0.931 | 0.869–0.997 |
| PI1 | 1.706 | 0.565 | 9.110 | 0.003 | 5.506 | 1.819–16.669 |
| PI2 | 2.019 | 0.616 | 10.739 | 0.001 | 7.533 | 2.251–25.204 |
| gestational week | −0.318 | 0.108 | 8.668 | 0.003 | 0.728 | 0.589–0.899 |
Results of multivariate logistic regression analysis.
3.4 Construction of nomogram prediction model
Based on the independent risk factors determined by multivariate Logistic regression analysis, a nomogram model for predicting SGA was constructed. Each risk factor was given corresponding score according to its regression coefficient, and the total score corresponding to the prediction probability (Figure 1).
Figure 1

Nomogram model for predicting SGA. x1: PSV ratio; x2: PSV1, x3: PSV2, x4: PI1, x5: PI2, x6: gestational week.
3.5 Evaluation and validation of nomogram model
In the training set, the C-index of the nomogram model was 0.858, the Hosmer-Lemeshow test p = 0.692, indicating that the model fitted well. The ROC curve showed an AUC of 0.858 (95% CI: 0.804–0.912), a sensitivity of 0.887, and a specificity of 0.747. In the validation set, C-index was 0.835, Hosmer-Lemeshow test p = 0.804, AUC was 0.835 (95% CI: 0.734–0.936), sensitivity was 0.636, and specificity was 0.833. The calibration curve and ROC curve are shown in Figures 2, 3, respectively.
Figure 2
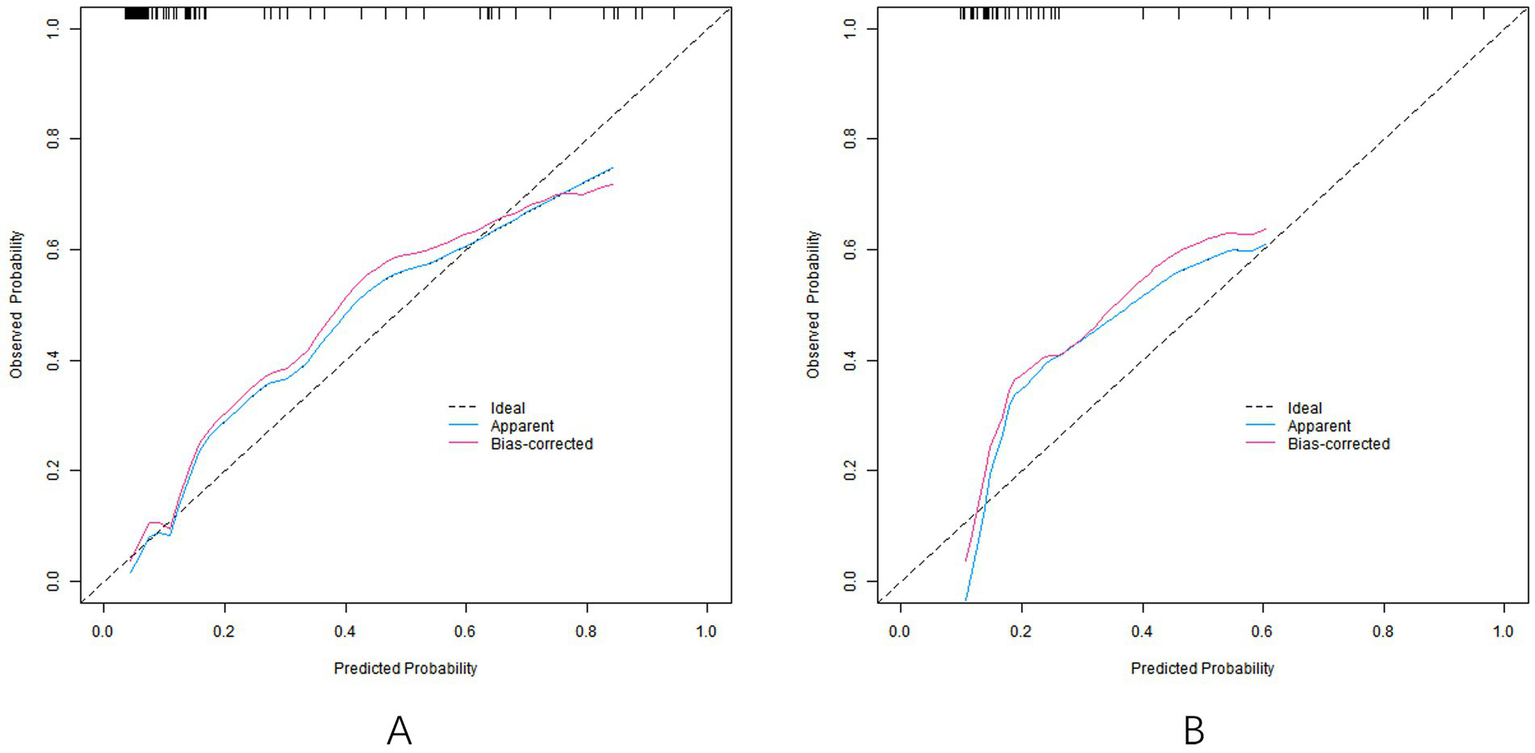
Calibration curve [calibration curves of models in training set (A) and validation set (B)].
Figure 3

ROC curve [the ROC curve of the model in the training set (A) and the ROC curve of the model in the verification set (B)].
3.6 Decision curve analysis
Decision curve analysis showed that when the threshold probability was within the range of 0.10–0.80, the nomogram model had high clinical application value for predicting SGA (Figure 4).
Figure 4
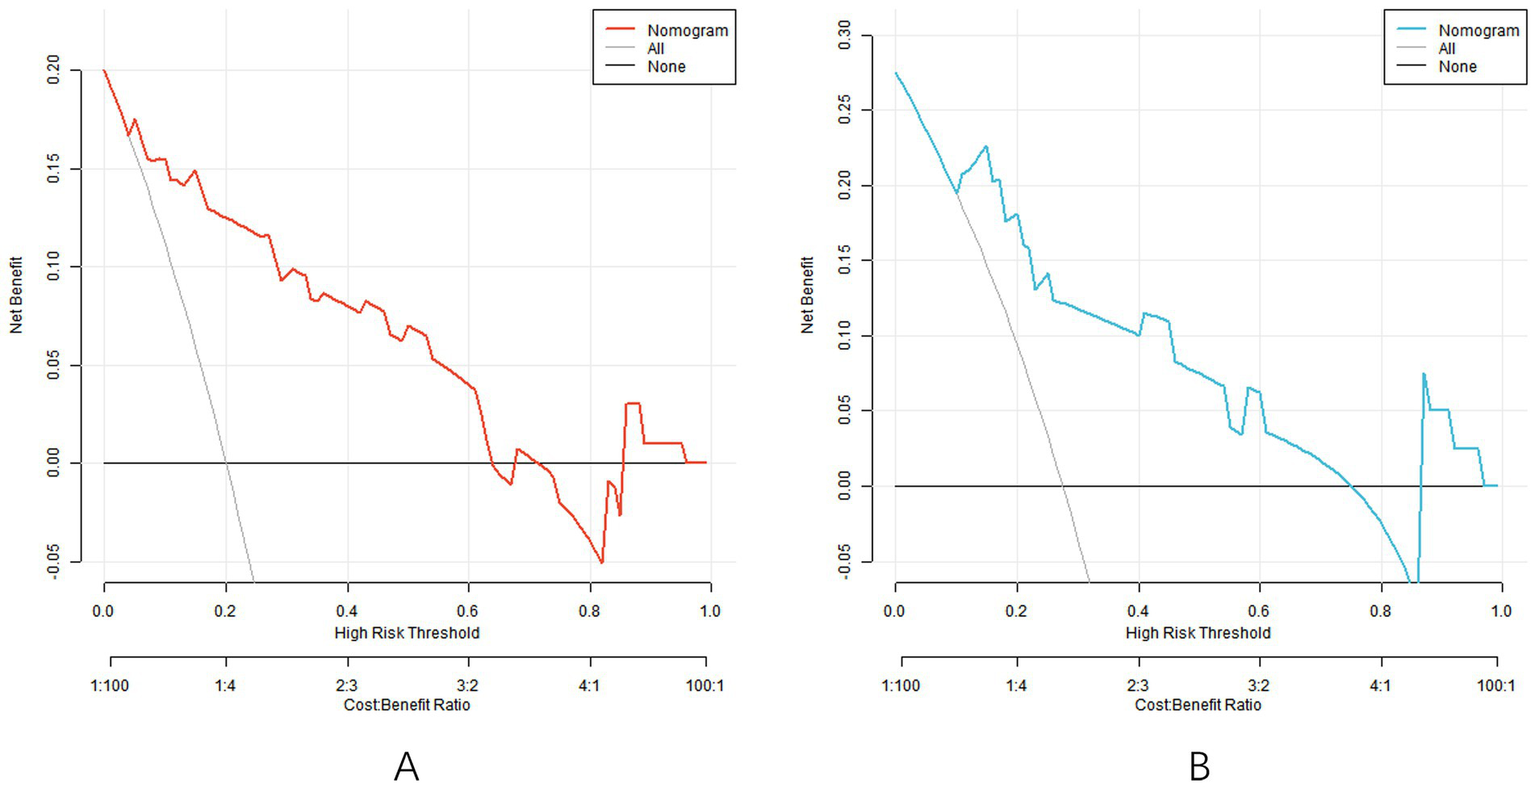
Decision curve [the decision curve of the model in the training set (A) and the decision curve of the model in the validation set (B)].
4 Discussion
The SGA is an important perinatal complication, and its incidence accounts for about 10% of the total number of neonates. It is not only associated with short-term risks such as fetal distress, hypothermia and hypoglycemia, but also may increase the risk of long-term health problems such as metabolic syndrome and cardiovascular disease in adulthood (7). Accurate prediction of SGA is of great significance for optimizing clinical intervention strategies and improving maternal and infant outcomes. At present, clinically commonly used prediction methods of SGA include fetal biometrics (such as biparietal diameter, abdominal circumference, and femoral length), maternal serological indicators (such as human chorionic gonadotropin and placental growth factor) and Doppler ultrasound to assess fetal hemodynamics (such as umbilical artery and uterine artery resistance index). However, the prediction efficiency of a single indicator is limited, and the joint application between different indicators has not yet formed a unified standard (8).
Ophthalmic artery is a branch of internal carotid artery, and its hemodynamic parameters can reflect fetal cerebrovascular resistance and blood flow redistribution (9). Previous studies have shown that in the case of fetal growth restriction (FGR), the flow resistance of the ophthalmic artery is decreased, manifested as decreased PI and RI, and increased PSV, which may be related to the “brain protection effect” initiated by the fetus to ensure blood supply to the brain (10). However, existing studies mostly focus on the association between single eye artery parameters and FGR, and there are few reports on the establishment of SGA prediction model using multiple eye artery parameters in combination. The purpose of this study was to explore the predictive value of PSV ratio, PSV1, PSV2, PI1, PI2 and gestational week in ophthalmic artery for SGA, and to construct a nomogram model, so as to provide a new tool for early clinical identification of high-risk pregnant women.
In this study, multivariate Logistic regression analysis showed that PSV ratio of ophthalmic artery (PSV1/PSV2) was the strongest independent risk factor for SGA (OR = 30.867), and its prediction efficiency was significantly higher than that of other parameters (11). This suggests that abnormal systolic flow dynamics in maternal ophthalmic artery may be linked to SGA.
From the perspective of mechanism, blood flow abnormalities in unilateral ophthalmic artery may reflect local vascular development or dysfunction, thus affecting the overall fetal blood flow distribution. Ophthalmic artery, a branch of the maternal internal carotid artery, primarily supplies the maternal eye and orbital structures. Its hemodynamic changes during pregnancy may reflect maternal cerebrovascular adaptation, which indirectly affects fetal growth by influencing uterine and placental perfusion. When the PSV of a unilateral ophthalmic artery increases, it may mean decreased vascular resistance or increased blood flow on that side, and this local abnormality may interfere with blood flow balance in the fetus, resulting in uneven delivery of nutrients and oxygen, thereby affecting fetal growth (12). Blood flow asymmetry may also indicate occult vasculopathy or placental insufficiency in the fetus (13). Placental insufficiency is one of the important causes of SGA and affects the material exchange between mother and fetus. The asymmetry of blood flow in the ophthalmic artery may be an early signal of placental insufficiency, indicating that the fetus redistributes blood flow to maintain blood supply to vital organs. The long-term existence of this compensatory mechanism may lead to fetal growth restriction (14). This study results are complementary to previous studies’ conclusion that unilateral ophthalmic artery parameters can predict FGR. Previous studies have mostly focused on single parameter of unilateral ophthalmic artery, such as PSV1 or PI1. However, in this study, the introduction of PSV ratio further revealed the importance of the difference in blood flow between the two ophthalmic arteries, thus providing a more comprehensive perspective for clinical evaluation. Univariate analysis showed that PSV1 in the SGA group was significantly higher than that in the non-SGA group (35.62 ± 5.26 vs. 31.93 ± 4.82 cm/s cm/s), while PSV2 was significantly reduced (28.44 ± 4.15 vs. 30.51 ± 5.03 cm/s cm/s). Multivariate regression further confirmed that both increased PSV1 (OR = 1.148) and decreased PSV2 (OR = 0.931) were independent risk factors. This paradox may be related to the compensatory mechanism of fetal hemodynamics. When placental function decreases, the fetus maintains blood supply to the brain by increasing cardiac output and reducing peripheral resistance (such as cerebrovascular dilatation), which leads to an increase in PSV1 in the ophthalmic artery. Because after cerebrovascular expansion, blood flow resistance is reduced, blood flow velocity is accelerated, so that the PSV1 increased. However, a decrease in PSV2 may reflect insufficient compensatory regulation of the contralateral ophthalmic artery, or suggest a broader vascular resistance abnormality. Specifically, when one ophthalmic artery increases blood flow by dilating blood vessels, the opposite ophthalmic artery may not compensate equally effectively, resulting in a relative decrease in blood flow velocity (15). In addition, this widespread vascular resistance abnormality may indicate that there is a problem with the circulatory system of the fetus as a whole that cannot efficiently distribute blood flow, thereby further affecting the growth and development of the fetus (16). PI is an important indicator reflecting vascular resistance. In this study, PI1 and PI2 of SGA group were significantly higher than those of non-SGA group, indicating that fetal ophthalmic artery resistance was increased. This result seems to contradict the theory of “brain protection effect.” According to the theory of “brain protection effect,” in the case of hypoxia or malnutrition of the fetus, the cerebral vessels will expand to increase cerebral blood flow and thus reduce the PI value. However, the increased PI value in this study may be due to the increased systemic vascular resistance of SGA fetus in the late stage of disease progression, which covered up the manifestations of local cerebrovascular dilatation. With the persistent existence of hypoxia and malnutrition in the fetus, the systemic blood vessels of the fetus will undergo adaptive changes, leading to a general increase in vascular resistance. This increase in systemic vascular resistance may outweigh the effects of local cerebrovascular dilatation, resulting in an increase in the PI value of the ophthalmic artery. In addition, the increased PI value may be related to vascular remodeling caused by chronic hypoxia in the fetus. The long-term hypoxia environment will promote changes in the structure of the vascular wall, increase vascular resistance, and further aggravate the fetal growth restriction (17). The study found a 30% reduction in SGA risk (OR = 0.728) for each additional week of gestation. This result is consistent with clinical common sense, as insufficient gestational weeks are one of the direct causes of SGA (18). The growth of the fetus in the uterus needs enough time, and as the gestational weeks increase, the fetus has more time to obtain nutrition and oxygen from the mother, thus promoting growth and development. Notably, pregnant women ≥28 weeks were included in this study, and gestational week still showed independent predictive value in the multivariate model, suggesting that accurate assessment of gestational week was important for risk stratification of SGA even in late pregnancy. In clinical practice, accurate assessment of gestational weeks can help doctors to detect abnormal fetal growth in time and take corresponding intervention measures (19). Accurate assessment of gestational weeks can also provide more personalized pregnancy management advice for pregnant women. For example, for pregnant women with small gestational weeks but normal fetal growth indicators, monitoring can be stepped up to ensure that the fetus grows normally in subsequent gestational weeks; For pregnant women with large gestational weeks but slow fetal growth, further investigation of the causes and targeted treatment are needed (20).
The C-index of the nomogram model constructed in this study in the training set and the verification set was 0.858 and 0.835, respectively, indicating that the model had good discrimination (the high discrimination was defined as C-index > 0.8). The ROC curve showed a training set AUC of 0.858 and a validation set of 0.835, both higher than the predictive power of a single parameter (e.g., an AUC of approximately 0.75–0.80 for the uterine artery PI). This performance is also superior to previous studies focusing on ophthalmic artery parameters alone. For example, Abdel Azim et al. (21) reported an AUC of 0.78 (95% CI: 0.71–0.85) using ophthalmic artery PSV at 35–37 weeks for SGA prediction, which is lower than our model’s AUC of 0.858. The calibration curve showed good agreement between the predicted and actual values, and the p values tested by Hosmer–Lemeshow were all >0.05, indicating that the fitting degree of the model was ideal. Analysis of the decision curve further confirmed that the model had a high net clinical benefit when the threshold probability was between 0.10 and 0.80.
The nomogram integrates multiple risk factors through a visual scoring system, and clinicians can quickly calculate the risk probability of SGA based on the PSV ratio of pregnant women, PSV1, PSV2, PI1, PI2 and gestational week. For example, a pregnant woman with 37 weeks of gestation, PSV ratio 1.25, PSV1 = 35 cm/s, PSV2 = 28 cm/s, PI1 = 1.9, and PI2 = 1.7, had a total score of approximately 150 points, and a corresponding risk probability of approximately 60% for SGA. This quantitative assessment allows for the personalization of monitoring protocols (e.g., increased frequency of ultrasound examinations, fetal biophysical scores) or interventions (e.g., nutritional support, timely termination of pregnancy). Compared with previous models based on uterine and umbilical artery parameters, the model in this study included ophthalmic artery blood flow indicators, which reflected the fetal cerebrovascular state more comprehensively (22). A previous study involving 1,500 pregnant women showed a model AUC of 0.82 combining uterine artery PI with maternal BMI, whereas the model AUC in this study was higher (0.858). Compared with Anjos et al. (23), who used ophthalmic artery PI alone (AUC = 0.76) for fetal growth assessment, our model’s inclusion of PSV1, PSV2, and their ratio provides a more comprehensive hemodynamic profile. Additionally, Mansukhani et al. (24) developed a preeclampsia prediction model with ophthalmic artery Doppler (AUC = 0.80), highlighting that our model’s higher AUC for SGA suggests specific utility in fetal growth restriction rather than general pregnancy complications. In addition, in this study, PSV ratio was used as the core variable for the first time, thus expanding the application range of ophthalmic artery parameters.
We recommend integrating the nomogram into routine ultrasound workflows from ≥28 weeks of gestation, when clinical intervention is most effective. Standardized training for sonographers should emphasize PSV ratio measurement (intra-observer variability <5%), incorporating video tutorials on ophthalmic artery identification, quarterly proficiency tests (≥90% accuracy), and quality control protocols (e.g., insonation angle <20°) to minimize inter-observer variability (<8%). In high-risk populations (e.g., maternal hypertension), combining uterine artery Doppler with serum PlGF levels may further improve detection rates. Our preliminary data demonstrate the nomogram’s superiority over fetal abdominal circumference (AUC = 0.78), reducing false positives by 22% in obese women and false negatives by 18% in late-term pregnancies (≥37 weeks), with an ongoing prospective trial (n = 500) aiming for ≥15% improvement in SGA detection. For women with pre-pregnancy BMI ≥ 24 kg/m2, adjusting the PSV1 cutoff to >37 cm/s (1.3-fold higher in SGA cases) is advised, while those ≥35 years may benefit from combined PlGF screening (<32 pg./mL) to reduce false negatives by 15%. Sensitivity analysis supports a two-step protocol: initial PSV ratio screening (cutoff >1.2; sensitivity = 82%, specificity = 76%) followed by confirmatory PSV1/PI2 assessment, reducing unnecessary examinations by 30–40% and increasing PPV from 32 to 48%. Future studies should validate these findings across diverse cohorts and compare the nomogram head-to-head with current standards to quantify its clinical impact.
This study has the following limitations: First, the single-center retrospective design resulted in a small sample size (n = 421), the data sources were limited to specific time periods and regions, which might cause selection bias due to differences in medical habits and ethnic characteristics, and the generalization ability of the model was limited, making it difficult to be extended to different populations. Second, no multi-center external verification was performed, which was mainly limited by the difficulty in resource and time coordination, difficulty in data standardization (such as incomparable parameters due to differences in ultrasonic equipment model and operating specifications), and insufficient sample size (only 421 cases were sampled in total, and no more data could be split for verification). In addition, potential confounders such as placental growth factor (PGF), fetal cardiac function, and maternal inflammation indicators were not included in the study, which may weaken the prediction efficiency of the model. Furthermore, the study only included Han Chinese pregnant women, and the impact of ethnic diversity on model applicability remains unclear. Future multi-center studies should include participants of different ethnicities to enhance the generalizability of the model. Finally, there is a lack of long-term follow-up data for SGA neonates to assess the predictive value of the model for long-term complications such as neurodevelopmental abnormalities and metabolic disorders.
Future improvements should be made in the following areas: First, a multi-center large sample prospective study (with a recommended sample size of ≥500 cases) was conducted to verify the external validity of the model through the standardized ultrasound operating procedures, so as to ensure its applicability in different ethnic groups, gestational weeks and medical conditions. Second, a multi-modal prediction system was constructed by integrating multi-dimensional predictive indicators such as maternal serology (PGF, sFlt-1), placental ultrasound parameters (villous space flow) and fetal heart function (Tei index) to improve the prediction accuracy of SGA associated with placental insufficiency. Third, we traced the neonates with SGA to school age, analyzed the correlation between ophthalmic artery parameters and neurodevelopmental outcomes (such as intelligence and motor ability), and revealed the potential mechanisms of hemodynamic abnormalities and brain injury. Fourthly, digital decision tools based on nomograms (such as mobile phone applications or built-in software for ultrasound equipment) are developed, which combine artificial intelligence technology to optimize the model and integrate dynamic blood flow parameters to improve the timeliness of prediction.
In summary, the nomogram model constructed based on ophthalmic artery Doppler parameters in this study has high prediction efficiency for SGA, and provides a new tool for early clinical recognition of high-risk pregnant women. Among them, the combination of PSV ratio, PSV1, PSV2, PI1, PI2 and gestational week can significantly improve the accuracy of the prediction. However, the clinical transformation of the model still needs to be further verified, and the prediction system needs to be optimized in the future based on multidisciplinary data to provide evidence-based support for the accurate prevention and control of SGA.
Statements
Data availability statement
The raw data supporting the conclusions of this article will be made available by the authors, without undue reservation.
Ethics statement
The studies involving humans were approved by Ethics Committee of The Sixth Affiliated Hospital of Jinan University. The studies were conducted in accordance with the local legislation and institutional requirements. The participants provided their written informed consent to participate in this study.
Author contributions
YY: Conceptualization, Writing – original draft, Methodology. HL: Data curation, Writing – original draft, Software, Methodology. SY: Data curation, Writing – original draft, Formal analysis. QH: Supervision, Writing – review & editing, Investigation. SC: Supervision, Writing – review & editing, Investigation, Conceptualization.
Funding
The author(s) declare that financial support was received for the research and/or publication of this article. This study received funding from the Dongguan Social Development Science and Technology Project (No. 20231800905112).
Conflict of interest
The authors declare that the research was conducted in the absence of any commercial or financial relationships that could be construed as a potential conflict of interest.
Generative AI statement
The authors declare that no Gen AI was used in the creation of this manuscript.
Any alternative text (alt text) provided alongside figures in this article has been generated by Frontiers with the support of artificial intelligence and reasonable efforts have been made to ensure accuracy, including review by the authors wherever possible. If you identify any issues, please contact us.
Publisher’s note
All claims expressed in this article are solely those of the authors and do not necessarily represent those of their affiliated organizations, or those of the publisher, the editors and the reviewers. Any product that may be evaluated in this article, or claim that may be made by its manufacturer, is not guaranteed or endorsed by the publisher.
References
1.
Abdel Azim S Sarno M Wright A Vieira N Charakida M Nicolaides KH . Ophthalmic artery Doppler at 35-37 weeks’ gestation in pregnancies with small or growth-restricted fetuses. Ultrasound Obstet Gynecol. (2022) 59:483–9. doi: 10.1002/uog.24854
2.
Ali S Mukasa DC Lukakamwa D Nakayenga A Namagero P Biira J et al . Relationship of maternal ophthalmic artery Doppler with uterine artery Doppler, hemodynamic indices and gestational age: prospective MATERA study. Ultrasound Obstet Gynecol. (2025) 65:163–72. doi: 10.1002/uog.29162
3.
Gy Lau K Bednorz M Parisi N Nicolaides KH Kametas NA . Ophthalmic artery Doppler in women with hypertensive disorders of pregnancy: relationship to blood pressure control and renal dysfunction at 6-9 weeks postnatally. Ultrasound Obstet Gynecol. (2024) 63:738–45. doi: 10.1002/uog.27563
4.
Anne RP Vardhelli V Oleti TP Murki S Reddy GMM Deshabhotla S et al . Propensity-matched comparison of very preterm small-and appropriate-for-gestational-age neonates. Indian J Pediatr. (2022) 89:59–66. doi: 10.1007/s12098-021-03878-3
5.
Gyokova E Hristova-Atanasova E Iskrov G . Preeclampsia management and maternal ophthalmic artery Doppler measurements between 19 and 23 weeks of gestation. J Clin Med. (2024) 13:10.3390/jcm13040950. doi: 10.3390/jcm13040950
6.
Sapantzoglou I Wright A Arozena MG Campos RV Charakida M Nicolaides KH . Ophthalmic artery Doppler in combination with other biomarkers in prediction of pre-eclampsia at 19-23 weeks’ gestation. Ultrasound Obstet Gynecol. (2021) 57:75–83. doi: 10.1002/uog.23528
7.
Monteiro VNP de Oliveira CA Gomes Junior SC do Cima LC Naves WU Diniz ALD et al . Ophthalmic artery doppler as a predictor of adverse neonatal outcomes in women with preeclampsia. J Clin Ultrasound. (2024) 53:504–9. doi: 10.1002/jcu.23899
8.
Bardin R Aviram A Hiersch L Hadar E Gabbay-Benziv R . False diagnosis of small for gestational age and macrosomia – clinical and sonographic predictors. J Matern Fetal Neonatal Med. (2022) 35:1539–45. doi: 10.1080/14767058.2020.1762559
9.
de Melo P Roever L Mendonça TMS de Melo PFMV da Silva Costa F Rolnik DL et al . Ophthalmic artery Doppler in the complementary diagnosis of preeclampsia: a systematic review and meta-analysis. BMC Pregnancy Childbirth. (2023) 23:343. doi: 10.1186/s12884-023-05656-9
10.
Diniz ALD Menêses V Freitas MAR Menêses VFSC Paes MMBM Naves WU et al . Performance of ophthalmic artery Doppler velocimetry in the complementary diagnosis of preeclampsia. J Matern Fetal Neonatal Med. (2022) 35:9078–85. doi: 10.1080/14767058.2021.2014452
11.
Gonser M Vonzun L Ochsenbein-Kölble N . Ophthalmic artery Doppler in prediction of pre-eclampsia: insights from hemodynamic considerations. Ultrasound Obstet Gynecol. (2021) 58:145–7. doi: 10.1002/uog.23665
12.
Gonser M Vonzun L Ochsenbein-Kölble N . Ophthalmic artery Doppler in hypertensive pregnancies. BJOG. (2022) 129:1394–5. doi: 10.1111/1471-0528.17062
13.
Gonser M Vonzun L Ochsenbein-Kölble N . Ophthalmic artery Doppler as a marker of pre-eclampsia: why does it work?BJOG. (2023) 130:120–1. doi: 10.1111/1471-0528.17317
14.
Kusuma RA Nurdiati DS Al Fattah AN Danukusumo D Abdullah S Sini I . Ophthalmic artery Doppler for pre-eclampsia prediction at the first trimester: a Bayesian survival-time model. J Ultrasound. (2023) 26:155–62. doi: 10.1007/s40477-022-00697-w
15.
Saleh M Naemi M Aghajanian S Saleh M Hessami K Bakhtiyari M . Diagnostic value of ophthalmic artery Doppler indices for prediction of preeclampsia at 28-32 weeks of gestation. Int J Gynaecol Obstet. (2023) 160:120–30. doi: 10.1002/ijgo.14305
16.
Barzilai R Bronshtein M Steinberg M Weiner Z Gover A . Small for gestational age: the familial perspective. J Matern Fetal Neonatal Med. (2022) 35:3840–4. doi: 10.1080/14767058.2020.1841160
17.
Higuchi R Koga H Sugino N Bonno M National Hospital Organization Network Pediatric and Perinatal Group . Mild small-for-gestational-age as a non-negligible risk factor for short stature. Early Hum Dev. (2023) 176:105704. doi: 10.1016/j.earlhumdev.2022.105704
18.
Hokken-Koelega ACS van der Steen M Boguszewski MCS Cianfarani S Dahlgren J Horikawa R et al . International consensus guideline on small for gestational age: etiology and management from infancy to early adulthood. Endocr Rev. (2023) 44:539–65. doi: 10.1210/endrev/bnad002
19.
Zhang S Zhou L Zhang L Wang Y Wang H . Molecular genetic screening of full-term small for gestational age. BMC Pediatr. (2023) 23:217. doi: 10.1186/s12887-023-04030-0
20.
Juul A Backeljauw P Højby M Kawai M Kildemoes RJ Linglart A et al . Somapacitan in children born small for gestational age: a multi-Centre, open-label, controlled phase 2 study. Eur J Endocrinol. (2023) 188:19–30. doi: 10.1093/ejendo/lvac008
21.
Abdel Azim S Wright A Sapantzoglou I Nicolaides KH Charakida M . Ophthalmic artery Doppler at 19-23 weeks’ gestation in pregnancies that deliver small-for-gestational-age neonates. Ultrasound Obstet Gynecol. (2022) 60:52–8. doi: 10.1002/uog.24913
22.
Naz S Hoodbhoy Z Jaffar A Kaleem S Hasan BS Chowdhury D et al . Neurodevelopment assessment of small for gestational age children in a community-based cohort from Pakistan. Arch Dis Child. (2023) 108:258–63. doi: 10.1136/archdischild-2022-324630
23.
Anjos DFRD de Freitas MAR Dos Santos MCA Diniz ALD . Doppler indices of the ophthalmic artery in pregnant women with Pregestational diabetes mellitus with and without retinopathy. J Ultrasound Med. (2021) 40:251–7. doi: 10.1002/jum.15393
24.
Mansukhani T Wright A Arechvo A Laich A Iglesias M Charakida M et al . Ophthalmic artery Doppler at 36 weeks’ gestation in prediction of pre-eclampsia: validation and update of previous model. Ultrasound Obstet Gynecol. (2024) 63:230–6. doi: 10.1002/uog.27464
Summary
Keywords
ophthalmic artery Doppler, PSV ratio, PSV1, PSV2, small for gestational age infants, prediction models
Citation
Yang Y, Liu H, Yang S, Huang Q and Chen S (2025) Preliminary exploration of prediction model and nomograph drawing of Doppler peak systolic velocity ratio, peak systolic velocity 1 and peak systolic velocity 2 of ophthalmic artery in pregnant women for small for gestational age infants. Front. Med. 12:1598587. doi: 10.3389/fmed.2025.1598587
Received
23 March 2025
Accepted
07 August 2025
Published
20 August 2025
Volume
12 - 2025
Edited by
A. Seval Ozgu-Erdinc, Ankara Bilkent City Hospital University, Türkiye
Reviewed by
Abubakar Nazir, King Edward Medical University, Pakistan
Elitsa Gyokova, Medical University Pleven, Bulgaria
Bedour Abdelghany, Port Said University, Egypt
Updates
Copyright
© 2025 Yang, Liu, Yang, Huang and Chen.
This is an open-access article distributed under the terms of the Creative Commons Attribution License (CC BY). The use, distribution or reproduction in other forums is permitted, provided the original author(s) and the copyright owner(s) are credited and that the original publication in this journal is cited, in accordance with accepted academic practice. No use, distribution or reproduction is permitted which does not comply with these terms.
*Correspondence: Shaohui Chen, little821225@163.com
†These authors have contributed equally to this work
Disclaimer
All claims expressed in this article are solely those of the authors and do not necessarily represent those of their affiliated organizations, or those of the publisher, the editors and the reviewers. Any product that may be evaluated in this article or claim that may be made by its manufacturer is not guaranteed or endorsed by the publisher.