Abstract
Background:
In the emergency department (ED), rapid risk stratification of critically ill patients is essential for timely intervention. The triglyceride-glucose (TyG) index, a simple marker of insulin resistance, may aid in early mortality prediction, but its utility in ED-to-ICU patients remains unexplored.
Methods:
Using data from the eICU Collaborative Research Database, we conducted a retrospective multicenter cohort study of 11,593 ED-to-ICU critically ill patients. The TyG index was calculated at ED presentation. The primary outcome was 28-day all-cause mortality. Multivariable Cox regression, restricted cubic splines, and sensitivity analyses were performed to assess associations.
Results:
Among patients (mean age 63.6 ± 15.7 years, 57.3% male), 28-day mortality was 6.96%. The relationship between the TyG index and mortality was nonlinear, featuring a critical threshold at a TyG index value of 9.84. Below this cutoff, each unit increase in TyG index significantly elevated mortality risk (HR 1.47, 95% CI 1.20–1.69, p < 0.0001), while above it, the risk plateaued (HR 1.04, 95% CI 1.03–1.05, p = 0.097). The association remained robust after adjustment for confounders (adjusted HR 1.19, 95% CI 1.04–1.35, p = 0.0089) and across sensitivity analyses.
Conclusion:
The TyG index, readily obtainable at ED presentation, provides emergency clinicians with a practical tool for early mortality risk stratification in critically ill patients. Its nonlinear association with 28-day mortality suggests a saturation effect, enabling rapid identification of high-risk patients who may benefit from intensified monitoring and intervention.
Introduction
The majority of critically ill patients admitted to the intensive care unit (ICU) are transferred from the emergency department (ED) (1). Recent statistics indicate that the proportion of patients transferred from the ED to the ICU has increased from 0.9 to 1.6% of all ED visits, a trend further exacerbated by the growing aging population (2). Some cohorts indicate that critically ill ED patients (e.g., sepsis, polytrauma, acute respiratory failure) face high mortality risks, with pre-ICU mortality reaching 34% (3). Another dataset shows that from 2014 to 2015, a total of 200,859 admissions of critically ill patients were recorded in 208 hospitals in the United States. Of these, 41.24% were from the emergency department, with an in-hospital mortality rate of 8.96% (4). This data highlights that in the emergency department, early identification and timely intervention in the first hour are essential for a better outcome.
Traditional ICU scoring systems (APACHE II, SOFA) lack practicality in the ED setting. These tools require complex parameters often unavailable during initial ED evaluation, delaying risk assessments (5). For example, delays in ICU transfer increase mortality by 27% in septic shock patients (6). Additionally, these scores fail to account for metabolic dysregulation—a key driver of critical illness progression (7). The ED demands simple, rapid biomarkers that integrate pathophysiological insights to enable real-time decisions.
Insulin resistance (IR), a hallmark of metabolic crisis, is prevalent in critically ill ED patients and correlates with multiorgan failure (8–12). The triglyceride-glucose (TyG) index—calculated using readily available ED labs (fasting triglycerides and glucose)—provides a pragmatic IR measure (13–15). Emerging evidence links elevated TyG index to adverse outcomes in acute myocardial infarction, cardiometabolic medicine, major adverse cardiovascular events, stroke and sepsis (16–20), suggesting its utility for ED risk stratification. Notably, a TyG index >11.18 predicts 48% higher mortality in acute kidney injury patients (21), aligning with the ED’s need for actionable thresholds.
However, existing studies are limited by small ED-specific cohorts and insufficient adjustment for resuscitation confounders (21–24). To address this gap, we analyzed 11,593 ED-to-ICU patients from the multicenter eICU-CRD. We aimed to: (1) Validate the TyG index’s prognostic value for 28-day mortality in ED- to-ICU patients; (2) Identify ED-actionable risk thresholds to optimize early interventions.
Methods
Study design
This retrospective multicenter cohort study analyzed ED-to-ICU patients using the eICU-CRD (2014–2015), comprising 208 U.S. hospitals (4, 25). The database’s automated data capture from ED admission through ICU care ensured fidelity to real-world emergency workflows. In terms of data storage and privacy, all data were automatically stored through Philips Healthcare’s eICU program, with anonymization processes in place to ensure compliance with the Health Insurance Portability and Accountability Act (HIPAA). Data access was granted after completing the Collaborative Institutional Training Initiative (CITI) program’s “Research with Data or Samples Only” course, thus exempting the study from review by the Massachusetts Institute of Technology Institutional Review Board (Record ID: 49995491), and waiving the requirement for informed consent. This study strictly adhered to the ethical principles outlined in the Declaration of Helsinki.
Participants
Patients were included in the study if they met the following criteria: (1) adults aged 18 years and older; (2) individuals who were critically ill and transferred from the ED to the ICU. The exclusion criteria were as follows: (1) patients lacking triglyceride (TG) data on the day of admission; (2) patients lacking fasting plasma glucose (FPG) data on the day of admission; (3) patients with extreme TyG index values (defined as values beyond three standard deviations from the mean) (26, 27). In this study, the term “Caucasian” refers to individuals of European descent who are non-Hispanic white. A total of 11,593 patients were included in the study, and they were categorized into three groups based on the tertiles of the TyG index measured on the day of admission. The detailed patient selection process is illustrated in Figure 1.
Figure 1

Flow chart of study population. ICU, intensive care unit.
Variables and outcomes
ED admission variables (first 24 h): Demographics, vital signs, lab values (total cholesterol [TC], TG, high-density lipoprotein cholesterol [HDL], low-density lipoprotein cholesterol [LDL], etc.), and comorbidities (ICD-9 codes: diabetes mellitus [DM], chronic obstructive pulmonary disease [COPD], chronic heart failure [CHF] and acute myocardial infarction [AMI]). ED-relevant severity scores (SOFA, GCS, APACHE IV) were extracted to benchmark against TyG performance. The TyG index was calculated based on initial FPG and TG levels, using the formula: ln [TG (mg/dL) × FPG (mg/dL)/2] (28–30). The TyG index was computed using initial ED labs to simulate real-time risk assessment. Primary outcome: 28-day all-cause mortality post-ED admission—a critical endpoint for evaluating ED risk stratification accuracy.
Statistical analysis
Continuous variables that followed a normal distribution were expressed as mean ± standard deviation (SD), while non-normally distributed continuous variables were described using median and interquartile range (IQR). Categorical data were presented as counts and percentages. Continuous variables were compared using the student’s t-test based on the tertiles of the TyG index, while categorical variables were analyzed using Pearson’s chi-square test or Fisher’s exact test.
We employed Cox proportional hazards models to estimate the association between the TyG index and 28-day mortality, presenting results as hazard ratios (HR) with 95% confidence intervals (CI) to illustrate regression estimates and adjusted results. Confounding factors were selected based on their association with the outcome of interest or if their effect estimates changed by more than 10%, in addition to being chosen based on clinical judgment. Consequently, we adjusted for the following covariates: gender, age, ethnicity, BMI, SOFA score, GCS score, APACH IV, BUN, Scr, TC, HDL, COPD, CHF, AMI, and DM.
Additionally, Cox regression models with cubic splines were utilized to delve into the nonlinear relationships between the TyG index and all-cause mortality. We subsequently employed a piecewise linear regression model to examine the threshold effect of the TyG index on mortality, and we conducted likelihood ratio tests to compare the single-segment linear regression model with the piecewise linear model.
To assess the robustness of our results, we performed sensitivity analyses, subgroup analyses, and interaction analyses. We calculated E-values to explore the potential impact of unmeasured confounding factors on the association between the TyG index and 28-day all-cause mortality. The E-value quantifies the magnitude of an unmeasured confounder needed to fully account for the observed association between the TyG index and 28-day all-cause mortality (31). A two-tailed alpha level was set at 0.05. All statistical analyses were conducted using EmpowerStats (X&Y Solutions, Inc., Boston, MA, USA)1 and R software version 3.6.1.2
Results
Baseline characteristics of the included participants
A total of 11,593 patients met the inclusion criteria in the eICU database (see Figure 1). The average age of the patients was 63.61 ± 15.65 years, with 6,646 males, accounting for approximately 57.33% of the cohort. The baseline TyG index values ranged from 6.54 to 11.39, with a mean of 8.96 (see Figure 2).
Figure 2
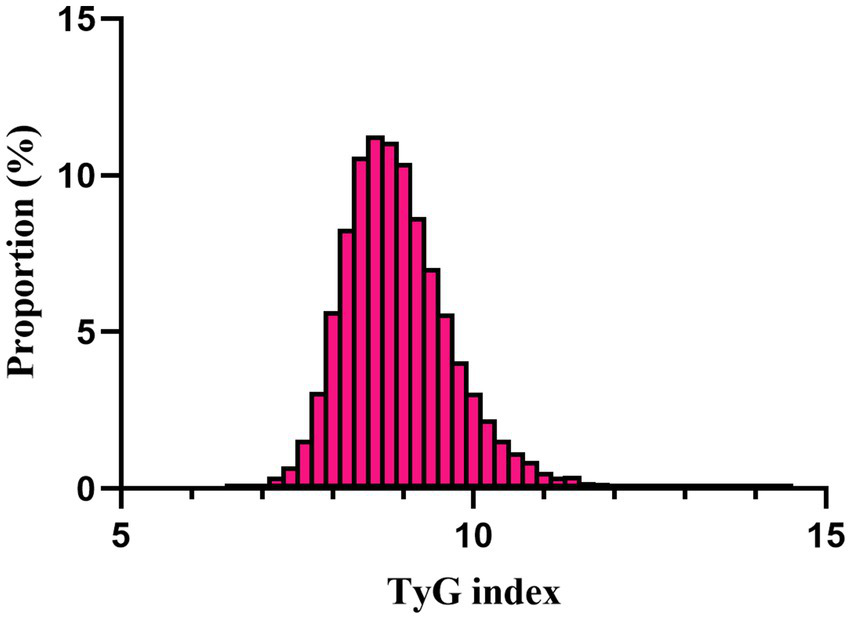
Distribution of TyG index. It presented a normal distribution, ranging from 6.54 to 11.39, with a mean of 8.96.
Table 1 presents the baseline characteristics of the patients grouped by the tertiles of the TyG index. As indicated in Table 1, there is a discernible trend in baseline characteristics and clinical outcomes with increasing tertiles of the TyG index. Higher levels of the TyG index were associated with younger age, increased BMI, a higher proportion of males, and an increased percentage of Caucasians. In terms of biochemical parameters, levels of FPG, BNU, and Scr showed an upward trend with an increasing TyG index, while HDL levels decreased. The TG and TC levels were significantly elevated in the third tertile. Clinically concerning trends were observed, as the incidence of complications such as DM, COPD, CHF, AMI, and mortality rates increased with higher TyG index tertiles. Additionally, the hospital lengths of stay tended to be longer. The 28-day all-cause mortality rate also increased with rising TyG index tertiles. Figure 3 displays the Kaplan–Meier curves for 28-day all-cause mortality. The probability of mortality progressively increased with a rising TyG index.
Table 1
| Characteristics | T1 (6.54–8.57) | T2 (8.57–9.16) | T3 (9.16–11.39) | p-value |
|---|---|---|---|---|
| Age (year) | 66.52 ± 16.60 | 64.86 ± 14.85 | 59.46 ± 14.55 | <0.001 |
| BMI (kg/m2) | 27.60 ± 7.51 | 29.39 ± 7.85 | 31.38 ± 8.22 | <0.001 |
| Gender | 0.207 | |||
| Female, n (%) | 1,693 (43.81%) | 1,625 (42.08%) | 1,627 (42.10%) | |
| Male, n (%) | 2,171 (56.19%) | 2,237 (57.92%) | 2,238 (57.90%) | |
| Ethnicity | <0.001 | |||
| Caucasian, n (%) | 2,714 (70.88%) | 2,821 (73.75%) | 2,752 (72.17%) | |
| African-American, n (%) | 633 (16.53%) | 508 (13.28%) | 476 (12.48%) | |
| Hispanic, n (%) | 226 (5.90%) | 243 (6.35%) | 304 (7.97%) | |
| Asian, n (%) | 166 (4.34%) | 166 (4.34%) | 182 (4.77%) | |
| Native American, n (%) | 21 (0.55%) | 17 (0.44%) | 29 (0.76%) | |
| Unknown, n (%) | 69 (1.80%) | 70 (1.83%) | 70 (1.84%) | |
| SOFA score, median (IQR) | 2.0 (1.00–3.0) | 1.0 (0.0–3.0) | 1.00 (0.0–4.0) | <0.001 |
| GCS score, median (IQR) | 15.0 (13.0–15.0) | 15.0 (13.0–15.0) | 15.0 (12.0–15.0) | <0.001 |
| APACHE IV score, median (IQR) | 47.0 (35.0–62.0) | 46.0 (34.0–62.0) | 48.0 (34.0–66.0) | <0.001 |
| BUN, median (IQR), (mmol/L) | 16.0 (12.0–24.0) | 17.0 (12.0–24.0) | 18.0 (13.0–29.0) | <0.001 |
| Scr, median (IQR), (mg/dL) | 0.90 (0.71–1.23) | 0.95 (0.76–1.27) | 1.00 (0.79–1.47) | <0.001 |
| FPG, median (IQR), (mg/dL) | 104.0 (92.0–123.0) | 121.0 (104.0–148.0) | 173.0 (127.0–247.0) | <0.001 |
| TC, (mg/dL) | 140.65 ± 41.14 | 155.15 ± 44.42 | 176.00 ± 64.00 | <0.001 |
| TG, median (IQR), (mg/dL) | 67.0 (54.0–83.0) | 112.0 (92.0–136.0) | 194.0 (144.0–268.0) | <0.001 |
| HDL, (mg/dL) | 47.99 ± 17.65 | 41.14 ± 14.83 | 35.99 ± 13.26 | <0.001 |
| Medical history | ||||
| DM, n (%) | 270 (6.99%) | 339 (8.78%) | 682 (17.64%) | <0.001 |
| COPD, n (%) | 217 (5.62%) | 210 (5.44%) | 172 (4.45%) | 0.044 |
| CHF, n (%) | 373 (9.65%) | 336 (8.70%) | 292 (7.55%) | 0.004 |
| AMI, n (%) | 646 (16.72%) | 883 (22.86%) | 885 (22.89%) | <0.001 |
| 28-day hospital mortality | <0.001 | |||
| No, n (%) | 3,654 (94.57%) | 3,603 (93.27%) | 3,529 (91.28%) | |
| Yes, n (%) | 210 (5.43%) | 260 (6.73%) | 337 (8.72%) | |
| Hospital LOS, median (IQR), d | 4.00 (2.40–7.09) | 3.87 (2.20–7.27) | 3.83 (2.14–7.34) | 0.016 |
The baseline characteristics of participants according to tertiles of TyG index.
Continuous variables are summarized as mean (SD) or median (trisection interval); categorical variables are presented as percentages (%). BMI, body mass index; COPD, chronic obstructive pulmonary disease; AMI, acute myocardial infarction; ICU, intensive care unit; LOS, length of stay; APACHE IV, acute physiology and chronic health evaluation IV; BUN, blood urea nitrogen; Scr, serum creatinine; SOFA, sequential organ failure assessment; GCS, Glasgow coma scale; FPG, fasting plasma glucose; TC, total cholesterol; TG, triglycerides; HDL, high-density lipoprotein; CHF, chronic heart failure; DM, diabetes mellitus.
Figure 3

Kaplan–Meier curves for all-cause mortality. The probability of all-cause mortality increased progressively with a rising TyG index.
Unadjusted association between baseline variables and 28-day all-cause mortality
The univariate analysis indicated positive associations between the TyG index and 28-day all-cause mortality. In addition, we also indicated positive associations between age, SOFA score, APACHE IV, BUN, Scr, FPG, TG and 28-day all-cause mortality, all significant at p < 0.05. Conversely, a negative association was observed with HDL-C and GCS score (all p < 0.05; detailed in Table 2).
Table 2
| Variable | Statistics | HR (95% CI) | p-value |
|---|---|---|---|
| Age (year) | 63.61 ± 15.65 | 1.02 (1.01, 1.02) | <0.0001 |
| BMI (kg/m2) | 29.46 ± 8.01 | 1.00 (0.99, 1.00) | 0.3541 |
| Gender | |||
| Male, n (%) | 4,945 (42.66%) | 1.0 | |
| Female, n (%) | 6,646 (57.34%) | 0.94 | 0.3771 |
| Ethnicity | |||
| Caucasian, n (%) | 8,287 (72.27%) | 1.0 | |
| African-American, n (%) | 1,617 (14.10%) | 0.70 (0.57, 0.86) | 0.0009 |
| Hispanic, n (%) | 773 (6.74%) | 0.74 (0.54, 1.02) | 0.0641 |
| Asian, n (%) | 514 (4.48%) | 0.80 (0.57, 1.11) | 0.1771 |
| Native American, n (%) | 67 (0.58%) | 0.63 (0.20, 1.97) | 0.4278 |
| Unknown, n (%) | 209 (1.82%) | 0.80 (0.46, 1.39) | 0.4353 |
| SOFA score, median (IQR) | 1.00 (1.00–4.00) | 1.32 (1.29, 1.35) | <0.0001 |
| GCS score, median (IQR) | 15.00 (130–15.0) | 0.82 (0.81, 0.84) | <0.0001 |
| APACH IV, median (IQR) | 47.0 (35.0–63.0) | 1.03 (1.03, 1.04) | <0.0001 |
| BUN, median (IQR), (mmol/L) | 17.0 (12.0–26.0) | 1.01 (1.01, 1.01) | <0.0001 |
| Scr, mg/dL | 1.37 ± 1.53 | 1.07 (1.04, 1.10) | <0.0001 |
| FPG, median (IQR), (mg/dL) | 123.0 (102.0–165.0) | 1.00 (1.00, 1.00) | <0.0001 |
| TC, (mg/dL) | 157.06 ± 52.72 | 0.99 (0.99, 1.00) | <0.0001 |
| TG, median (IQR), (mg/dL) | 108.0 (75.0–163.0) | 1.00 (1.00, 1.00) | 0.0291 |
| HDL, (mg/dL) | 42.52 ± 16.27 | 0.99 (0.99, 1.00) | 0.0026 |
| TyG index | 8.96 ± 0.83 | 1.13 (1.04, 1.21) | 0.0022 |
| Medical history | |||
| DM, n (%) | 1,291 (11.14%) | 0.96 (0.78, 1.19) | 0.7391 |
| COPD, n (%) | 599 (5.17%) | 0.90 (0.67, 1.20) | 0.4673 |
| CHF, n (%) | 1,001 (8.63%) | 1.18 (0.95, 1.45) | 0.1344 |
| AMI, n (%) | 2,414 (20.82%) | 0.84 (0.68, 1.02) | 0.0826 |
Factors influencing risk of ICU and hospital mortality analyzed by univariate Cox proportional hazards regression analysis.
CI, confidence interval; HR, hazard ratios.
Association between TyG index and 28-day all-cause mortality
We utilized three Cox proportional hazards regression models to assess the impact of the TyG index on 28-day all-cause mortality in ED critically ill patients. In the initial unadjusted model (Model I), a 1-unit increase in the TyG index was associated with a 13% increase in the likelihood of all-cause mortality, with a HR of 1.13 (95% CI: 1.04–1.21, p = 0.0022). In the partially adjusted model (Model II), which only considered gender, age, race, and BMI, each 1-unit increase in the TyG index was linked to a 25% higher mortality risk, yielding an HR of 1.25 (95% CI: 1.15–1.35, p < 0.0001). The fully adjusted model (Model III) demonstrated that for each 1-unit increase in the TyG index, the risk of patient mortality increased by 19%, resulting in an HR of 1.19 (95% CI: 1.04–1.35, p = 0.0089). Consistent confidence intervals further support the strong relationship between the TyG index and 28-day mortality in emergency critically ill patients, as illustrated in Table 3.
Table 3
| Exposure | Model I (HR, 95%CI) p | Model II (HR, 95%CI) p | Model III (HR, 95%CI) p |
|---|---|---|---|
| TyG index | 1.13 (1.04, 1.21) 0.0022 | 1.25 (1.15, 1.35) < 0.0001 | 1.19 (1.04, 1.35) 0.0089 |
| (TyG index Tertile) | |||
| T1 | Ref | Ref | Ref |
| T2 | 1.22 (1.02, 1.47) 0.0305 | 1.24 (1.03, 1.50) 0.0227 | 1.32 (1.04, 1.67) 0.0219 |
| T3 | 1.56 (1.31, 1.86) < 0.0001 | 1.85 (1.54, 2.22) < 0.0001 | 1.56 (1.21, 2.02) 0.0007 |
| p for trend | <0.0001 | <0.0001 | 0.0007 |
Association between TyG index and all-cause mortality in different models.
Model I: we did not account for additional variables.
Model II: we adjusted gender, age, ethnicity and BMI.
Model III: we adjusted gender, age, ethnicity, BMI, SOFA score, GCS score, APACHE IV, BUN, Scr, TC, HDL, COPD, CHF, AMI, and DM. HR, Hazard Ratios; CI, confidence; Ref, reference.
Additionally, we transformed the TyG index into a categorical variable and reintroduced it into our model. The multivariate-adjusted model revealed that compared to participants in the first tertile (T1), the HR for those in the second and third tertiles (T2–T3) were 1.32 (1.04–1.67) and 1.56 (1.21–2.02), respectively. This indicates that participants in T2 and T3 had a 32 and 56% increased likelihood of all-cause mortality, respectively (see Table 3, Model III).
Sensitivity analyses
Table 4 presents a sensitivity analysis of the association between the TyG index and all-cause mortality. In Model I, the sensitivity analysis focused on Caucasian patients (N = 8,287). After adjusting for confounding variables, the TyG index was associated with an increased risk of all-cause mortality, yielding a HR of 1.21 (95% CI: 1.04–1.40, p = 0.0109). Model II focused on patients aged 45 years and older (N = 10,322). In this model, the TyG index was significantly associated with an increased risk of all-cause mortality, with an HR of 1.25 (95% CI: 1.09–1.43, p = 0.0012). Model III excluded patients with a BMI greater than 25 kg/m2 (N = 7,855). In this model, the TyG index was associated with an HR of 1.20 (95% CI: 1.03–1.41) for all-cause mortality (p = 0.0225). These extensive sensitivity analyses emphasize the reliability of our findings (see Table 4). Additionally, we generated an E-value to assess sensitivity to unmeasured confounding. An E-value of 1.68 is required to explain away the observed HR of 1.19.
Table 4
| Exposure | Model I (HR, 95%CI) p | Model II (HR, 95%CI) p | Model III (HR, 95%CI) p |
|---|---|---|---|
| TyG index | 1.21 (1.04, 1.40) 0.0109 | 1.25 (1.09, 1.43) 0.0012 | 1.20 (1.03, 1.41) 0.0225 |
| (TyG index Tertile) | |||
| T1 | Ref | Ref | Ref |
| T2 | 1.37 (1.05, 1.79) 0.0223 | 1.40 (1.10, 1.79) 0.0065 | 1.15 (0.85, 1.55) 0.3763 |
| T3 | 1.52 (1.13, 2.04) 0.0057 | 1.69 (1.29, 2.20) 0.0001 | 1.56 (1.13, 2.14) 0.0062 |
| p for trend | 0.0062 | 0.0001 | 0.0047 |
Association between TyG index and all-cause mortality in different sensitivity analyses.
Model I was a sensitivity analysis performed with Caucasian patients (N = 8,287). We adjusted gender, age, BMI, SOFA score, GCS score, APACHE IV, BUN, Scr, TC, HDL, COPD, CHF, AMI, and DM.
Model II was a sensitivity analysis performed patients’ age ≥ 45 years (N = 10,322). We adjusted gender, age, ethnicity, BMI, SOFA score, GCS score, APACHE IV, BUN, Scr, TC, HDL, COPD, CHF, AMI, and DM. Model III was a sensitivity analysis performed patients’ BMI ≥ 25 kg/m2 (N = 7,855). We adjusted gender, age, ethnicity, BMI, SOFA score, GCS score, APACHE IV, BUN, Scr, TC, HDL, COPD, CHF, AMI, and DM.
Identification of nonlinear association
We utilized a generalized additive model and found a nonlinear saturation effect relationship between the TyG index and all-cause mortality (see Figure 4). We compared the linear regression model with a two-piecewise linear regression model, and the log-likelihood ratio test yielded a p-value of 0.001. This result indicates that the two-piecewise linear regression model should be used for model fitting (see Table 5). In other words, when the TyG index is less than 9.84, each 1-unit increase in the TyG index is associated with a 42% increase in all-cause mortality (adjusted HR 1.42, 95% CI 1.20–1.69, p < 0.0001). When the TyG index is ≥9.84, the mortality rate in critically ill patients no longer increases with increasing TyG index (adjusted HR 1.04, 95% CI 1.03–1.05, p = 0.0972).
Figure 4
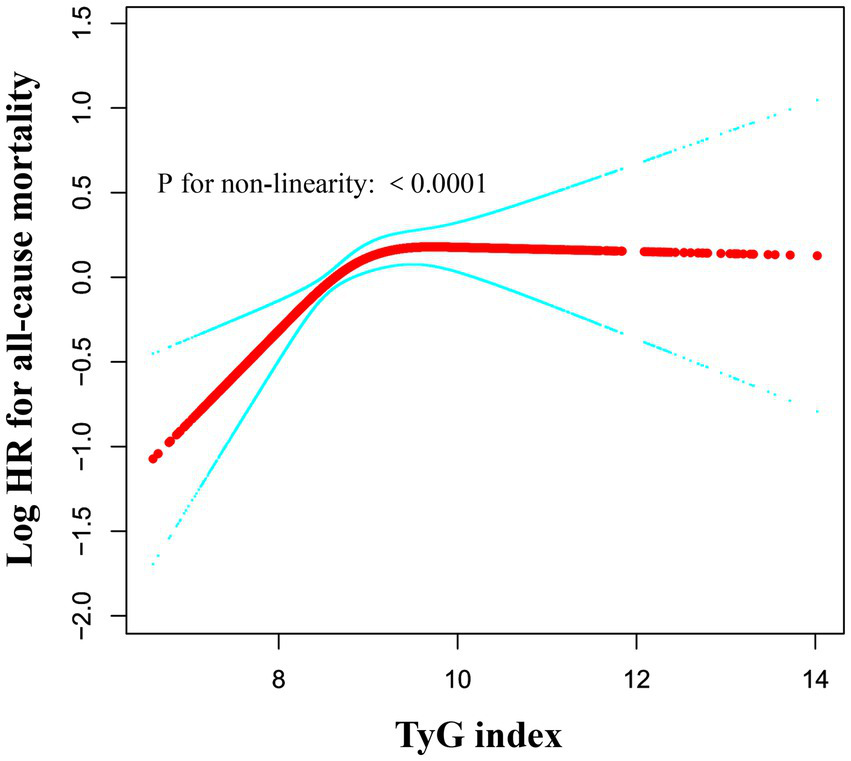
Associations between TyG index and all-cause mortality in critically ill patients. A threshold, nonlinear association between TyG index and all-cause mortality was identified using a generalized additive model (GAM). The solid red line represents the smooth curve fitted between the variables. The blue bands represent the 95% CI from the fitted model. The analysis was adjusted for gender, age, ethnicity, BMI, SOFA score, GCS score, APACHE IV, BUN, Scr, TC, HDL, COPD, CHF, AMI, and DM.
Table 5
| Outcome: all-cause mortality | HR, 95%CI | p-value |
|---|---|---|
| Standard Cox regression | 1.19 (1.04, 1.35) | 0.0089 |
| Two-piecewise Cox regression | ||
| Inflection points of TyG index | 9.84 | |
| <9.84 | 1.42 (1.20, 1.69) | <0.0001 |
| ≥9.84 | 1.04 (1.03, 1.05) | 0.0972 |
| p for log-likelihood ratio test* | 0.001 |
Threshold effect analysis of the TyG index and all-cause mortality.
Data were presented as HR (95% CI) p value; Model I, linear analysis; Model II, non-linear analysis. Adjusted for gender, age, ethnicity, BMI, SOFA score, GCS score, APACHE IV, BUN, Scr, TC, HDL, COPD, CHF, AMI, and DM. CI, confidence interval; OR, odds ratio; LRT, logarithm likelihood ratio test. *p < 0.05 indicates that model II is significantly different from Model I.
Subgroup analyses
As shown in Figure 5, we conducted subgroup analyses to evaluate the association between the TyG index and all-cause mortality. The primary findings indicated that in patients aged over 72 years, the TyG index was highly correlated with all-cause mortality. Additionally, a strong association between the TyG index and all-cause mortality was observed in female patients, and those without CHF. The study did not find significant interaction effects among the subgroups (all interaction p-values were greater than 0.05).
Figure 5
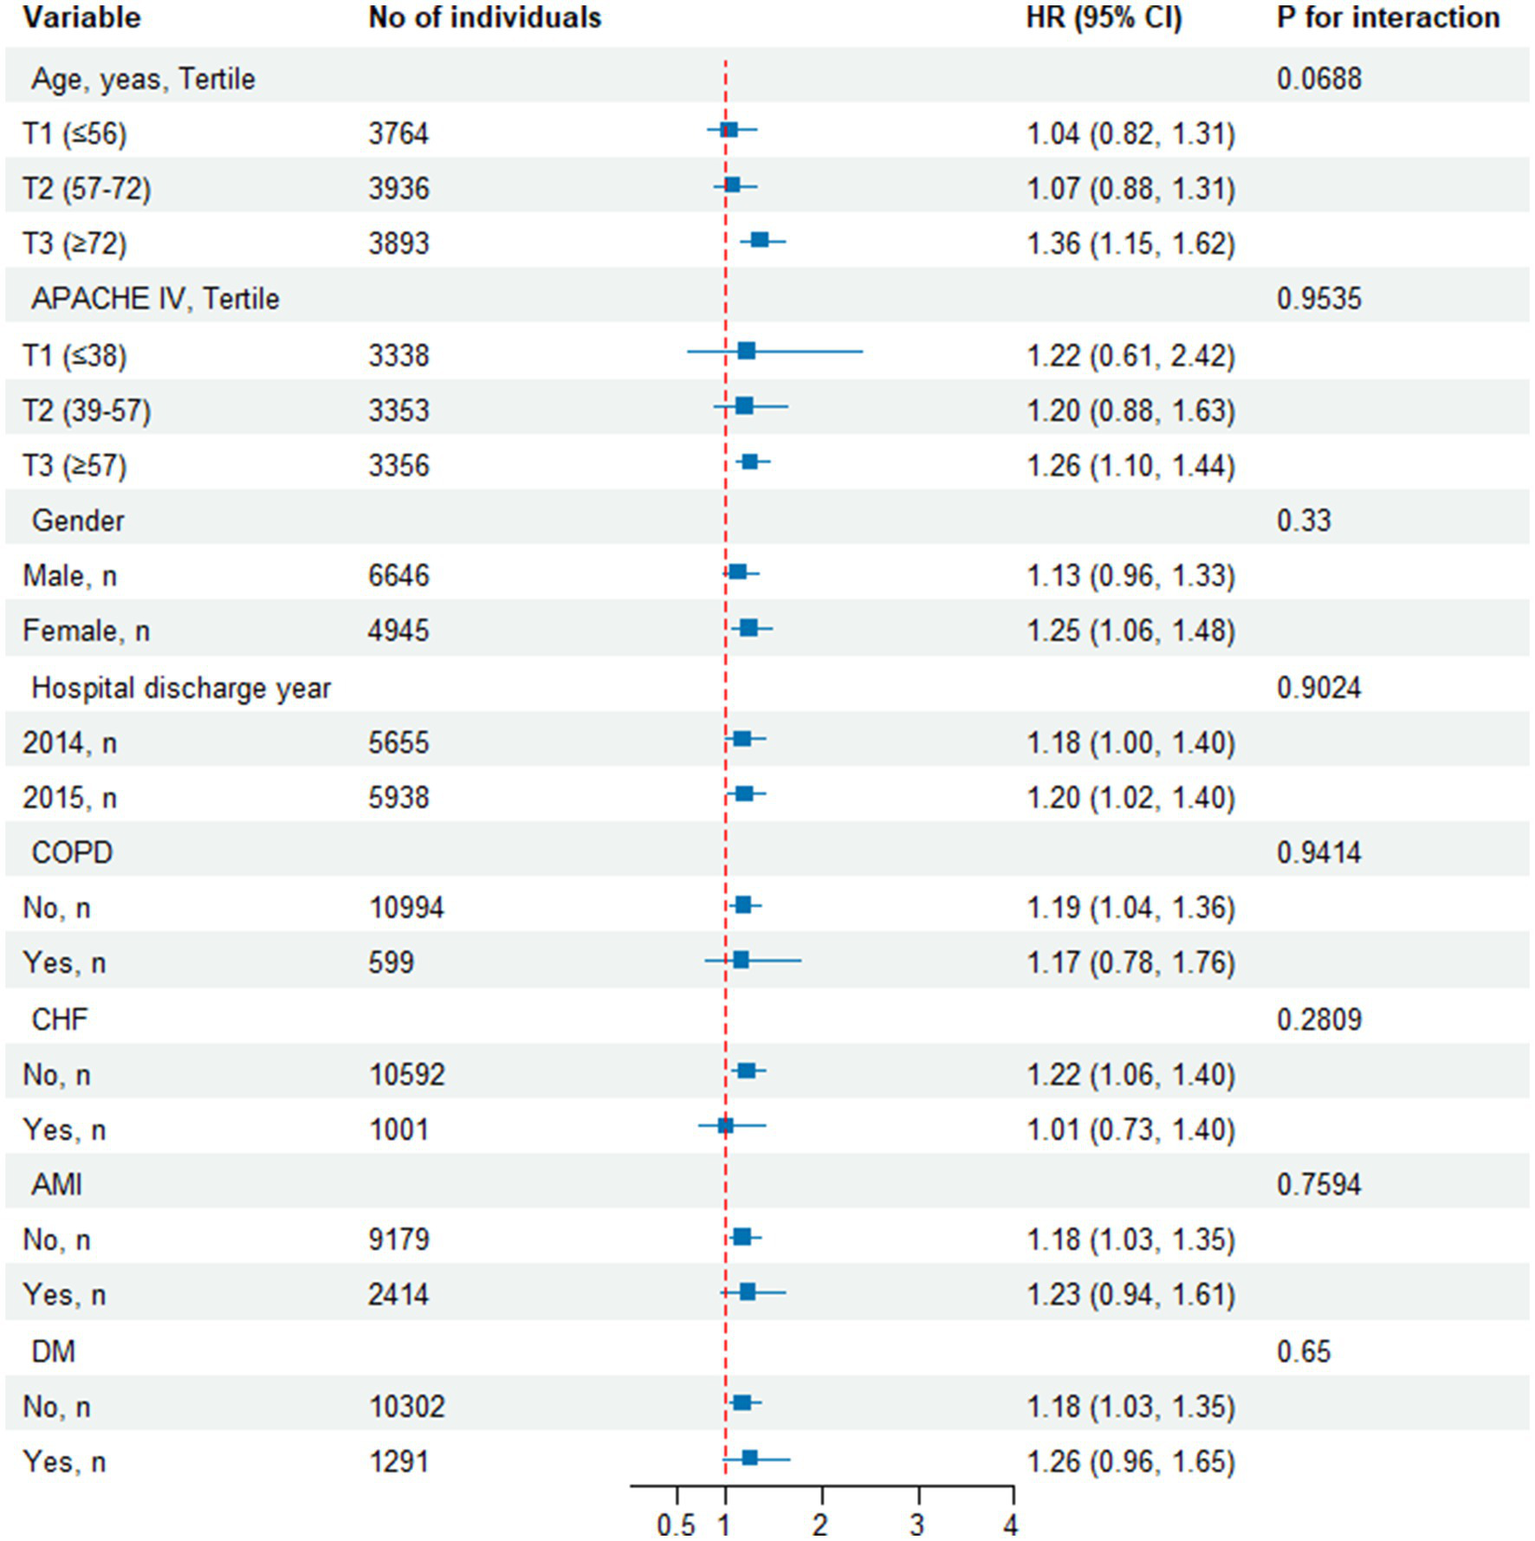
Effect size of TyG index on all-cause mortality in prespecified and exploratory subgroups. Above model adjusted for gender, age, ethnicity, BMI, SOFA score, GCS score, APACHE IV, BUN, Scr, TC, HDL, COPD, CHF, AMI, and DM. In each case, the model is not adjusted for the stratification variable when the stratification variable was a categorical variable.
Discussion
This multicenter study establishes the TyG index as a time-sensitive prognostic tool for 28-day mortality in ED-to-ICU patients. We identified a nonlinear threshold effect (inflection point: 9.84), where mortality risk escalates sharply below this cutoff (HR = 1.47) but plateaus above it—a critical insight for ED risk stratification. Unlike traditional ICU scores requiring delayed multi-organ assessments (e.g., APACHE IV), the TyG index leverages two routine ED biomarkers (FPG and TG), enabling risk calculation by short time after emergency admission (32, 33). This aligns with the “golden hour” principle in emergency care, where rapid triage directly impacts outcomes.
Given the simplicity, operability, and high efficiency of the TyG index in various clinical applications, it has been widely adopted in clinical practice. Numerous studies have shown that the TyG index is closely associated with various metabolic disorders, cardiovascular diseases, and the occurrence and prognosis of atherosclerosis (34–41). Many clinical studies have found a significant correlation between elevated TyG index levels and increased hospital mortality rates in critically ill patients, effectively predicting poor outcomes in cases of cardiac arrest, stroke, trauma, coronary artery disease, and sepsis. For instance, Cai et al. (24) extracted data from the MIMIC-IV database involving 733 patients with severe ischemic stroke and found a significant association between elevated TyG index and in-hospital and ICU all-cause mortality using Cox proportional hazards regression analysis. Similarly, Zheng et al. (18) explored the prognostic role of the TyG index for the first time in critically ill infectious patients using a retrospective observational cohort study involving 1,257 severe infection patients from the MIMIC-IV database, indicating a correlation between elevated TyG index and increased in-hospital mortality in these patients. Ye et al. (42) investigated 639 patients with chronic kidney disease and coronary artery disease in the ICU, discovering that the TyG index could predict in-hospital and one-year mortality rates. Also, Zhang et al. (43) analyzed 1,618 severe coronary artery disease patients from the MIMIC-III database, highlighting that the TyG index could significantly predict hospital and ICU mortality rates in these patients. Huang et al. (44) indicated that the TyG index can serve as a novel assessment tool for predicting all-cause mortality in critically ill hemorrhagic stroke patients, noting that it can predict mortality due to hemorrhagic stroke. However, the patients included in these studies may have come from various departments and not solely from the emergency department, and several limitations exist within these studies: (i) Some studies utilized retrospective designs, which may lead to selection bias and information bias; (ii) Smaller sample sizes (such as 733 patients) may limit the generalizability of the results; (iii) Despite considering several confounding variables, there may still be unrecognized or uncontrolled confounding factors that could bias the results.
To address the deficiencies and limitations mentioned above, we conducted a multicenter retrospective cohort study based on the eICU database, including 11,593 ED-to-ICU critically ill patients, and investigated the association between the TyG index and the 28-day mortality rate of ED-to-ICU critically ill patients. Moreover, we generated an E-value to assess the sensitivity to unmeasured confounding factors. Our results indicated that the high TyG index group had significantly higher 28-day in-hospital all-cause mortality compared to the low TyG index group. The TyG index exhibited a significant positive correlation with 28-day all-cause mortality rates, and this association remained significant after adjusting for various clinical and laboratory variables. Furthermore, we utilized a cubic spline function in the Cox proportional hazards regression model to identify a nonlinear saturation effect, with an inflection point at 9.84. This finding indicates that an increased TyG index significantly elevates the risk of mortality, particularly when exceeding this threshold. Below this inflection point, all-cause mortality increases with rising TyG index levels; above this point, all-cause mortality reaches a saturation level (see Table 5).
Furthermore, our study conducted risk stratification analysis across various subgroups. The subgroup analysis indicated that in patients aged over 72 years, the TyG index was a more significant predictor of 28-day all-cause mortality, consistent with previous studies (45). This highlights the need to pay closer attention to older patients, as they are likely to experience more complications and a faster progression of illness. In females, the TyG index seemingly predicts 28-day all-cause mortality more significantly, potentially related to higher age, SOFA score, and APACHE IV, along with a greater prevalence of COPD and CHF in this cohort compared to males (Supplementary Table 1). Another interesting finding in our study was that among Caucasians, the TyG index was also a very significant predictor of 28-day all-cause mortality, which may be related to their metabolic characteristics, dietary habits, and responses to cardiovascular risk factors. However, we observed a connection between the TyG index and all-cause mortality in patients without CHF. This phenomenon may be attributed to reverse causation: patients diagnosed with these comorbidities are more likely to receive appropriate treatment and greater attention. Therefore, although their overall mortality risk is higher, their prognosis may be improved. Furthermore, in our subgroup analysis, we did not observe any significant interactions. This indicates that the relationship between the TyG index and all-cause mortality is consistent across different subgroups and is not significantly influenced by other variables. This finding enhances our confidence in the applicability of the TyG index in clinical settings and suggests its potential as a risk assessment tool.
Evidently, our primary results align similarly with previous studies. Huiruo Liu et al. (46) investigated the association between the TyG index and outcomes in patients with acute myocardial infarction complicated by cardiogenic shock (AMICS), including 375 patients who developed cardiogenic shock. The study found a significant elevation of the TyG index in these patients, with a linear correlation to both in-hospital and ICU mortality rates. Furthermore, this study indicated a cutoff value of 9.22, above which patients displayed a significantly increased risk of death during hospitalization and in the ICU. Additionally, Ying Liao et al. (47) analyzed 3,026 critically ill patients and exhibited a non-linear association between the TyG index and mortality, with a cutoff point of 9.2. However, compared to our study, these earlier investigations often did not adequately consider the specificity of the TyG index and its potential application in emergency critically ill patients. Our study identified a non-linear association between the TyG index and all-cause mortality among ED-to-ICU critically ill patients, with a cutoff point of 9.84, which is slightly higher than previous findings. This indicates that the TyG index for all-cause mortality to reach saturation is higher in ED critically ill patients. This phenomenon may be attributed to the presence of multiple comorbidities and the complex clinical conditions of these patients. Furthermore, their studies had relatively small sample sizes and lacked multicenter data support, which may limit the validity of the results. In other words, the findings of this study are more reliable and worthy of widespread clinical application. On the other hand, some studies may have focused on other biomarkers or scoring systems, such as APACHE II or SOFA scores (48). These scoring systems typically require multiple data inputs, which may be challenging to obtain swiftly within an emergency setting, delaying patient risk assessment. In contrast, the TyG index is relatively simple to compute and can be rapidly acquired in the emergency department, making it suitable for immediate applications in clinical practice.
Although the mechanisms underlying the close association between the TyG index and all-cause mortality in ICU patients are not yet fully elucidated, the prevailing hypothesis suggests that metabolic abnormalities due to IR could be a significant contributor (47). Firstly, IR can lead to metabolic disorders, such as hyperglycemia and abnormal lipid metabolism, potentially exacerbating the underlying conditions of critically ill patients. These metabolic abnormalities are closely linked to an increased risk of complications, including infections, inflammation, and tissue hypoperfusion, which can further worsen the condition (49, 50). Secondly, the TyG index has been shown to amplify inflammatory responses, oxidative stress, endothelial dysfunction, and cardiovascular remodeling, all of which are primary contributors to the deterioration of critically ill patients’ health (51, 52). Through these mechanisms, a close association between the TyG index and overall mortality rates in critically ill patients is observed.
Our study possesses several strengths: Firstly, it is the first to verify a significant positive correlation between the TyG index and increased 28-day all-cause mortality rates in ED-to-ICU critically ill patients. Additionally, it identifies a nonlinear saturation effect association between the TyG index and 28-day all-cause mortality. Secondly, this study utilizes a large sample size of 11,593 patients and employs a multicenter retrospective cohort design, contrasting with many previous studies characterized by small sample sizes or case–control designs, thus enhancing the representativeness and broad applicability of the findings. Thirdly, our analysis considers various potential confounding factors (e.g., gender, age, BMI, SOFA score, GCS score and APACH IV, etc.), utilizing E-values to assess sensitivity to unmeasured confounders, revealing robust results. Many earlier studies failed to adequately adjust these factors, potentially leading to bias in their results. Fourthly, our study conducted thorough sensitivity analyses to validate the robustness of the TyG index as a predictor of mortality risk, bolstering the credibility of the findings. Fifthly, it included subgroup analysis and interaction evaluations. Through subgroup analysis, the study identified associations between the TyG index and all-cause mortality rates across different ages, APACHE IV, genders, or underlying disease states (e.g., DM, CHF, COPD, and AMI). This analysis aids in determining which specific populations might be more affected by the TyG index, thus providing more targeted guidance for clinical decision-making. Interaction analysis across various subgroups further validated whether the predictive capability of the TyG index remained consistent across diverse populations. This method enhances the robustness of the findings, making the study conclusions more widely applicable.
However, several limitations and shortcomings must be acknowledged in this research. Firstly, as a retrospective study, it may be subject to selection bias and information bias, which could affect the interpretation of the results. Secondly, although the study controlled for various confounding factors, there may still be unrecognized confounding variables. We utilized the E-value sensitivity analysis to quantify the potential implications of unmeasured confounders and found that an unmeasured confounder was unlikely to fully explain the treatment effect. Thirdly, this study experienced some missing data; although multiple imputation methods were employed to address this issue, it may still influence the accuracy of the results. Fourthly, the study did not delve deeply into the biological mechanisms linking the TyG index and mortality rates in ED-to-ICU critically ill patients, suggesting an area for future research to explore potential physiological mechanisms further. Fifthly, due to database constraints, we could not confirm whether all glucose measurements were derived from fasting samples. Sixthly, while the findings of this study demonstrate a degree of representativeness, further validation in other independent cohorts is necessary to confirm their generalizability. Seventhly, this study is based on the eICU database, which mainly covers data from hospitals in the United States. Therefore, we suggest that caution should be exercised when applying the TyG index threshold derived in this study to populations outside the United States. Eighthly, our analysis considers various potential confounding factors (e.g., gender, age, BMI, SOFA score, GCS score and APACHE IV, etc.), utilizing E-values to assess sensitivity to unmeasured confounders. However, this alone is not sufficient. We will consider further detailed exploration of specific potential confounders, such as the use of vasopressors and fluid resuscitation, and how they might influence the association between the TyG index and mortality. This will help to provide a more comprehensive understanding of the limitations and robustness of our findings. Finally, the data used in this study originated from the United States, which means the results may not be fully applicable to ICUs in other countries. Despite potential limitations arising from regional differences, the characteristics revealed by this study can serve as a reference for patient management and treatment planning in other regions, contributing to the improvement of critical care quality on a global scale.
Conclusion
In ED-to-ICU critically ill patients, the TyG index demonstrates a nonlinear relationship with 28-day mortality, serving as a rapid, actionable biomarker for emergency risk stratification. A threshold of 9.84 identifies high-risk patients requiring immediate metabolic optimization (e.g., glycemic control, lipid management) and prioritized ICU admission.
Statements
Data availability statement
The datasets presented in this study can be found in online repositories. The names of the repository/repositories and accession number(s) can be found in the article/Supplementary material.
Ethics statement
The studies involving humans were approved by this study protocol was approved by the MIT Institutional Review Board (Approval No.: 49995491). The studies were conducted in accordance with the local legislation and institutional requirements. Written informed consent for participation in this study was provided by the participants’ legal guardians/next of kin.
Author contributions
ZH: Conceptualization, Data curation, Formal analysis, Writing – original draft. JB: Formal analysis, Writing – original draft. KY: Conceptualization, Formal analysis, Methodology, Writing – original draft. WG: Writing – review & editing. HY: Funding acquisition, Methodology, Writing – review & editing.
Funding
The author(s) declare that financial support was received for the research and/or publication of this article. This work was supported by the National Natural Science Foundation of China (grant number 82072232), the Science and Technology Program of Guangzhou, China (grant number 202201020028), Shenzhen Science and Technology Program (KCXFZ2023073109410002), National Natural Science Foundation of China (No. 82471574), Shenzhen Clinical Research Center for Trauma treatment (LCYSSQ20220823091405012), Shenzhen Second People’s Hospital Clinical Research Fund of Shenzhen High-level Hospital Construction Project (No. 20253357007) and Medical Research Foundation of Guangdong Province (A2024429).
Conflict of interest
The authors declare that the research was conducted in the absence of any commercial or financial relationships that could be construed as a potential conflict of interest.
Generative AI statement
The author(s) declare that no Gen AI was used in the creation of this manuscript.
Publisher’s note
All claims expressed in this article are solely those of the authors and do not necessarily represent those of their affiliated organizations, or those of the publisher, the editors and the reviewers. Any product that may be evaluated in this article, or claim that may be made by its manufacturer, is not guaranteed or endorsed by the publisher.
Supplementary material
The Supplementary material for this article can be found online at: https://www.frontiersin.org/articles/10.3389/fmed.2025.1605843/full#supplementary-material
References
1.
Kim YC Kim JH Ahn JY Jeong SJ Ku NS Choi JY et al . Discontinuation of glycopeptides in patients with culture negative severe Sepsis or septic shock: a propensity-matched retrospective cohort study. Antibiotics (Basel). (2020) 9:250. doi: 10.3390/antibiotics9050250
2.
Herring AA Ginde AA Fahimi J Alter HJ Maselli JH Espinola JA et al . Increasing critical care admissions from U.S. emergency departments, 2001-2009. Crit Care Med. (2013) 41:1197–204. doi: 10.1097/CCM.0b013e31827c086f
3.
McDowald K Direktor S Hynes EA Sahadeo A Rogers ME . Effectiveness of collaboration between emergency department and intensive care unit teams on mortality rates of patients presenting with critical illness: a systematic review. JBI Database System Rev Implement Rep. (2017) 15:2365–89. doi: 10.11124/JBISRIR-2017-003365
4.
Pollard TJ Johnson AEW Raffa JD Celi LA Mark RG Badawi O . The eICU collaborative research database, a freely available multi-center database for critical care research. Sci Data. (2018) 5:180178. doi: 10.1038/sdata.2018.178
5.
Braun A Chang D Mahadevappa K Gibbons FK Liu Y Giovannucci E et al . Association of low serum 25-hydroxyvitamin D levels and mortality in the critically ill. Crit Care Med. (2011) 39:671–7. doi: 10.1097/CCM.0b013e318206ccdf
6.
O'Callaghan DJ Jayia P Vaughan-Huxley E Gribbon M Templeton M Skipworth JR et al . An observational study to determine the effect of delayed admission to the intensive care unit on patient outcome. Crit Care. (2012) 16:R173. doi: 10.1186/cc11650
7.
Stey AM Kanzaria HK Dudley RA Bilimoria KY Knudson MM Callcut RA . Emergency department length of stay and mortality in critically injured patients. J Intensive Care Med. (2022) 37:278–87. doi: 10.1177/0885066621995426
8.
DeFronzo RA Ferrannini E . Insulin resistance. A multifaceted syndrome responsible for NIDDM, obesity, hypertension, dyslipidemia, and atherosclerotic cardiovascular disease. Diabetes Care. (1991) 14:173–94. doi: 10.2337/diacare.14.3.173
9.
Kahn SE Cooper ME Del PS . Pathophysiology and treatment of type 2 diabetes: perspectives on the past, present, and future. Lancet. (2014) 383:1068–83. doi: 10.1016/S0140-6736(13)62154-6
10.
Kosmas CE Bousvarou MD Kostara CE Papakonstantinou EJ Salamou E Guzman E . Insulin resistance and cardiovascular disease. J Int Med Res. (2023) 51:655741820. doi: 10.1177/03000605231164548
11.
Boles A Kandimalla R Reddy PH . Dynamics of diabetes and obesity: epidemiological perspective. Biochim Biophys Acta Mol basis Dis. (2017) 1863:1026–36. doi: 10.1016/j.bbadis.2017.01.016
12.
Kalfon P Le Manach Y Ichai C Bréchot N Cinotti R Dequin PF et al . Severe and multiple hypoglycemic episodes are associated with increased risk of death in ICU patients. Crit Care. (2015) 19:153. doi: 10.1186/s13054-015-0851-7
13.
Fritz J Brozek W Concin H Nagel G Kerschbaum J Lhotta K et al . The triglyceride-glucose index and obesity-related risk of end-stage kidney disease in Austrian adults. JAMA Netw Open. (2021) 4:e212612. doi: 10.1001/jamanetworkopen.2021.2612
14.
Kim MK Ahn CW Kang S Nam JS Kim KR Park JS . Association between the triglyceride glucose index and coronary artery calcification in Korean adults. Cardiovasc Diabetol. (2017) 16:108. doi: 10.1186/s12933-017-0589-4
15.
Sun Y Ji H Sun W An X Lian F . Triglyceride glucose (TyG) index: a promising biomarker for diagnosis and treatment of different diseases. Eur J Intern Med. (2025) 131:3–14. doi: 10.1016/j.ejim.2024.08.026
16.
Cui H Liu Q Wu Y Cao L . Cumulative triglyceride-glucose index is a risk for CVD: a prospective cohort study. Cardiovasc Diabetol. (2022) 21:22. doi: 10.1186/s12933-022-01456-1
17.
Thai PV Tien HA Van Minh H Valensi P . Triglyceride glucose index for the detection of asymptomatic coronary artery stenosis in patients with type 2 diabetes. Cardiovasc Diabetol. (2020) 19:137. doi: 10.1186/s12933-020-01108-2
18.
Zheng R Qian S Shi Y Lou C Xu H Pan J . Association between triglyceride-glucose index and in-hospital mortality in critically ill patients with sepsis: analysis of the MIMIC-IV database. Cardiovasc Diabetol. (2023) 22:307. doi: 10.1186/s12933-023-02041-w
19.
Avagimyan A Pogosova N Fogacci F Aghajanova E Djndoyan Z Patoulias D et al . Triglyceride-glucose index (TyG) as a novel biomarker in the era of cardiometabolic medicine. Int J Cardiol. (2025) 418:132663. doi: 10.1016/j.ijcard.2024.132663
20.
Sbriscia M Colombaretti D Giuliani A Di Valerio S Scisciola L Rusanova I et al . Triglyceride glucose index predicts long-term mortality and major adverse cardiovascular events in patients with type 2 diabetes. Cardiovasc Diabetol. (2025) 24:115. doi: 10.1186/s12933-025-02671-2
21.
Lv L Xiong J Huang Y He T Zhao J . Association between the triglyceride glucose index and all-cause mortality in critically ill patients with acute kidney injury. Kidney Dis (Basel). (2024) 10:69–78. doi: 10.1159/000535891
22.
Zhang Y Ding X Hua B Liu Q Gao H Chen H et al . High triglyceride-glucose index is associated with adverse cardiovascular outcomes in patients with acute myocardial infarction. Nutr Metab Cardiovasc Dis. (2020) 30:2351–62. doi: 10.1016/j.numecd.2020.07.041
23.
Nie M Jiang B Xu Y . Association between the triglyceride-glucose index and mortality in critically ill patients: a meta-analysis. Medicine (Baltimore). (2024) 103:e39262. doi: 10.1097/MD.0000000000039262
24.
Cai W Xu J Wu X Chen Z Zeng L Song X et al . Association between triglyceride-glucose index and all-cause mortality in critically ill patients with ischemic stroke: analysis of the MIMIC-IV database. Cardiovasc Diabetol. (2023) 22:138. doi: 10.1186/s12933-023-01864-x
25.
O'Halloran HM Kwong K Veldhoen RA Maslove DM . Characterizing the patients, hospitals, and data quality of the eICU collaborative research database. Crit Care Med. (2020) 48:1737–43. doi: 10.1097/CCM.0000000000004633
26.
Steventon JJ Trueman RC Ma D Yhnell E Bayram-Weston Z Modat M et al . Longitudinal in vivo MRI in a Huntington's disease mouse model: global atrophy in the absence of white matter microstructural damage. Sci Rep. (2016) 6:32423. doi: 10.1038/srep32423
27.
Zhang N Hu X Zhang Q Bai P Cai M Zeng TS et al . Non-high-density lipoprotein cholesterol: high-density lipoprotein cholesterol ratio is an independent risk factor for diabetes mellitus: results from a population-based cohort study. J Diabetes. (2018) 10:708–14. doi: 10.1111/1753-0407.12650
28.
Han J Dai W Chen L Huang Z Li C Wang K . Elevated triglyceride-glucose index associated with increased risk of diabetes in non-obese young adults: a longitudinal retrospective cohort study from multiple Asian countries. Front Endocrinol (Lausanne). (2024) 15:1427207. doi: 10.3389/fendo.2024.1427207
29.
Tao LC Xu JN Wang TT Hua F Li JJ . Triglyceride-glucose index as a marker in cardiovascular diseases: landscape and limitations. Cardiovasc Diabetol. (2022) 21:68. doi: 10.1186/s12933-022-01511-x
30.
Jiang Y Shen J Chen P Cai J Zhao Y Liang J et al . Association of triglyceride glucose index with stroke: from two large cohort studies and Mendelian randomization analysis. Int J Surg. (2024) 110:5409–16. doi: 10.1097/JS9.0000000000001795
31.
Haneuse S VanderWeele TJ Arterburn D . Using the E-value to assess the potential effect of unmeasured confounding in observational studies. JAMA. (2019) 321:602–3. doi: 10.1001/jama.2018.21554
32.
Wang J Huang X Fu C Sheng Q Liu P . Association between triglyceride glucose index, coronary artery calcification and multivessel coronary disease in Chinese patients with acute coronary syndrome. Cardiovasc Diabetol. (2022) 21:187. doi: 10.1186/s12933-022-01615-4
33.
Chiu H Tsai HJ Huang JC Wu PY Hsu WH Lee MY et al . Associations between triglyceride-glucose index and micro- and macro-angiopathies in type 2 diabetes mellitus. Nutrients. (2020) 12:328. doi: 10.3390/nu12020328
34.
Zhang Q Xiao S Jiao X Shen Y . The triglyceride-glucose index is a predictor for cardiovascular and all-cause mortality in CVD patients with diabetes or pre-diabetes: evidence from NHANES 2001-2018. Cardiovasc Diabetol. (2023) 22:279. doi: 10.1186/s12933-023-02030-z
35.
Liu Q Zhang Y Chen S Xiang H Ouyang J Liu H et al . Association of the triglyceride-glucose index with all-cause and cardiovascular mortality in patients with cardiometabolic syndrome: a national cohort study. Cardiovasc Diabetol. (2024) 23:80. doi: 10.1186/s12933-024-02152-y
36.
Zhou Y Wang C Che H Cheng L Zhu D Rao C et al . Association between the triglyceride-glucose index and the risk of mortality among patients with chronic heart failure: results from a retrospective cohort study in China. Cardiovasc Diabetol. (2023) 22:171. doi: 10.1186/s12933-023-01895-4
37.
Lopez-Jaramillo P Gomez-Arbelaez D Martinez-Bello D Abat M Alhabib KF Avezum Á et al . Association of the triglyceride glucose index as a measure of insulin resistance with mortality and cardiovascular disease in populations from five continents (PURE study): a prospective cohort study. Lancet Healthy Longev. (2023) 4:e23–33. doi: 10.1016/S2666-7568(22)00247-1
38.
Zhao M Xiao M Tan Q Lu F . Triglyceride glucose index as a predictor of mortality in middle-aged and elderly patients with type 2 diabetes in the US. Sci Rep. (2023) 13:16478. doi: 10.1038/s41598-023-43512-0
39.
Liu C Liang D Xiao K Xie L . Association between the triglyceride-glucose index and all-cause and CVD mortality in the young population with diabetes. Cardiovasc Diabetol. (2024) 23:171. doi: 10.1186/s12933-024-02269-0
40.
Wen J Pan Q Du LL Song JJ Liu YP Meng XB et al . Association of triglyceride-glucose index with atherosclerotic cardiovascular disease and mortality among familial hypercholesterolemia patients. Diabetol Metab Syndr. (2023) 15:39. doi: 10.1186/s13098-023-01009-w
41.
Yu S Li Q Yang H Guo X Li G Sun Y . Triglyceride-glucose index predicts all-cause mortality, but not cardiovascular mortality, in rural northeast Chinese patients with metabolic syndrome: a community-based retrospective cohort study. Nutr Metab (Lond). (2024) 21:27. doi: 10.1186/s12986-024-00804-0
42.
Ye Z An S Gao Y Xie E Zhao X Guo Z et al . Association between the triglyceride glucose index and in-hospital and 1-year mortality in patients with chronic kidney disease and coronary artery disease in the intensive care unit. Cardiovasc Diabetol. (2023) 22:110. doi: 10.1186/s12933-023-01843-2
43.
Zhang R Shi S Chen W Wang Y Lin X Zhao Y et al . Independent effects of the triglyceride-glucose index on all-cause mortality in critically ill patients with coronary heart disease: analysis of the MIMIC-III database. Cardiovasc Diabetol. (2023) 22:10. doi: 10.1186/s12933-023-01737-3
44.
Huang Y Li Z Yin X . Triglyceride-glucose index: a novel evaluation tool for all-cause mortality in critically ill hemorrhagic stroke patients-a retrospective analysis of the MIMIC-IV database. Cardiovasc Diabetol. (2024) 23:100. doi: 10.1186/s12933-024-02193-3
45.
Cheng L Zhang F Xue W Yu P Wang X Wang H et al . Association of dynamic change of triglyceride-glucose index during hospital stay with all-cause mortality in critically ill patients: a retrospective cohort study from MIMIC IV2.0. Cardiovasc Diabetol. (2023) 22:142. doi: 10.1186/s12933-023-01874-9
46.
Liu H Wang L Zhou X Wang H Hao X Du Z et al . Triglyceride-glucose index correlates with the occurrence and prognosis of acute myocardial infarction complicated by cardiogenic shock: data from two large cohorts. Cardiovasc Diabetol. (2024) 23:337. doi: 10.1186/s12933-024-02423-8
47.
Liao Y Zhang R Shi S Zhao Y He Y Liao L et al . Triglyceride-glucose index linked to all-cause mortality in critically ill patients: a cohort of 3026 patients. Cardiovasc Diabetol. (2022) 21:128. doi: 10.1186/s12933-022-01563-z
48.
Zhang XM Zhang WW Yu XZ Dou QL Cheng AS . Comparing the performance of SOFA, TPA combined with SOFA and APACHE-II for predicting ICU mortality in critically ill surgical patients: a secondary analysis. Clin Nutr. (2020) 39:2902–9. doi: 10.1016/j.clnu.2019.12.026
49.
Reaven G . The metabolic syndrome or the insulin resistance syndrome? Different names, different concepts, and different goals. Endocrinol Metab Clin N Am. (2004) 33:283–303. doi: 10.1016/j.ecl.2004.03.002
50.
Ji W Gao L Sun P Jia J Li J Wang X et al . Association of the triglyceride-glucose index and vascular target organ damage in a Beijing community-based population. Front Cardiovasc Med. (2022) 9:948402. doi: 10.3389/fcvm.2022.948402
51.
Wu Z Liu L Wang W Cui H Zhang Y Xu J et al . Triglyceride-glucose index in the prediction of adverse cardiovascular events in patients with premature coronary artery disease: a retrospective cohort study. Cardiovasc Diabetol. (2022) 21:142. doi: 10.1186/s12933-022-01576-8
52.
Li J Lin Y Li H Fan R Lin L Wang X et al . A retrospective study of the association between the triglyceride glucose index and myocardial revascularization for new-onset acute coronary syndromes. Front Cardiovasc Med. (2022) 9:862252. doi: 10.3389/fcvm.2022.862252
Summary
Keywords
triglyceride-glucose index, emergency critical care, risk stratification, insulin resistance, mortality prediction, ICU admission
Citation
Huang Z, Bu J, Yu K, Gu W and Yin H (2025) Emergency risk stratification using the TyG index: a multi-center cohort study on nonlinear association with 28-day mortality among critically ill patients transferred from the ED to the ICU. Front. Med. 12:1605843. doi: 10.3389/fmed.2025.1605843
Received
09 April 2025
Accepted
07 July 2025
Published
30 July 2025
Volume
12 - 2025
Edited by
Luca Marino, Sapienza University of Rome, Italy
Reviewed by
Dimitrios Damaskos, University of Edinburgh, United Kingdom
Muhammad Waseem, Lincoln Medical Center, United States
Ashot Avagimyan, Yerevan State Medical University, Armenia
Updates
Copyright
© 2025 Huang, Bu, Yu, Gu and Yin.
This is an open-access article distributed under the terms of the Creative Commons Attribution License (CC BY). The use, distribution or reproduction in other forums is permitted, provided the original author(s) and the copyright owner(s) are credited and that the original publication in this journal is cited, in accordance with accepted academic practice. No use, distribution or reproduction is permitted which does not comply with these terms.
*Correspondence: Wanjie Gu, wanjiegu@hotmail.com; Haiyan Yin, haiyanyin1867@126.com
Disclaimer
All claims expressed in this article are solely those of the authors and do not necessarily represent those of their affiliated organizations, or those of the publisher, the editors and the reviewers. Any product that may be evaluated in this article or claim that may be made by its manufacturer is not guaranteed or endorsed by the publisher.