 Cong Zhang1,2
 Xiaotao Wu
 Xiaozhi Sun
- 1Department of Spine Surgery, Zhongda Hospital, School of Medicine, Southeast University, Nanjing, China
- 2Surgery Research Center, School of Medicine, Southeast University, Nanjing, China
- 3Department of Orthopedic Trauma, Yizheng Hospital of Traditional Chinese Medicine, Yizheng, China
Objective: We evaluated differences in multifidus muscle atrophy (MMA) among patients with degenerative lumbar spondylolisthesis (DLS) across various segments and grades of spondylolisthesis, analysed the correlation between DLS and MMA, identified risk factors contributing to MMA, and provided a clinical reference for the prevention and treatment of MMA.
Methods: This retrospective study analysed data from 213 patients diagnosed with single-segment DLS between September 2020 and January 2022. Participants were categorised into three groups based on the affected spinal segment: L3 (n = 27), L4 (n = 140), and L5 (n = 46). The LCSA/GCSA ratio was calculated to assess the extent of MMA. Differences in MMA and its correlation with DLS severity were analysed across different spondylolisthesis grades. Furthermore, based on the Kjaer classification, patients were stratified into Mild and Severe MMA groups. A multivariate logistic regression analysis was performed to identify risk factors influencing the degree of MMA in DLS patients.
Results: The LCSA/GCSA ratio at the spondylolisthesis segment was significantly lower than that at the non-spondylolisthesis segment (p < 0.001). When comparing LCSA/GCSA ratios between different grades of lumbar spondylolisthesis (Grade I and II), no statistically significant differences were observed (p > 0.05). In the general population, a strong positive correlation was identified between the degree of MMA and the VAS and ODI scores for low back pain, whereas no significant correlation was found with the VAS score for leg pain. Age, BMI, and osteoporosis demonstrated statistically significant differences between the two groups (p < 0.05). Multivariate logistic regression analysis identified age, BMI, and osteoporosis as significant risk factors for MMA progression in DLS patients (p < 0.05).
Conclusion: DLS patients exhibit MMA, with more pronounced atrophy at the spondylolisthesis-affected segment. Age, BMI, and osteoporosis are independent risk factors for MMA progression in DLS patients. Clinically, it is crucial to identify and monitor high-risk patients with these factors and implement early preventive and therapeutic interventions to mitigate disease progression.
1 Introduction
Degenerative lumbar spondylolisthesis (DLS) refers to the anterior displacement of the upper vertebral body relative to the lower vertebral body during lumbar degeneration. Unlike isthmic spondylolisthesis, DLS is characterised by an intact lumbar isthmus. The primary clinical manifestations include low back pain radiating to the leg due to nerve root compression. DLS is a prevalent degenerative condition of the lumbar spine, with a higher incidence in women than in men (1). Numerous studies have investigated the pathogenesis of DLS, and the widely accepted hypothesis attributes its development to lumbar disc degeneration, facet joint degeneration, and laxity of the surrounding muscles and ligaments (2–4). These mechanisms primarily emphasise the role of intervertebral joint instability in the progression of DLS. However, the overall stability and flexibility of the lumbar spine depend on multiple anatomical structures, and current theories do not fully elucidate the aetiology of DLS. The paraspinal muscles of the lumbar spine primarily include the multifidus, longissimus, iliopsoas, and psoas major muscles. Among these, the multifidus muscle is the most critical component, playing a key role in resisting rotational and translational movements of the spine. Its primary physiological function is to maintain the physiological lordosis of the lumbar spine, thereby contributing to spinal stability (5, 6).
The multifidus muscle consists of multiple independent muscle bundles, with superficial bundles spanning several vertebral bodies in a directional manner. Conversely, the deep muscle bundles are segmentally arranged, overlapping one another, and positioned close to the rotational centre of the lumbar facet joints. These structural characteristics allow even slight contractions of the multifidus muscle to generate significant motor force (7). The muscle fibres of the multifidus are rich in proprioceptors, particularly muscle spindles, which are highly sensitive to tensile stimuli and changes in muscle length. When the body changes position, the muscle spindles in the multifidus detect tension and generate nerve impulses, which are transmitted to the spinal cord, triggering regulatory signals. This activation prompts the multifidus muscle to contract, counteracting rotational movements and vertebral slippage, contributing to lumbar spine stabilisation (8, 9).
The primary manifestations of multifidus muscle degeneration include a reduction in muscle mass and increased fat infiltration (10, 11). Multifidus muscle mass gradually declines with age, decreasing by approximately 1% per year after the age of 40 (12, 13). Due to its unique anatomical and biomechanical properties, progressive degeneration and fat infiltration of the multifidus muscle impair its autonomous contractile function, ultimately compromising segmental stability (14). Currently, studies on the correlation between multifidus muscle atrophy (MMA) and DLS remain limited and controversial. We analysed the relationship between DLS and MMA through lumbar magnetic resonance imaging (MRI) measurements. In addition, the severity of MMA in patients will be classified into Mild and Severe groups based on the Kjaer classification (15). A retrospective analysis will be conducted to identify risk factors for MMA in DLS, providing insights for early and effective interventions to mitigate MMA and prevent the development of DLS in clinical practice.
2 Data and methods
2.1 Research subjects
A retrospective study was conducted on inpatients diagnosed with single-segment DLS who were admitted to the Department of Spine Surgery at Southeast University Affiliated Zhongda Hospital between September 2020 and January 2022. Patients aged > 45 years who were diagnosed with single-segment DLS and had complete imaging data, including lumbar spine MRI, computed tomography, anteroposterior and lateral radiographs, and dynamic radiographs, were included. Patients with isthmic spondylolisthesis, ankylosing spondylitis, rheumatoid arthritis, congenital lumbar spine malformations, a history of lumbar spine surgery, primary or metastatic tumours involving the lumbar spine, or lumbar spine fractures were excluded. We also reduced potential bias by applying strict inclusion and exclusion criteria (such as excluding patients with chronic liver disease, chronic kidney disease, or those receiving acupuncture or massage therapy, as these conditions and treatments may affect MMA). Additionally, a comparison of baseline data for sex, age, BMI, osteoporosis, hypertension, and diabetes among the three groups of DLS patients showed no statistically significant differences, indicating that the groups are comparable.
During this retrospective study, strict inclusion and exclusion criteria were applied, and dedicated personnel were responsible for follow-up and recording clinical data, thereby minimising data selection bias and enhancing the accuracy of retrospective data recording. In addition, 20 healthy older adult volunteers were recruited as a control group. These individuals exhibited no history of low back or leg pain, lumbar spinal pathology, trauma, or prior lumbar spine surgery. The control group was matched with the DLS group in terms of age, sex, and BMI. The study was approved by the Ethical Committee of the Zhongda Hospital, Southeast University (No. 2019ZDSYLL101-P01). Informed written consent was obtained from all patients.
2.2 Methods and evaluation
2.2.1 Recording baseline patient information
Patient demographic and clinical data were recorded, including sex, age, body mass index (BMI), presence of osteoporosis, hypertension, and diabetes mellitus, the level of lumbar spondylolisthesis, and relevant laboratory examination findings.
Patients underwent anteroposterior, lateral, and dynamic lumbar spine radiographs. Spondylolisthesis severity was assessed using the Meyerding classification system based on lateral radiographs, categorising patients into Grade I or II (16). Patients were stratified into three groups based on the affected vertebral segment: the L3 group (n = 27; 24 Grade I, 3 Grade II), the L4 group (n = 140; 126 Grade I, 14 Grade II), and the L5 group (n = 46; 40 Grade I, 6 Grade II).
2.2.2 Measurement of MMA
MRI offers high sensitivity for detecting early degeneration of paravertebral muscles and provides superior visualisation of surrounding muscles, adipose tissue, and neural structures without radiation exposure. This modality is widely recognised as an effective method for quantifying muscle atrophy and fat infiltration (11). Data were collected from 20 older adult healthy volunteers to serve as a control group. All patients with spondylolisthesis and control subjects underwent standardised scanning using a 3.0 T Siemens MRI scanner (Siemens Healthcare, Erlangen, Germany). T2-weighted images were obtained at the L3/4, L4/5, and L5/S1 intervertebral disc levels, corresponding to the maximal cross-sectional area of the paravertebral muscles (17). MRI scans parameters during image acquisition are as follows, slice thickness: 4 mm, FOV: 200 mm, pixel matrix: 512*512, Voxel: 0.65*0.49*4 mm.
The cross-sectional area of the multifidus muscle on both sides of the lumbar spine was measured at the specified levels using ImageJ software (National Institutes of Health, Bethesda, MD, United States) and summed to determine the gross cross-sectional area (GCSA). Similarly, the lean cross-sectional area (LCSA) of the multifidus muscle on both sides was measured and summed to represent the total LCSA (Figure 1). Click on the threshold button of Image J software and adjust it until the fat infiltration area in the image is completely covered. The degree of MMA was calculated as the ratio of LCSA to GCSA (LCSA/GCSA), with a higher ratio indicating milder atrophy and a lower ratio indicating more severe atrophy (18). All measurements were independently conducted by two experienced radiologists. In cases of discrepancies, consensus was reached through discussion. Both radiologists had extensive clinical experience and received standardised training on measurement protocols prior to the study. Both radiologists received our standardised training and were knowledgeable in how to control grayscale values, adjust thresholds, and identify tissue edges. In addition, they were blinded to the research objectives, to minimise potential bias.
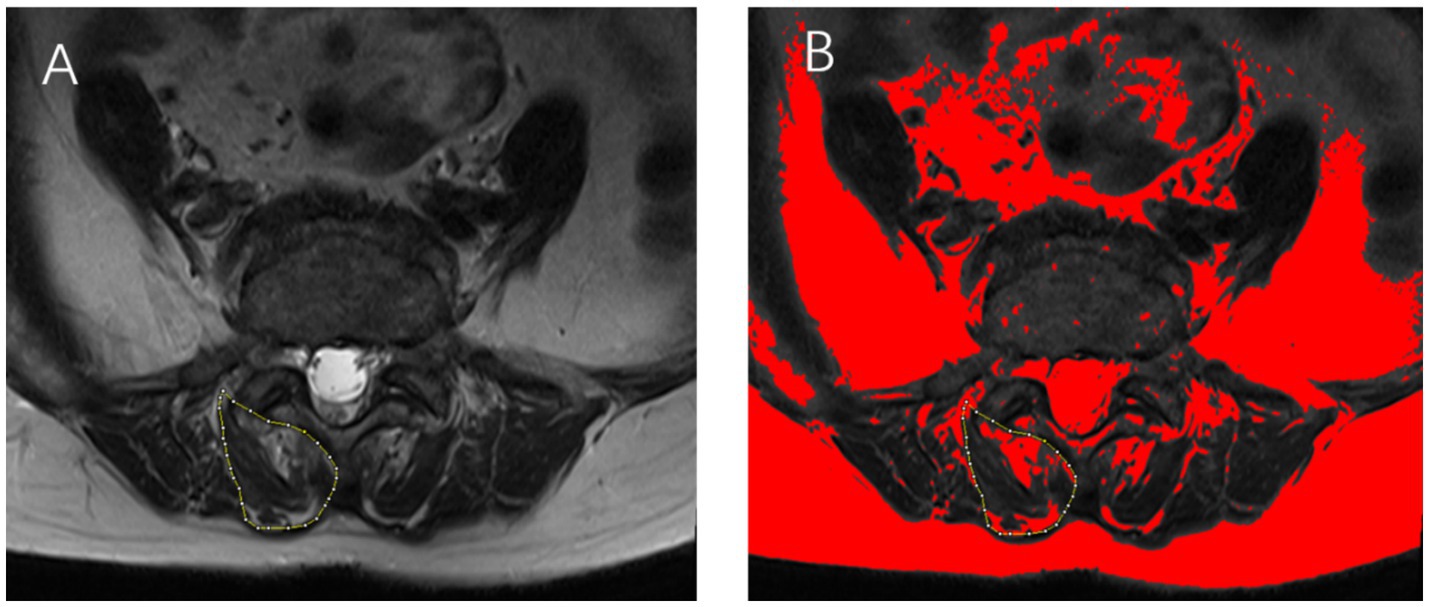
Figure 1. (A) Axial T2-weighted magnetic resonance imaging (MRI) of a 65-year-old female patient, illustrating the multifidus muscle area at the L4/5 level, outlined in yellow. (B) The fat infiltration area within the multifidus muscle is highlighted in red. The total multifidus muscle area is calculated by summing the measured areas on both sides of the lumbar spine.
2.2.3 Visual analogue scale and Oswestry disability index scores
Preoperative VAS and ODI scores were obtained for all three patient groups. The.
VAS score ranges from 0 to 10, where 0 indicates no pain and 10 represents extreme pain, with higher scores reflecting greater pain severity. The ODI questionnaire is used to assess functional disability due to low back pain, with the score calculated by dividing the actual score by the maximum possible score and multiplying by 100%. A higher ODI score indicates more severe functional impairment related to low back pain.
2.2.4 Risk factor analysis
According to the Kjaer classification, patients were categorised into Mild and Severe groups based on the degree of MMA. Differences in age, sex, BMI, osteoporosis, laboratory examination indicators, and other relevant factors between the two groups were compared. In addition, a multifactor logistic regression analysis was conducted to identify the risk factors influencing the degree of MMA in DLS patients.
2.3 Statistical analyses
Statistical analyses were performed using SPSS version 20.0 (IBM Corp., Armonk, NY, United States). Continuous variables are presented as mean ± standard deviation, whereas categorical variables are expressed as frequencies and percentages. Independent samples t-tests and chi-square (χ2) tests were used for comparisons between two groups. In this study, the L3 group included a total of 27 patients. Exact tests were used for comparisons between two groups (e.g., L3 group vs. L4 group, L3 group vs. L5 group). One-way analysis of variance (ANOVA) was used for comparisons among multiple groups. Multiple linear regression analysis was conducted to compare differences in LCSA/GCSA at different lumbar levels between the spondylolisthesis and control groups. Pearson correlation analysis was used to assess the correlation of MMA between the spondylolisthesis and non-spondylolisthesis segments. In addition, a multifactor logistic regression analysis was performed to identify risk factors influencing the degree of MMA in DLS patients. A significance level of α = 0.05 was set, with p < 0.05 considered statistically significant.
3 Results
3.1 Demographic characteristics of DLS patients
Our study included 213 patients with single-segment DLS and 20 healthy older adult individuals as a control group. All spondylolisthesis patients had single-stage DLS with complete imaging data.
The mean age of the DLS patients was 63.04 ± 9.25 (45–91) years. Among the 213 participants, 56 were male (26.3%), and 157 were female (73.7%). The distribution of spondylolisthesis levels was as follows: L3 segment (n = 27; 24 Grade I, 3 Grade II), including 6 males and 21 females, aged 46 to 83 years; L4 segment (n = 140; 126 Grade I, 14 Grade II), including 35 males and 105 females, aged 47 to 88 years; and L5 segment (n = 46; 40 Grade I, 6 Grade II), including 15 males and 31 females, aged 45–91 years. Comparison of demographic variables, including sex, age, BMI, presence of osteoporosis, hypertension, and diabetes mellitus, among the three spondylolisthesis groups revealed no statistically significant differences (p > 0.05), indicating baseline comparability (Table 1).
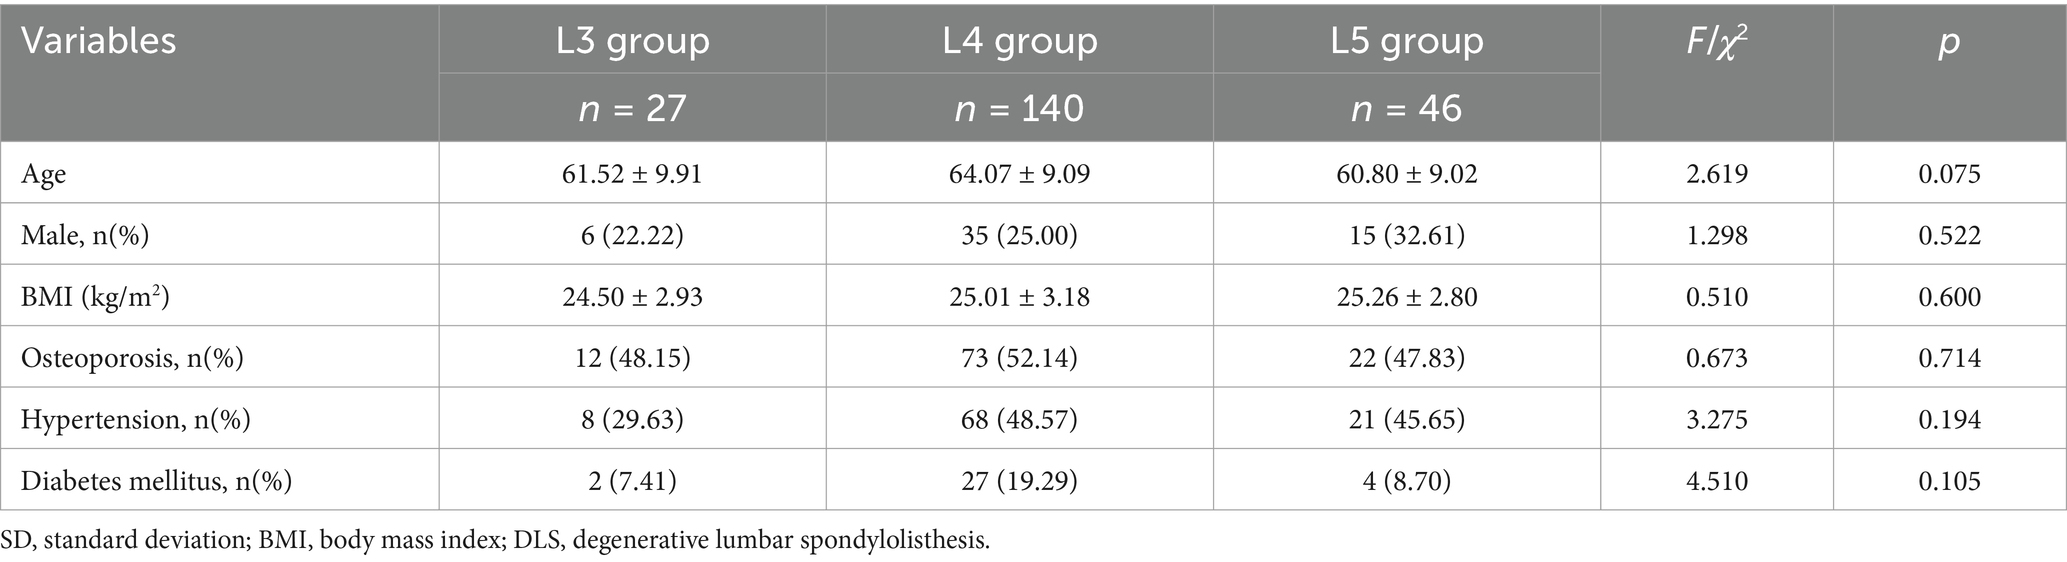
Table 1. Comparison of the general information of the three groups of patients with DLS.
3.2 Comparison of MMA between DLS and control groups
After matching for age, sex, and BMI, multiple linear regression analysis revealed that the LCSA/GCSA ratio of the multifidus muscle at the L3/4, L4/5, and L5/S1 levels in all three spondylolisthesis groups was significantly lower than that in the control group, with statistically significant differences (p < 0.001; Table 2).
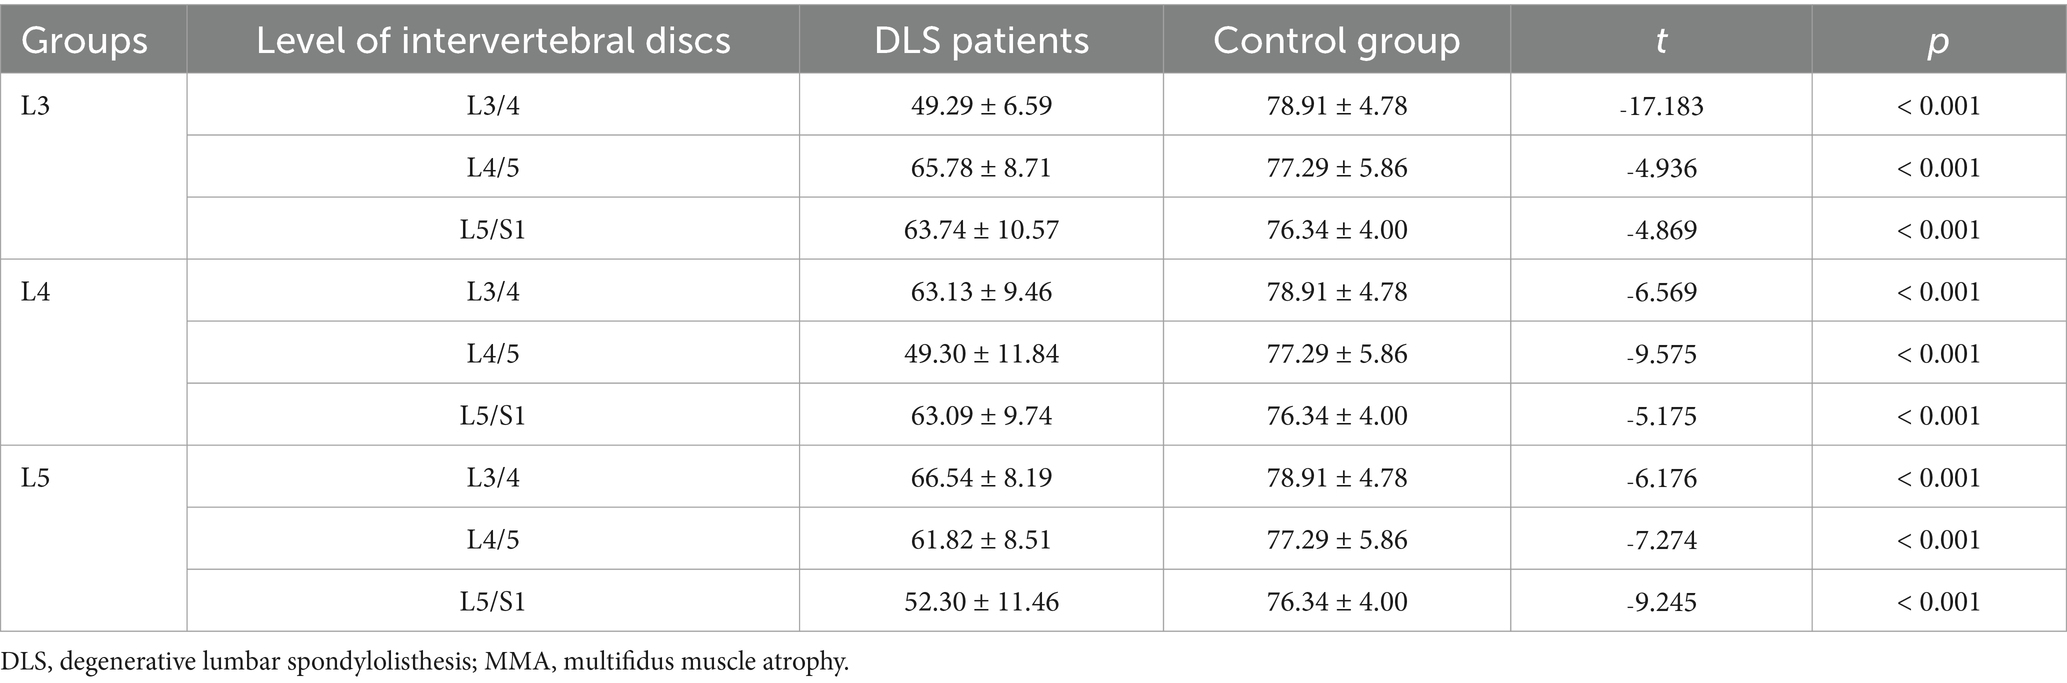
Table 2. Comparison of the degree of MMA at three intervertebral disc levels between DLS patients and the control group.
3.3 Comparison of MMA at different intervertebral disc levels in DLS patients
A comparison of multifidus LCSA/GCSA between the spondylolisthesis and non-spondylolisthesis segments in DLS patients revealed a statistically significant difference (p < 0.001; Table 3). In contrast, no statistically significant differences were observed in multifidus LCSA/GCSA in the L3/4, L4/5, L5/S1 segments in the control group (p > 0.05; Table 3; Figure 2).

Table 3. Comparison of the degree of MMA at different intervertebral disc levels between DLS patients and the control group.
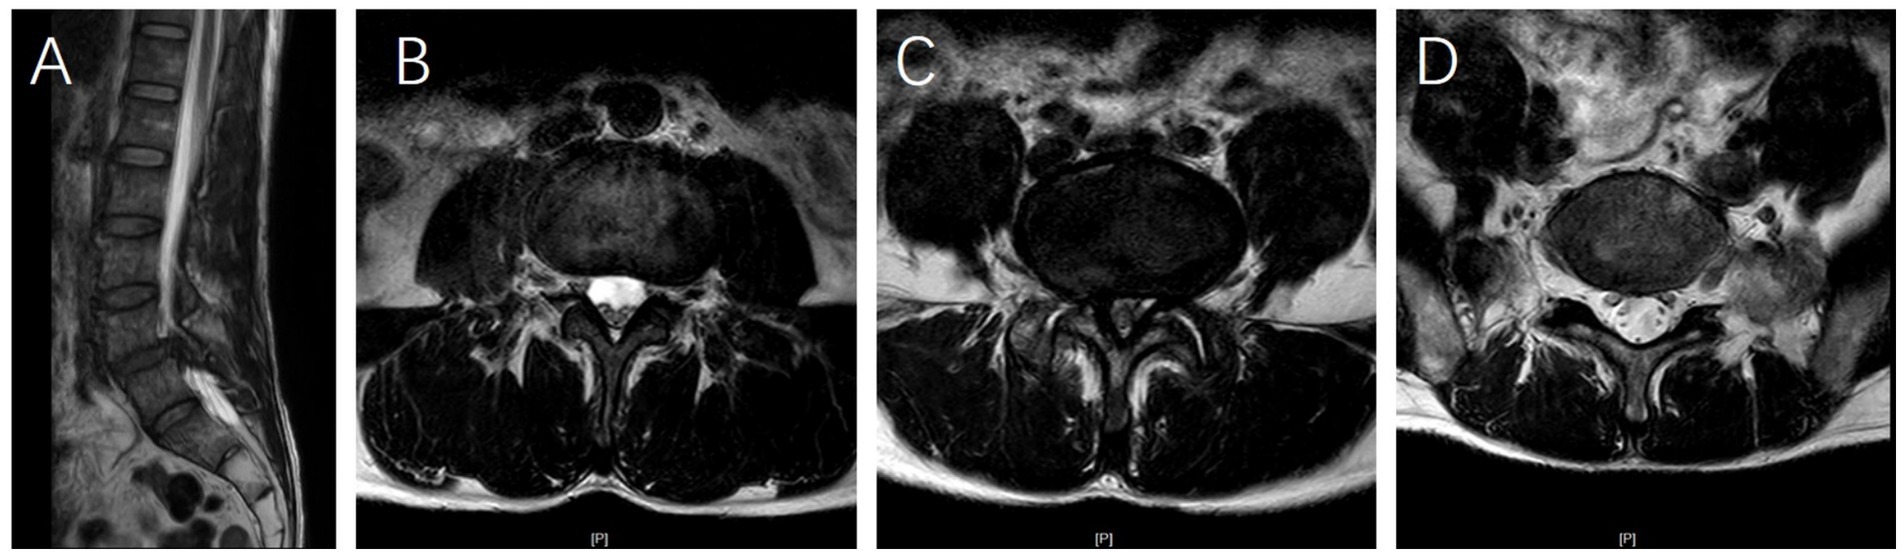
Figure 2. (A) Sagittal T2-weighted magnetic resonance imaging (MRI) of a 62-year-old female patient demonstrating L4 vertebral spondylolisthesis. (B–D) Axial T2-weighted MRI scans at the L3/4, L4/5, and L5/S1 levels reveal that multifidus muscle atrophy (MMA) is most severe at the L4/5 level compared to the L3/4 and L5/S1 levels, whereas the degree of MMA is similar between the L3/4 and L5/S1 levels.
3.4 Comparison of MMA in DLS patients with grade I and II
According to the Meyerding grading system, DLS patients are divided into Grade I and Grade II. No statistically significant differences were observed in the LCSA/GCSA of the multifidus muscle between patients with different grades of spondylolisthesis at the same segment (p > 0.05; Table 4).
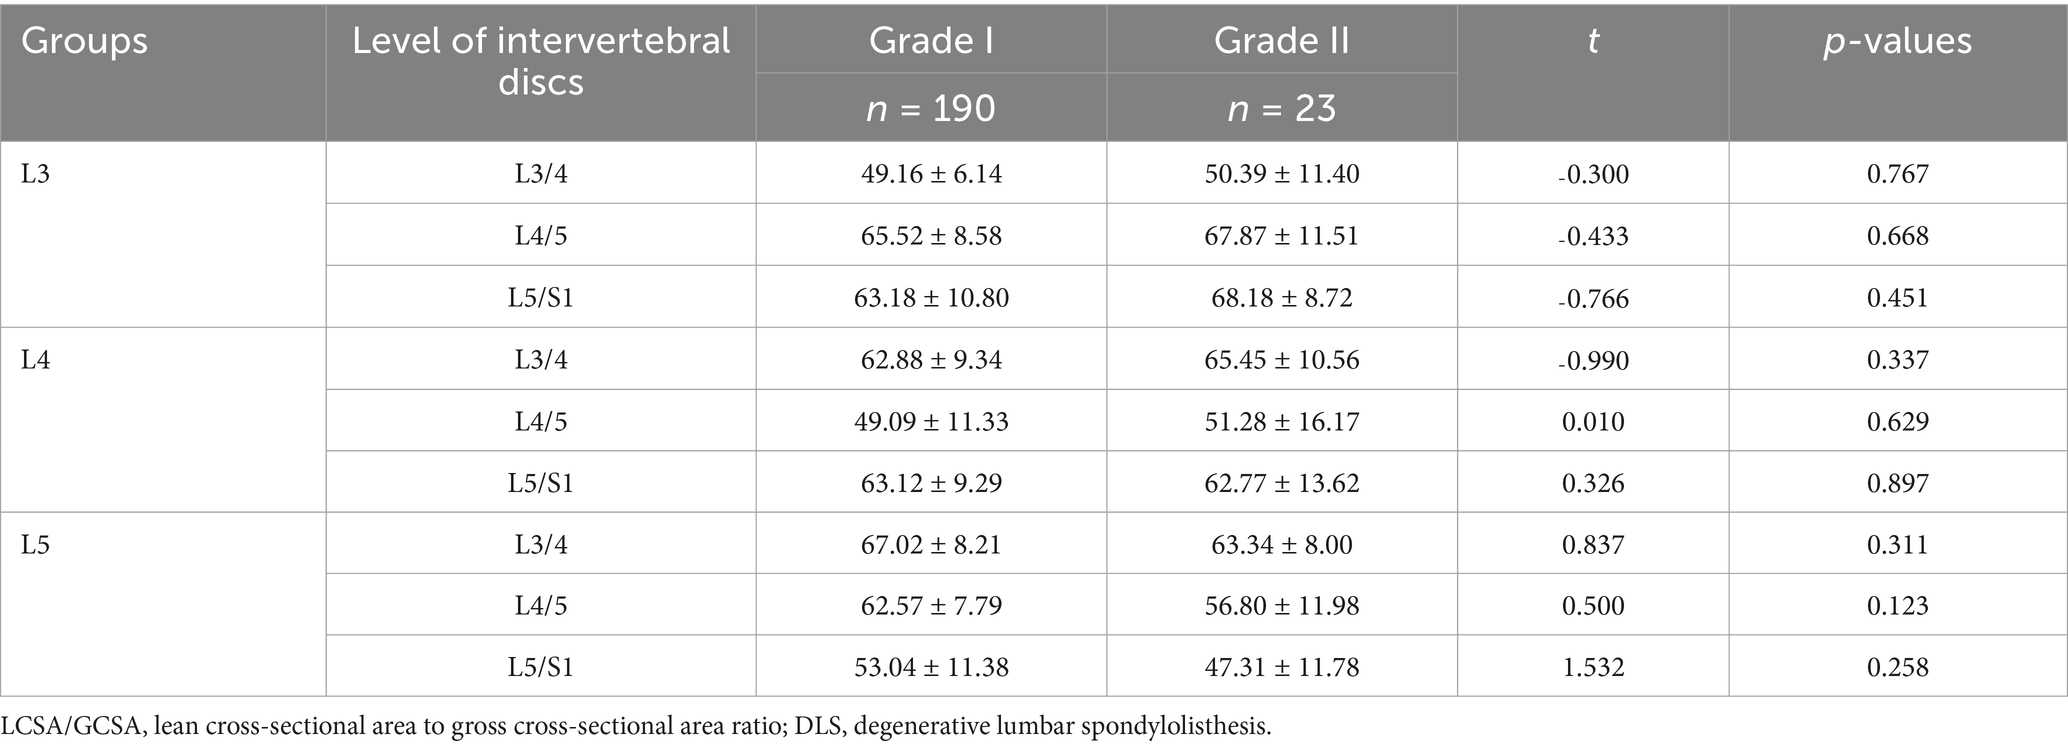
Table 4. Comparison of LCSA/GCSA between different grades of DLS at the same segment.
3.5 Comparison of the correlation between multifidus LCSA/GCSA in the spondylolisthesis and non-spondylolisthesis segments
In the L3 group, a weak positive correlation was observed between the L3/4 level and the L4/5 and L5/S1 levels (r = 0.357, p > 0.05; r = 0.078, p > 0.05). In the L4 group, a strong positive correlation was found between the L4/5 level and the L3/4 and L5/S1 levels (r = 0.686, p < 0.001; r = 0.744, p < 0.001). In the L5 group, a moderate positive correlation was identified between the L5/S1 level and the L3/4 and L4/5 levels (r = 0.482, p < 0.001; r = 0.448, p < 0.05; Table 5; Figure 3).

Table 5. Comparison of the correlation between multifidus LCSA/GCSA in the spondylolisthesis and non-spondylolisthesis segments.
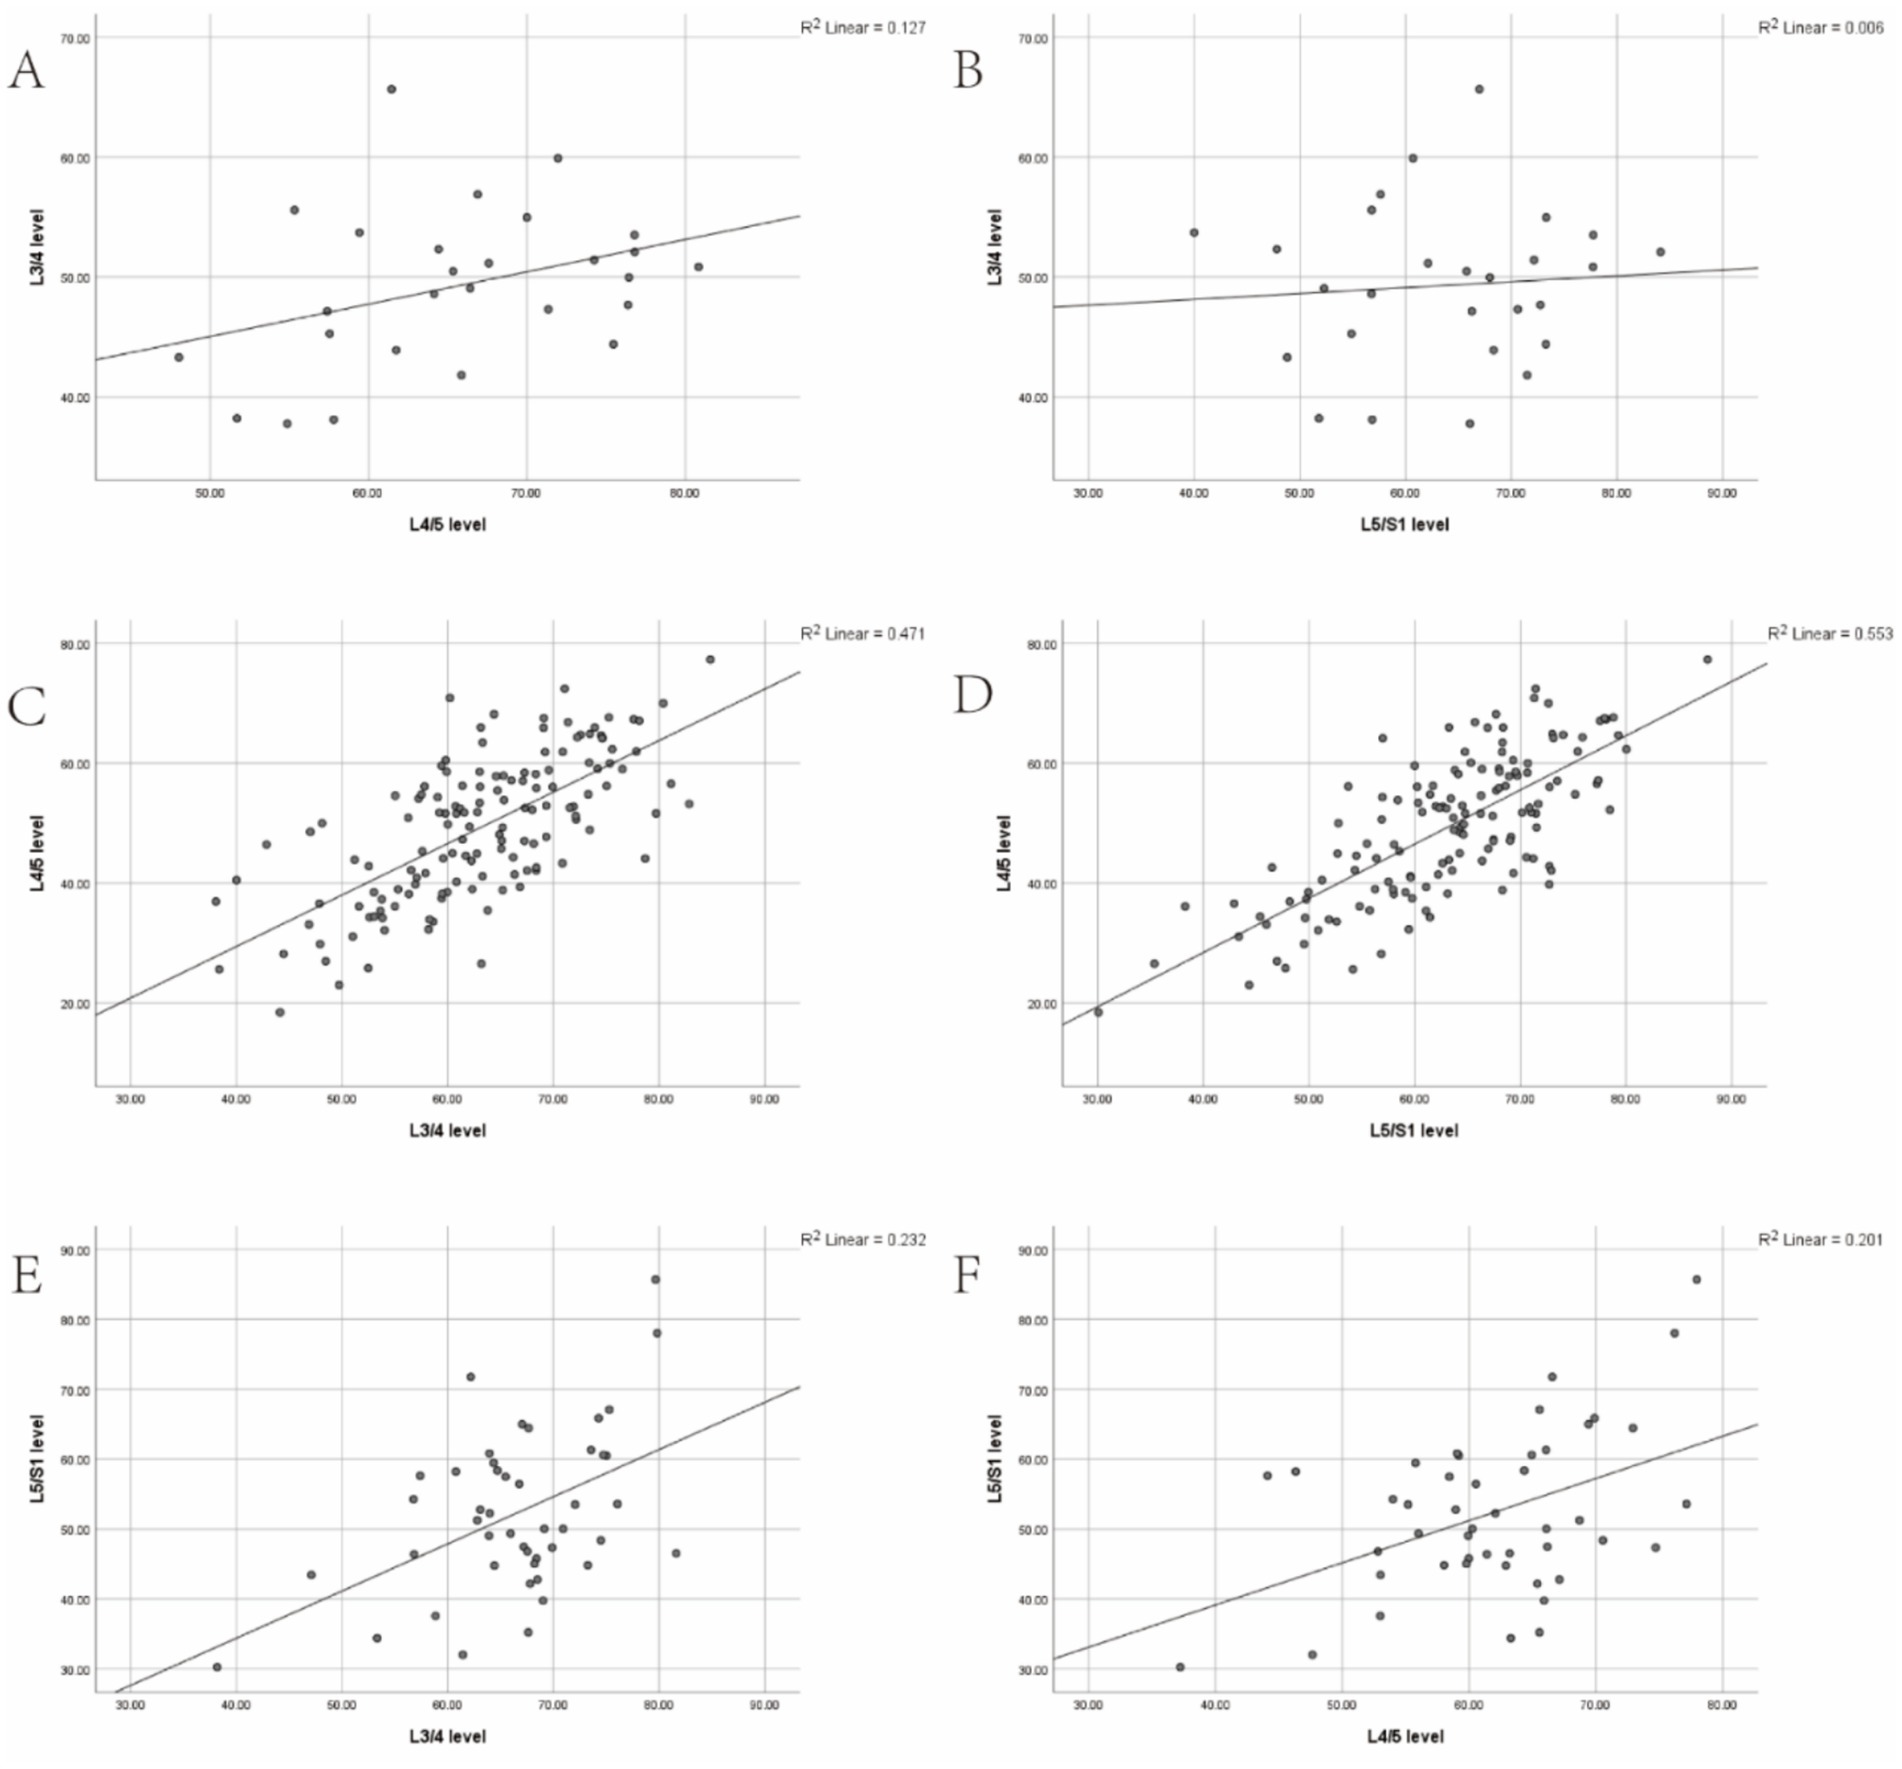
Figure 3. (A,B) Correlation between the degree of multifidus muscle atrophy (MMA) at the L3/4 level and the degree of MMA at the L4/5 and L5/S1 levels in the L3 group. (C,D) Correlation between the degree of MMA at the L4/5 level and the degree of MMA at the L3/4 and L5/S1 levels in the L3 group. (E,F) Correlation between the degree of MMA at the L5/S1 level and the degree of MMA at the L3/4 and L4/5 levels in the L3 group.
Scatter plots were constructed to illustrate the correlation trends of LCSA/GCSA between the spondylolisthesis and non-spondylolisthesis segments of the multifidus muscle in three groups, clearly depicting the strength of these correlations.
3.6 Correlation analysis of the degree of MMA with VAS scores for low back and leg pain and ODI scores
A significant negative correlation was observed between the degree of MMA and the VAS and ODI scores for low back pain across the three patient groups (r = ˗0.907, p < 0.001; r = ˗0.407, p < 0.05; r = ˗0.942, p < 0.001; r = ˗0.541, p < 0.001; r = ˗0.856, p < 0.001; r = ˗0.298, p < 0.05). However, no significant correlation was observed between MMA degree and the VAS score for leg pain (r = ˗0.078, p > 0.05; r = ˗0.045, p > 0.05; r = ˗0.124, p > 0.05). Similarly, in the general population, a significant negative correlation was observed between the degree of MMA and the VAS and ODI scores for low back pain (r = ˗0.927, p < 0.001; r = ˗0.474, p < 0.001), whereas no significant correlation was found with the VAS score for leg pain (r = ˗0.117, p > 0.05; Table 6).
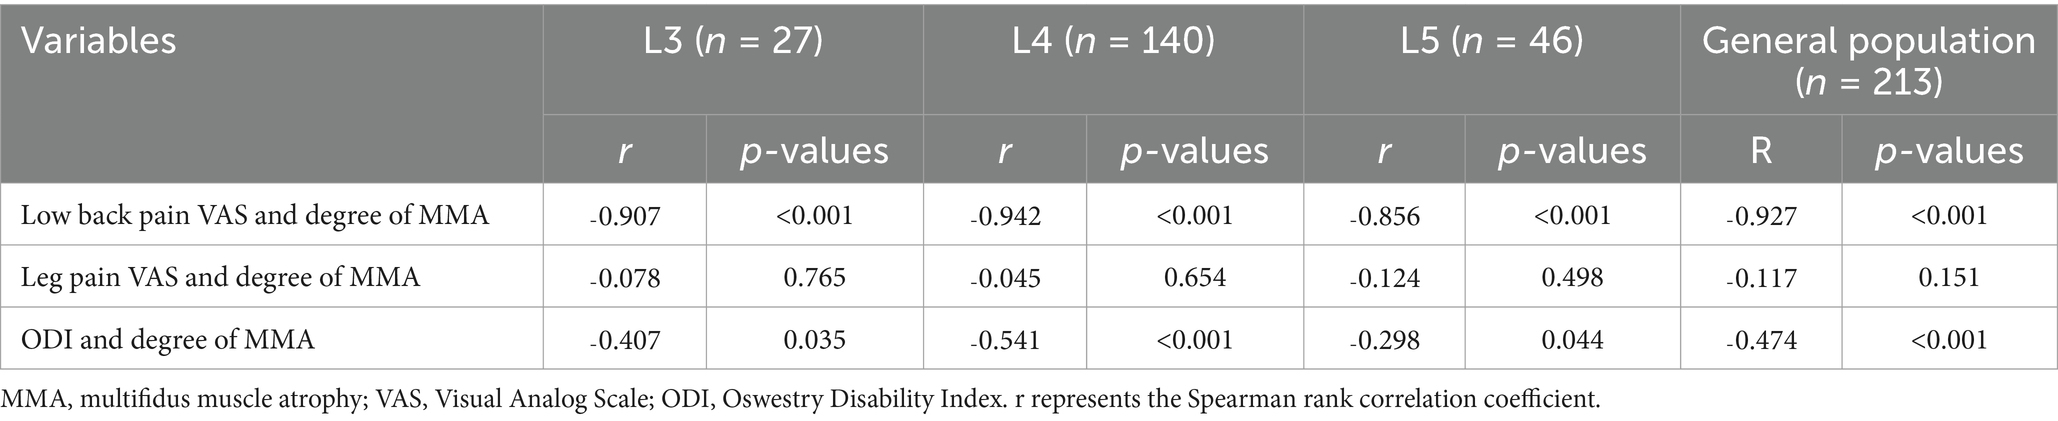
Table 6. Correlation analysis of the degree of MMA with preoperative VAS scores for low back and leg pain and ODI scores.
3.7 Correlation analysis of the degree of lumbar spondylolisthesis with VAS scores for low back and leg pain and ODI scores
Patients in the L3, L4, and L5 groups were classified into Grade I and Grade II lumbar spondylolisthesis according to the Meyerding classification. A comparison of VAS scores for low back pain between patients with Grade I and Grade II spondylolisthesis in each group exhibited no statistically significant differences (p > 0.05; Tables 7–9). However, comparisons of VAS scores for leg pain and ODI scores revealed statistically significant differences (p < 0.05; Tables 7–9).
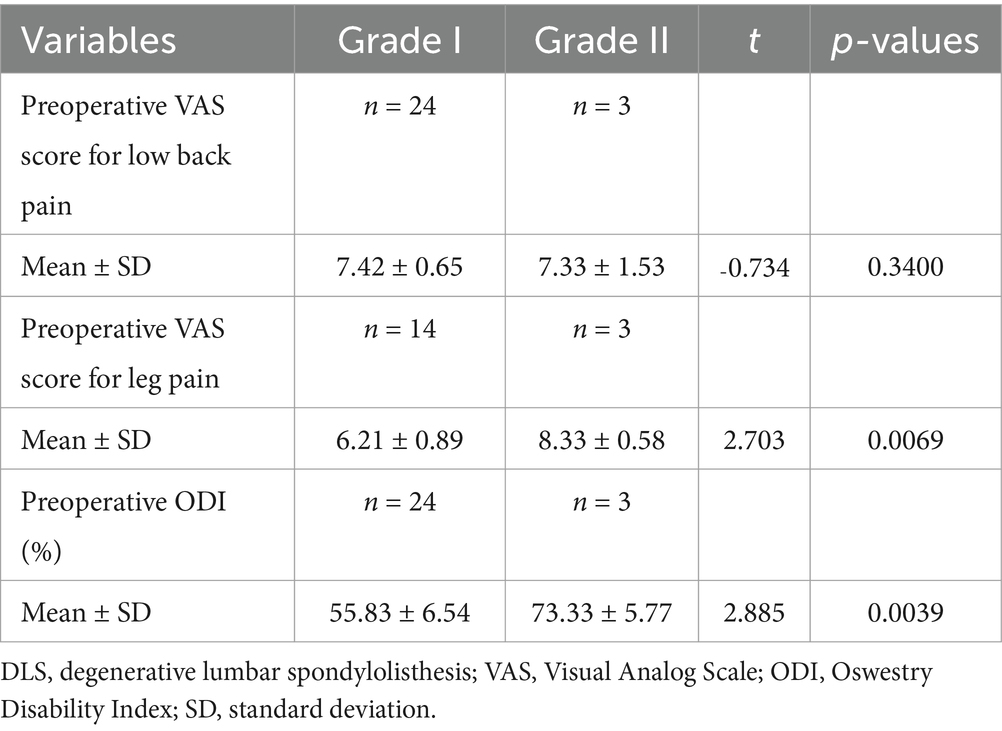
Table 7. Comparative analysis of different grades of DLS in the L3 segment with preoperative low back pain, leg pain, and ODI scores.
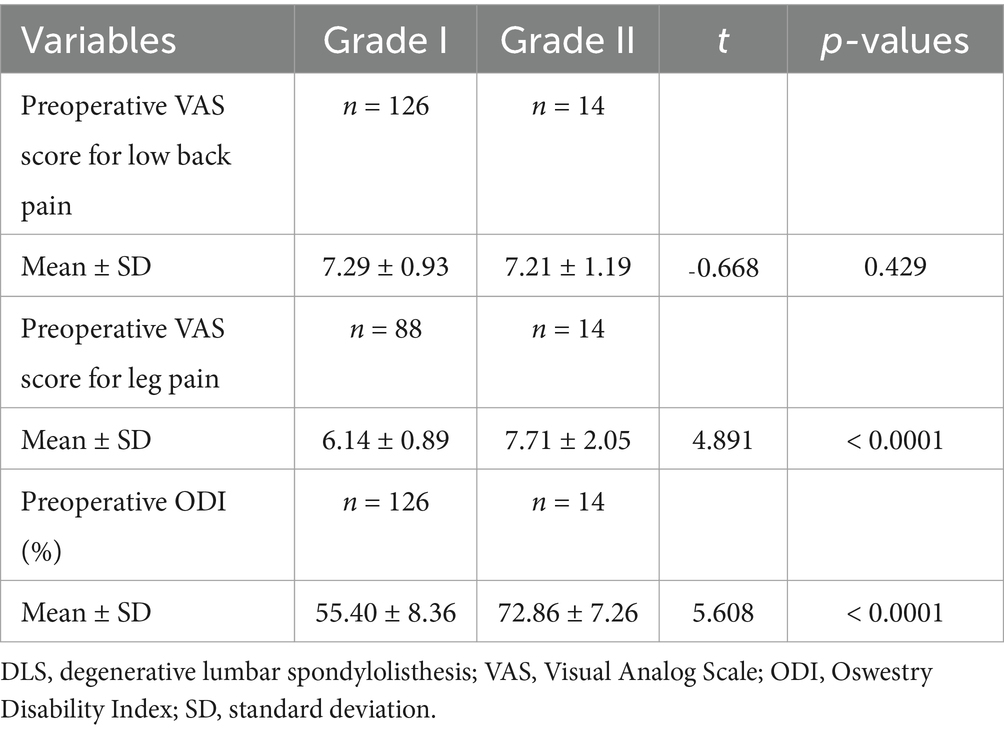
Table 8. Comparative analysis of different grades of DLS in the L4 segment with preoperative low back pain, leg pain, and ODI scores.
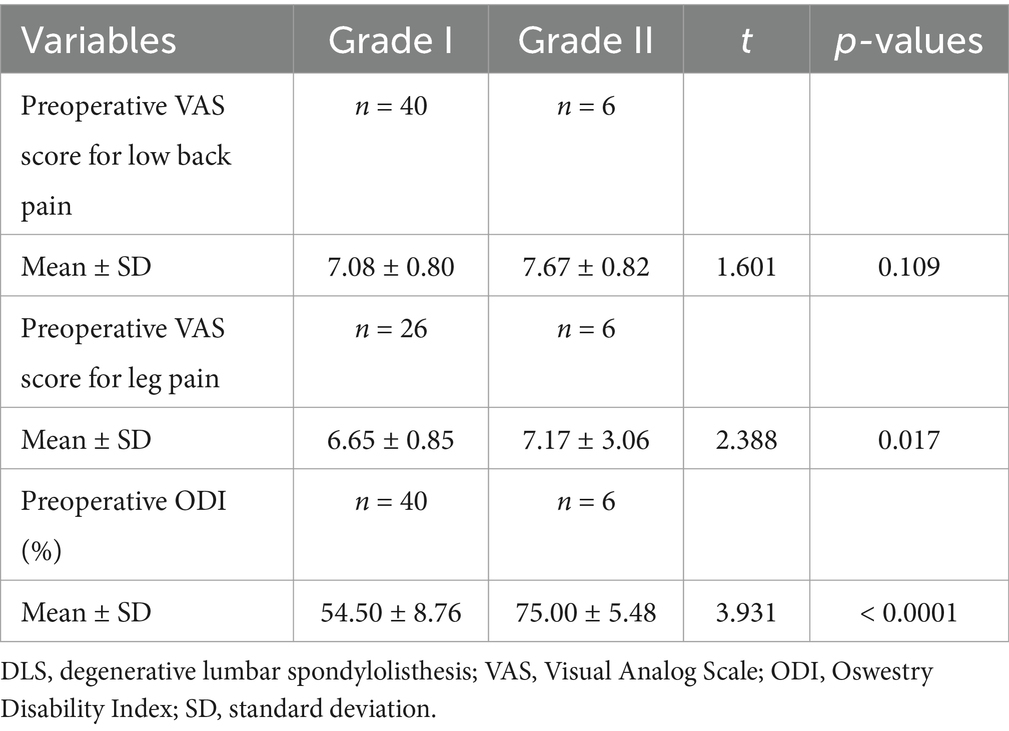
Table 9. Comparative analysis of different grades of DLS in the L5 segment with preoperative low back pain, leg pain, and ODI scores.
3.8 Comparison of laboratory test findings between the mild and severe groups
According to the Kjaer classification, patients were categorised into the Mild and Severe groups based on the degree of MMA. Univariate analysis revealed no statistically significant differences in laboratory test indicators between the Severe and Mild groups, including red blood cell count, haematocrit levels, haemoglobin levels, platelet count, prothrombin time, activated partial thromboplastin time, international normalised ratio, total protein, albumin, globulin, and the albumin-to-globulin ratio (p > 0.05; Table 10).
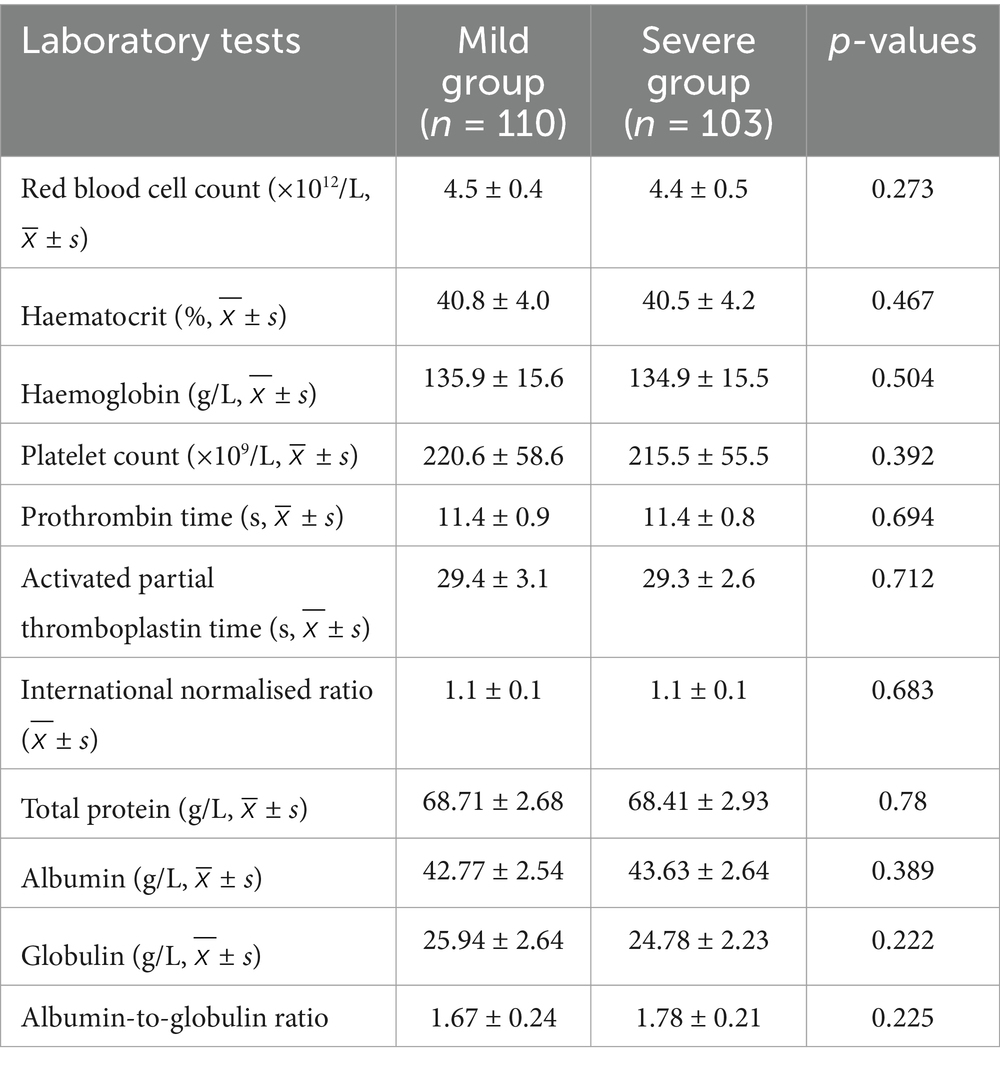
Table 10. Comparison of laboratory test indicators between the mild and severe groups.
3.9 Comparison of basic characteristics between patients with the mild and severe groups
Univariate risk factor analysis revealed no statistically significant differences in sex, hypertension, or diabetes mellitus between the Mild and Severe groups (Kjaer classification) (p > 0.05). However, age, BMI, and osteoporosis revealed statistically significant differences between the two groups (p < 0.05; Table 11).
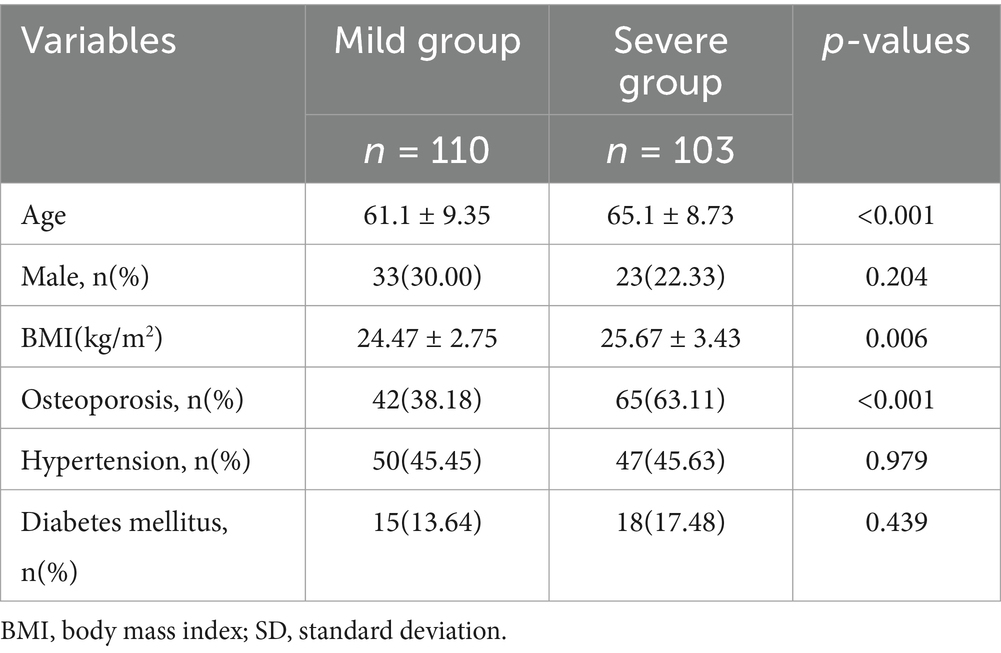
Table 11. Comparison of general characteristics between the Mild and Severe groups.
3.10 Multivariate logistic regression analysis of risk factors for MMA in DLS patients
Multivariate logistic regression analysis identified age (beta coefficient [B] = 1.246, odd ratio [OR] = 3.476, 95% confidence interval [CI] = 2.109–5.729), BMI (B = 0.740, OR = 2.096, 95% CI = 1.144–3.839), and osteoporosis (B = 0.041, OR = 1.042, 95% CI = 1.018–1.067) as significant risk factors for the exacerbation of MMA in DLS patients (p < 0.05; Table 12).
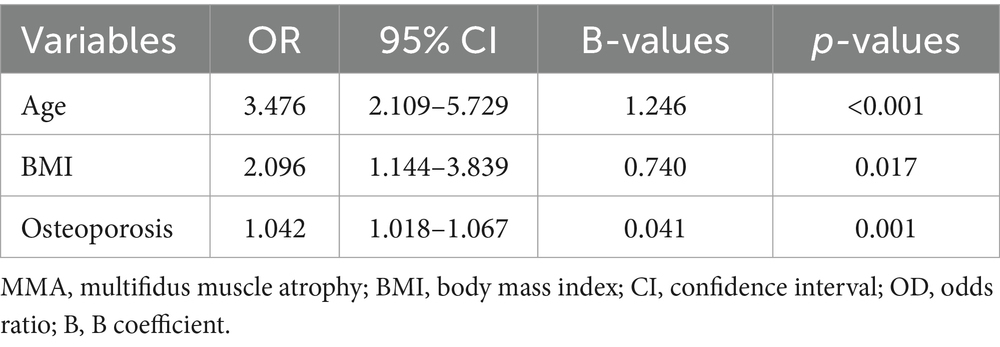
Table 12. Multivariate logistic regression analysis of risk factors for MMA exacerbation.
4 Discussion
The concept of MMA was first introduced by Mattila et al., who suggested a significant association with low back pain and lumbar disc herniation (19). DLS, a prevalent degenerative disease of the lumbar spine, is primarily attributed to diminished lumbar stability. This condition is characterised by low back pain due to vertebral spondylolisthesis and leg pain caused by nerve root compression. MMA is closely associated with vertebral spondylolisthesis, with patients experiencing low back pain exhibiting significant fat infiltration and multifidus muscle atrophy compared to healthy individuals (20). MRI of the lumbar spine frequently reveals pronounced MMA at the level of spondylolisthesis in DLS patients (21). Previous studies have demonstrated a correlation between MMA and facet joint hypertrophy, spinal stenosis, and lumbar spondylolisthesis (22).
To minimise the potential influence of low back pain on MMA, we recruited 20 healthy older adult volunteers as a control group. We compared the degree of MMA between DLS patients and the control group and found that MMA at the L3/4, L4/5, and L5/S1 segments was significantly more pronounced in DLS patients compared to the control group. This finding indicates that the multifidus muscle undergoes substantial atrophy in DLS patients. Furthermore, we analysed whether the degree of MMA differed between spondylolisthesis and non-spondylolisthesis segments across the three groups. Our findings demonstrated a significant increase in MMA in spondylolisthesis segments, confirming that these segments experience more severe atrophy. In addition, this deterioration appears to influence adjacent lumbar segments, exacerbating MMA progression. Previous studies have reported similar findings in patients with degenerative lumbar stenosis, demonstrating that MMA is more severe in affected segments compared to adjacent unaffected segments (23–25). These findings are consistent with our findings, which indicate that MMA increases with age and is significantly more pronounced in DLS patients, particularly in spondylolisthesis segments. Moreover, our findings revealed a positive correlation between MMA in spondylolisthesis and non-spondylolisthesis segments of the lumbar spine, indicating a broader impact of muscle atrophy beyond the directly affected regions.
In DLS, excessive motion in adjacent segments increases stress on the paravertebral muscles, leading to direct injury, particularly affecting the multifidus muscle. In addition, this process compromises the nerve supply to the paravertebral muscles, including the multifidus. The nerve branches pass through the fibrous tunnel formed by the ligamentum flavum, and lumbar spondylolisthesis, along with facet joint hypertrophy, exacerbate local muscle and nerve damage (26).
VAS and ODI scores are commonly used to evaluate low back pain severity and lumbar function in spinal disorders (27). In patients with degenerative lumbar scoliosis, MMA exhibits a significant positive correlation with VAS scores for low back pain and ODI scores for lumbar function, indicating that MMA significantly contributes to a decline in quality of life (28). In addition, improving MMA can lead to a significant reduction in VAS and ODI scores, enhancing patients’ quality of life. Several studies analysing the effects of unilateral multi-segmental minimally invasive interbody fusion on paravertebral muscles have found that a reduction in the LCSA is closely associated with postoperative VAS scores for low back pain (29, 30). However, no significant correlation has been observed between LCSA reduction and VAS scores for leg pain (31). These findings indicate that MMA is significantly associated with degenerative lumbar diseases and plays a crucial role in low back pain and lumbar dysfunction in DLS patients. Therefore, during lumbar spine surgery, surgeons need to utilise minimally invasive techniques that maximise the protection and preservation of multifidus muscle to reduce residual postoperative lower back pain.
Moreover, we analysed the correlation between the degree of MMA and the severity of DLS with low back pain and lumbar dysfunction. Our findings revealed that all three groups of spondylolisthesis patients experienced varying degrees of low back pain and referred pain in the lower limbs. A positive correlation was observed between the degree of MMA and low back pain and lumbar dysfunction; however, no correlation was observed with leg pain. Furthermore, when comparing Grade II spondylolisthesis to Grade I spondylolisthesis, no statistically significant differences were observed in VAS scores for low back pain. Conversely, statistically significant differences were observed in VAS scores for leg pain and dysfunction.
The causal relationship between DLS and MMA remains uncertain. It is widely believed that DLS leads to compression of the medial branch of the segmental nerve, which innervates and nourishes the multifidus muscle, resulting in denervation and subsequent atrophy (32). In DLS patients, the severity of MMA is closely associated with the degree of spondylolisthesis and is thought to contribute to disease progression (15). Several studies have demonstrated a positive correlation between the extent of MMA and the severity of lumbar spondylolisthesis in DLS patients (33, 34). Similar findings have been reported in patients with degenerative lumbar stenosis, where MMA is more pronounced in the degenerated segment than in adjacent normal segments (23). Guo et al. analysed risk factors for spondylolisthesis in 90 DLS patients and suggested that MMA contributes to lumbar instability, increasing the likelihood of vertebral slippage (35). However, the extent of MMA’s contribution relative to DLS among various risk factors remains unclear. MMA is considered a causative factor in spondylolisthesis, as it progressively worsens with age, leading to chronic low back pain, reduced spinal tension, and diminished control over external loads, resulting in lumbar instability (18). Several studies have suggested that DLS may contribute to MMA, suggesting that, in the early stages of lumbar spondylolisthesis, the paravertebral muscles compensate through hypertrophy to maintain lumbar stability. However, as the condition advances, these muscles may undergo atrophy due to decompensation (36, 37).
Therefore, the causal relationship between MMA and DLS remains unclear. Previous studies on their correlation indicate a lack of direct evidence to definitively establish a causal link between the two.
The precise etiological factors contributing to the development of MMA remain uncertain, impeding the implementation of effective early preventive strategies for DLS through MMA-targeted interventions. Consequently, the identification and mitigation of high-risk factors for MMA in DLS patients are of paramount clinical significance. We stratified patients into Mild and Severe MMA groups based on the Kjaer classification system (15) and conducted a retrospective analysis to delineate the independent risk factors for MMA in DLS. Our findings reveal that advanced age, elevated BMI, and osteoporosis are independently associated with the exacerbation of MMA in DLS patients.
Previous studies have established muscle atrophy as a primary determinant of diminished muscle strength, precipitating a cascade of functional imbalances within the musculoskeletal system (38–41). Notably, multifidus muscle quality declines progressively, with an estimated 1% annual reduction after the age of 40 (12, 13). Degenerative changes and fat infiltration in the multifidus muscle contribute to weakened voluntary contraction, leading to muscle atrophy and, ultimately, lumbar instability (14). These findings suggest that age is a significant contributor to MMA.
Comparative analyses of paravertebral muscle morphology between patients with lumbar spinal stenosis and asymptomatic middle-aged and older adult individuals have demonstrated age as a significant independent predictor of paravertebral muscle atrophy. Notably, the impact of age on muscle atrophy appears to be more pronounced in patients with lumbar spinal stenosis (42). Furthermore, studies investigating the correlation between back muscle characteristics and tenderness sensitivity in patients with low back pain have identified age as a critical factor contributing to fat infiltration within the multifidus muscle, leading to its atrophy (43).
MMA is characterised by an increase in fat infiltration. BMI, a well-established indicator of obesity, reflects a higher proportion of adipose tissue, which can contribute to increased fat infiltration in the muscles. We identified BMI as an independent risk factor for the exacerbation of MMA in DLS patients. Notably, patients in the Severe MMA group exhibited a higher BMI, suggesting that elevated BMI is linked to increased fat infiltration and more severe MMA.
Furthermore, a recent study revealed that higher BMI and vitamin D deficiency are significant risk factors for paravertebral muscle atrophy and low back pain in postmenopausal women, with both factors exerting a cumulative effect that worsens muscle atrophy and pain severity (44). In addition, Ogon et al. used MRI to analyse the factors influencing intracellular and extracellular lipid accumulation in multifidus fat infiltration among patients with chronic low back pain. Their findings indicate that higher BMI is associated with increased extracellular lipid infiltration, exacerbating MMA (45).
We identified osteoporosis as an independent risk factor for the progression of MMA in DLS patients. The presence of osteoporosis indicates a metabolic imbalance in the musculoskeletal system, which significantly increases the risk of MMA.
Lee et al. reported a significant association between multifidus fat infiltration and osteoporotic vertebral compression fractures. In addition, paravertebral muscle atrophy has been associated with the recurrence of acute osteoporotic vertebral compression fractures in patients following percutaneous vertebroplasty, emphasising the connection between muscle atrophy and osteoporosis-related fractures (46). In older women, both decreased bone density and paravertebral muscle atrophy are prevalent. Notably, individuals with reduced bone density have a 5.7-fold higher likelihood of developing paravertebral muscle atrophy, emphasising a significant association between bone loss and muscle degeneration (47, 48).
5 Conclusion
DLS patients experience MMA, which is more pronounced at the spondylolisthesis segment. The severity of MMA exhibits a positive correlation with VAS scores for low back pain and ODI, but is not associated with VAS scores for leg pain. Compared to Grade I lumbar spondylolisthesis, Grade II does not show a significant difference in MMA severity or low back pain VAS scores; however, patients experience more severe leg pain and lumbar dysfunction. In addition, age, BMI, and osteoporosis are independent risk factors for MMA progression in DLS patients. Clinically, patients with these risk factors require careful monitoring, and effective prevention and treatment strategies should be actively implemented, including back muscle strengthening exercises, weight management, and anti-osteoporosis therapy.
Data availability statement
The original contributions presented in the study are included in the article/supplementary material, further inquiries can be directed to the corresponding author.
Ethics statement
The studies involving humans were approved by the Ethical Committee of the Zhongda Hospital, Southeast University. The studies were conducted in accordance with the local legislation and institutional requirements. The participants provided their written informed consent to participate in this study.
Author contributions
CZ: Conceptualization, Data curation, Formal analysis, Funding acquisition, Investigation, Methodology, Software, Visualization, Writing – original draft, Writing – review & editing. RS: Writing – review & editing. XW: Resources, Supervision, Writing – review & editing. XS: Data curation, Formal analysis, Project administration, Supervision, Writing – review & editing.
Funding
The author(s) declare that financial support was received for the research and/or publication of this article. The research was supported by grants from the National Natural Science Foundation of China (82202768), Zhongda Hospital Affiliated to Southeast University, Jiangsu Province High-Level Hospital Construction Funds (GSP-LCYJFH20), the Fundamental Research Funds for the Central Universities (2242020 K40156), Open Project Programme of the Key Base for Standardised Training for General Physicans, Zhongda Hospital, Southeast University (ZDZYJD-QK-2022-16), Jiangsu Entrepreneurship and Innovation Doctors (202030338).
Conflict of interest
The authors declare that the research was conducted in the absence of any commercial or financial relationships that could be construed as a potential conflict of interest.
Generative AI statement
The author(s) declare that no Gen AI was used in the creation of this manuscript.
Publisher’s note
All claims expressed in this article are solely those of the authors and do not necessarily represent those of their affiliated organizations, or those of the publisher, the editors and the reviewers. Any product that may be evaluated in this article, or claim that may be made by its manufacturer, is not guaranteed or endorsed by the publisher.
References
1. Sengupta, DK, and Herkowitz, HN. Degenerative spondylolisthesis: review of current trends and controversies. Spine (Phila Pa 1976). (2005) 30:S71–81. doi: 10.1097/01.brs.0000155579.88537.8e
2. Rangwalla, K, Filley, A, El Naga, A, Gendelberg, D, Baldwin, A, Maziad, A, et al. Degenerative lumbar spondylolisthesis: review of current classifications and proposal of a novel classification system. Eur Spine J. (2024) 33:1762–72. doi: 10.1007/s00586-023-07818-x
3. Gadjradj, PS, Basilious, M, Goldberg, JL, Sommer, F, Navarro-Ramirez, R, Mykolajtchuk, C, et al. Decompression alone versus decompression with fusion in patients with lumbar spinal stenosis with degenerative spondylolisthesis: a systematic review and meta-analysis. Eur Spine J. (2023) 32:1054–67. doi: 10.1007/s00586-022-07507-1
4. Singh, G, Sembrano, JN, Haselhuhn, JJ, and Polly, DW Jr. Lumbar degenerative spondylolisthesis: role of sagittal alignment. Spine Deform. (2024) 12:443–9. doi: 10.1007/s43390-023-00788-6
5. Liu, Y, Liu, Y, Hai, Y, Li, G, Liu, T, and Wang, Y. Lumbar lordosis reduction and disc bulge may correlate with multifidus muscle fatty infiltration in patients with single-segment degenerative lumbar spinal stenosis. Clin Neurol Neurosurg. (2020) 189:105629. doi: 10.1016/j.clineuro.2019.105629
6. Shah, J, Tanwar, T, Iram, I, Aldabbas, M, and Veqar, Z. Effect of increased lumbar lordosis on lumbar multifidus and longissimus Thoracis activation during quadruped exercise in patients with chronic low Back pain: an EMG study. J Appl Biomech. (2020) 36:436–43. doi: 10.1123/jab.2020-0040
7. Moseley, GL, Hodges, PW, and Gandevia, SC. Deep and superficial fibers of the lumbar multifidus muscle are differentially active during voluntary arm movements. Spine (Phila Pa 1976). (2002) 27:E29–36. doi: 10.1097/00007632-200201150-00013
8. Nizard, RS, Wybier, M, and Laredo, JD. Radiologic assessment of lumbar intervertebral instability and degenerative spondylolisthesis. Radiol Clin North Am. (2001) 39:55–71. doi: 10.1016/S0033-8389(05)70263-3
9. Fortin, M, and Macedo, LG. Multifidus and paraspinal muscle group cross-sectional areas of patients with low back pain and control patients: a systematic review with a focus on blinding. Phys Ther. (2013) 93:873–88. doi: 10.2522/ptj.20120457
10. James, G, Ahern, BJ, Goodwin, W, Goss, B, and Hodges, PW. Targeted multifidus muscle activation reduces fibrosis of multifidus muscle following intervertebral disc injury. Eur Spine J. (2024) 33:2166–78. doi: 10.1007/s00586-024-08234-5
11. Wang, B, Xu, L, Teng, P, Nie, L, and Yue, H. The effect of lumbar multifidus muscle degeneration on upper lumbar disc herniation. Front Surg. (2024) 11:1323939. doi: 10.3389/fsurg.2024.1323939
12. Cheung, KM, Karppinen, J, Chan, D, Ho, DW, Song, YQ, Sham, P, et al. Prevalence and pattern of lumbar magnetic resonance imaging changes in a population study of one thousand forty-three individuals. Spine (Phila Pa 1976). (2009) 34:934–40. doi: 10.1097/BRS.0b013e3181a01b3f
13. Okada, E, Matsumoto, M, Ichihara, D, Chiba, K, Toyama, Y, Fujiwara, H, et al. Cross-sectional area of posterior extensor muscles of the cervical spine in asymptomatic subjects: a 10-year longitudinal magnetic resonance imaging study. Eur Spine J. (2011) 20:1567–73. doi: 10.1007/s00586-011-1774-x
14. Visser, M, Goodpaster, BH, Kritchevsky, SB, Newman, AB, Nevitt, M, Rubin, SM, et al. Muscle mass, muscle strength, and muscle fat infiltration as predictors of incident mobility limitations in well-functioning older persons. J Gerontol A Biol Sci Med Sci. (2005) 60:324–33. doi: 10.1093/gerona/60.3.324
15. Kjaer, P, Bendix, T, Sorensen, JS, Korsholm, L, and Leboeuf-Yde, C. Are MRI-defined fat infiltrations in the multifidus muscles associated with low back pain? BMC Med. (2007) 5:2. doi: 10.1186/1741-7015-5-2
16. Meyerding, HW. Spondylolisthesis; surgical fusion of lumbosacral portion of spinal column and interarticular facets; use of autogenous bone grafts for relief of disabling backache. J Int Coll Surg. (1956) 26:566–91.
17. Niemelainen, R, Briand, MM, and Battie, MC. Substantial asymmetry in paraspinal muscle cross-sectional area in healthy adults questions its value as a marker of low back pain and pathology. Spine (Phila Pa 1976). (2011) 36:2152–7. doi: 10.1097/BRS.0b013e318204b05a
18. Wang, G, Karki, SB, Xu, S, Hu, Z, Chen, J, Zhou, Z, et al. Quantitative MRI and X-ray analysis of disc degeneration and paraspinal muscle changes in degenerative spondylolisthesis. J Back Musculoskelet Rehabil. (2015) 28:277–85. doi: 10.3233/BMR-140515
19. Mattila, M, Hurme, M, Alaranta, H, Paljärvi, L, Kalimo, H, Falck, B, et al. The multifidus muscle in patients with lumbar disc herniation. Histochem Morphometric Analysis Intraoperative Biopsies Spine. (1986) 11:732–8.
20. Wang, Z, Tian, Y, Li, C, Li, D, Ibrahim, Y, Yuan, S, et al. Radiographic risk factors for degenerative lumbar spondylolisthesis: a comparison with healthy control subjects. Front Surg. (2022) 9:956696. doi: 10.3389/fsurg.2022.956696
21. Guven, AE, Schönnagel, L, Chiapparelli, E, Camino-Willhuber, G, Zhu, J, Caffard, T, et al. Relationship between lumbar foraminal stenosis and multifidus muscle atrophy - a retrospective cross-sectional study. Spine (Phila Pa 1976). (2024) 50:702–706. doi: 10.1097/BRS.0000000000005113
22. Kalichman, L, Hodges, P, Li, L, Guermazi, A, and Hunter, DJ. Changes in paraspinal muscles and their association with low back pain and spinal degeneration: CT study. Eur Spine J. (2010) 19:1136–44. doi: 10.1007/s00586-009-1257-5
23. Xia, G, Li, X, Shang, Y, Fu, B, Jiang, F, Liu, H, et al. Correlation between severity of spinal stenosis and multifidus atrophy in degenerative lumbar spinal stenosis. BMC Musculoskelet Disord. (2021) 22:536. doi: 10.1186/s12891-021-04411-5
24. Schönnagel, L, Zhu, J, Camino-Willhuber, G, Guven, AE, Tani, S, Caffard, T, et al. Relationship between lumbar spinal stenosis and axial muscle wasting. Spine J. (2024) 24:231–8. doi: 10.1016/j.spinee.2023.09.020
25. Minetama, M, Kawakami, M, Nakatani, T, Teraguchi, M, Nakagawa, M, Yamamoto, Y, et al. Lumbar paraspinal muscle morphology is associated with spinal degeneration in patients with lumbar spinal stenosis. Spine J. (2023) 23:1630–40. doi: 10.1016/j.spinee.2023.06.398
26. Bierry, G, Kremer, S, Kellner, F, Abu Eid, M, Bogorin, A, and Dietemann, JL. Disorders of paravertebral lumbar muscles: from pathology to cross-sectional imaging. Skeletal Radiol. (2008) 37:967–77. doi: 10.1007/s00256-008-0494-8
27. Meng, H, Su, N, Lin, J, and Fei, Q. Comparative efficacy of unilateral biportal endoscopy and micro-endoscopic discectomy in the treatment of degenerative lumbar spinal stenosis: a systematic review and meta-analysis. J Orthop Surg Res. (2023) 18:814. doi: 10.1186/s13018-023-04322-2
28. Tang, Y, Yang, S, Chen, C, Luo, K, Chen, Y, Wang, D, et al. Assessment of the association between paraspinal muscle degeneration and quality of life in patients with degenerative lumbar scoliosis. Exp Ther Med. (2020) 20:505–11. doi: 10.3892/etm.2020.8682
29. Hoffmann, CH, and Kandziora, F. Minimally invasive transforaminal lumbar interbody fusion. Oper Orthop Traumatol. (2020) 32:180–91. doi: 10.1007/s00064-020-00660-0
30. Kim, DC, Laskay, N, Alcala, C, and Schwender, J. Minimally invasive decompression with noninstrumented facet fusion versus minimally invasive Transforaminal lumbar Interbody fusion for stenosis associated with grade 1 lumbar degenerative spondylolisthesis. Clin Spine Surg. (2023) 36:E416–e422. doi: 10.1097/BSD.0000000000001473
31. Yoo, JS, Min, SH, Yoon, SH, and Hwang, CH. Paraspinal muscle changes of unilateral multilevel minimally invasive transforaminal interbody fusion. J Orthop Surg Res. (2014) 9:130. doi: 10.1186/s13018-014-0130-3
32. Franke, J, Hesse, T, Tournier, C, Schuberth, W, Mawrin, C, LeHuec, JC, et al. Morphological changes of the multifidus muscle in patients with symptomatic lumbar disc herniation. J Neurosurg Spine. (2009) 11:710–4. doi: 10.3171/2009.7.SPINE08448
33. Chen, WY, Wang, K, Yuan, WA, and Zhan, HS. Relationship between lumbosacral multifidus muscle and lumbar disc herniation. Zhongguo Gu Shang. (2016) 29:581–4. doi: 10.3969/j.issn.1003-0034.2016.06.021
34. James, G, Stecco, C, Blomster, L, Hall, L, Schmid, AB, Shu, CC, et al. Muscle spindles of the multifidus muscle undergo structural change after intervertebral disc degeneration. Eur Spine J. (2022) 31:1879–88. doi: 10.1007/s00586-022-07235-6
35. Guo, M, Kong, C, Sun, S, Sun, X, Li, X, and Lu, S. Predictors of L4-L5 degenerative lumbar spondylolisthesis: L4 inclination angle and facet joint angle. World Neurosurg. (2019) 130:e680–6. doi: 10.1016/j.wneu.2019.06.188
36. He, K, Head, J, Mouchtouris, N, Hines, K, Shea, P, Schmidt, R, et al. The implications of paraspinal muscle atrophy in low back pain, thoracolumbar pathology, and clinical outcomes after spine surgery: a review of the literature. Glob Spine J. (2020) 10:657–66. doi: 10.1177/2192568219879087
37. Cao, B, Zuo, Y, Xu, Y, Wu, F, Du, H, Hou, Y, et al. Correlation between fat infiltration of paraspinal muscle and L4 degenerative lumbar spondylolisthesis in asymptomatic adults. Asian J Surg. (2023) 46:834–40. doi: 10.1016/j.asjsur.2022.08.097
38. Ikeda, S, Tsumura, H, and Torisu, T. Age-related quadriceps-dominant muscle atrophy and incident radiographic knee osteoarthritis. J Orthop Sci. (2005) 10:121–6. doi: 10.1007/s00776-004-0876-2
39. Frontera, WR, Hughes, VA, Lutz, KJ, and Evans, WJ. A cross-sectional study of muscle strength and mass in 45- to 78-yr-old men and women. J Appl Physiol. (1991) 71:644–50.
40. Landers, KA, Hunter, GR, Wetzstein, CJ, Bamman, MM, and Weinsier, RL. The interrelationship among muscle mass, strength, and the ability to perform physical tasks of daily living in younger and older women. J Gerontol A Biol Sci Med Sci. (2001) 56:B443–8. doi: 10.1093/gerona/56.10.B443
41. Newman, AB, Haggerty, CL, Goodpaster, B, Harris, T, Kritchevsky, S, Nevitt, M, et al. Strength and muscle quality in a well-functioning cohort of older adults: the Health, Aging and Body Composition study. J Am Geriatr Soc. (2003) 51:323–30. doi: 10.1046/j.1532-5415.2003.51105.x
42. Wang, W, Guo, Y, Li, W, and Chen, Z. The difference of paraspinal muscle between patients with lumbar spinal stenosis and normal middle-aged and elderly people, studying by propensity score matching. Front Endocrinol (Lausanne). (2022) 13:1080033. doi: 10.3389/fendo.2022.1080033
43. Goubert, D, Meeus, M, Willems, T, De Pauw, R, Coppieters, I, Crombez, G, et al. The association between back muscle characteristics and pressure pain sensitivity in low back pain patients. Scand J Pain. (2018) 18:281–93. doi: 10.1515/sjpain-2017-0142
44. Chen, H, Xu, HW, Zhang, SB, Yi, YY, and Wang, SJ. Vitamin D inadequacy combined with high BMI affects paraspinal muscle atrophy and pain intensity in postmenopausal women. Climacteric. (2022) 25:376–82. doi: 10.1080/13697137.2021.1990257
45. Ogon, I, Takebayashi, T, Takashima, H, Morita, T, Yoshimoto, M, Terashima, Y, et al. Quantitative analysis concerning atrophy and fat infiltration of the multifidus muscle with magnetic resonance spectroscopy in chronic low Back pain. Spine Surg Relat Res. (2019) 3:163–70. doi: 10.22603/ssrr.2018-0023
46. Lee, DG, and Bae, JH. Fatty infiltration of the multifidus muscle independently increases osteoporotic vertebral compression fracture risk. BMC Musculoskelet Disord. (2023) 24:508. doi: 10.1186/s12891-023-06640-2
47. Ekin, EE, and Altunrende, ME. The association of reduced bone density with paraspinal muscle atrophy and adipose tissue in geriatric patients: a cross-sectional CT study. Turk J Med Sci. (2019) 49:538–42. doi: 10.3906/sag-1809-48
Keywords: degenerative lumbar spondylolisthesis, osteoporosis, multifidus muscle atrophy, paraspinal muscles, fat infiltration
Citation: Zhang C, Sun R, Wu X and Sun X (2025) Correlation and risk factor analysis of multifidus muscle atrophy in degenerative lumbar spondylolisthesis. Front. Med. 12:1609660. doi: 10.3389/fmed.2025.1609660
Edited by:
Martha Cecilia Castano-Betancourt, Faculdade de Medicina de Jundiai, BrazilReviewed by:
Junhao Chen, The Second Affiliated Hospital of Kunming Medical University, ChinaGerardo Gomez-Castro, Instituto Nacional de Neurología y Neurocirugía “Manuel Velasco Suárez”, Mexico
Copyright © 2025 Zhang, Sun, Wu and Sun. This is an open-access article distributed under the terms of the Creative Commons Attribution License (CC BY). The use, distribution or reproduction in other forums is permitted, provided the original author(s) and the copyright owner(s) are credited and that the original publication in this journal is cited, in accordance with accepted academic practice. No use, distribution or reproduction is permitted which does not comply with these terms.
*Correspondence: Xiaozhi Sun, c3h6MzExQDEyNi5jb20=