Abstract
Background:
The systemic immune-inflammation index (SII) has been associated with various diseases, but its relationship with latent tuberculosis infection (LTBI) remains unclear. This study aimed to evaluate the association between SII and LTBI in United States adults.
Methods:
Data were obtained from the National Health and Nutrition Examination Survey (NHANES) 1999–2000 and 2011–2012 cycles. LTBI was defined as a positive result on either the QuantiFERON®-TB Gold In-Tube (QFT-GIT) assay or the tuberculin skin test (TST). SII was calculated based on neutrophil, platelet, and lymphocyte counts. All analyses were performed using complex survey design and sampling weights. Multivariable logistic regression models were applied to evaluate the association between SII and LTBI. SII was also analyzed in quartiles to assess trends. Restricted cubic spline (RCS) was employed to explore the potential non-linear associations. Subgroup analyses were conducted to assess whether the association varied across demographic and clinical strata.
Results:
A total of 9,489 participants were included, among whom 1,068 were identified with LTBI. Multivariable logistic regression demonstrated that SII was inversely associated with LTBI. For each 100-unit increase in SII, the odds of LTBI decreased by 6% (adjusted OR = 0.94, 95% CI: 0.90–0.97). When analyzed by quartiles, participants in the highest quartile had significantly lower odds of LTBI compared to those in the lowest quartile (adjusted OR = 0.58, 95% CI: 0.41–0.81), with a significant trend across quartiles (P for trend = 0.003). RCS showed a linear relationship between SII/100 and LTBI (P for non-linearity >0.05). The results of further subgroups analysis were consistent, with a significant interaction observed only for HIV status (P for interaction = 0.034).
Conclusion:
SII was inversely associated with LTBI and may serve as a readily accessible marker for LTBI risk stratification. Given its non-specific nature, further longitudinal studies are needed to validate its clinical and public health utility.
1 Introduction
Tuberculosis (TB) is an infectious disease that is widespread worldwide, caused by the bacterium Mycobacterium tuberculosis (Mtb), and poses a significant risk to human health. The World Health Organization (WHO) estimates that around 10.6 million people were infected with TB across the globe in 2021, with approximately 1.6 million reported deaths (1). In efforts to prevent and control TB, latent tuberculosis infection (LTBI) is an essential aspect that should not be ignored (2). LTBI signifies the existence of a sustained immune response within the body after being infected with Mtb, despite the lack of clinical symptoms or imaging abnormalities (3). It is estimated that nearly 30% of individuals who come into contact with Mtb will develop LTBI, and among these, 5% to 10% may progress to active TB within a few years after the initial infection (4). Therefore, effective identification and management of LTBI are crucial for diminishing the transmission and incidence of TB (5).
In recent years, the importance of the Systemic Immune-Inflammation Index (SII) in diagnosing, prognostic assessment, and monitoring disease progression across various medical conditions has gained increasing recognition (6–8). The SII is a comprehensive tool used to evaluate inflammation, derived from standard peripheral blood test parameters. The formula for calculating SII is as follows: SII = (neutrophil count × platelet count)/lymphocyte count, a method initially introduced by Hu et al. in 2014 (9). This index integrates neutrophils, platelets, and lymphocytes, which are key cellular components of the immune response, and functions as a novel biomarker indicative of systemic immune and inflammatory status (10). Tuberculosis, an inflammatory disease caused by Mtb infection, is characterized by a complex immune response (11). Given this, the link between SII and tuberculosis has garnered attention. Yu et al. found that the SII was significantly elevated in patients with active pulmonary tuberculosis compared to those with non-tuberculous pulmonary diseases (12). However, no studies have yet investigated the specific relationship between SII and LTBI. Consequently, this study utilized the National Health and Nutrition Examination Survey (NHANES) database to explore the connection between SII and LTBI, providing valuable insights into the health status of United States individuals.
2 Materials and methods data source
2.1 Study design and participants
The National Health and Nutrition Examination Survey (NHANES) serves as a crucial, ongoing evaluation of the health and nutritional conditions of the United States population. Our analysis used publicly available cross-sectional NHANES data, with sampling weights applied to account for the complex survey design. For detailed information on the NHANES methodology and updates, visit http://www.cdc.gov/nchs/nhanes/index.htm (accessed on 15 April 2025). Before data collection commenced, the study protocols were reviewed and approved by the ethical review board of the National Center for Health Statistics, ensuring that all participants were thoroughly informed and provided written consent for participation. Our analysis included individuals aged 18 and older who completed an interview, excluding those with missing data regarding SII or LTBI status.
2.2 SII measurement
Blood samples were collected at the Mobile Examination Center (MEC), where complete blood count (CBC) tests, including lymphocyte, segmented neutrophil, and platelet counts, were conducted using the Beckman Coulter® HMX on EDTA-anticoagulated blood. The counts for neutrophils, lymphocytes, and platelets were recorded as × 103 cells/μL. SII was calculated by multiplying the platelet count by the neutrophil count divided by the lymphocyte count (9).
2.3 LTBI measurement
In this study, LTBI was defined as a positive result on either the QuantiFERON®-TB Gold In-Tube (QFT-GIT) assay or/and the tuberculin skin test (TST) (13, 14). Data from the 1999–2000 and 2011–2012 NHANES cycles were included, as TST was conducted in both cycles and QFT-GIT was available in the 2011–2012 cycle. The QFT-GIT is an in vitro diagnostic test that measures interferon-gamma (IFN-γ) release in response to TB-specific antigens (15). Whole blood was collected into Nil, TB Antigen, and Mitogen tubes, incubated at 37°C ± 1°C for 16–24 h, and IFN-γ concentrations were quantified by enzyme-linked immunosorbent assay (ELISA). A result was considered positive if the IFN-γ level in the TB Antigen tube exceeded the Nil by ≥ 0.35 IU/mL and was ≥ 25% higher than the Nil, with Nil values ≤ 8.0 IU/mL. Samples with low Mitogen response (< 0.5 IU/mL) and no antigen response were classified as indeterminate and excluded. Only individuals with valid (positive or negative) results were included in the analysis. TST was considered positive if the skin induration was ≥ 10 mm (16, 17).
2.4 Covariates
The study accounted for several potential confounding factors, drawing on prior research and clinical expertise (18, 19). These included age, sex, race/ethnicity, family poverty-to-income ratio (PIR), educational attainment, marital status, body mass index (BMI), diabetes, coronary heart disease, hypertension, smoking status, alcohol consumption, hemoglobin levels, and platelet count. Age was treated as a continuous variable, while sex was categorized as male or female. Race/ethnicity was grouped as non-Hispanic white, non-Hispanic black, Mexican American, or other (18). Family income was divided into three categories based on the PIR: low income (PIR ≤ 1.3), medium income (PIR = 1.3–3.5), and high income (PIR > 3.5) (19). Education was classified into three levels: less than 9 years, 9 to 12 years, and more than 12 years (18). Marital status was categorized as either married or living with a partner, or living alone (18). BMI was calculated using standard procedures based on weight and height. Smoking status was classified as never smoked, current smoker, or former smoker (19). Similarly, alcohol consumption was classified into non-drinkers and drinkers. The presence of previous diseases (hypertension, diabetes, and coronary heart disease) was determined based on participants’ responses to the questionnaire regarding whether a doctor had diagnosed them with these conditions. Human immunodeficiency virus (HIV) status was defined by HIV-1 antibody testing and hepatitis B viruses (HBV) status by the presence of HBsAg detected through immunometric immunoassay, with participants classified as HIV-positive or -negative and HBV-positive or -negative accordingly (20). The outcome was a lifetime history of hepatitis C viruses (HCV) infection, defined by the presence of anti-HCV (21).
2.5 Statistical analysis
All the analyses in this study were conducted by using complex sampling design and sample weights. Baseline characteristics of participants with and without LTBI were compared using survey-weighted analyses. Continuous variables were summarized as mean with standard errors (SE), while categorical variables were reported as weighted proportions. Group comparisons were conducted using the Student’s t-test or Mann–Whitney U test for continuous variables and the chi-square test for categorical variables.
To examine the relationship between SII and LTBI, sample-weighted multivariable logistic regression analyses were conducted to estimate odds ratios (ORs) and 95% confidence intervals (CIs). Three progressively adjusted models were created to control for potential confounders. Model 1 was unadjusted, while Model 2 adjusted for key sociodemographic variables, including age, sex, race/ethnicity, family income, education level, marital status. Model 3 was fully adjusted, further incorporating BMI, diabetes, hypertension, coronary heart disease, smoking status, alcohol use, HIV, HBV, and HCV infection status. To confirm the association between SII and LTBI when treated as a continuous variable, SII was divided into quartiles and a trend test was conducted. Additionally, sample-weighted restricted cubic spline (RCS) regression was performed with four knots examine the dose-response relationship between SII and LTBI status. Subgroup analyses were conducted by sex, age, BMI, race/ethnicity, diabetes, smoking status, alcohol use, and HIV status. Within each subgroup, survey-weighted logistic regression models were applied using the fully adjusted model, excluding the stratification variable. To address missing covariate data, a multivariate single imputation approach was implemented using an iterative algorithm, with Bayesian Ridge regression as the estimator for successive imputations (22).
All statistical analyses were performed using R Statistical Software (Version 4.2.2; The R Foundation, Vienna, Austria1) and the Free Statistics software (Version 2.1.1; Beijing Free Clinical Medical Technology Co., Ltd., Beijing, China) (23). A two-tailed p-value < 0.05 was considered statistically significant. This cross-sectional study adhered to the STROBE (Strengthening the Reporting of Observational Studies in Epidemiology) guidelines.
3 Results
3.1 Baseline characteristics
A total of 19,721 participants were initially selected from the NHANES 1999–2000 and 2011–2012 cycles. After excluding 8,409 individuals under 18 years of age, 11,312 participants remained. Of these, 1,313 were excluded due to missing data on the SII, and an additional 510 were excluded due to incomplete information on LTBI. Ultimately, 9,489 eligible participants were included in the final analysis, comprising 1,068 individuals with LTBI and 8,421 without LTBI (Figure 1).
FIGURE 1

Flowchart of the study cohort. NHANES, National Health and Nutrition Examination Survey.
Table 1 presents the weighted characteristics of the study population. The cohort consisted of 48.3% males, with a mean age of 45.4 years. The LTBI group was older, with an average age of 49.5 years, and had lower income and educational levels. Additionally, this group exhibited increased rates of hypertension and diabetes compared to the non-LTBI group. The LTBI group also showed lower neutrophil counts, platelet counts, and SII values than the non-LTBI group.
TABLE 1
| Variables | Total (unweighted n = 9489) | Non-LTBI (unweighted n = 8421) | LTBI (unweighted n = 1068) | p |
| Weighted, n | 197,603,353 | 184,207,148 | 13,396,205 | |
| Sex, (%) | <0.001 | |||
| Male | 48.25 | 47.63 | 56.81 | |
| Female | 51.75 | 52.37 | 43.19 | |
| Age, years | 45.40 (0.55) | 45.1 (0.58) | 49.5 (0.83) | <0.001 |
| Race/ethnicity, (%) | <0.001 | |||
| Non-Hispanic White | 68.55 | 71.27 | 31.14 | |
| Non-Hispanic Black | 10.81 | 10.39 | 16.60 | |
| Mexican American | 7.24 | 6.48 | 17.68 | |
| Other | 13.41 | 11.87 | 34.57 | |
| PIR, (%) | <0.001 | |||
| low income | 25.24 | 24.46 | 36.42 | |
| medium income | 34.37 | 34.24 | 36.19 | |
| high income | 40.39 | 41.30 | 27.39 | |
| Education level years, (%) | <0.001 | |||
| <9 | 6.39 | 5.54 | 17.80 | |
| 9–12 | 36.12 | 35.80 | 40.35 | |
| >12 | 57.50 | 58.66 | 41.85 | |
| Marital status, (%) | 0.38 | |||
| Living with partner | 61.23 | 61.06 | 63.63 | |
| Living alone | 38.77 | 38.94 | 36.37 | |
| BMI, kg/m2 | 28.30 (0.15) | 28.30 (0.15) | 28.25 (0.33) | 0.98 |
| Diabetes, (%) | <0.001 | |||
| No | 92.44 | 92.79 | 87.61 | |
| Yes | 7.56 | 7.21 | 12.39 | |
| Coronary heart disease, (%) | 0.82 | |||
| No | 97.00 | 96.98 | 97.16 | |
| Yes | 3.00 | 3.02 | 2.84 | |
| Hypertension, (%) | 0.003 | |||
| No | 77.54 | 77.95 | 71.82 | |
| Yes | 22.46 | 22.05 | 28.18 | |
| Smoking status, (%) | 0.067 | |||
| Never | 53.54 | 54.02 | 47.10 | |
| Former | 24.62 | 24.36 | 28.06 | |
| Current | 21.84 | 21.62 | 24.85 | |
| Alcohol use, (%) | 0.005 | |||
| No | 23.78 | 23.39 | 29.36 | |
| Yes | 76.22 | 76.61 | 70.64 | |
| HIV, (%) | 0.32 | |||
| negative | 99.55 | 99.53 | 99.77 | |
| positive | 0.45 | 0.47 | 0.23 | |
| HBV, (%) | 0.001 | |||
| negative | 99.69 | 99.74 | 99.00 | |
| positive | 0.31 | 0.26 | 1.00 | |
| HCV, (%) | 0.17 | |||
| negative | 98.35 | 98.40 | 97.66 | |
| positive | 1.65 | 1.60 | 2.34 | |
| Lymphocyte (103 cells/ul) | 2.07 (0.02) | 2.06 (0.02) | 2.18 (0.04) | 0.004 |
| Neutrophil (103 cells/ul) | 4.28 (0.05) | 4.30 (0.05) | 4.06 (0.07) | 0.014 |
| Platelet (103 cells/ul) | 248.48 (1.38) | 248.70 (1.43) | 245.57 (2.63) | 0.018 |
| SII | 561.80 (7.34) | 566.35 (7.58) | 499.23 (10.45) | <0.001 |
Baseline characteristics of participants.
Mean (SE) for continuous variables, (%) for categorical variables. PIR, poverty income ratio; BMI, body mass index; SII, systemic immune-inflammation index; LTBI, latent tuberculosis infection; HIV, human immunodeficiency virus; HBV, hepatitis B virus; HCV, hepatitis C virus. Bold values indicate p-value < 0.05.
3.2 Association between SII and LTBI
Sample-weighted multivariable logistic regression analysis indicated a consistent negative association between SII and LTBI across all models (Table 2). A 100-unit increase in SII was associated with a 6% reduction in the odds of LTBI, both in unadjusted (OR = 0.92, 95% CI: 0.90–0.95) and fully adjusted models (OR = 0.94, 95% CI: 0.90–0.97). When analyzed by quartiles, participants in the highest SII quartile (Quartile 4) had a 42% lower likelihood of LTBI compared to those in Quartile 1 (OR = 0.58, 95% CI: 0.41–0.81) in the fully adjusted model. The trend test indicated a statistically significant trend (p < 0.05). The linear relationship between SII and LTBI was confirmed by weighted RCS (p for non-linearity >0.05) (Figure 2).
TABLE 2
| Variable | n.event_% | Model I | Model II | Model III | |||
| OR (95%CI) | P-Value | OR (95%CI) | P-Value | OR (95%CI) | P-Value | ||
| SII/100 | 1068 (11.3) | 0.92 (0.90∼0.95) | <0.001 | 0.94 (0.91∼0.97) | <0.001 | 0.94 (0.90∼0.97) | 0.002 |
| SII/100 quartiles | |||||||
| Quartile 1 | 346 (14.6) | 1 (Ref) | 1 (Ref) | 1 (Ref) | |||
| Quartile 2 | 269 (11.3) | 0.64 (0.51∼0.81) | <0.001 | 0.74 (0.57∼0.97) | 0.030 | 0.74 (0.56∼0.99) | 0.045 |
| Quartile 3 | 251 (10.6) | 0.57 (0.46∼0.71) | <0.001 | 0.64 (0.51∼0.82) | 0.001 | 0.63 (0.48∼0.83) | 0.005 |
| Quartile 4 | 202 (8.5) | 0.51 (0.39∼0.66) | <0.001 | 0.60 (0.45∼0.80) | 0.002 | 0.58 (0.41∼0.81) | 0.006 |
| P for trend | <0.001 | <0.001 | 0.003 | ||||
Associations between SII/100 and LTBI.
Model I: unadjusted; Model II: adjusted for: sex, age, race/ethnicity, family income, education level, marital status; Model III: adjusted for: sex, age, race/ethnicity, family income, education level, marital status, body mass index, diabetes, coronary heart disease, hypertension, smoking status, alcohol use, HIV, HBV, HCV. SII, systemic immune-inflammation index; LTBI, latent tuberculosis infection; OR, odds ratio; CI, confidence interval; Ref, reference; HIV, human immunodeficiency virus; HBV, hepatitis B virus; HCV, hepatitis C virus.
FIGURE 2
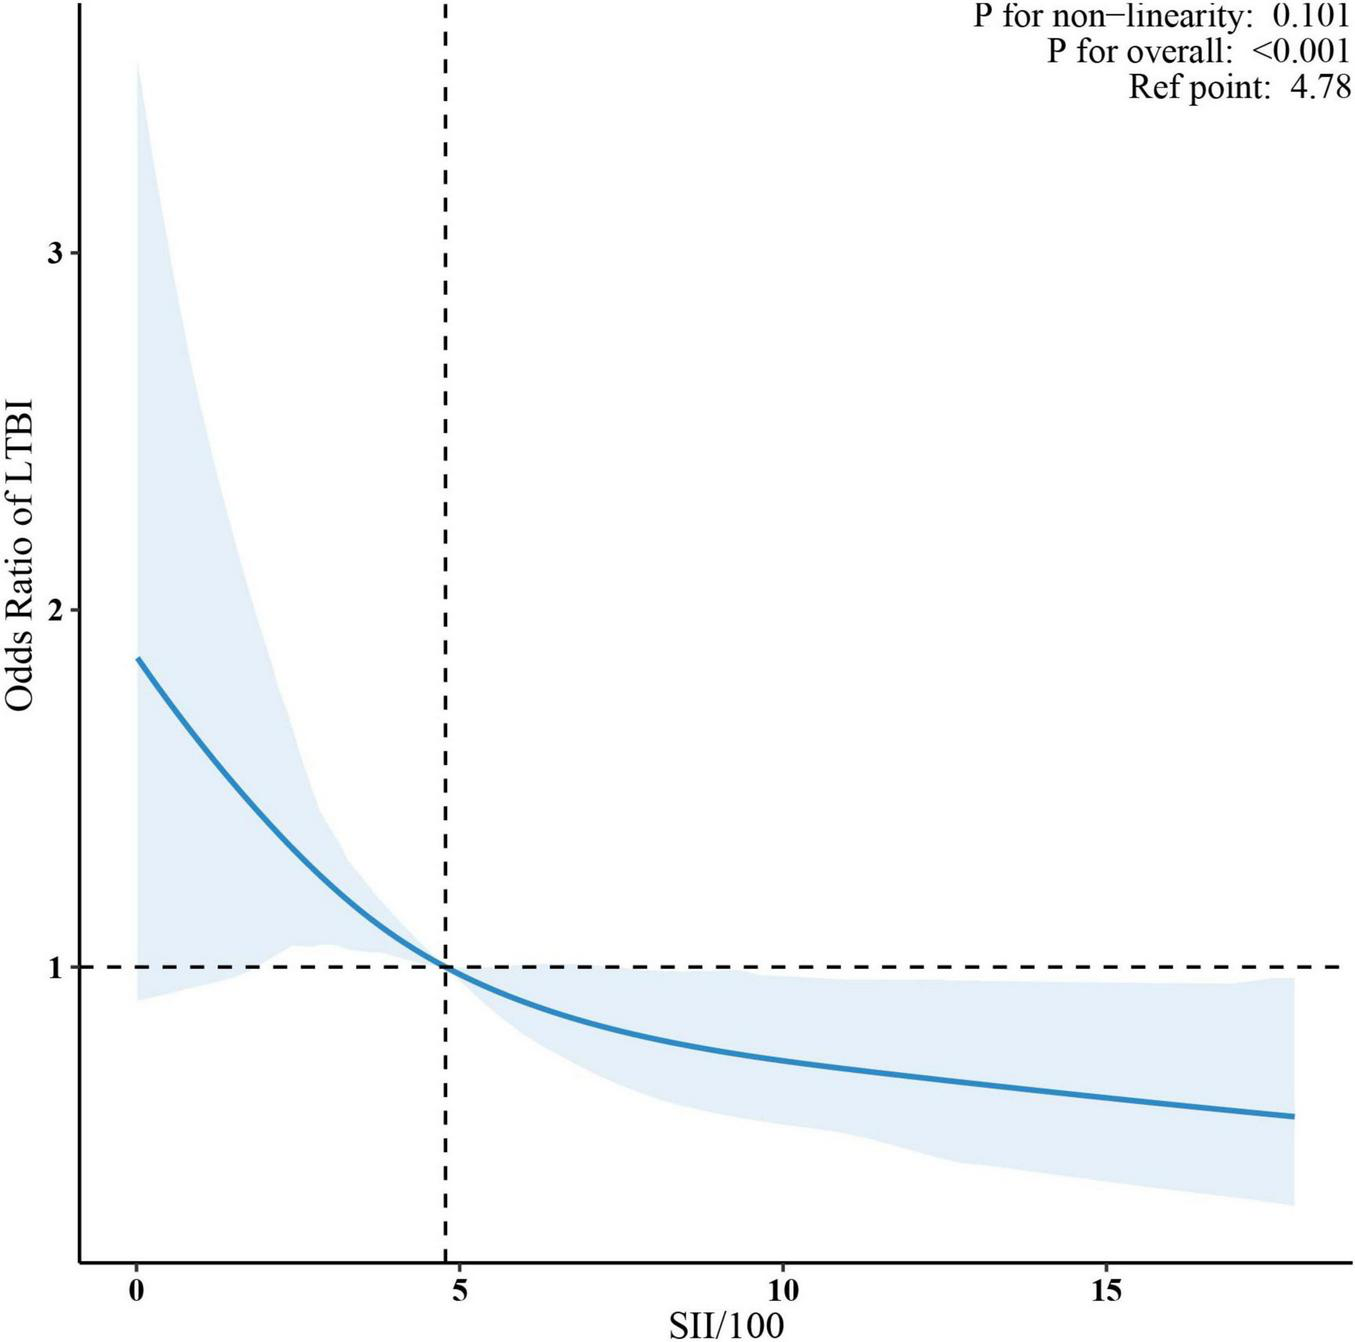
Association between SII/100 and LTBI. The solid red lines represent the predicted odds ratios, while the dashed red lines indicate the 95% confidence intervals. Adjusted for sex, age, race/ethnicity, family income, education level, marital status, body mass index, diabetes, coronary heart disease, hypertension, smoking status, alcohol use, HIV, HBV, HCV. Only the top 99% of SII data are shown. SII, systemic immune-inflammation index; LTBI, latent tuberculosis infection.
3.3 Subgroup analyses
Subgroup analyses were performed based on sex, age (< 18 years, ≥ 18 years), BMI (< 25 kg/m2, ≥ 25 kg/m2), race/ethnicity, diabetes, smoking status, alcohol use, and HIV status. Adjustments were made for sex, age, race/ethnicity, family income, education level, marital status, body mass index, diabetes, coronary heart disease, hypertension, smoking status, alcohol use, HIV, HBV, and HCV. The associations remained consistent across all subgroups, with no significant interactions observed (p for interaction >0.05), except for HIV status (p for interaction = 0.034) (Figure 3).
FIGURE 3
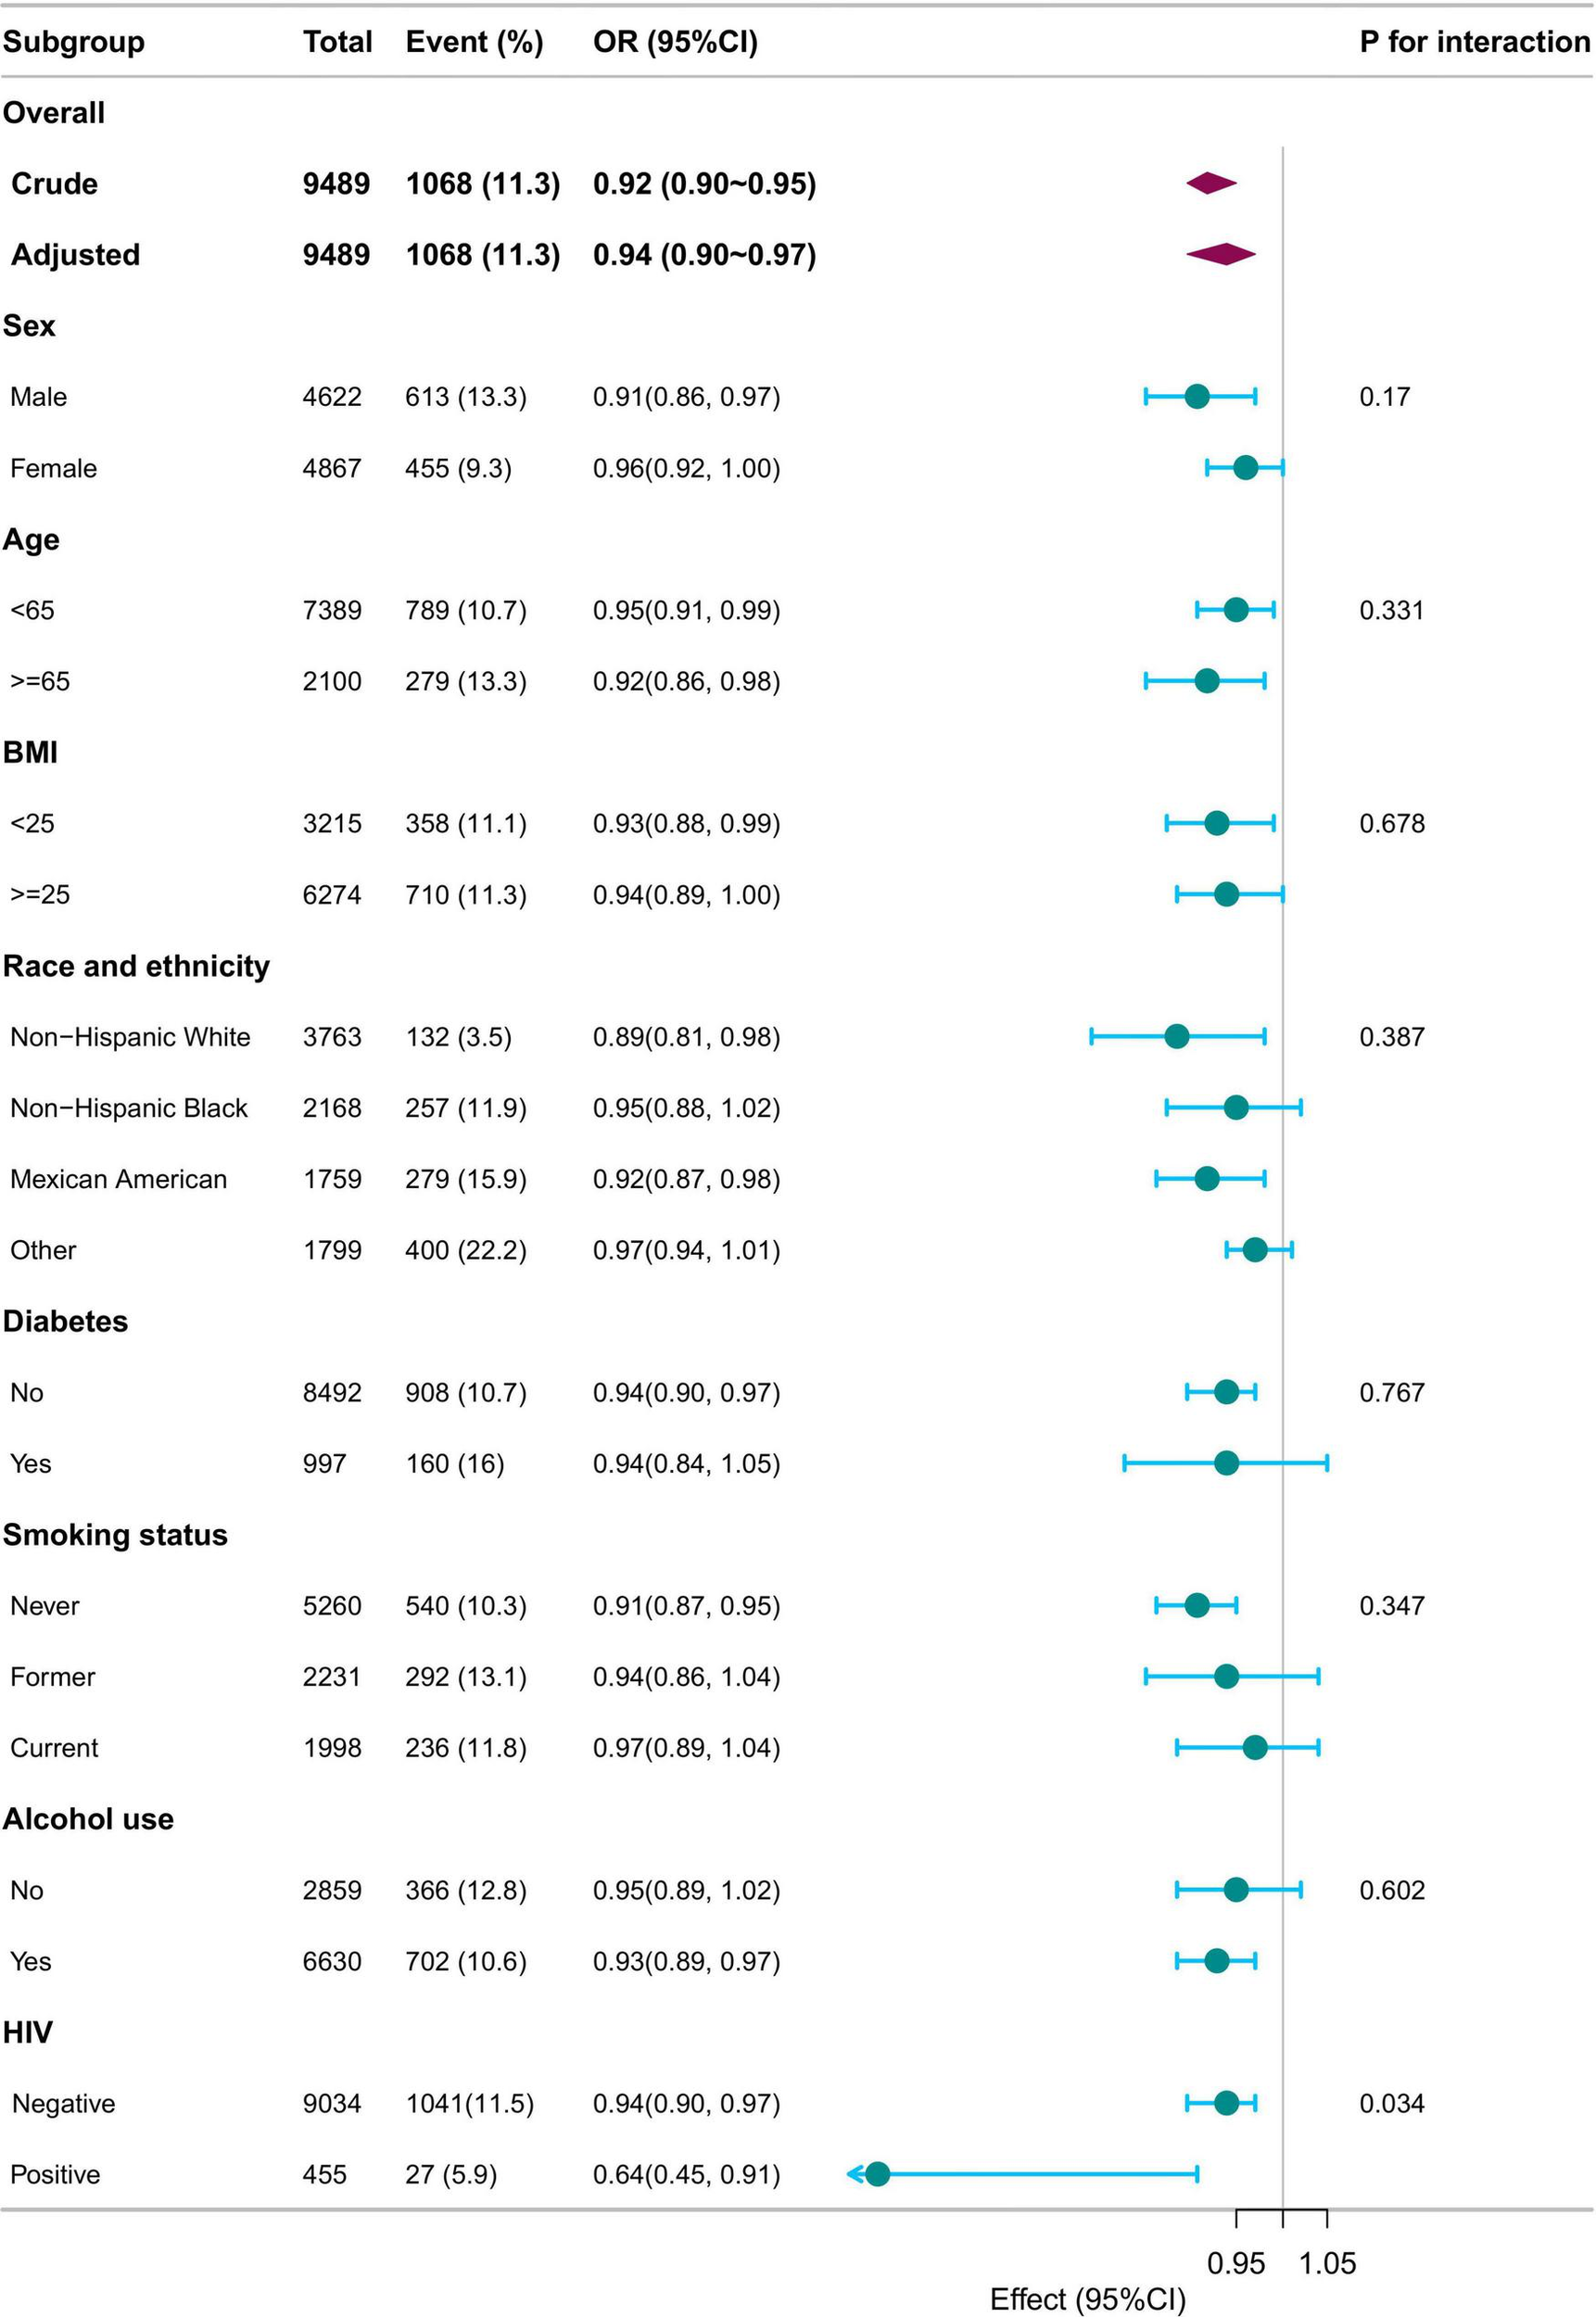
Subgroup analysis of SII/100 and LTBI. Adjusted for sex, age, race/ethnicity, family income, education level, marital status, body mass index, diabetes, coronary heart disease, hypertension, smoking status, alcohol use, HIV, HBV, HCV except for the stratification component itself. SII, systemic immune-inflammation index; LTBI, latent tuberculosis infection.
4 Discussion
This study is the first to demonstrate a significant inverse association between SII and LTBI in a United States adult population sample from NHANES.
The systemic immune-inflammation index (SII), a novel composite biomarker derived from platelet, neutrophil, and lymphocyte counts, has become a validated indicator of systemic inflammation and immune dysregulation (17). Changes in peripheral blood cell profiles, reflected by SII, provide a reliable measure of chronic low-grade inflammation. Numerous studies have highlighted its clinical significance across various diseases, including oncology (24), cardiovascular conditions (25), and metabolic syndrome (26). SII has also been associated with infectious diseases. Wang et al. found that individuals with HIV had notably lower SII levels compared to those without the infection (27). A multicenter study further showed that higher SII is an independent predictor for intensive care unit (ICU) admission in COVID-19 patients (28). Additionally, elevated SII has been linked to increased mortality in Clostridium difficile infections (29).
Recent studies have increasingly focused on the relationship between the SII and tuberculosis. Yu et al. observed that SII levels were notably higher in patients with active pulmonary tuberculosis compared to those with non-tuberculous lung diseases (12). Kerget et al. also reported that SII levels were considerably higher in patients with tuberculous lymphadenitis than in those with granulomatous disease and reactive lymphadenopathy (30). Furthermore, Liu et al. showed a significant link between SII levels and depression or anxiety symptoms in tuberculosis patients (31). Huang et al. further found that SII levels were markedly higher in patients who experienced restenosis after interventional treatment for tuberculous airway stenosis, compared to those who did not (32). These results imply that SII, as a comprehensive marker of systemic inflammation and immune function, may offer valuable insights in the context of tuberculosis.
However, large-scale studies exploring the link between SII and LTBI remain scarce. Our research identifies a significant negative association between SII and LTBI, with higher SII values corresponding to a reduced risk of LTBI. This contrasts with the inflammatory profile of active TB, where elevated SII reflects ongoing immune activation (12). However, LTBI represents a specific stage within the continuum from tuberculosis infection to disease, characterized by a dynamic state of immune equilibrium in which Mtb is contained without apparent clinical manifestations (33). Interestingly, prior studies have reported inverse associations between LTBI and inflammatory markers such as the monocyte-to-lymphocyte ratio (MLR) and neutrophil-to-lymphocyte ratio (NLR) (18, 34). In addition, the SII has been shown to be negatively correlated with HIV status (27). Consistently, our subgroup analysis revealed a statistically significant interaction between SII and HIV status, with the inverse association between SII and LTBI being more pronounced among individuals living with HIV.
The systemic immune-inflammation index (SII) combines platelet, neutrophil, and lymphocyte counts, all of which are critical in the immune response to tuberculosis (35, 36). Neutrophils play a vital role in both innate and adaptive immunity, crucial for preventing tuberculosis infection (37). They are phagocytic cells within early TB granulomas, responsible for killing Mtb through oxidative damage (38). A study on active pulmonary tuberculosis found that neutrophils were the predominant cell type infected by Mtb in respiratory secretions (39). A study in the United Kingdom showed that the risk of tuberculosis infection among contacts of pulmonary tuberculosis patients was independently and negatively correlated with peripheral blood neutrophil counts. Neutrophil depletion reduced whole blood’s ability to inhibit the growth of Mycobacterium bovis BCG and Mtb by 7.3-fold and 3.1-fold, respectively (40). Recent research has emphasized the complex role of platelets in tuberculosis pathogenesis. Platelets participate in the immune response against Mtb through the production of host defense peptides and cytokines (41). Platelets can also release a variety of cytokines and chemokines, such as PF4 and VEGF-A, which play a key role in promoting chemotaxis and activation of monocytes and enhancing inflammatory responses (42). However, platelets may also adversely affect primary progressive tuberculosis by limiting the production of reactive oxygen species in lung-resident myeloid cells, thereby hampering antimicrobial defense (43). Thus, elevated SII values likely reflect heightened neutrophil and platelet activity, contributing to the control of Mtb growth and spread.
These findings suggest that SII may offer useful insights into host immune responses to Mtb infection. Based on routinely available hematological parameters, SII holds potential as a supportive tool for LTBI risk stratification, particularly in resource-limited settings. However, its application should be interpreted cautiously and within the context of broader clinical and epidemiological assessment.
This study utilizes data from the NHANES database and adopts a cross-sectional design to explore the relationship between SII and LTBI. Nonetheless, several limitations must be acknowledged. Firstly, the cross-sectional nature of the study prevents the establishment of causality or the identification of temporal sequence. Thus, it remains uncertain whether elevated SII levels precede LTBI development, result from LTBI, or reflect shared underlying risk factors. Future longitudinal studies are warranted to clarify these relationships. Secondly, some potential confounding factors, such as chronic illnesses, medication usage, BCG vaccination, and immunosuppressive therapy, are inadequately recorded in the NHANES dataset, which may influence the accuracy of the results. Thirdly, although LTBI was defined as a positive result on either QFT-GIT or TST, both tests have known limitations. QFT-GIT may yield false-negative results, particularly in immunocompromised or elderly individuals, whereas TST may produce false-positive results due to prior BCG vaccination or exposure to non-tuberculous mycobacteria. Finally, SII was assessed at a single time point, which may not reflect its temporal variability. Moreover, as a non-specific inflammatory marker, SII can be elevated due to various conditions such as infections, cancers, and autoimmune diseases, potentially leading to misclassification or residual confounding. Future studies should implement a longitudinal approach, consider additional confounders, and replicate the results in different population groups.
5 Conclusion
Our findings demonstrate a significant inverse association between SII and LTBI, suggesting that SII may assist in LTBI risk stratification among adults. However, given its non-specific nature, further longitudinal studies are needed to validate these findings and clarify the potential clinical and public health implications of SII in LTBI screening and management.
Statements
Data availability statement
The original contributions presented in this study are included in this article/supplementary material, further inquiries can be directed to the corresponding author.
Ethics statement
The studies involving humans were approved by Ethics Review Board of the National Center for Health Statistics. The studies were conducted in accordance with the local legislation and institutional requirements. The human samples used in this study were acquired from National Health and Nutrition Examination Survey. Written informed consent for participation was not required from the participants or the participants’ legal guardians/next of kin in accordance with the national legislation and institutional requirements.
Author contributions
TP: Writing – review and editing, Supervision, Writing – original draft, Conceptualization, Project administration. LW: Writing – review and editing, Writing – original draft, Data curation. JZ: Writing – review and editing, Data curation, Writing – original draft. SD: Writing – review and editing, Writing – original draft, Methodology.
Funding
The author(s) declare that no financial support was received for the research and/or publication of this article.
Acknowledgments
We would like to express our sincere appreciation to the Physician Scientist Team for their dedicated instruction and valuable insights on NHANES data analysis and interpretation.
Conflict of interest
The authors declare that the research was conducted in the absence of any commercial or financial relationships that could be construed as a potential conflict of interest.
Generative AI statement
The authors declare that no Generative AI was used in the creation of this manuscript.
Publisher’s note
All claims expressed in this article are solely those of the authors and do not necessarily represent those of their affiliated organizations, or those of the publisher, the editors and the reviewers. Any product that may be evaluated in this article, or claim that may be made by its manufacturer, is not guaranteed or endorsed by the publisher.
Footnotes
References
1.
Bagcchi S . WHO’s global tuberculosis report 2022.Lancet Microbe. (2023) 4:e20. 10.1016/S2666-5247(22)00359-7
2.
Jonas D Riley S Lee L Coffey C Wang S Asher G et al Screening for latent tuberculosis infection in adults: Updated evidence report and systematic review for the US preventive services task force. JAMA. (2023) 329:1495–509. 10.1001/jama.2023.3954
3.
Kim S Thal R Szkwarko D. Management of Latent Tuberculosis Infection. Geneva: WHO (2023).
4.
US Preventive Services Task Force, MangioneCMBarryMJNicholsonWKCabanaMChelmowDet alScreening for latent tuberculosis infection in adults: US preventive services task force recommendation statement.JAMA. (2023) 329:1487. 10.1001/jama.2023.4899
5.
Shete P Tang A Flood J . Screening for latent tuberculosis infection among Non–US-born adults in the US: A path toward elimination.JAMA. (2023) 329:1457. 10.1001/jama.2023.4967
6.
Huai Q Luo C Song P Bie F Bai G Li Y et al Peripheral blood inflammatory biomarkers dynamics reflect treatment response and predict prognosis in non-small cell lung cancer patients with neoadjuvant immunotherapy. Cancer Sci. (2023) 114:4484–98. 10.1111/cas.15964
7.
Li X Gu L Chen Y Chong Y Wang X Guo P et al Systemic immune-inflammation index is a promising non-invasive biomarker for predicting the survival of urinary system cancers: A systematic review and meta-analysis. Ann Med. (2021) 53:1827–38. 10.1080/07853890.2021.1991591
8.
Zhao Y Shao W Zhu Q Zhang R Sun T Wang B et al Association between systemic immune-inflammation index and metabolic syndrome and its components: Results from the national health and nutrition examination survey 2011–2016. J Transl Med. (2023) 21:691. 10.1186/s12967-023-04491-y
9.
Hu B Yang X Xu Y Sun Y Sun C Guo W et al Systemic immune-inflammation index predicts prognosis of patients after curative resection for hepatocellular carcinoma. Clin Cancer Res. (2014) 20:6212–22. 10.1158/1078-0432.CCR-14-0442
10.
Zhao X Li J Li X . Association between systemic immune-inflammation index and psoriasis: A population-based study.Front Immunol. (2024) 15:1305701. 10.3389/fimmu.2024.1305701
11.
Tiwari D Martineau A . Inflammation-mediated tissue damage in pulmonary tuberculosis and host-directed therapeutic strategies.Semin Immunol. (2023) 65:101672. 10.1016/j.smim.2022.101672
12.
Yu Z Shang Z Huang Q Wen F Patil S . Integrating systemic immune-inflammation index, fibrinogen, and T-SPOT.TB for precision distinction of active pulmonary tuberculosis in the era of mycobacterial disease research.Front Microbiol. (2024) 15:1382665. 10.3389/fmicb.2024.1382665
13.
Hubbard A Hirode G Chitnis A Wong R . Prevalence of hepatitis B surface antigen and hepatitis B core antibody among adults with latent tuberculosis infection.Eur J Gastroenterol Hepatol. (2021) 33:e610–4. 10.1097/meg.0000000000002180
14.
Qi M Zhang H He J . Higher blood manganese level associated with increased risk of adult latent tuberculosis infection in the US population.Front Public Health. (2024) 12:1440287. 10.3389/fpubh.2024.1440287
15.
Wang L Kuang Y Zeng Y Wan Z Yang S Li R . Association of systemic inflammation response index with latent tuberculosis infection and all-cause mortality: A cohort study from NHANES 2011-2012.Front Immunol. (2025) 16:1538132. 10.3389/fimmu.2025.1538132
16.
Magodoro I Wilkinson K Claggett B Ntusi N Siedner M Wilkinson R . Discordance between measures of mycobacterium tuberculosis sensitization and type 2 diabetes mellitus in the united states (NHANES): A population-based cohort study.J Infect. (2025) 90:106496. 10.2139/ssrn.4975386
17.
Ghassemieh B Attia E Koelle D Mancuso J Narita M Horne D . Latent tuberculosis infection test agreement in the national health and nutrition examination survey.Am J Respir Crit Care Med. (2016) 194:493–500. 10.1164/rccm.201508-1560OC
18.
Huang Y Ao T Zhen P Hu M . Neutrophil-to-lymphocyte ratio and its association with latent tuberculosis infection and all-cause mortality in the US adult population: A cohort study from NHANES 2011–2012.Front Nutr. (2024) 11:1467824. 10.3389/fnut.2024.1467824
19.
Liu H Wang L Chen C Dong Z Yu S . Association between dietary niacin intake and migraine among American adults: National health and nutrition examination survey.Nutrients. (2022) 14:3052. 10.3390/nu14153052
20.
Yang J Lin J Liu J Jiang X Zhang H Peng L . Estimates of prevalence, time-trend, and association of smoking in adults living with HIV, HBV, and HCV (NHANES 1999–2018).Sci Rep. (2022) 12:19925. 10.1038/s41598-022-24291-6
21.
Awan A Shakik S Banack H Fisman D Simmons A . Hepatitis B and C in individuals with a history of antipsychotic medication use: A population-based evaluation.PLoS One. (2023) 18:e0284323. 10.1371/journal.pone.0284323
22.
Bernard D Doumard E Ader I Kemoun P Pagès J Galinier A et al Explainable machine learning framework to predict personalized physiological aging. Aging Cell. (2023) 22:e13872. 10.1111/acel.13872
23.
Ruan Z Lu T Chen Y Yuan M Yu H Liu R et al Association between psoriasis and nonalcoholic fatty liver disease among outpatient US adults. JAMA Dermatol. (2022) 158:745. 10.1001/jamadermatol.2022.1609
24.
He T Xu B Wang L Wang Z Shi H Zhong C et al The prognostic value of systemic immune-inflammation index in patients with unresectable hepatocellular carcinoma treated with immune-based therapy. Biomark Res. (2025) 13:10. 10.1186/s40364-024-00722-6
25.
Xu M Chen R Liu L Liu X Hou J Liao J et al Systemic immune-inflammation index and incident cardiovascular diseases among middle-aged and elderly Chinese adults: The Dongfeng-Tongji cohort study. Atherosclerosis. (2021) 323:20–9. 10.1016/j.atherosclerosis.2021.02.012
26.
Ramezankhani A Tohidi M Hadaegh F . Association between the systemic immune-inflammation index and metabolic syndrome and its components: Results from the multi-ethnic study of atherosclerosis (MESA).Cardiovasc Diabetol. (2025) 24:78. 10.1186/s12933-025-02629-4
27.
Wang C Letendre S Hong S Andalibi M Iudicello J Ellis R . Differential systemic immune-inflammation index levels in people with and without HIV infection.AIDS. (2025) 39:554–9. 10.1097/QAD.0000000000004088
28.
Hamad D Aly M Abdelhameid M Ahmed S Shaltout A Abdel-Moniem A et al Combined blood indexes of systemic inflammation as a mirror to admission to intensive care unit in COVID-19 patients: A multicentric study. J Epidemiol Glob Health. (2022) 12:64–73. 10.1007/s44197-021-00021-5
29.
Scarlata G Quirino A Costache C Toc D Marascio N Pantanella M et al Clostridioides difficile infection: Use of inflammatory biomarkers and hemogram-derived ratios to predict mortality risk in hospitalized patients. Antibiotics. (2024) 13:769. 10.3390/antibiotics13080769
30.
Kerget B Afşin D Aksakal A . The role of systemic immune-inflammation index (SII) in the differential diagnosis of granulomatous and reactive LAP diagnosed by endobronchial ultrasonography: Evaluation of the systemic immune-inflammation index in sarcoidosis, tuberculosis and reactive lymphadenitis.Sarcoidosis Vasc Diffuse Lung Dis. (2023) 40:e2023038. 10.36141/svdld.v40i3.14743
31.
Liu X Bai X Ren R Tan L Zhang Y Lan H et al Association between depression or anxiety symptoms and immune-inflammatory characteristics in in-patients with tuberculosis: A cross-sectional study. Front Psychiatry. (2022) 13:985823. 10.3389/fpsyt.2022.985823
32.
Huang W Xu C Wei B Li X Wu F Hou Y et al Analysis of risk factors for restenosis after interventional treatment of tuberculous airway stenosis. Respiration. (2024) 104:341–8. 10.1159/000542909
33.
Migliori G Ong C Petrone L D’Ambrosio L Centis R Goletti D . The definition of tuberculosis infection based on the spectrum of tuberculosis disease.Breathe. (2021) 17:210079. 10.1183/20734735.0079-2021
34.
Hua H Wang H . Monocyte-to-lymphocyte ratio is significantly associated with positive QuantiFERON-TB gold-in-tube and adult survival: An observational study.Sci Rep. (2022) 12:20406. 10.1038/s41598-022-24376-2
35.
Kirwan D Chong D Friedland J . Platelet activation and the immune response to tuberculosis.Front Immunol. (2021) 12:631696. 10.3389/fimmu.2021.631696
36.
Sankar P Mishra B . Early innate cell interactions with Mycobacterium tuberculosis in protection and pathology of tuberculosis.Front Immunol. (2023) 14:1260859. 10.3389/fimmu.2023.1260859
37.
Wang P Lin S Liou H Chen C Shu C Lee C et al Protective effect of BCG and neutrophil-to-lymphocyte ratio on latent tuberculosis in end stage renal disease. Infect Dis Ther. (2023) 12:1907–20. 10.1007/s40121-023-00839-5
38.
Yang C Cambier C Davis J Hall C Crosier P Ramakrishnan L . Neutrophils exert protection in the early tuberculous granuloma by oxidative killing of mycobacteria phagocytosed from infected macrophages.Cell Host Microbe. (2012) 12:301–12. 10.1016/j.chom.2012.07.009
39.
Eum S Kong J Hong M Lee Y Kim J Hwang S et al Neutrophils are the predominant infected phagocytic cells in the airways of patients with active pulmonary TB. Chest. (2010) 137:122–8. 10.1378/chest.09-0903
40.
Martineau A Newton S Wilkinson K Kampmann B Hall B Nawroly N et al Neutrophil-mediated innate immune resistance to mycobacteria. J Clin Invest. (2007) 117:1988–94. 10.1172/JCI31097
41.
Torres-Juarez F Trejo-Martínez L Layseca-Espinosa E Leon-Contreras J Enciso-Moreno J Hernandez-Pando R et al Platelets immune response against Mycobacterium tuberculosis infection. Microb Pathog. (2021) 153:104768. 10.1016/j.micpath.2021.104768
42.
Urbán-Solano A Flores-Gonzalez J Cruz-Lagunas A Pérez-Rubio G Buendia-Roldan I Ramón-Luing L et al High levels of PF4, VEGF-A, and classical monocytes correlate with the platelets count and inflammation during active tuberculosis. Front Immunol. (2022) 13:1016472. 10.3389/fimmu.2022.1016472
43.
Scheuermann L Pei G Domaszewska T Zyla J Oberbeck-Müller D Bandermann S et al Platelets restrict the oxidative burst in phagocytes and facilitate primary progressive tuberculosis. Am J Respir Crit Care Med. (2020) 202:730–44. 10.1164/rccm.201910-2063OC
Summary
Keywords
systemic immune-inflammation index, SII, latent tuberculosis infection, LTBI, NHANES
Citation
Pang T, Wang L, Zhang J and Duan S (2025) Association between systemic immune-inflammation index and latent tuberculosis infection: a cross-sectional study. Front. Med. 12:1615302. doi: 10.3389/fmed.2025.1615302
Received
23 April 2025
Accepted
11 July 2025
Published
30 July 2025
Volume
12 - 2025
Edited by
Muhammad Sohaib Asghar, AdventHealth, United States
Reviewed by
Kunhong Xiao, Fujian Medical University, China
Wanjie Yang, The University of Texas at Austin, United States
Updates
Copyright
© 2025 Pang, Wang, Zhang and Duan.
This is an open-access article distributed under the terms of the Creative Commons Attribution License (CC BY). The use, distribution or reproduction in other forums is permitted, provided the original author(s) and the copyright owner(s) are credited and that the original publication in this journal is cited, in accordance with accepted academic practice. No use, distribution or reproduction is permitted which does not comply with these terms.
*Correspondence: Ting Pang, pangting3350@bjsjth.cn
Disclaimer
All claims expressed in this article are solely those of the authors and do not necessarily represent those of their affiliated organizations, or those of the publisher, the editors and the reviewers. Any product that may be evaluated in this article or claim that may be made by its manufacturer is not guaranteed or endorsed by the publisher.