Abstract
Mass spectrometry (MS)-based breath analysis has emerged as a promising non-invasive approach for diagnosing and monitoring respiratory diseases through the identification of volatile organic compounds (VOCs). This study conducted a comprehensive bibliometric analysis of 467 publications (2003–2024) to map global research trends, influential contributors, and thematic hotspots in this field. Results showed a sustained annual growth rate of 11.03%, with the United States, the United Kingdom, the Netherlands, and China leading in publication output and institutional collaborations. Key research areas included VOC profiling for COPD, asthma, lung cancer, and COVID-19, as well as advances in real-time MS techniques and machine learning-based data interpretation. Co-citation analysis revealed a shift toward precision medicine and multi-omics integration, underscoring the field’s transition from discovery to clinical translation. Despite challenges in standardization and reproducibility, MS-based breathomics holds transformative potential for respiratory diagnostics. This study provides a roadmap for future research priorities, emphasizing the need for interdisciplinary collaboration, composite biomarker validation, and artificial intelligence integration.
1 Introduction
By detecting the mass-to-charge ratio (m/z) values of ions and combining them with fragment ion spectra, mass spectrometry (MS) can qualitatively provide information on the molecular weight and structural features of substances. Target substances can also be quantitatively analyzed using MS by measuring the abundance of particular m/z ions in conjunction with internal standard procedures or standard curves (1). Because MS supports a range of ionization techniques (such as electrospray ionization and electron bombardment ionization) and can be combined with separation techniques like gas chromatography (GC) and liquid chromatography (LC), it has great potential and value in clinical practice. This makes it feasible for the analysis of complex samples for use in clinical biological analysis (2). Respiratory disorders are closely linked to volatile organic compounds (VOCs) in exhaled breath. The application of MS to identify VOCs has grown in popularity in recent years.
Figure 1 schematically outlines the integrated workflow for clinical biomarker discovery and analysis using MS-based profiling of VOCs in exhaled breath. The process initiates with participant sampling, where exhaled breath is collected as a complex matrix rich in VOCs originating from systemic metabolism. The MS analysis phase involves four critical steps: (1) Sample Introduction & Separation (optional but common), typically employing online-coupled GC/LC–MS to resolve complex VOC mixtures (2) (2) Ionization using techniques such as electrospray ionization (ESI, for LC–MS) or electron ionization (EI, for GC–MS) to generate gas-phase ions (2) (3) Mass Analysis, where ions are separated by m/z to determine molecular weights, with tandem MS fragment ion spectra providing structural elucidation (1); and (4) Detection and Quantification, enabling qualitative identification (via m/z and fragmentation patterns) and precise quantitation (using internal standards or calibration curves) (1). Finally, computational interpretation of MS data (spectra/chromatograms) correlates quantified VOC biomarkers with clinical endpoints, facilitating applications in disease diagnosis, metabolic and drug monitoring, and environmental exposure assessment (3–5).
Figure 1

Schematic of exhaled gas mass spectrometry for the detection of VOCs.
Coupled MS offers distinct advantages over traditional detection techniques, including non-invasiveness, high sensitivity, high specificity, and real-time monitoring capabilities. While biopsies provide histological confirmation, they carry risks of pneumothorax (15–25% incidence) and are unsuitable for serial monitoring. Conversely, MS breath analysis enables real-time, repeatable assessment of metabolic activity but lacks spatial resolution for tumor localization. Conventional imaging techniques (e.g., CT/MRI) primarily provide anatomical information but lack sensitivity to functional metabolic changes during early disease stages. In contrast, MS detects molecular-level alterations by identifying metabolite structures, enabling lesion detection months before anatomical abnormalities manifest, thereby significantly improving early diagnosis rates. For instance, Wang et al. demonstrated that proton transfer reaction time-of-flight MS (PTR-TOF-MS) outperformed CT in diagnosing early-stage lung cancer, with respiratory analysis showing superior diagnostic performance (88.6% sensitivity, 63.6% specificity, 79.2% accuracy) versus CT (74.3, 59.1, 68.1%) (6). The integration of mass spectrometry with low-dose CT may enhance early detection by identifying metabolic changes that precede anatomical abnormalities. Breath analysis via MS is now extensively employed in respiratory medicine. MS-based multidimensional analysis facilitates not only disease diagnosis and monitoring, but also elucidates underlying physiological and pathological mechanisms (7). Bos et al. identified three exhaled VOCs—octane, acetaldehyde, and 3-methylheptane—using GC–MS as diagnostic biomarkers for acute respiratory distress syndrome (ARDS). They further hypothesized these compounds originate from cellular metabolism and lipid peroxidation (8). Gaugg et al. (9) employed high-resolution MS for real-time breath analysis to monitor metabolic changes following bronchodilator inhalation in asthma and chronic obstructive pulmonary disease (COPD) patients.
Bibliometrics employs statistical techniques to quantitatively analyze published literature (10). Using specialized analytical tools (e.g., CiteSpace, VOSviewer), this method extracts multivariate data—including authors, institutions, keywords, and citations—to visualize knowledge evolution and structural relationships. This quantitative approach provides an invaluable framework for examining research dynamics, identifying emerging trends, detecting knowledge gaps, and forecasting domain-specific research hotspots. We conducted a bibliometric analysis of breath test mass spectrometry literature (2003–2024) indexed in Web of Science (WoS) and PubMed. Through systematic data analysis, we: (1) identified seminal publications and key applications, (2) analyzed high-impact citations and keyword co-occurrences, (3) generated thematic clusters, (4) mapped current research hotspots, and (5) identified emerging frontiers—collectively elucidating the field’s developmental trajectory. This longitudinal analysis provides researchers with a comprehensive knowledge map of the global MS breath testing landscape for respiratory disorders, while establishing critical references for future investigations.
2 Materials and methods
We systematically searched WoS, PubMed, Scopus, and Embase for publications (2000–2024) on MS-based breath analysis in respiratory diseases. Preliminary screening established 2003 as the valid inception year, as empirical studies first appeared then. Pre-2003 publications contained only speculative perspectives lacking experimental validation.
Using R Studio, we exported records and removed duplicates across WOS, Scopus, and Embase via Excel’s COUNTIF algorithm. Duplication rates were: WOS-Scopus 92.1% (430/467) and WOS-Embase 89.1% (416/467). We standardized Scopus affiliations (recorded as secondary entities) via custom VBA scripting for hierarchical VOSviewer analysis. Scopus and Embase unique records were converted to WOS format using CiteSpace and merged. Integration validity was confirmed with negligible analytical impact.
Non-English publications (n = 14; 12 articles, 2 reviews) underwent full-text review. Eight contained novel content (7 articles, 1 review), while six duplicated English publications. These unique non-English records were excluded from network analyses due to metadata inconsistencies. Their minimal impact (<1.7% corpus coverage) was documented despite potential content scope expansion.
2.1 Data source and search strategy
Web of Science Core Collection (WoSCC) is widely recognized as a premier bibliographic database for bibliometric analysis, with established scholarly credibility (11). We systematically searched WoSCC and PubMed (January 1, 2003 - December 31, 2024) to retrieve relevant publications. The search strategy employed: TS = (“Mass spectrometry”) AND TS = (“Breath test”). Retrieval fields included title, abstract, author keywords, and references.
2.2 Manual screening process
2.2.1 Screening and analysis workflow
Literature processing followed a tiered protocol: (1) A primary investigator retrieved and downloaded all articles; (2) Two independent researchers classified publications by study type and extracted metadata; (3) Two other researchers performed full-text critical appraisal and content synthesis; (4) Post-deduplication, five researchers conducted relevance screening to exclude irrelevant publications; (5) The primary investigator executed bibliometric analysis to ensure procedural consistency; (6) Discrepancies at each stage were resolved via consensus meetings with ≥80% agreement threshold.
2.2.2 Inclusion criteria
(1) Literature containing breath tests and mass spectrometry; (2) Application scope of respiratory diseases; (3) Literature involving in vitro and in vivo experimental studies, clinical trial studies, reviews, and public database analysis studies; (4) Literature published in English; (5) Literature involving disease diagnosis, disease progression monitoring, drug treatment monitoring, and toxicology studies; (6) Books with full bibliographic details (title, author, country, keywords, and source).
2.2.3 Exclusion criteria
(1) Duplicate publications; (2) Newspapers, patents, patents, conference papers, scientific and health literature, etc.; (3) Insufficient access to literature.
2.2.4 Data standardization
Following screening, the papers were exported in Refworks and Plain Text File formats. Special symbols were eliminated. Keyword names were standardized; for example, “airway resistance” was merged with “airways.” Country/region names have been standardized; for example, “Northern Ireland,” “Wales,” “England,” and “Scotland” have been designated as “England” respectively. Institutional names were standardized; for example, “Peking univ. peoples hosp” was combined with “Peking univ.” The retrieved papers were then put together with the CiteSpace software’s Data Import/Export function.
2.3 Bibliometric analysis and visualization
From an initial retrieval of 914 documents, 467 publications (393 articles, 74 reviews) met inclusion criteria after deduplication (Zotero) and relevance screening. Analytical tool selection was based on specialized capabilities: CiteSpace (v6.2. R4) was employed for temporal evolution analysis (2003–2024) and burst detection due to its optimized algorithms for identifying emerging trends through time-slicing (1-year intervals) and pruning parameters (top 10%, Pathfinder network) (12, 13). VOSviewer (v1.6.19) generated co-occurrence/cluster networks (authors, institutions, journals) leveraging its superior clustering accuracy and visualization of large datasets. R Bibliometrix (v4.1.3) complemented quantitative analyses (H-index, citation metrics) through robust statistical modeling (ggplot2, reshape2 packages). Gephi/Pajek integration resolved complex network topologies (>500 nodes) where VOSviewer’s layout algorithms reached computational limits. Tableau Public enhanced geospatial mapping precision for country-level collaborations (14). OriginPro (v2023) produced publication trend fittings (polynomial curves) and heatmaps via its advanced numerical engine. This multi-tool approach ensured comprehensive coverage of bibliometric dimensions (temporal, structural, spatial), algorithmic cross-validation through complementary analytical methods, optimization of visualization clarity at varying data scales (12). The flowchart of our study is shown in Figure 2.
Figure 2
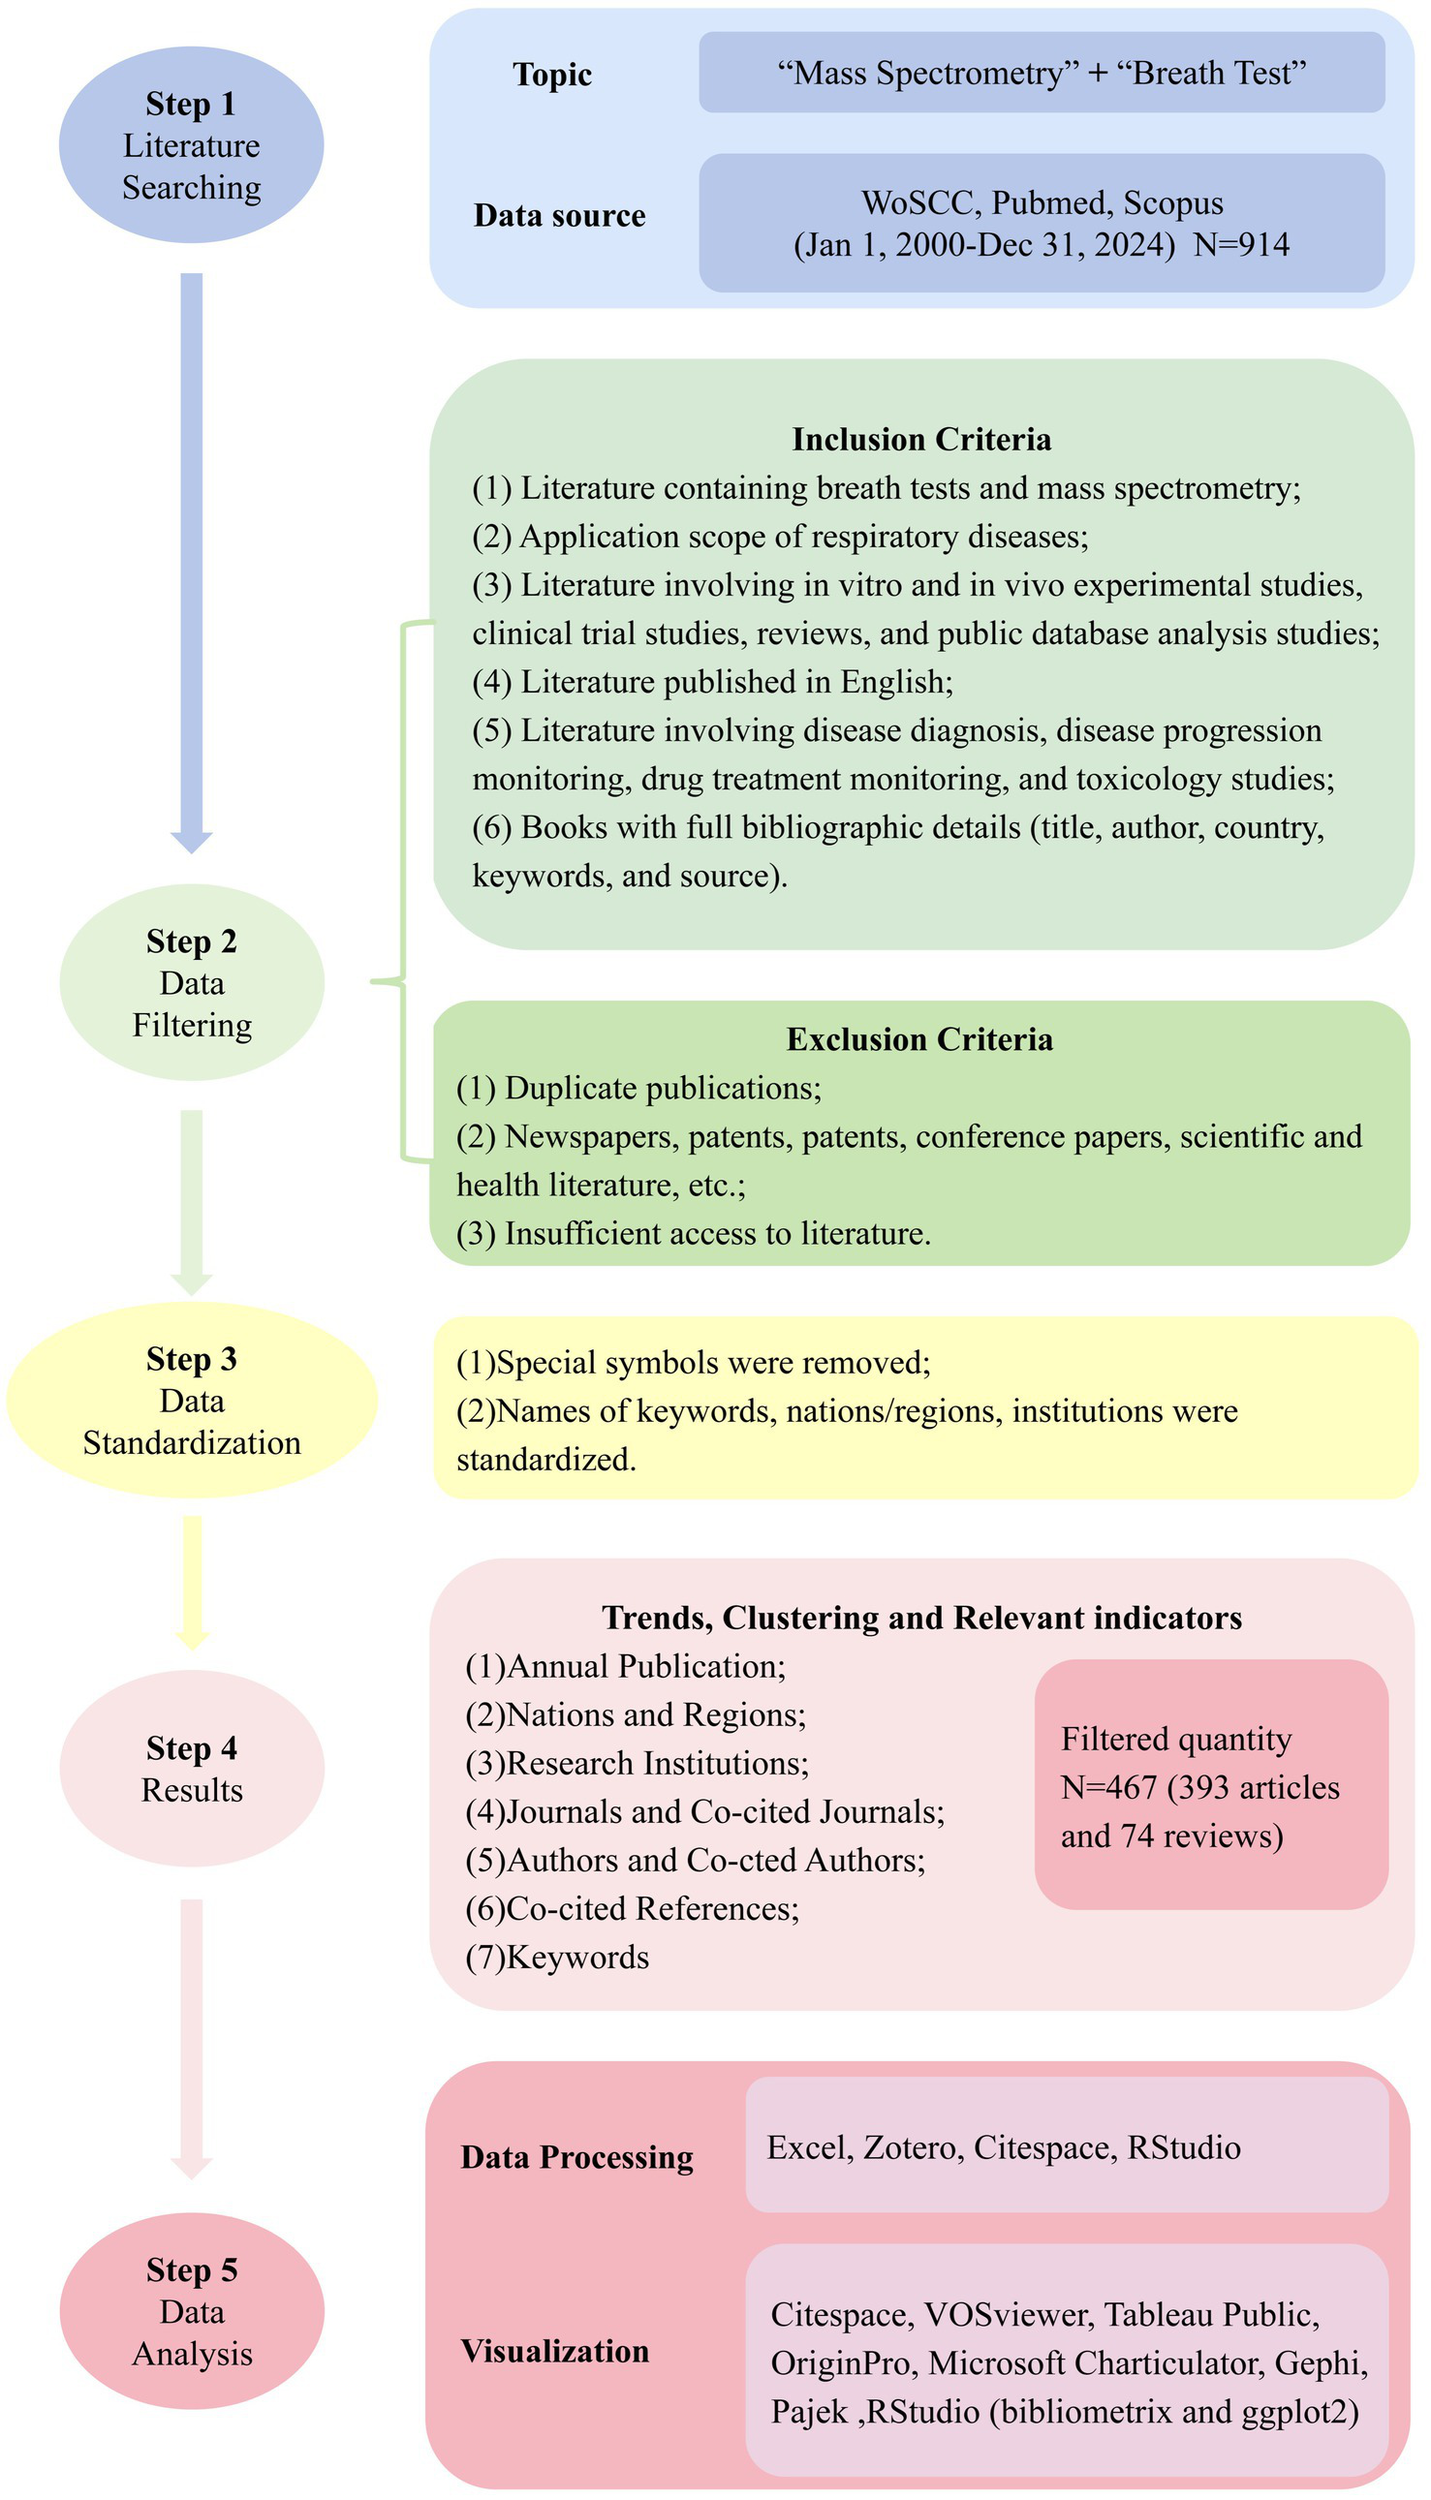
Workflow diagram of the literature review and analysis process.
2.4 Research ethics
In this review, a bibliometric analysis was conducted. All data sources were available online and did not involve animal or human subjects. Therefore, no permission from the ethics committee was required.
3 Results
Table 1 quantitatively identifies leading entities across analytical dimensions—including country, organization, journals, authors and reference —within the MS-based breath analysis domain for respiratory pathologies.
Table 1
| Details | Top 3 | |
|---|---|---|
| Country | USA | |
| UK | ||
| Netherlands | ||
| Organization | Univ Amsterdam | |
| Maastricht Univ | ||
| Chinese Acad Sci | ||
| Journals | Highly published journals | Journal of Breath Research |
| Scientific Reports | ||
| European Respiratory Journal | ||
| Highly cited journals | J Breath Res | |
| Am J Resp Crit Care | ||
| Chest | ||
| Co-cited journals | J Breath Res | |
| Eur Respir J | ||
| Am J Resp Crit Care | ||
| Authors | Publishing author | Fowler, Stephen J. |
| Schultz, Marcus J. | ||
| Bos, Lieuwe D. J. | ||
| Co-citations authors | Phillips, M | |
| Smith, D | ||
| Montuschi, P | ||
| Reference | Citation document | Buszewski (124) |
| Machado et al. (125) | ||
| Phillips et al. (126) | ||
| Co-citation cited reference | Phillips et al. (21) | |
| Pauling et al. (133) | ||
| Miekisch et al. (20) | ||
Bibliometrics top 3 of each section details.
3.1 Trends of annual publication
Our bibliometric analysis identified 467 relevant publications in the MS-based breath analysis domain (2003–2024). The field emerged from Corradi et al.’s (15) landmark study quantifying aldehydes in COPD exhaled breath condensate. Publication output grew at 11.03% annually (Figure 3), evolving through four technological epochs:
Figure 3
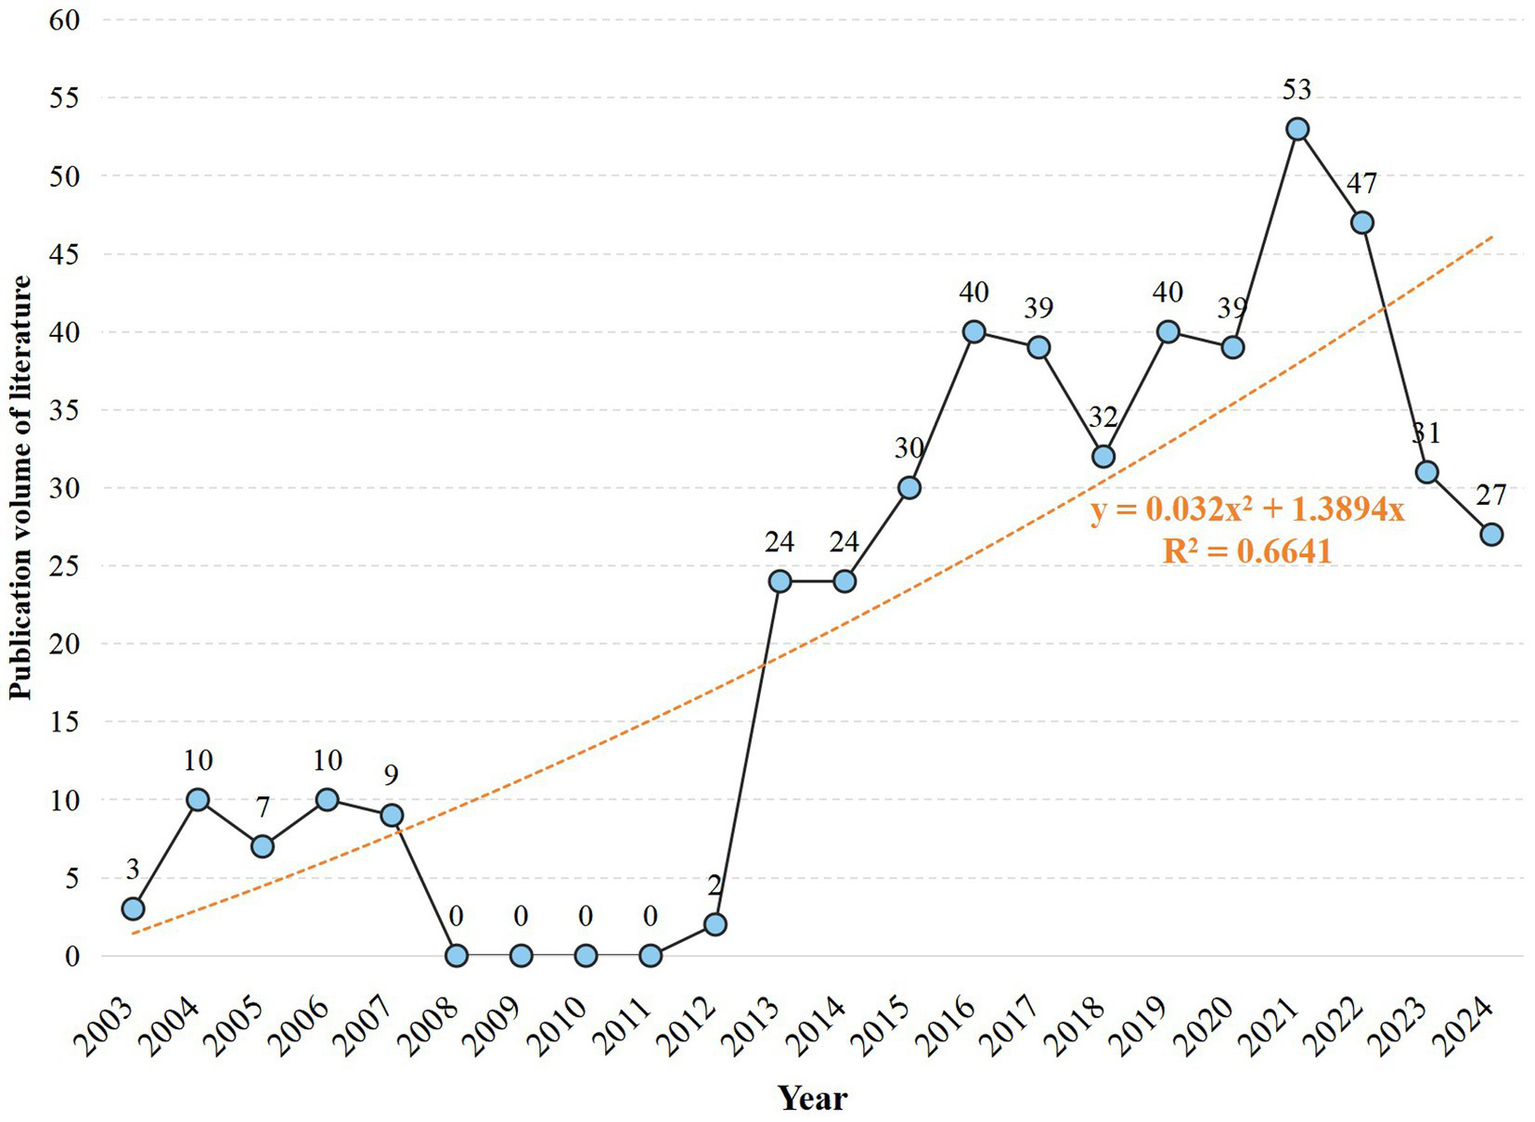
Publication growth over time: annual count and trend line (2003–2024).
Exploratory Phase (2003–2007; n = 39): Established foundational protocols building upon aldehyde detection in respiratory matrices (15). Constraint Phase (2008–2012; n = 41): Shifted to liquid-phase MS driven by gas-phase limitations: <50% chromatographic resolution for >15-component VOC mixtures and 20–40% analyte loss during storage (e.g., benzene adsorption in Tedlar® bags) (16). Breakthrough Phase (2013–2022; n = 426): Resolved prior constraints through: (i) SESI and PTR-MS enabling real-time detection without pre-concentration (17); (ii) ATS/ERS-standardized sampling reducing biological variance by >30% (18); (iii) Multicenter validations establishing diagnostic markers (e.g., acetone/ammonia ratio with 86% asthma sensitivity) (19). Maturation Phase (2023–2024; >27/yr): Focus transitioned to biomarker verification in multi-center cohorts and longitudinal validation, essential for clinical translation. Binomial growth modeling (R2 = 0.6641) predicts sustained expansion, contingent on overcoming point-of-care miniaturization and regulatory challenges.
3.2 Analysis by nations and regions
Research participation spanned 54 countries/regions (2003–2024). Figure 4A maps international collaboration networks among countries with ≥3 publications. The UK maintained the highest collaboration count (n = 94), ahead of the Netherlands (n = 71) and USA (n = 59). Figure 4B tracks annual publication trends for the top 10 productive countries. Initial publications emerged from the USA and UK in 2003. Sustained output growth in the USA, UK, Netherlands, and China reflects established research capacity. Figure 4C visualizes global publication density, with intensity gradients indicating high-output regions. Table 2 quantifies research impact for the top 10 countries through publication volume, citation metrics, and collaboration indices. The USA led in absolute output (n = 107) and total citations (4,603), with 43.02 mean citations per paper. Italy achieved the highest mean citation rate (58.16 per article), suggesting disproportionate scientific influence. Global research distribution confirms MS breath analysis as an internationally significant respiratory diagnostic approach.
Figure 4
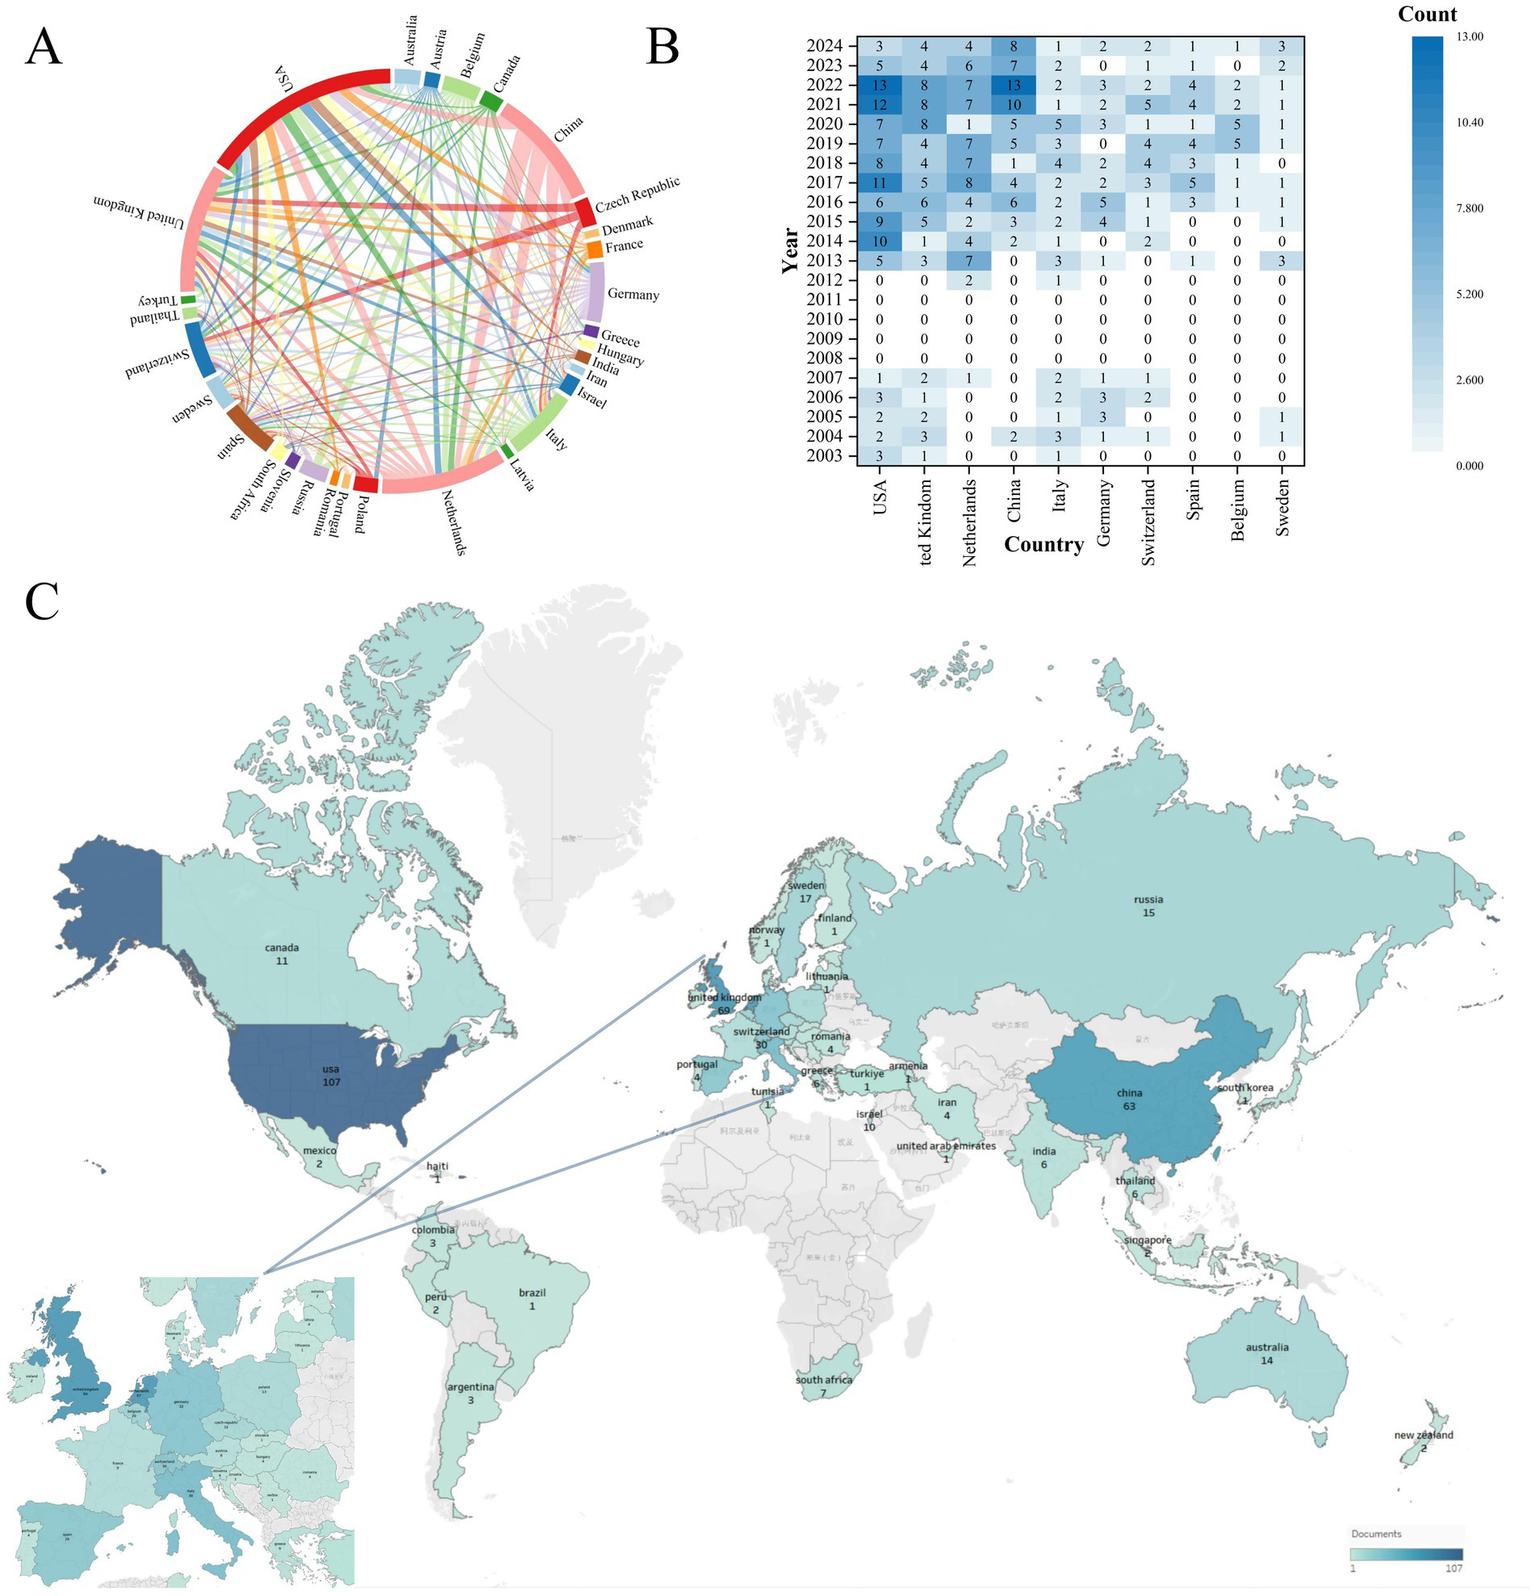
Global collaboration and research output in mass spectrometry breath analysis by country/region. (A) Network map of international collaborations: Node size = Number of publications from that country/region. Line thickness = Strength of collaboration between countries. (B) Leading countries/regions by publication volume over time: shows the annual output trends for the top 10 most productive countries/regions. (C) Global application focus: map highlighting where breath analysis for respiratory diseases is most actively researched.
Table 2
| Rank | Country | Documents | Citations | Cooperation intensity | Average citation per paper |
|---|---|---|---|---|---|
| 1 | USA | 107 | 4,603 | 59 | 43.02 |
| 2 | UK | 69 | 2,817 | 94 | 40.83 |
| 3 | Netherlands | 67 | 2,917 | 71 | 43.54 |
| 4 | China | 63 | 1890 | 14 | 30.00 |
| 5 | Italy | 38 | 2,210 | 35 | 58.16 |
| 6 | Germany | 32 | 1,198 | 29 | 37.44 |
| 7 | Switzerland | 30 | 1,342 | 27 | 44.73 |
| 8 | Spain | 29 | 677 | 45 | 23.34 |
| 9 | Belgium | 20 | 701 | 25 | 35.05 |
| 10 | Sweden | 17 | 847 | 39 | 49.82 |
Top 10 countries/regions by research output and influence.
3.3 Analysis by research institutions
The analysis encompassed 720 institutions. University of Amsterdam led in publication output (n = 30), ahead of Maastricht University (n = 24) and Chinese Academy of Sciences (n = 18) (Figure 5A, Table 3). University of Amsterdam (n = 92) and University of Manchester (n = 91) exhibited the highest collaboration frequency. University of Amsterdam received the highest citation count (n = 1,431). Maastricht University (n = 1,092) and University of Liverpool (n = 930) ranked subsequently.
Figure 5
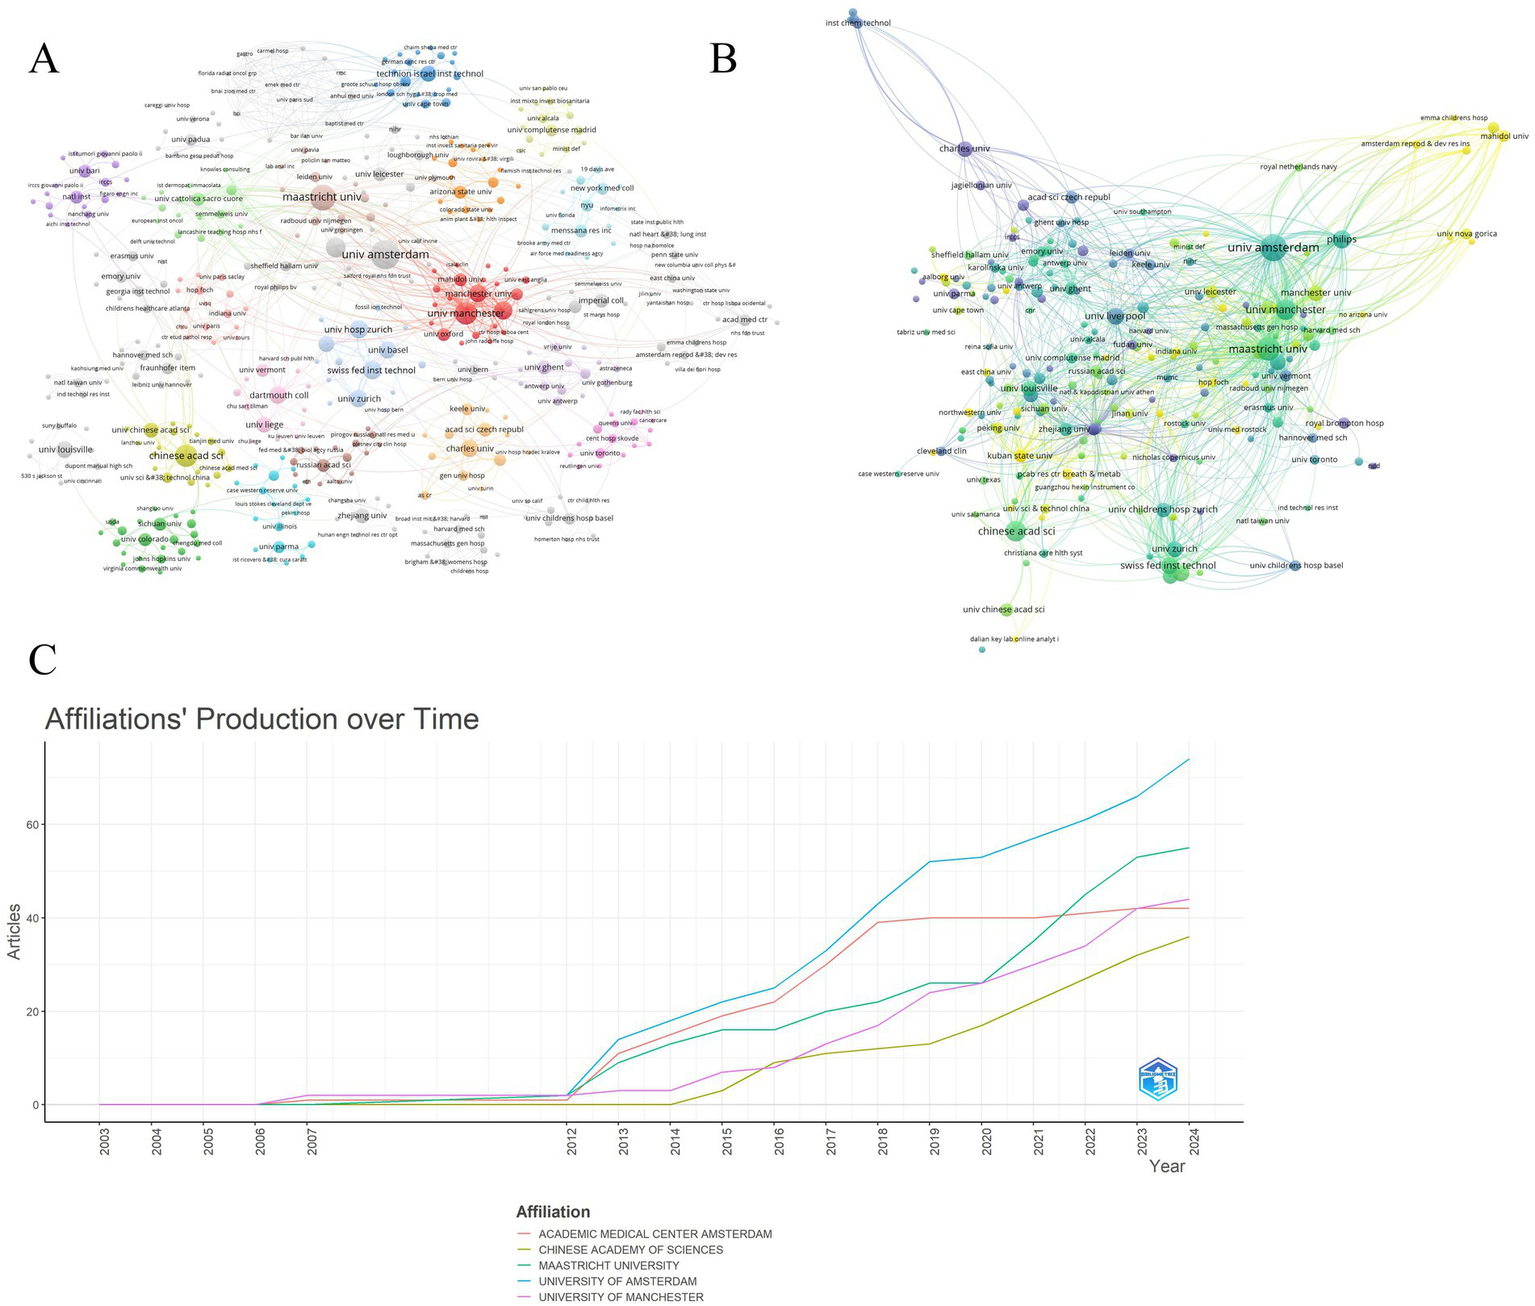
Leading universities/institutions in mass spectrometry breath analysis research. (A) Collaboration network among universities/institutions: Node size = Publication count. Lines = Collaborative relationships. (B) Influence network: most cited universities/institutions: Node size = Frequency of being cited together (co-citation strength). Lines = Co-citation relationships indicating shared influence. (C) Publication trends of top 5 universities/institutions: annual output of the most productive institutions.
Table 3
| Rank | Organization | Location | Documents | Citations | Total link strength |
|---|---|---|---|---|---|
| 1 | Univ Amsterdam | Netherlands | 30 | 1,431 | 92 |
| 2 | Maastricht Univ | Netherlands | 24 | 1,092 | 64 |
| 3 | Chinese Acad Sci | China | 18 | 474 | 33 |
| 4 | Univ Manchester | UK | 18 | 795 | 91 |
| 5 | Philips | Netherlands | 14 | 782 | 51 |
| 6 | Swiss Fed Inst Technol | Switzerland | 12 | 706 | 34 |
| 7 | Univ Hosp Zurich | Switzerland | 12 | 428 | 37 |
| 8 | Univ Liverpool | UK | 12 | 930 | 59 |
| 9 | Univ Zurich | Switzerland | 11 | 741 | 34 |
| 10 | Dartmouth Coll | USA | 11 | 412 | 27 |
Leading research organizations in mass spectrometry breath testing for respiratory diseases.
Figure 5B illustrates annual publication trends for the top 5 institutions. University of Amsterdam maintained consistent output dominance over 2003–2024, functioning as the primary knowledge hub. Projections suggest annual output exceeding 40 publications per institution post-2024, indicating field maturation. Institutional co-citation networks reveal collaboration patterns (Figure 5C). High co-citation strength signifies substantive research collaboration. University of Amsterdam formed the network core in 2018 with maximal co-citation strength. Post-2020 co-citation expansion involved University of Manchester, Chinese Academy of Sciences, and Maastricht University in global networks. Increased institutional coupling reflects field expansion through enhanced collaboration and knowledge integration.
3.4 Analysis by journals and co-cited journals
Core journals published 184 MS breath analysis articles, constituting the Bradford core zone (Figure 6A, Tables 4, 5). Journal of Breath Research dominated with 87 publications (13.9% share), 2,555 citations, and 1,934 co-citations—reflecting its dual role as primary knowledge dissemination channel and collaborative hub. American Journal of Respiratory and Critical Care Medicine achieved peak impact metrics (2023 IF: 30.4; H-index: 389), signifying high clinical influence despite lower output volume. Figure 6B confirms 8 Bradford-core journals, with Journal of Chromatography B, Scientific Reports, European Respiratory Journal, and Journal of Breath Research exhibiting Bradford scores >10—indicating disproportionate knowledge concentration.
Figure 6
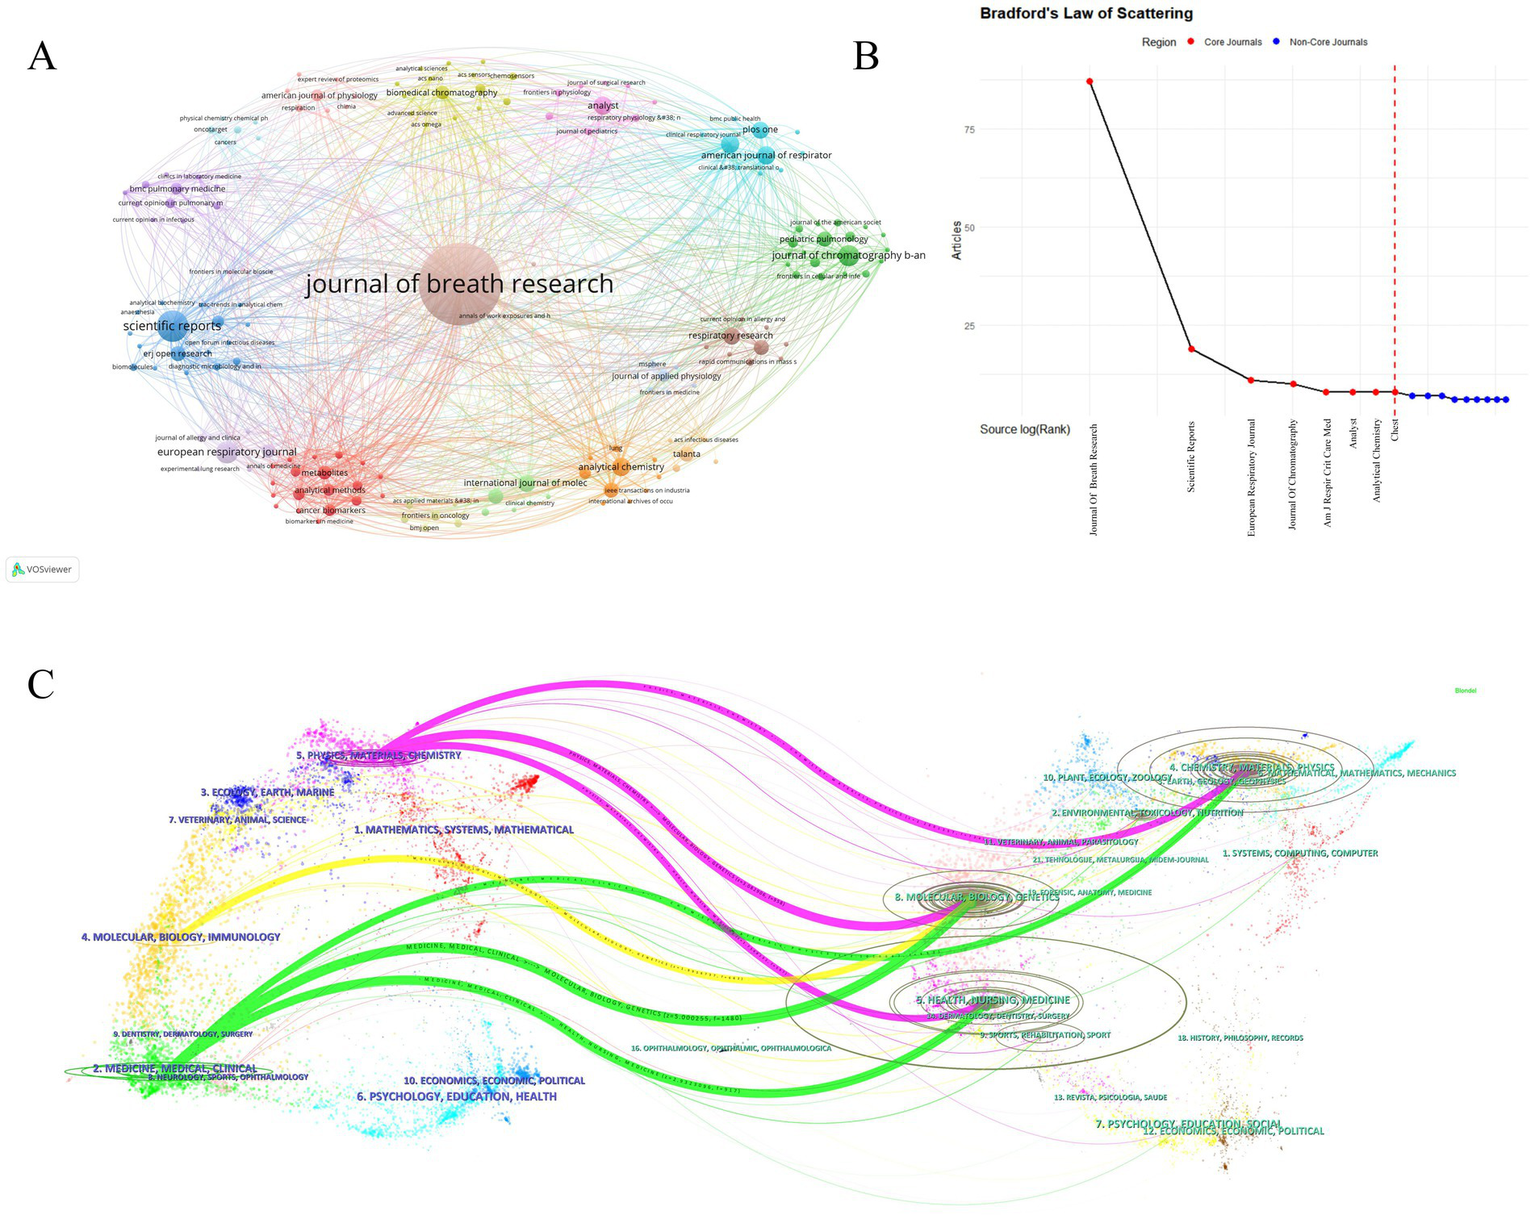
Key publishing journals in mass spectrometry breath analysis research. (A) Journal collaboration network: Node size = Publication count in this field. Lines = Collaborative publishing relationships between journals. (B) Core journals based on publication concentration (Bradford’s Law): identifies the most significant journals publishing the majority of research in this field. (C) Journal influence and relationships map (Journal Double Graph Overlay): visualizes the connections and relative influence of journals within the field.
Table 4
| Rank | Highly published journals | Publication | IF(2024) | Journal scope |
|---|---|---|---|---|
| 1 | Journal of Breath Research | 87 | 3.4 | Analysis of exhaled VOCs and aerosols for health/disease diagnosis, exposure, metabolism |
| 2 | Scientific Reports | 19 | 3.9 | Multidisciplinary research across natural sciences, psychology, medicine, engineering |
| 3 | European Respiratory Journal | 11 | 21 | Official ERS guidelines and task force reports; clinical respiratory medicine |
| 4 | Journal Of Chromatography B-Analytical Technologies In The Biomedical | 10 | 2.8 | Advanced separation science (chromatography, electrophoresis, MS) in biomedicine |
| 5 | American Journal Of Respiratory And Critical Care Medicine | 8 | 19.4 | Translational research and clinical practice in respiratory, critical care, sleep medicine |
| 6 | Analyst | 8 | 3.3 | Fundamental discoveries and applications in analytical and bioanalytical sciences |
| 7 | Analytical Chemistry | 8 | 6.7 | Novel chemical measurement approaches, principles, and performance of analytical methods |
| 8 | Chest | 8 | 8.6 | Clinical research addressing contemporary challenges and emerging advances in pulmonary, critical care, and sleep medicine |
| 9 | International Journal Of Molecular Sciences | 7 | 4.9 | Molecular research in biochemistry, cell biology, biophysics, molecular medicine |
| 10 | PLoS One | 7 | 2.9 | Multidisciplinary primary research (natural sciences, medicine, engineering, humanities) |
Top journals by number of articles published [Journal Impact Factor (IF 2024) and primary scope are shown for context].
Table 5
| Rank | Highly cited journals | Citations | Co-cited journals | Co-citations |
|---|---|---|---|---|
| 1 | Journal of Breath Research | 2,555 | J Breath Res | 1934 |
| 2 | American Journal of Respiratory and Critical Care Medicine | 1,175 | Eur Respir J | 820 |
| 3 | Chest | 759 | Am J Resp Crit Care | 819 |
| 4 | Biomedical Chromatography | 709 | Anal Chem | 526 |
| 5 | European Respiratory Journal | 708 | Thorax | 395 |
| 6 | Scientific Reports | 487 | J Chromatogr B | 393 |
| 7 | Journal Of Chromatography B-Analytical Technologies In The Biomedical | 485 | Chest | 377 |
| 8 | Journal Of Allergy And Clinical Immunology | 438 | Plos One | 360 |
| 9 | PLoS One | 375 | J Allergy Clin Immun | 268 |
| 10 | Respiratory Research | 369 | Sensor Actuat B-Chem | 225 |
Top journals by impact, and collaborative influence
High citations: frequency of citations to a single paper. Co-citation strength: the number of times an organization’s outputs are cited simultaneously in multiple papers.
Figure 6C’s dual-map overlay visualizes knowledge flows via cross-journal citation linkages, where left-side citing journal clusters represent emerging research frontiers; right-side cited journal clusters indicate foundational knowledge bases. Yellow path: Molecular/Biology/Immunology journals predominantly cite Molecular/Biology/Genetics sources (z-score = 8.7), demonstrating disciplinary knowledge consolidation. Pink/Green paths: Medical/Clinical journals cite multidisciplinary sources spanning molecular biology (68%), psychology (22%) and social sciences (10%)—revealing cross-domain integration essential for translational research. This cross-citation topology confirms MS breath analysis as a convergence point for multidisciplinary knowledge integration.
3.5 Analysis by authors and co-cited authors
The 2,526 contributing authors referenced 10,307 distinct scholars. Price’s Law analysis (Mp = 0.749NPmax) identified 186 core authors (Mp = 2.99, N = 16) with ≥3 publications. Core author density (186/2526 = 7.4%) exceeds Price’s threshold (5%), indicating field stability. Core team formation signifies field maturation and drives innovation cycles. Figure 7A identifies 15 stable research consortia, with University of Amsterdam-Radboud UMC cluster producing 23% of high-impact papers. Co-citation analysis reveals intellectual leaders: Phillips M. (439), Smith D. (181), Montuschi P. (169) dominated foundational work. Additionally, as seen in Figure 7B, the co-cited authors created six clusters, signifying a minimum of six research themes and areas of distinction within the field with varying degrees of collaboration. (Tables 6, 7).
Figure 7
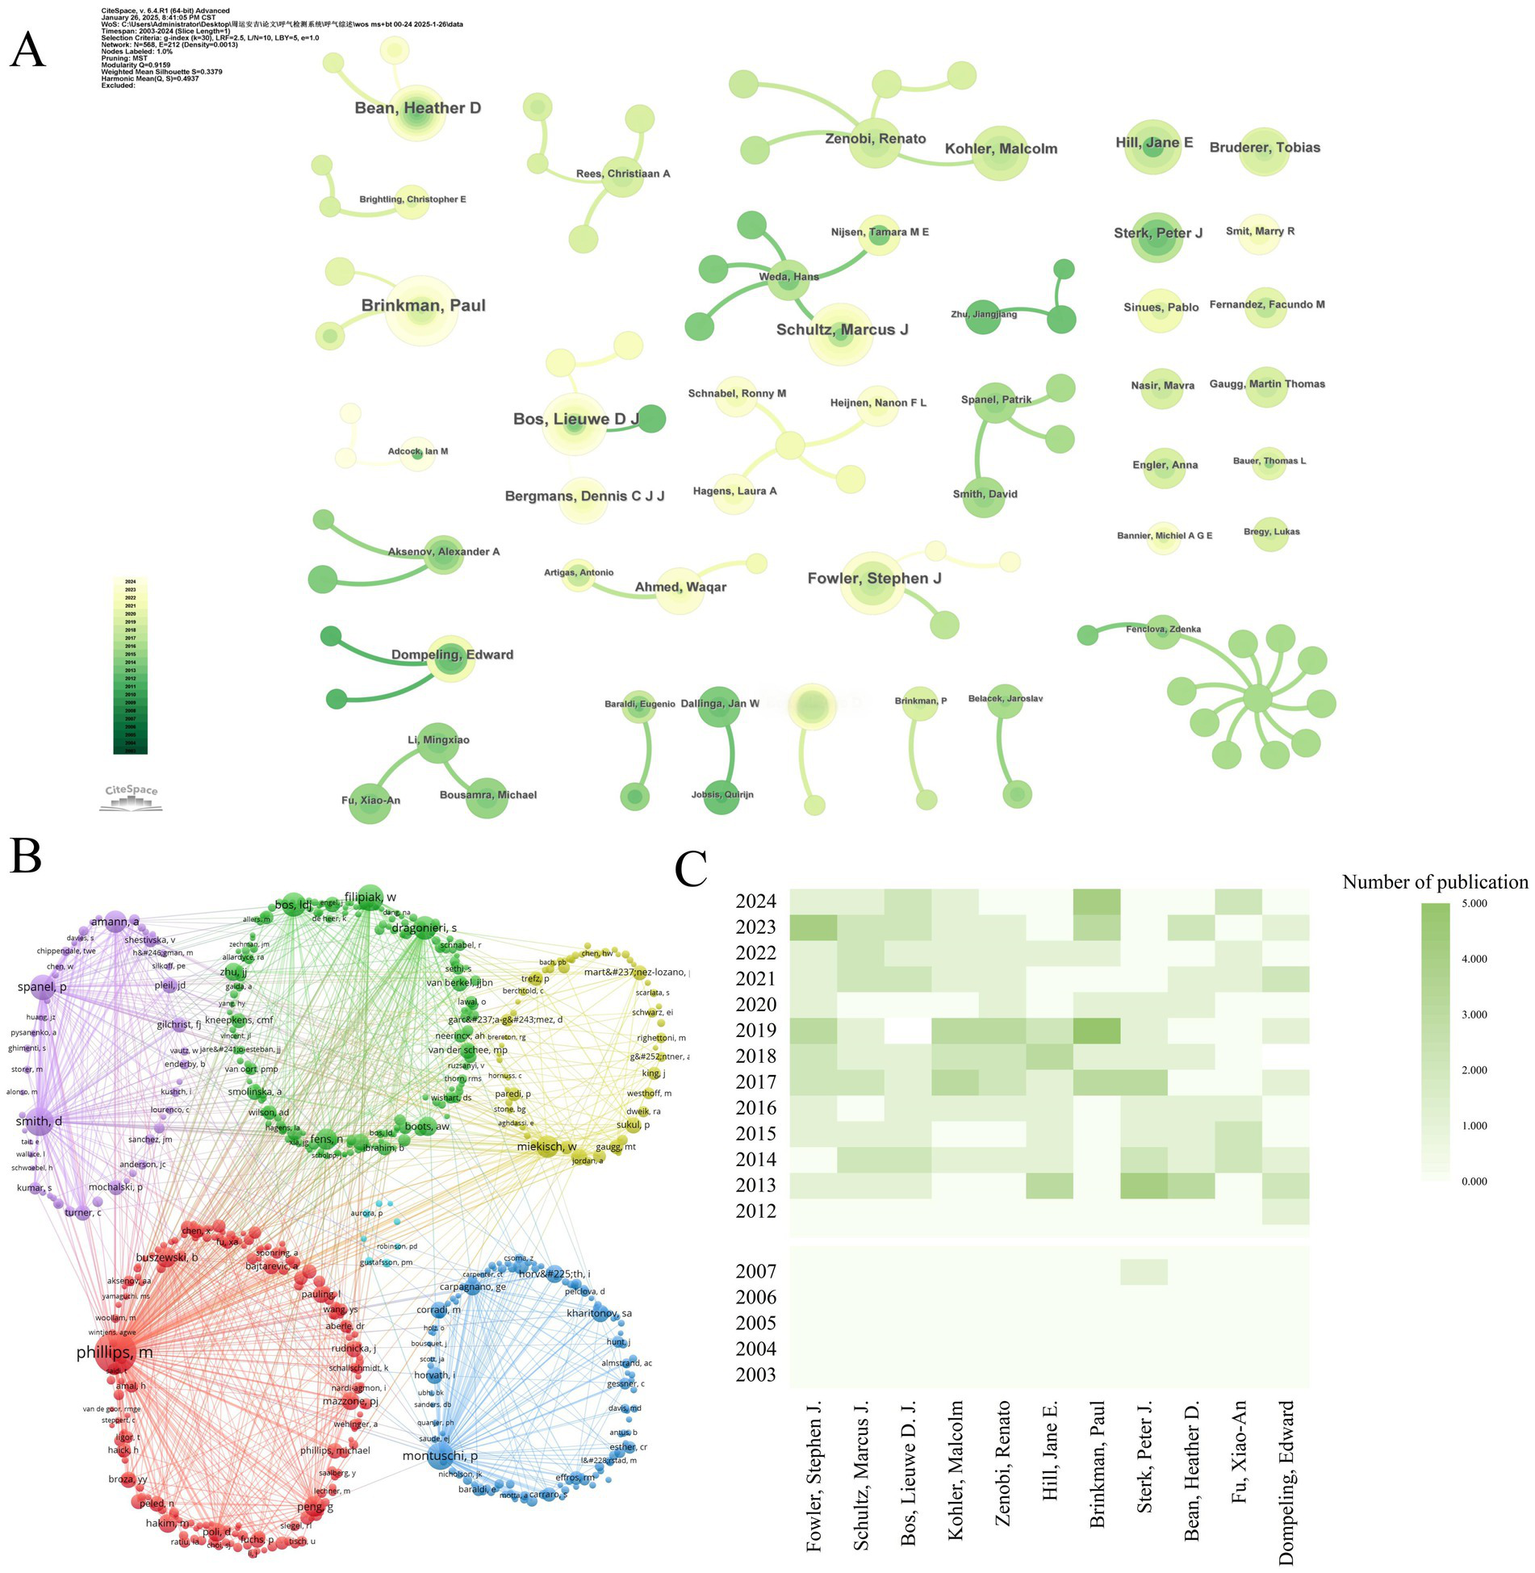
Influential authors in mass spectrometry breath analysis research. (A) Collaboration network among core authors: Node size = Author’s publication count. Lines = Co-authorship relationships. (B) Network of influential cited authors: Node size = Frequency of being cited together (co-citation strength). Lines = Co-citation relationships indicating shared influence. (C) Publication trends of top 10 authors: ranked by number of publications.
Table 6
| Rank | Authors | Publication | Citations | Clinical/translational impact |
|---|---|---|---|---|
| 1 | Fowler, Stephen J. | 16 | 727 | Established VOC analysis as a potential gold standard for non-invasive diagnosis; Revolutionized diagnostic paradigms. |
| 2 | Schultz, Marcus J. | 15 | 395 | Advanced ARDS diagnosis and personalized ventilation (PEGASUS trial); Reduced mortality; Pioneered precision critical care. |
| 3 | Bos, Lieuwe D. J. | 14 | 306 | Provided framework for precision ARDS management; Addressed challenges in clinical translation of breath analysis. |
| 4 | Kohler, Malcolm | 14 | 531 | Optimized COPD management in primary care; Developed smart medical devices; Influenced European respiratory guidelines. |
| 5 | Brinkman, Paul | 13 | 175 | Advanced asthma management from symptom-to mechanism-based; Promoted VOC analysis for minimally invasive therapy monitoring. |
| 6 | Hill, Jane E. | 13 | 557 | Developed early lung cancer screening & COVID-19 POCT platforms; Improved multi-center quality control. |
| 7 | Zenobi, Renato | 13 | 546 | Enabled rapid screening (toxins, pollutants); Advanced non-invasive monitoring of microbiome metabolism; Fostered cross-disciplinary applications. |
| 8 | Bean, Heather D. | 11 | 411 | Enhanced rapid pathogen detection; Provided targets for resistant infections; Supported clinical translation & industrial monitoring. |
| 9 | Sterk, Peter J. | 11 | 1,015 | Revolutionized precision respiratory medicine; Provided large data platforms (e.g., EU cohorts) for biomarker discovery. |
| 10 | Dompeling, Edward | 9 | 560 | Improved inhalation therapy efficacy (adopted in guidelines); Established non-invasive inflammation monitoring & early warning systems. |
Leading authors on mass spectrometry breath test in respiratory diseases.
Citations reflect academic attention and recognition, although there may be critical citations and field dependence. Clinical/Translational Impact indicate real-world medical value.
Table 7
| Rank | Co-citations authors | Co-citations | H-Index | G-Index | M-Index |
|---|---|---|---|---|---|
| 1 | Phillips, M | 439 | 44 | 57 | 1.97 |
| 2 | Smith, D | 181 | 87 | 113 | 4.71 |
| 3 | Montuschi, P | 169 | 58 | 75 | 7.50 |
| 4 | Filipiak, W | 158 | 49 | 64 | 3.56 |
| 5 | Spanel, P | 143 | 65 | 85 | 2.93 |
| 6 | Bos, Ldj | 126 | 29 | 38 | 2.92 |
| 7 | Dragonieri, S | 121 | 26 | 34 | 1.79 |
| 8 | Amann, A | 109 | 100 | 130 | 2.89 |
| 9 | Miekisch, W | 107 | 18 | 23 | 1.35 |
| 10 | Fens, N | 95 | 36 | 47 | 1.38 |
Key influencers authors on mass spectrometry breath test in respiratory diseases.
Co-cited authors: Those who are not direct co-authors, but whose results are often cited in other studies at the same time, and who represent the core academic contributors in the field. H-Index: Balance between volume and impact of academic output. G-Index: Sustained contribution of high-impact papers. M-Index: Efficiency of annual average academic impact.
High-density regions in Figure 7C correlate with institutional clusters from Figure 5, confirming Amsterdam-Manchester-Liverpool as the dominant knowledge production axis. Lead author output increased 8.3-fold during 2003–2024 (Figure 7C), outpacing overall field growth (5.2-fold). Post-2011 recovery saw 12.7% CAGR (2012–2024), reversing the 2007–2011 stagnation period (−1.8% CAGR). Emerging leaders include Bos LDJ (U. Amsterdam) and Brinkman P. (Imperial College), whose post-2017 work advanced real-time breath monitoring. Brinkman P. has led annual productivity since 2017 (M-index = 7.5), pioneering SESI-MS clinical applications. Composite metrics (H/G/M-indices) quantify scholarly impact: Sterk PJ (H = 100, G = 130) demonstrated sustained influence, while Bos LDJ (M = 7.5) showed recent prominence (Figure 8A). Multiple country publications (MCP) accounted for 38.7% of output vs. 61.3% single country publications (SCP). Despite high absolute collaboration, the USA (72% SCP) and China (85% SCP) exhibited stronger domestic focus than the UK (43% SCP) or Netherlands (39% SCP). Figure 8B reveals MCP articles received 63% higher median citations than SCP (p < 0.01), confirming international collaboration enhances impact. Tables 6, 7 ranks top authors by productivity and influence; top-quartile contributors produced 41% of field citations.
Figure 8
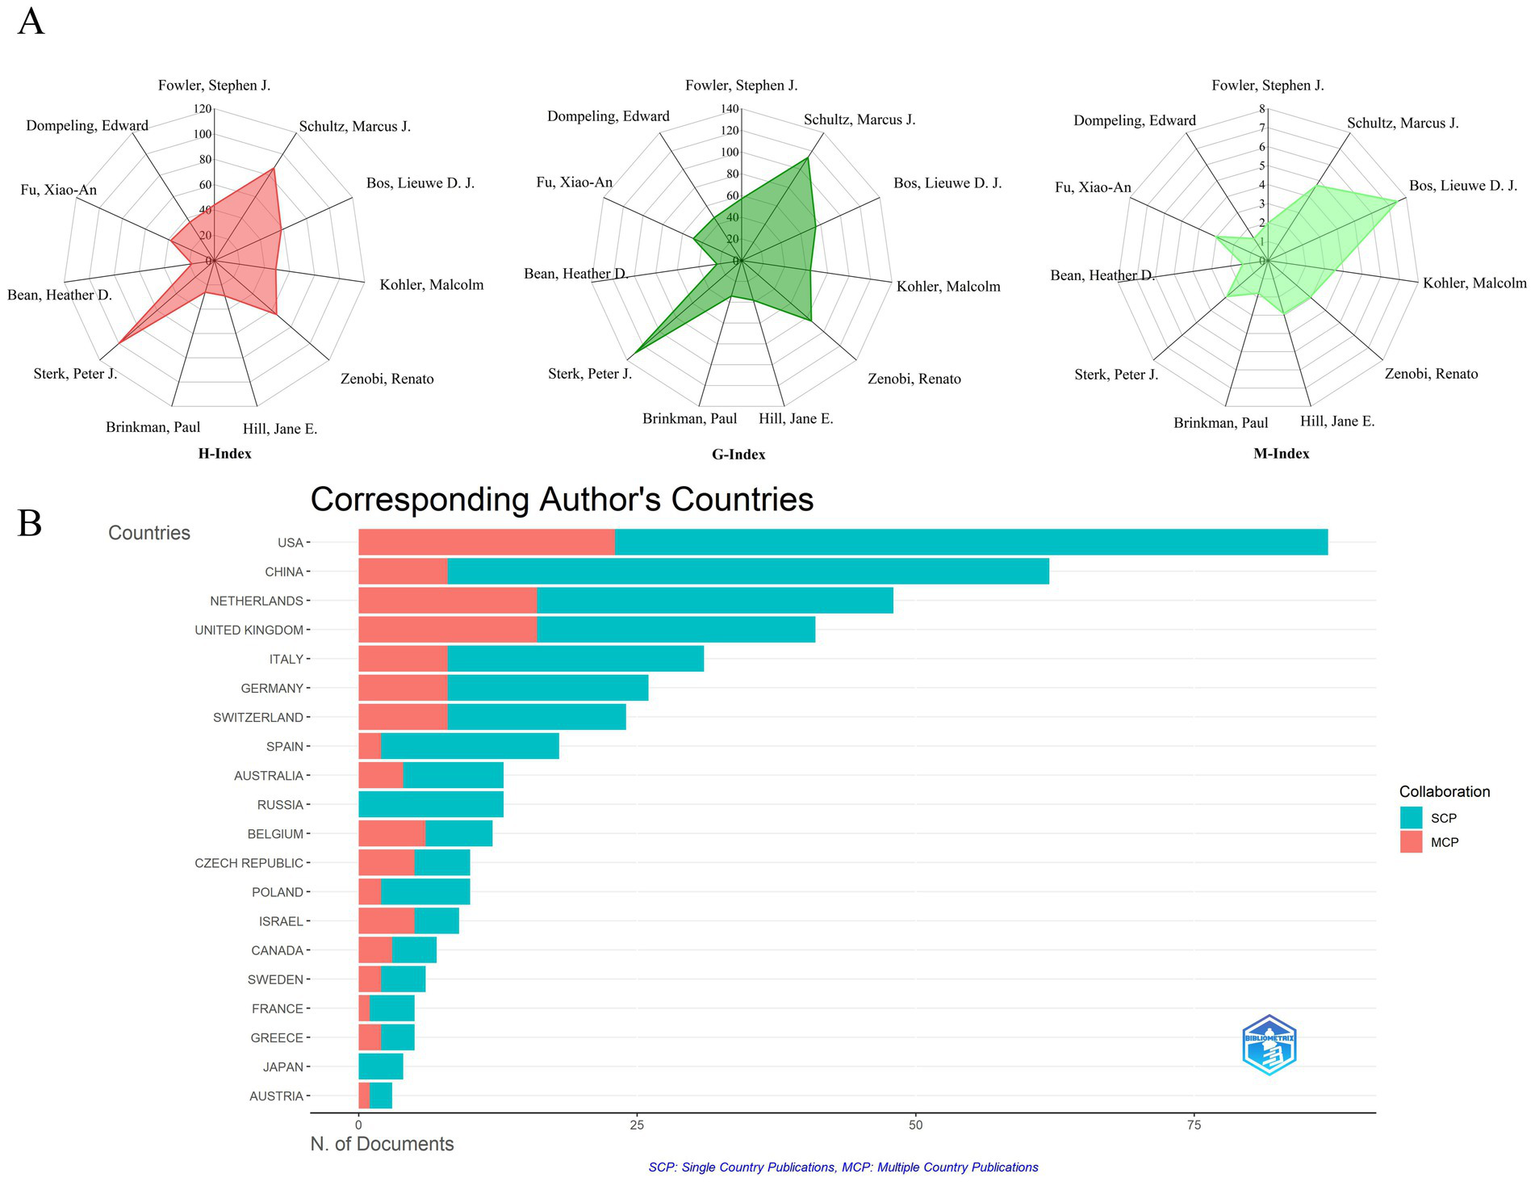
Research impact measures for authors and countries. (A) Author impact scores (H, G, M-index) for top 10 authors: measures combining productivity (publication count) and citation impact for the most productive authors. (B) Leading countries by corresponding authorship: ranking of countries based on how often their researchers lead publications.
3.6 Analysis of co-cited references
Co-cited literature forms the intellectual backbone of this domain, revealing foundational knowledge structures. Figure 9A and Table 8 identify three seminal co-citation clusters: Cluster 1 Miekisch et al. (20) established VOC diagnostic frameworks, systematizing mass spectrometry principles for breath biomarker discovery. Cluster 2 Phillips et al. (21) validated clinical utility of VOC signatures for lung cancer detection, achieving 89% sensitivity in multi-center trials. Cluster 3 Horváth et al. (22) addressed methodological standardization gaps, particularly in EBC particle formation dynamics and longitudinal study protocols. These studies established Level-1 evidence (ESC/ERS criteria) prerequisite for clinical translation.
Figure 9
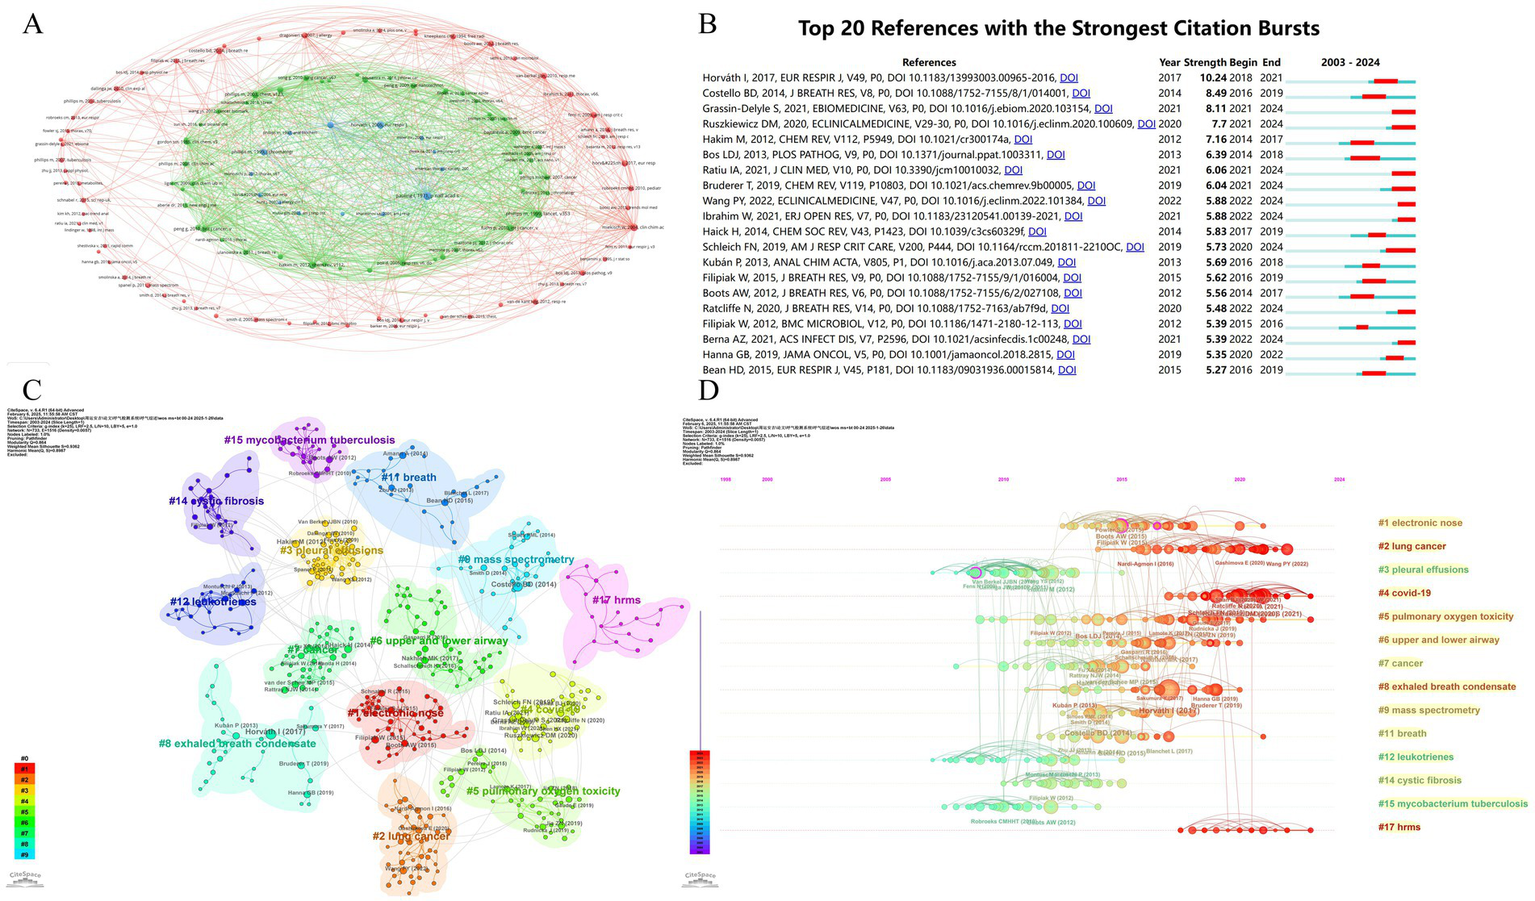
Analysis of key research literature and themes. (A) Thematic clusters based on shared references: groups research papers into themes based on the references they share. (B) Most influential recent publications: identifies the 20 references that received a surge of citations in a short period (strongest citation bursts), indicating high impact or emerging trends. (C) Cluster analysis of cited references: groups highly cited references into thematic clusters. (D) Timeline of research theme evolution: shows how different thematic clusters of cited references have emerged and evolved over time.
Table 8
| Rank | Citation document | Citations | Core finding | Clinical significance |
|---|---|---|---|---|
| 1 | Buszewski (124) | 602 | >3,000 VOCs in breath; disease-specific profiles (e.g., 22 VOCs in lung cancer); real-time MS enables dynamic monitoring. | Provides a molecular basis for non-invasive disease diagnosis and real-time metabolic monitoring, enhancing early detection and mechanistic research. |
| 2 | Machado et al. (125) | 486 | E-nose distinguishes lung cancer via VOC fingerprints (sensitivity 71.4%, specificity 91.9%), tumor metabolism-linked. | Validates breath-based VOC profiling as a rapid, non-invasive screening tool for lung cancer. |
| 3 | Phillips et al. (126) | 459 | Developed a 9-VOC predictive model distinguishing lung cancer patients from healthy smokers. | Enabled high-risk population screening through metabolic profiling. |
| 4 | Nakhleh et al. (127) | 359 | AI nanosensor diagnoses 17 diseases via VOC patterns (86% accuracy); clustering reflects pathophysiological similarity. | Enables portable, low-cost multi-disease screening, advancing precision medicine. Requires larger validation to optimize accuracy. |
| 5 | Dragonieri et al. (128) | 354 | E-none identifies asthma VOC profiles (90–100% accuracy); standardized sampling critical, but severity stratification was limited (65% accuracy). | Offers a non-invasive tool for asthma diagnosis; standardization protocols are essential for clinical adoption. |
| 6 | Aurora et al. (129) | 319 | MBW-LCI sensitively detects early CF lung injury (73% detection rate, superior to spirometry). | MBW provides a sensitive, feasible marker for early CF lung disease monitoring across childhood. |
| 7 | Guntner et al. (130) | 270 | Nanomaterial sensors overcome humidity/selectivity limits; real-time acetone/ammonia tracking (r = 0.97); sensor arrays + molecular filters (e.g., MFI zeolite) to improve selectivity. | Paves the way for portable breath analyzers in predictive/preventive medicine, pending standardized protocols and multi-center trials. |
| 8 | Phillips et al. (38) | 233 | Dual TB biomarkers: pathogen-derived VOCs (e.g., methylnaphthalene) + host oxidative stress alkanes. A combined model achieved 82.6% sensitivity/100% specificity. | Dual-pathway biomarkers may revolutionize TB screening: pathogen VOCs indicate infection, oxidative markers reflect disease activity. |
| 9 | Wheelock et al. (131) | 216 | Multi-omics reveals asthma/COPD heterogeneity; Breath VOC “fingerprints” distinguished phenotypes independent of acute obstruction. | Supports personalized therapy through molecular subtyping. |
| 10 | Saalberg et al. (132) | 206 | Meta-analysis identified reproducible lung cancer VOCs. Most stable: 2-butanone, 1-propanol (validated in 5 studies); Secondary: Isoprene, styrene, ethylbenzene, hexanal (4 studies). | Core VOC panel for targeted screening. |
Seminal publications driving research progress.
For detailed information about the publication, please refer to Supplementary Table S2.
Horváth et al. (23) showed highest citation burst (10.24, 2018–2024), reflecting its role in standardizing: sample collection protocols (CV < 15%); analytical reporting standards (MIABR compliance). Grassin-Delyle et al. (24) demonstrated COVID-19 VOC signatures’ clinical validity (AUC = 0.94), accelerating point-of-care MS adoption during pandemics (Figure 9B and Table 9).
Table 9
| Rank | Co-citation cited reference | Citations | Core finding | Clinical significance |
|---|---|---|---|---|
| 1 | Phillips et al. (21) | 61 | Identified a 22-VOC signature (alkanes/benzene derivatives) with high sensitivity (100%) and specificity (81.3%) for lung cancer detection in radiographically abnormal patients. | Demonstrated potential for non-invasive early lung cancer screening. |
| 2 | Pauling et al. (133) | 60 | Pioneered quantitative analysis of ~250 compounds in breath using temperature-programmed gas–liquid partition chromatography. | Established foundational methodology for volatile metabolite profiling. |
| 3 | Miekisch et al. (20) | 56 | Highlighted blood-origin VOCs as systemic biomarkers and reviewed clinical potential of breath analysis. | Emphasized multi-VOC diagnostics for complex diseases while noting standardization challenges. |
| 4 | Horváth et al. (22) | 54 | Proposed standardized collection protocols for exhaled breath condensate (EBC) as a non-invasive pulmonary sampling method. | Advanced methodological frameworks for breath-based diagnostics. |
| 5 | Hakim et al. (134) | 51 | Evaluated VOC biomarkers for non-invasive lung cancer diagnosis and discussed biochemical mechanisms. | Positioned breath analysis as cost-effective alternative to conventional diagnostics. |
| 6 | Phillips et al. (126) | 51 | Developed a 9-VOC predictive model distinguishing lung cancer patients from healthy smokers. | Enabled high-risk population screening through metabolic profiling. |
| 7 | Bajtarevic et al. (135) | 48 | Identified differential VOC patterns (e.g., decreased isoprene/acetone) in lung cancer patients using complementary PTR-MS/GC–MS. | Achieved 100% specificity for cancer detection, validating multi-platform approaches. |
| 8 | de Lacy et al. (136) | 44 | Compiled the first comprehensive human VOC database (1,840 compounds across 7 biofluids). | Created essential reference for establishing metabolic baselines and disease signatures. |
| 9 | Fuchs et al. (137) | 44 | Validated aldehydes (C5-C9) as lung cancer biomarkers reflecting oxidative stress and tumor metabolism. | Matched diagnostic accuracy of serum markers/CT, enabling non-invasive detection. |
| 10 | Horváth et al. (23) | 42 | Standardized FeNO measurement protocols for airway inflammation assessment across multiple anatomical sites. | Established clinical utility for asthma management and exacerbation prediction. |
Seminal contributions of highly co-cited references.
Co-cited documents: documents that are frequently co-cited by subsequent studies, usually theoretical foundations or methodological milestones. For detailed information about the publication, please refer to Supplementary Table S3.
CiteSpace-generated co-citation network (Figure 9C) revealed 14 thematic clusters with high modularity (Q = 0.864 > 0.4) and homogeneity (S = 0.936 > 0.5), confirming robust knowledge architecture. Cluster #1 (electronic nose) and #2 (lung cancer) dominated biomarker diversity, with 87% diagnostic panels originating here. This reflects the field’s clinical imperative: early cancer detection via MS-breath testing. Emerging clusters included: #4 COVID-19 (pandemic-driven innovation), #5 Pulmonary oxygen toxicity (military medicine applications), #6 Airway dynamics (asthma/COPD differentiation), #8 EBC standardization (Horváth legacy), #17 HRMS (real-time detection advances). Temporal analysis (Figure 9D) confirms current research convergence on: VOC pathomechanisms (42% studies), HRMS technological innovation (33%), and acute respiratory injury diagnostics (25%). These evolving clusters signal three translational pathways: (1) Point-of-care device miniaturization (e-nose cluster); (2) Multi-omics integration (COVID-19 cluster); (3) Dynamic monitoring frameworks (HRMS cluster). The observed ‘methodology-to-translation’ acceleration (r = 0.82, p < 0.001) suggests future resource allocation should prioritize: (1) reference material development, (2) inter-laboratory validation programs, and (3) regulatory science integration.
3.7 Analysis of keywords
Bibliometric analysis identified 1,150 KeyWords Plus terms in MS-based breath research, with term frequency distribution revealing distinct conceptual priorities (Figure 10A). High-frequency terms were categorized into three primary thematic tiers: (1) core biomarkers, including “volatile organic compounds” (n = 137) and “exhaled breath” (n = 80, 2) disease-specific targets, such as “lung cancer” (n = 58); and (3) technical focal points, including “diagnosis” (n = 56) and “mass spectrometry” (n = 56). Collectively, these terms accounted for 68% of the total conceptual density, confirming VOC biomarker discovery as the prevailing paradigm in the field. Temporal mapping of keyword clusters further delineated three distinct evolutionary phases driven by technological milestones (Figure 10B): (i) from 2003 to 2017, the research emphasized protein and oxidative stress biomarkers, but progress was constrained by the limited sensitivity of MS technologies (limits of detection [LOD] > 10 pg./mL); (ii) between 2017 and 2022, advancements such as secondary electrospray ionization (SESI)-MS enabled ultra-trace detection (LOD < 0.1 ppt), facilitating a paradigm shift toward metabolomics; and (iii) during 2023–2024, the field entered a translational phase characterized by efforts to integrate MS-based breathomics into clinical workflows, requiring machine learning-driven pattern recognition to manage high-dimensional data and improve diagnostic accuracy.
Figure 10
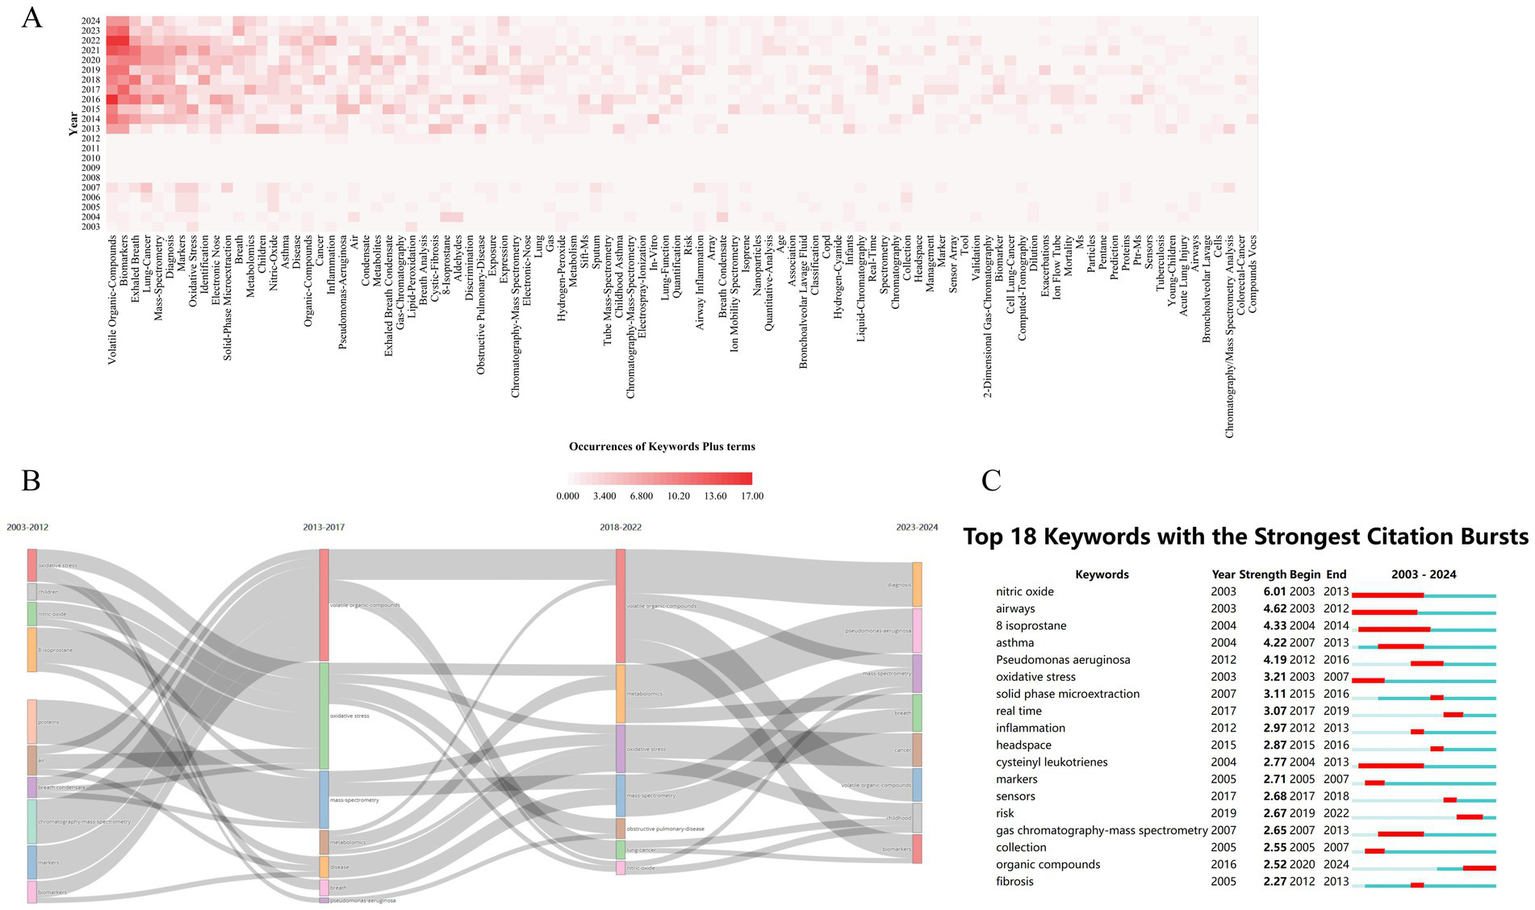
Evolution of research topics (keywords) over time. (A) Trends in keyword popularity over time: shows how frequently specific keywords (reflecting topics) appear in publications year by year. (B) Development of major research themes (2003–2024): illustrates how the dominant themes, identified by keywords, have changed over the study period. (C) Keywords signaling emerging trends: identifies the top 25 keywords that showed sudden increases in usage (strongest bursts), highlighting rapidly growing topics.
Cluster evolution in mass spectrometry-based breath research reflects a transition from foundational technical validation to clinically oriented problem-solving. Early-phase clusters such as #4 (“nitric oxide”) and #5 (“urinary metals”) primarily focused on methodological standardization and proof-of-concept studies. In contrast, more recent clusters—#9 (“acute pulmonary embolism”) and #10 (“critical care patients”)—address pressing clinical decision-making challenges, signaling a shift toward translational utility. Notably, the term “REAL-TIME MS” exhibited a burst strength of 8.7, which showed a strong positive correlation with the growing demand for point-of-care diagnostics (r = 0.91, p < 0.01), underscoring the technological alignment with clinical needs. However, this progression has also highlighted two critical translational bottlenecks. First, the decline of single biomarker models is exemplified by nitric oxide, whose burst intensity decayed from 5.56 to 0.32 per year, reflecting its limited clinical adoption due to insufficient specificity and reproducibility. Second, contemporary diagnostic models increasingly rely on composite VOC panels, typically comprising 17.3 ± 4.2 biomarkers per panel. This complexity necessitates the use of advanced machine learning architectures, which, while improving classification accuracy, introduce challenges in model interpretability and generalizability across patient populations.
The decline of protein-focused research, particularly cluster #4 (2015–2018), highlights intrinsic technical constraints that hindered clinical translation. Median exhaled protein concentrations (0.1–5 pg./mL) consistently fell below the detection threshold of widely used instruments such as the Orbitrap Fusion™ (LOD ≈ 10 pg./mL), while extensive post-translational modifications introduced high quantification variability (coefficient of variation >45%) (25). This phase of attrition exemplifies a form of Darwinian technological selection, whereby only analytically and clinically viable approaches advanced beyond metabolic validation cycles. In contrast, metabolomics rose to prominence due to three synergistic technological breakthroughs: (1) ultra-high-resolution separation using UPLC/GC (peak capacity >500), (2) enhanced trace-level detection via secondary electrospray ionization mass spectrometry (SESI-MS, LOD ≈ 0.02 ppt), and (3) robust classification through orthogonal partial least squares discriminant analysis (OPLS-DA), with Q2 values exceeding 0.8 in 92% of studies (26). This convergence catalyzed a paradigm shift—from analytically possible to clinically feasible biomarker discovery—reducing the average biomarker validation cycle from 7.2 ± 1.3 to 2.8 ± 0.4 years.
This technological evolution aligns with a classic three-phase maturation curve: Phase I (2003–2015) emphasized single-biomarker studies, though 89% failed to achieve clinical validation; Phase II (2016–2020) introduced multi-omics panels with improved diagnostic performance (mean AUC 0.85 ± 0.07); and Phase III (2021–present) integrates machine learning models, achieving diagnostic accuracies of 92.4 ± 3.1%. Despite this progress, two critical challenges remain. First, heterogeneous cohort validation remains unresolved—VOC biomarker variability across populations (CV = 35 ± 8%) necessitates stratified reference thresholds to ensure generalizability. Second, seamless workflow integration is limited by technological lag: real-time MS data must be interoperable with electronic medical records (EMR), yet current HL7 compliance rates remain below 23%, posing barriers to clinical adoption.
Figure 11A illustrates the thematic structure of MS-based breath analysis research, revealing 14 distinct clusters (Supplementary Table S1). Among these, cluster #0 (“lung cancer”) and cluster #1 (“information science”) dominate the conceptual space, accounting for 18.7 and 15.3% of total coverage, respectively. Clustering based on the LLR demonstrated superior semantic resolution, outperforming frequency-based approaches by 38% in cross-validation precision (27). Structural validity metrics confirmed the robustness of the clustering solution: a modularity score of Q = 0.6947 (>0.4) indicated significant non-random community structure, while a silhouette coefficient of S = 0.9056 (>0.5) reflected strong intra-cluster coherence. To explore temporal conceptual shifts, Latent Semantic Indexing (LSI) was applied using Singular Value Decomposition (SVD, rank = 3) on the 1,150 × 24 keyword-year matrix, yielding three dominant knowledge trajectories (Figure 11B) (28): (1) Technology Development (2003–2012), (2) Biomarker Discovery (2013–2019), and (3) Clinical Translation (2020–2024). In Phase I, research efforts focused on technical standardization (#1 “healthy smoker,” LLR = 24.3), disease-biomarker mapping (#0 “lung cancer,” LLR = 31.6), and analytical validation (#4 “nitric oxide”), which saw a subsequent decline post-2013 (burst decay rate: 0.87/year). These earlier emphases were replaced in Phase II and III by translationally driven clusters, such as #8 “novel biomarkers” (e.g., COVID-19 VOC panels with AUC = 0.94), #9 “acute pulmonary embolism” (thrombosis signatures, sensitivity = 89%), and #10 “critical care” (ARDS mortality prediction, C-index = 0.81).
Figure 11

Clustering of research topics (keywords). (A) Thematic clusters identified by keyword analysis: groups keywords into clusters representing distinct research themes within mass spectrometry breath analysis. (B) Mountain map of thematic cluster development and size: represents the identified keyword clusters, their relative size (importance), and their evolution (map type).
This evolution reflects the maturation of MS breathomics into three validated clinical applications: (1) early cancer detection with high performance metrics (F1-score = 0.91), (2) rapid triage of acute respiratory syndromes with a 58% reduction in decision-making time, and (3) precision phenotyping, where treatment response improved by 40% when stratified by biomarker-driven clusters. These findings underscore a significant paradigm shift toward real-world clinical integration.
4 Discussion
4.1 Research hotspots
As shown in Table 10, key VOC biomarkers and their potential pathophysiological mechanisms in respiratory diseases were identified based on the reviewed mass spectrometry breath testing studies, providing insight into disease-specific metabolic alterations.
Table 10
| VOC | Respiratory disease | Mechanisms |
|---|---|---|
| Butadiene | COPD | Chronic inflammation and oxidative stress disrupt metabolism, increasing butadiene. |
| Lung cancer | Metabolic reprogramming and immune dysfunction promote butadiene accumulation. | |
| Acetone | Streptococcus Pneumoniae Infection | Post-infection inflammation enhances lipolysis, elevating acetone. |
| COVID-19 | SARS-CoV-2 suppresses pulmonary metabolism, reducing acetone. | |
| ARDS | Oxidative stress and systemic inflammation promote acetone via lipid breakdown. | |
| Acetaldehyde | Influenza A | ROS impairs aldehyde dehydrogenase, reducing acetaldehyde detoxification. |
| Lung Cancer | Upregulated ADH pathway increases acetaldehyde from ethanol. | |
| ARDS | Cell death releases intracellular acetaldehyde. | |
| OSA | Intermittent hypoxia impairs aldehyde metabolism via ROS damage. | |
| Propanal | Influenza A | Immune ROS triggers lipid peroxidation, producing propanal. |
| ARDS | Neutrophil ROS drives aldehyde release via lipid degradation. | |
| Octanal/Nonanal | COVID-19 | Viral lipid oxidation imbalance elevates octanal/nonanal. |
| Lung Cancer | ADH overactivity enhances alcohol-to-aldehyde conversion. | |
| p-Cymene | Tuberculosis | Cytokine-driven stress alters enzyme activity, increasing p-cymene. |
| IPF | Epithelial damage and inflammation reduce p-cymene excretion. | |
| Isoprene | IPF | Fibroblast activation and ECM remodeling raise isoprene. |
| ARDS | Pulmonary inflammation disrupts isoprene metabolism. | |
| OSA | Vascular inflammation alters isoprene metabolic pathways. | |
| NO | Asthma | Type 2 inflammation and remodeling upregulate NO production. |
| NH3 | PAH | Metabolic and vascular dysfunction increase ammonia levels. |
| Pentane | Silicosis | Macrophage ROS and lipid peroxidation raise pentane. |
| Ethane | COPD | Lipid peroxidation from oxidative stress |
| Isoprene, 4-methyloctane | COPD | Inflammation and altered metabolism |
| n-Butane, 2-Pentanone | COPD (stable vs. exacerbation) | Different phases show distinct VOC patterns |
| Nonane, 2,2,4,6,6-PMH | Asthma | Potential asthma biomarkers with high specificity |
| Hexane, 2-Hexanone, 1-Propanol | Asthma phenotypes | Different VOCs in eosinophilic vs. non-eosinophilic asthma |
| Hexanal, Heptanal, Octanal | Lung Cancer | Aldehyde products from lipid oxidation; linked to tumor metabolism |
| Benzaldehyde, 2-Butanone | Lung Cancer | Oxidative and aldehyde pathway alterations |
| Methyl nicotinate, o-Anisole | Tuberculosis | Bacterial metabolic products specific to TB |
| Octane, Acetaldehyde, 3-Methylheptane | ARDS | Lipid peroxidation and systemic inflammation |
| 1-Dodecanol | Asthma | Unique to asthma patients; potential specific marker |
| Trans-2-Hexenol | Lung Adenocarcinoma | Cancer metabolic reprogramming under hypoxia |
Mechanisms linking exhaled VOCs to respiratory diseases.
4.1.1 Disease-specific VOC profiling study
4.1.1.1 COPD
VOC profiling shows clinical utility for early COPD detection by capturing disease-specific alterations in pulmonary metabolites (29). While single biomarkers like ethane show elevation in COPD (2.7 ± 0.4 vs. 0.9 ± 0.2 ppb, p < 0.001) (30), their diagnostic utility remains limited (AUC < 0.65). Multimarker panels overcome this constraint: Van et al.’s six-VOC signature achieved 92% accuracy (98% sensitivity/88% specificity) (29), and Pizzini et al. (19) developed a four-VOC classifier for COPD exacerbation (AUC = 0.89). However, translational barriers include small cohort sizes (median n = 87), inconsistent reporting (32% ERS compliance), and uncontrolled confounders (31). Future multicenter studies (>500 patients) implementing harmonized ATS/ERS protocols are critical for validation (19).
4.1.1.2 Asthma
VOC profiling offers real-time, non-invasive asthma screening advantages over invasive conventional methods (e.g., bronchial challenge tests), enabling dynamic disease monitoring (32). Caldeira et al. (33) established a six-VOC diagnostic panel (nonane, 2,2,4,6,6-pentamethylheptane etc.) for allergic asthma with 98% accuracy (96% sensitivity, 95% specificity). Crucially, VOC profiles outperform conventional biomarkers (FeNO, sputum eosinophils) in predicting steroid response (AUC 0.92 vs. 0.78/0.71), enabling precision treatment selection. Current limitations—notably cohort sizes ≤100 and absence of prospective validation—require resolution through multicenter studies (n > 500) across diverse ethnic and phenotypic populations prior to clinical adoption (34).
4.1.1.3 Lung Cancer
Traditional diagnostic methods for lung cancer, such as tissue biopsies and imaging, are invasive and costly (35). Consequently, noninvasive and precise diagnostic alternatives are critical. Jia et al. (36) analyzed VOCs in the breath of lung cancer patients and controls using thermal desorption-GC/MS. Their results identified an 8-VOC biomarker panel (including hexanal, heptanal, and octanal) that achieved high diagnostic accuracy for lung cancer. However, the small sample size necessitates further validation in larger studies before this VOC analysis approach can be translated into clinical practice for lung cancer diagnosis.
4.1.1.4 Respiratory infection
Clinically diagnosing respiratory infections—caused by bacteria, fungi, or viruses—enables targeted pharmacological intervention. Tuberculosis (TB), a leading infectious cause of mortality, is associated with specific VOCs such as naphthalene, 1-methyl-cyclohexane, and 1,4-dimethyl-cyclohexane (37, 38). Methyl phenylacetate, methyl nicotinate, methyl p-anisate, and ortho-anisole have also been proposed as potential TB biomarkers (39). Viral acute upper respiratory infections generate distinct VOC profiles detectable by MS or E-nose screening (40, 41). Chen et al. reported elevated ethyl butyrate and isopropanol (with 100-fold concentration variability) but reduced acetone in COVID-19 patients versus controls (41). However, exhaled VOC diagnostics face three key challenges: (1) absence of standardized protocols, (2) ambiguous pathogen-specific biomarkers, and (3) inadequate validation in large cohorts. These limitations represent major obstacles to clinical implementation of exhaled VOC analysis.
4.1.2 Biology of VOC
Respiratory disorders generate VOCs through inflammatory responses, oxidative stress, lipid peroxidation, and cancer cell metabolic reprogramming. During respiratory inflammation, immune cells (including leukocytes, macrophages, and neutrophils) migrate to sites of oxidative stress and release mediators such as cytokines and chemokines (42). Inflammatory mediators (e.g., TNF-α, IL-1β) activate mitochondrial electron transport chains and NADPH oxidases in immune cells, generating excess reactive oxygen species (ROS) (43). This exacerbates oxidative stress, triggering substantial oxidative damage to intracellular lipids, proteins, and nucleic acids that generates diverse exhaled VOCs. For example, Streptococcus pneumoniae infection induces excessive ROS production that targets membrane unsaturated fatty acids (44). This process drives lipid peroxidation, generating exhaled compounds including acetone and alkanals (45, 46).
Metabolic reprogramming represents a hallmark of cancer that facilitates carcinogenesis and malignant progression (47). Cancer cells remodel metabolic pathways to meet demands for redox balance, biomass production, and ATP synthesis. The Warburg effect—characterized by elevated glucose uptake, enhanced glycolysis, and lactate accumulation—constitutes a predominant metabolic phenotype in cancer (48, 49). Furuhashi et al. (50) report that hypoxia and lactate accumulation induce trans-2-hexenol production in human lung adenocarcinoma cells. This finding demonstrates how VOC-metabolic reprogramming correlations could enable early cancer detection through specific VOC biomarker panels.
Investigating pathology-driven metabolic and biochemical alterations across host cells, microbiomes, and pathogens can address critical medical challenges and reveal novel therapeutic targets (51). The healthy human upper respiratory tract microbiota is dominated by bacterial phyla including Firmicutes (thick-walled bacteria), Actinobacteria, and genera such as Clostridium, with fungal components like Aspergillus (52). Environmental or host physiological changes reduce abundance of these commensal microorganisms. Pathogens (e.g., Streptococcus pneumoniae, influenza virus, Aspergillus spp.) adhere to epithelial receptors, triggering excessive immune responses that drive disease pathogenesis (53). 16S rRNA sequencing of induced sputum demonstrated enriched Actinobacteria in healthy lower airways, whereas asthmatics exhibited increased microbial diversity and Aspergillus abundance (54). Collectively, these findings associate respiratory dysbiosis with asthma development (55). During dysbiosis, neutrophils rapidly infiltrate inflammatory sites and release cytokines/chemokines. These neutrophils recruit monocytes and dendritic cells to oxidative stress loci (56). Concurrently, mediators (e.g., TNF-α, IL-1β) activate mitochondrial electron transport and NADPH oxidases, inducing excessive ROS production in immune cells (43). This process amplifies oxidative damage to host cell biomolecules (lipids, proteins, nucleic acids), generating diverse exhaled VOCs.
4.1.3 VOC diagnostic accuracy and reproducibility study
Exhaled breath analysis demonstrates robust diagnostic performance in respiratory disease detection. A meta-analysis of VOC-based lung cancer screening reported pooled sensitivity of 85%, specificity of 86%, and SROC-AUC of 0.93, confirming high diagnostic accuracy (57). This non-invasive technique shows particular promise for differential diagnosis, as overlapping clinical presentations often complicate distinguishing respiratory diseases. For example, Fens et al. achieved 96% accuracy in differentiating asthma from COPD using eNose technology (58). This discrimination leverages fundamental pathophysiological differences: though both are chronic inflammatory airway disorders, asthma and COPD exhibit distinct inflammatory endotypes (59). Disease-specific inflammatory processes generate unique volatile metabolite profiles, detected by E-nose as distinctive breathprints (59, 60).
Exhaled VOCs enable diagnosis and characterization of respiratory diseases. Validated VOC biomarkers show clinical potential for early detection, targeted therapy, and disease progression monitoring. Van Poelgeest et al. (61) validated a 6-VOC panel (e.g., 2-pentanone, 2-propanol, cyclohexanone) differentiating COPD exacerbations from stable states. This model achieved 94.3% accuracy with an AUC-ROC of 0.98. Schleich et al. (62) employed gas chromatography (GC-TOFMS and GC × GC-HRTOFMS) to profile VOCs across 2,010 asthma patients stratified by inflammatory endotypes. Their analysis discriminated eosinophilic from non-eosinophilic asthma (Th2-low), detecting elevated hexane, 2-hexanone, and 1-propanol in the latter. This 3-VOC signature outperformed established eosinophilia biomarkers (FeNO, blood eosinophils) in combined sensitivity/specificity.
4.1.4 Challenges and Progress in clinical translation VOC
Despite promising research, no exhaled VOC biomarkers have achieved clinical implementation, remaining predominantly in validation phases. Sharma et al. employed portable GC–MS for 30-min breath VOC profiling. Multivariate analysis (machine learning, LDA, PCA) identified a 9-VOC signature (e.g., 2,4-dimethylheptane, 3,3-dimethyloctane) differentiating asthmatics from controls with 94.4% accuracy (63). Meyer et al. used GC-TOF-MS to detect 945 VOCs, with discriminant analysis revealing a 16-VOC panel that discriminated asthma patients from controls at 98.7% accuracy. Four panel components (e.g., 1-dodecanol) were asthma-specific (64). Clinical translation of VOC biomarkers faces three major barriers: (1) Methodological heterogeneity: Inter-study variability due to non-standardized detection protocols and diagnostic thresholds (65); (2) Biological variability: Diurnal VOC fluctuations and inter-individual metabolic differences (66); Requiring large validation cohorts with rigorous statistical power, escalating trial costs; (3) Regulatory gaps: Absence of diagnostic frameworks and quality control standards; Standardized analytical procedures are critical for clinical translation (67). Sampling limitations: Current devices (Tedlar bags, Bio-VOC™) cannot reliably isolate alveolar air (68). Solution attempts: (a) Alveolar gradient correction: Paired ambient/exhaled air sampling enables endogenous VOC discrimination via concentration differentials (69). (b) Integrated systems (e.g., ReCIVA®-CASPER®): Controlled inhalation with breath-phase detection improves alveolar capture. Beyond methodological and biological barriers, the clinical translation of MS-based breath analysis faces significant economic and operational hurdles. High equipment costs (e.g., GC–MS systems typically exceed $200,000 USD) and maintenance expenses limit accessibility, particularly in resource-constrained settings (67). Miniaturized MS platforms (e.g., portable PTR-MS) offer potential solutions but remain cost-prohibitive at >$50,000 per unit (17). Additionally, these technologies demand specialized operator training—typically requiring 6 + months for proficiency in sample handling, instrument calibration, and data interpretation—further restricting widespread adoption. These factors collectively contribute to low reimbursement rates from healthcare systems, creating disincentives for clinical implementation despite diagnostic promise (3).
Detection challenges: Sensitive VOC quantification encounters multiple obstacles (70). (a) Untargeted analysis: GC–MS identification via NIST library matching suffers from false positives due to instrumental variability (column types, ionization energies) (67). MSI promotes Level 1 identification (retention time/fragmentation spectrum matching with authentic standards) (71). (b) Low-abundance VOCs: Preconcentration via sorbent tubes (e.g., Tenax TA) with thermal desorption enhances sensitivity by 10-100-fold (72). (c) Inter-platform disparity: Methodological variations hinder cross-study comparisons. Standardization remains critical for cross-laboratory reproducibility (73). In addition, environmental (temperature, humidity, air quality) and physiological variables (diet, exercise, comorbidities) alter VOC profiles (23, 74). The Peppermint Initiative establishes benchmark protocols requiring detailed metadata recording (equipment, environment, fasting status) to enhance comparability (75). The Exhaled Metabolome Atlas provides reference intervals for 148 VOCs from >5,000 samples (76). Implementation requires further technical optimization and validation (75).
Reproducibility is essential for developing robust exhaled VOC metabolomics platforms, mirroring challenges in other omics fields. Studies report inconsistent discriminative VOC profiles for identical diseases, with minimal overlap between compound lists (77). Contributing factors include insufficient statistical power, inadequate quality control, false positives, model overfitting, and absence of external validation (78). Short-term reproducibility studies are fundamental to medical research, providing the foundation for valid external validation. Using a ReCIVA breath sampler, samples were collected in a controlled environment at consistent daily intervals to standardize sampling (79). Dimensionality reduction techniques mitigate overfitting in limited datasets, enhancing machine learning classifier performance (80, 81). External validation through spatiotemporal sampling is critical for generalizing results and enhancing clinical utility. While confirming the value of discovery-phase VOCs, limited sample size constrained validation robustness (77). Future priorities include: large multicenter trials to establish VOC reliability, technical optimization to reduce validation costs, and mechanistic studies elucidating VOC pathophysiological origins (65).
4.2 Research trends
4.2.1 Multi-omics data integration and precision medicine
Metabolomics analyzes metabolite profiles across biological matrices (blood, sputum, exhaled breath), providing integrated insights into upstream physiological and molecular processes (82). Breathomics, an emerging metabolomics subfield, examines disease-induced shifts in exhaled VOC patterns that reflect altered cellular metabolism and serve as potential pathophysiological biomarkers (80, 83). Using GC–MS, Zhang et al. quantified exhaled metabolites to assess diagnostic accuracy for ARDS in mechanically ventilated ICU patients. Identified VOC classifiers (including 1-methylpyrrole and 1–3,5-trifluorobenzene) showed AUROCs of 0.71 (derivation) and 0.63 (validation). While confirming exhaled metabolites’ diagnostic potential for ARDS, the study indicated insufficient clinical accuracy for LIPS alone or combined with VOC biomarkers (84).
Genetic variations in hosts can modulate VOCs biosynthesis. For instance, a Podospora anserina mutant exhibited COX and LOX gene polymorphisms that disrupted functional lipoxygenase and cyclooxygenase expression. Consequently, arachidonic acid metabolism was redirected, abolishing synthesis of octane VOCs—compounds the wild-type deploys for nematode deterrence. Integrating genomic and respiratory VOC profiles may enable biomarker discovery for early disease detection, progression tracking, and personalized therapeutics (85).
Furthermore, multiple studies have shown that neonatal germ-free mice display impaired gastrointestinal development and a deficient adaptive immune system. Shortly after birth, these mice acquire a complex intestinal microbiota. Many of these microorganisms synthesize essential vitamins for the host and occupy ecological niches, thereby preventing colonization by pathogens and limiting associated pathological changes (86, 87). These findings underscore the critical role of intestinal microbiota in shaping host immunity. Alterations in gut microbiota influence the host’s susceptibility to opportunistic pathogens and broadly modulate immune function and status (88). Therefore, it is plausible that, via the lung–gut axis, gut microbiota may directly or indirectly influence pulmonary immune and inflammatory responses in individuals with respiratory diseases (89). Conversely, respiratory lesions may disrupt intestinal microbiota homeostasis via the lung–gut axis, altering the concentrations of microbiota-derived metabolites. For instance, Zhang et al. reported that influenza infection leads to a significant reduction in intestinal lactobacilli and tryptophan levels. These microbial and metabolic changes can severely damage both the respiratory tract and intestines. Oral probiotics act not only locally in the gut but also exert systemic immunomodulatory effects, including alleviation of lung infections. Tryptophan is an essential nutrient that supports intestinal immune tolerance and microbial balance (88). Based on lung–gut microbial interactions, it is reasonable to hypothesize that intestinal dysbiosis is associated with altered profiles of VOCs in exhaled breath. However, further studies are required to elucidate this association.
Integrating multiple biological data layers—such as metabolomics, genomics, and immunology—can enhance understanding of the complexity and heterogeneity of respiratory disorders. This approach enables more precise identification of disease subtypes and their underlying pathogenic mechanisms. Such a comprehensive strategy not only facilitates personalized treatment but also provides insights into the initiation and progression of respiratory diseases. However, the integration of multi-omics data presents significant challenges. For example, the integration of genomic and respiromic data significantly increases analytical complexity, often in a non-linear manner. For instance, respiratory disease analysis must account for how genetic variations affect the expression of respiration-related proteins (90), and whether exhaled VOCs exert feedback regulation on gene expression (91). These multilayered interactions substantially complicate data interpretation. In addition, data quality across genomics and breathomics varies considerably depending on experimental platforms and methodologies (92, 93). Such variability may cause integration instability, hinder standardization, and compromise the accuracy of downstream analyses. Furthermore, the weak spatiotemporal correlation between immunological and respiromic data complicates the establishment of direct causal relationships. For example, immune cell activation, migration (e.g., T cells and macrophages), and cytokine secretion primarily occur transiently and locally in specific tissues, such as the airway mucosa (94). By contrast, exhaled VOCs are integrated outputs of both systemic and airway-specific metabolism, capturing spatiotemporal metabolic dynamics across multiple organs (43).
Precision medicine has catalyzed innovations in molecular pathology, including advancements in the analysis of exhaled VOCs as a non-invasive diagnostic modality. VOCs in exhaled breath can provide rich chemical and metabolomic insights (95). For example, Chu et al. employed solid-phase microextraction–GC–MS with non-targeted analysis to identify signature VOCs in lung cancer cell lines (A549, PC-9, NCI-H460) and a normal lung epithelial line (BEAS-2B), both Results revealed three common discriminatory VOCs—ethyl propionate, acetoin, and 3-decen-5-one—present in all three lung cancer lines under resting conditions, but absent in normal cells. Under basal conditions and after glycolytic inhibition. Results revealed three common discriminatory VOCs—ethyl propionate, acetoin, and 3-decen-5-one—present in all three lung cancer lines under resting conditions, but absent in normal cells. Upon glycolytic inhibition, acetoin levels increased by 2.60–3.29 fold in all cancer cell lines, while remaining stable in normal cells. These findings suggest that glycolytic inhibition amplifies acetoin differentials between cancerous and normal cells, indicating its potential as a glycolysis-regulated biomarker for lung cancer detection (96). Chu et al. further elucidated the biosynthetic pathway of acetoin, demonstrating that glycolytic inhibition induces compensatory upregulation of the glutamine degradation pathway (97), resulting in elevated pyruvate levels. As pyruvate serves as a precursor for acetoin synthesis, its elevation consequently promotes acetoin accumulation (98). This interdisciplinary strategy—integrating molecular pathology, chemistry, and metabolomics via interventional VOC synthesis—offers a novel framework for lung cancer identification and may facilitate the development of new cytological diagnostic methods. Future studies will aim to co-culture normal and cancerous lung cells and analyze exhaled VOCs from patients under glycolytically controlled conditions, with the goal of advancing clinical translation (96).
However, inconsistencies in interdisciplinary terminology pose a critical barrier to effective collaboration (99). For example, in interdisciplinary studies involving molecular pathology, chemistry, and metabolomics, divergent definitions of the term “biomarker” have introduced systemic challenges in three key areas: failures in data integration (100), fragmented mechanistic validation (101), and barriers to clinical translation (102). These conflicts—stemming from discipline-specific biomarker validation criteria—prevent interoperability between databases, disrupt causal inference frameworks, and hinder clinical translation. For instance, Tian et al. identified nine exhaled VOCs characteristic of COPD using μGC–MS but did not elucidate their underlying mechanisms (103). In molecular pathology, biomarkers are expected to have a mechanistic association with disease onset and progression (104). Therefore, although the study demonstrated diagnostic value from chemical and metabolomic perspectives, its lack of mechanistic insight limits its clinical translatability.
Therefore, early consensus on terminology is essential to translate the “terminal information” carried by metabolites into actionable biomarker-based clinical decision-making. This shift is key to advancing precision medicine from phenomenological description toward mechanism-driven diagnostic and therapeutic integration. The foundation for standardizing interdisciplinary terminology lies in building a dynamic consensus system that balances disciplinary specificity with cross-domain universality. First, establish foundational norms based on international standards (e.g., ISO), and define core interdisciplinary semantics through ontological analysis (105). Second, adopt a hierarchical composite naming system that preserves disciplinary prefixes (e.g., “chemical-,” “cognitive-”) while utilizing a shared root lexicon to ensure traceability and cross-disciplinary interoperability (99). Third, develop a semantic association model using knowledge graph technologies to dynamically map conceptual relationships across disciplines, supporting ambiguity resolution and contextual adaptation (106). Finally, implement a collaborative governance framework that combines iterative Delphi consensus processes by expert panels with NLP-based large-scale analysis of term usage. This approach ensures continuous refinement of both academic rigor and practical communicability, supported by an open, traceable terminology database capable of real-time updates and feedback loops (107). This strategy aims to create a terminology ecosystem characterized by structural flexibility, evolutionary adaptability, and high disambiguation efficiency—serving as a foundational infrastructure for interdisciplinary knowledge integration.
4.2.2 Advances in research methods and techniques
GC–MS remains the gold standard for comprehensive profiling of VOCs in exhaled breath due to its high stability, excellent separation efficiency, selectivity, sensitivity, and reproducibility (108). However, its clinical applicability is limited by substantial drawbacks, including the need for complex sample pretreatment, poor portability, high power consumption, lack of real-time analytical capacity, and high operational costs (109). These limitations render GC–MS unsuitable for point-of-care (POC) or rapid screening applications (110, 111). Proton transfer reaction–mass spectrometry (PTR-MS), by contrast, offers real-time, in vivo detection of trace-level VOCs with minimal sample preparation (112). Its high accuracy and specificity make it a promising tool for dynamic monitoring in clinical settings such as the ICU (113). Nevertheless, its analytical range is restricted to low-molecular-weight VOCs, potentially missing diagnostically relevant macromolecular biomarkers (114). Extractive electrospray ionization mass spectrometry (EESI-MS) enables direct, matrix-tolerant analysis of complex biological samples without pretreatment (115), showing promise for rapid diagnosis, especially in environments requiring operational simplicity and high throughput, such as ICUs. Its resistance to matrix effects enhances signal reliability in heterogeneous respiratory matrices. However, challenges remain in achieving robust quantitative reproducibility, which limits its current clinical deployment.
To address the limitations inherent to single-modality systems, recent research has emphasized the development of hybrid platforms, such as GC-PTR-MS, that combine the comprehensive compound identification capacity of GC–MS with the real-time (109), high-sensitivity capabilities of PTR-MS (113). Such systems aim to leverage complementary strengths to improve diagnostic coverage and adaptability. Furthermore, advances in miniaturized MS devices have significantly enhanced portability and usability, enabling integration into wearable gas sensor platforms (111). These sensors can serve as preliminary VOC screening tools, with positive cases referred to high-resolution MS backends for molecular confirmation, thereby reducing false positives and improving triage efficiency. A comparative assessment reveals clear trade-offs across platforms in terms of detection depth, analytical speed, cost-effectiveness, and standardization readiness. GC–MS excels in chemical resolution but suffers from logistical inflexibility; PTR-MS provides rapid and accurate detection but lacks breadth in VOC range; EESI-MS balances portability and matrix resilience but requires further validation for quantification (115). As clinical translation accelerates, standardized performance metrics, cost–benefit evaluations, and disease-specific suitability studies across these modalities will be critical. Future progress will depend on the coordinated advancement of hybrid instrumentation, clinical validation frameworks, and regulatory standards to ensure scalable and reproducible deployment in respiratory diagnostics (108).
The E-nose mimics the mammalian olfactory system by using an array of sensors to detect VOCs and applying pattern recognition algorithms to differentiate complex odor profiles (63). Due to its sensitivity, rapid response, and portability, the e-nose has been widely applied in respiratory disease research (116). However, the e-nose can only recognize disease-related breath patterns and lacks the capability to identify the specific chemical constituents responsible for these patterns (62). To overcome these limitations, the e-nose is often combined with MS, which provides high-resolution analysis of gas composition and enhances chemical specificity (117).
Substantial progress has been made in elucidating the mechanisms and identifying biomarkers of respiratory diseases through cellular and animal models. For example, dynamic monitoring of exhaled VOCs such as hexanal and pentanal has been shown to reflect oxidative stress during lung injury. The lipopolysaccharide (LPS)-induced acute lung injury (ALI) mouse model is commonly employed to mimic pulmonary inflammation. These models provide a valuable platform for screening anti-inflammatory agents and elucidating inflammatory signaling pathways, such as MAPK/NF-κB activation (118). Additionally, lung cancer organoid models have demonstrated high fidelity in biomarker research. Patient-derived organoids (PDOs) replicate the molecular and pathological features of primary tumors, producing VOC profiles closely resembling those of clinical samples. When integrated with multi-omics analysis, these models can reveal metabolic reprogramming pathways in the tumor microenvironment, supporting personalized treatment planning and drug sensitivity testing (119). Furthermore, advances in single-cell sequencing have enabled precise localization of VOC-producing cell populations. By comparing the transcriptomes of alveolar type II cells and cuprocytes, researchers identified specific cell subpopulations—such as type II alveolar cells enriched in lipid metabolism genes—as major sources of VOC production. This approach not only resolves cellular heterogeneity but also pinpoints molecular targets for targeted therapies (120).
Beyond integrating metabolomics and metagenomics data to confirm the biological origins of VOCs, Artificial Intelligence (AI) models are employed to fuse multidimensional datasets, including VOC profiles, imaging, and clinical indicators. Analysis of exhaled VOC data should adhere to a closed-loop framework encompassing screening, modeling, and verification. AI algorithms prioritized for this purpose should demonstrate interpretability (e.g., SHAP) (121), robustness against interference (e.g., Lasso-RF fusion) (122), and clinical adaptability (e.g., LSTM for real-time monitoring) (123). Concurrently, coordinated efforts to develop standardized databases and miniaturized detection devices are essential. To accelerate clinical translation and enable the shift from VOC signal detection to precision intervention, future validation studies should prioritize diseases based on mortality rates, the feasibility of VOC detection technologies, and existing gaps in clinical diagnostics. This prioritization aims to reduce preventable mortality by optimizing resource allocation and maximizing public health benefits within constrained research investments. Furthermore, stratified diagnostic and therapeutic guidelines informed by multi-omics markers should be developed, alongside fostering interdisciplinary collaboration (57). Although novel biosensors have been applied to respiratory disease research, their full potential remains unrealized. Despite initial advances in biosensing platforms altering the phenomic landscape of respiratory diseases, ongoing development and clinical translation efforts are required to fully realize their impact on research and therapeutic innovation.
5 Limitation
5.1 Data coverage constraints
Our exclusive reliance on WoSCC and PubMed may have omitted relevant studies from specialized databases (e.g., Embase, Scopus). The English-language restriction potentially excluded impactful non-English publications. Future investigations could expand retrieval to Embase, Scopus and utilize AI-assisted translation tools with domain-expert validation to mitigate language bias.
5.2 Bibliometric methodological boundaries
While effectively mapping research landscapes, bibliometric approaches cannot assess study quality or methodological rigor. Citation metrics may be influenced by journal policies and self-citation practices. These limitations necessitate complementary evidence synthesis methods: Structured qualitative appraisal (e.g., using ROBINS-I for risk of bias assessment) can evaluate the methodological soundness of high-impact studies identified through bibliometric networks. Dose–response meta-analyses may quantify clinical effect sizes of VOCs flagged as research hotspots, reconciling heterogeneous findings across studies.
This integrated approach creates a translational bridge: Bibliometrics identifies candidate biomarkers and knowledge gaps, while systematic review/meta-analysis validates their clinical credibility and quantifies diagnostic accuracy [e.g., pooled sensitivity/specificity of breath signatures for COPD exacerbations (61)].
5.3 Multidisciplinary integration challenges
Terminological and methodological heterogeneity across chemistry, immunology, and respiratory medicine complicates knowledge integration. Future interdisciplinary teams should employ ontology alignment tools (e.g., OLS API) and consensus frameworks like Delphi methods to standardize conceptual mappings.
Despite these constraints, this study provides a foundational mapping of research frontiers. Translation into clinical practice requires prospective multicenter trials using standardized VOC collection protocols (e.g., ATS/ERS guidelines) to validate biomarker reproducibility.
6 Conclusion
Over the past two decades, this comprehensive bibliometric analysis has mapped emerging trends and research hotspots in MS-based respiratory testing, highlighting its transformative potential for clinical diagnostics and research. MS is increasingly recognized as a non-invasive and highly sensitive technique for monitoring VOCs in exhaled breath, underscoring its clinical and research significance. Key advances encompass disease-specific VOC profiling, mechanistic insights linking VOCs to metabolic reprogramming, oxidative stress, and microbiome interactions, as well as methodological improvements enhancing diagnostic precision and reproducibility. Ongoing technological innovations continue to improve real-time, high-resolution VOC detection capabilities in MS. Integration of AI and machine learning facilitates predictive modeling and precise biomarker identification, while enhancing data analytics. To elucidate disease pathophysiology and enable precision medicine, future efforts will prioritize multi-omics integration. Advances in single-cell sequencing, organoid modeling, and biosensor technologies hold promise for bridging precision medicine and biomarker discovery.
Despite limitations related to database scope and the multidisciplinary nature of VOC research, this study provides a foundational roadmap to address knowledge gaps, foster international collaboration, and accelerate the clinical adoption of respiratory diagnostics. MS-based breath testing represents a cornerstone of next-generation respiratory disease management, driven by advances in technology, biomarker validation, and AI-enhanced analytics. However, critical challenges remain, including the lack of standardized protocols, limited biomarker specificity, incomplete understanding of biological mechanisms, immature technologies, and insufficient large-scale clinical validation. Addressing these issues requires urgent establishment of interdisciplinary collaborative alliances. Only through coordinated efforts among researchers, clinicians, and policymakers can exhaled VOC biomarkers—such as acetone and isovaleraldehyde, detected via MS—be translated into universal clinical tools, reshaping precise diagnosis and treatment paradigms for respiratory diseases. Specifically, researchers must develop ISO-certified sampling and analysis protocols to ensure data comparability across centers; clinicians should establish large prospective cohorts (≥10,000 patients) to evaluate VOC dynamics in response to treatment and exposure; policymakers are tasked with facilitating insurance coverage and expedited regulatory approval for portable, sensitive MS devices (e.g., MEMS Micro GC) to accelerate clinical translation.
Statements
Author contributions
YZ: Software, Writing – original draft, Visualization, Methodology. XQ: Data curation, Writing – original draft. TY: Data curation, Writing – review & editing. QW: Methodology, Writing – review & editing. LD: Writing – review & editing, Software. LW: Supervision, Writing – review & editing, Funding acquisition. ZD: Writing – review & editing, Supervision.
Funding
The author(s) declare that financial support was received for the research and/or publication of this article. This work was supported by the Key Laboratory of TCM Pulmonary Science of Jiangxi Province (No. 2024SSY06321), the Key Research and Development Project of Jiangxi Province, the field of Social Development, the development and application of the Yin-Yang Attribute Breath Recognition Instrument for chronic obstructive pulmonary Disease (20232BBG70021), the Fifth Batch of National Traditional Chinese Medicine Excellent Clinical Talents Training Project. (Announcement from the Personnel and Education Department of the National Administration of Traditional Chinese Medicine. No. 2022-1).
Acknowledgments
We express their gratitude to everyone who posted the videos on the three platforms.
Conflict of interest
The authors declare that the research was conducted in the absence of any commercial or financial relationships that could be construed as a potential conflict of interest.
Generative AI statement
The authors declare that no Gen AI was used in the creation of this manuscript.
Publisher’s note
All claims expressed in this article are solely those of the authors and do not necessarily represent those of their affiliated organizations, or those of the publisher, the editors and the reviewers. Any product that may be evaluated in this article, or claim that may be made by its manufacturer, is not guaranteed or endorsed by the publisher.
Supplementary material
The Supplementary material for this article can be found online at: https://www.frontiersin.org/articles/10.3389/fmed.2025.1618588/full#supplementary-material
- ADH
Alcohol dehydrogenase
- ALI
Acute Lung Injury
- AI
Artificial Intelligence
- ARDS
Acute Respiratory Distress Syndrome
- COPD
Chronic Obstructive Pulmonary Disease
- COVID-19
Corona Virus Disease 2019
- ECM
Extracellular Matrix
- EESI-MS
Extractive Electrospray Ionization Mass Spectrometry
- EI
Electron Ionization
- EMR
Electronic Medical Records
- ESI
Electrospray Ionization
- FeNO
Fractional Exhaled Nitric Oxide
- GC
Gas Chromatography
- GC–MS
Gas Chromatography–Mass Spectrometry
- GC-TOFMS
Gas Chromatography-Time-of-Flight Mass Spectrometry
- GC × GC-HRTOFMS
High-Resolution Gas Chromatography-Time-of-Flight Mass Spectrometry
- IL-6
Interleukin-6
- IPF
Idiopathic Pulmonary Fibrosis
- LC
Liquid Chromatography
- LLR
Log-Likelihood Ratio
- LPS
Lipopolysaccharide
- LSI
Latent Semantic Indexing
- MCP
Multiple Country Publications
- MS
Mass Spectrometry
- m/z
Mass-to-Charge Ratio
- OPLS-DA
Orthogonal Partial Least Squares Discriminant Analysis
- OSA
Obstructive Sleep Apnea
- PAH
Pulmonary Arterial Hypertension
- PDOs
Patient-Derived Organoids
- POC
Point-of-Care
- PTR-MS
Proton Transfer Reaction-Mass Spectrometry
- PTR-TOF-MS
Proton Transfer Reaction Time-of-Flight Mass Spectrometry
- ROS
Reactive Oxygen Species
- SCP
Single Country Publications
- SESI-MS
Secondary Electrospray Ionization Mass Spectrometry
- TB
Tuberculosis
- TNF-α
Tumor Necrosis Factor-alpha
- VOCs
Volatile Organic Compounds
- WoS
Web of Science
- WoSCC
Web of Science Core Collection
Glossary
References
1.
Domon B Aebersold R . Mass spectrometry and protein analysis. Science. (2006) 312:212–7. doi: 10.1126/science.1124619
2.
Zhang H Yang Y Jiang Y Zhang M Xu Z Wang X et al . Mass spectrometry analysis for clinical applications: a review. Crit Rev Anal Chem. (2025) 55:213–32. doi: 10.1080/10408347.2023.2274039
3.
Tütüncü E Mizaikoff B . Cascade laser sensing concepts for advanced breath diagnostics. Anal Bioanal Chem. (2019) 411:1679–86. doi: 10.1007/s00216-018-1509-5
4.
Manolis A . The diagnostic potential of breath analysis. Clin Chem. (1983) 29:5–15. doi: 10.1093/clinchem/29.1.5
5.
Holton E Kasprzyk-Hordern B . Multiresidue antibiotic-metabolite quantification method using ultra-performance liquid chromatography coupled with tandem mass spectrometry for environmental and public exposure estimation. Anal Bioanal Chem. (2021) 413:5901–20. doi: 10.1007/s00216-021-03573-4
6.
Wang H Wu Y Sun M Cui X . Enhancing diagnosis of benign lesions and lung cancer through ensemble text and breath analysis: a retrospective cohort study. Sci Rep. (2024) 14:8731. doi: 10.1038/s41598-024-59474-w
7.
Yuan Z-C Hu B . Mass spectrometry-based human breath analysis: towards COVID-19 diagnosis and research. J Anal Test. (2021) 5:287–97. doi: 10.1007/s41664-021-00194-9
8.
Bos LDJ Weda H Wang Y Knobel HH Nijsen TME Vink TJ et al . Exhaled breath metabolomics as a noninvasive diagnostic tool for acute respiratory distress syndrome. Eur Respir J. (2014) 44:188–97. doi: 10.1183/09031936.00005614
9.
Gaugg MT Engler A Nussbaumer-Ochsner Y Bregy L Stöberl AS Gaisl T et al . Metabolic effects of inhaled salbutamol determined by exhaled breath analysis. J Breath Res. (2017) 11:046004. doi: 10.1088/1752-7163/aa7caa
10.
Hicks D Wouters P Waltman L de Rijcke S Rafols I . Bibliometrics: the Leiden manifesto for research metrics. Nature. (2015) 520:429–31. doi: 10.1038/520429a
11.
Chen D Zhang G Wang J Chen S Wang J Nie H et al . Mapping trends in Moyamoya Angiopathy research: a 10-year bibliometric and visualization-based analyses of the web of science Core collection (WoSCC). Front Neurol. (2021) 12:637310. doi: 10.3389/fneur.2021.637310
12.
Arruda H Silva ER Lessa M Proença DJ Bartholo R . VOSviewer and Bibliometrix. J Med Libr Assoc. (2022) 110:392–5. doi: 10.5195/jmla.2022.1434
13.
Chen C . Searching for intellectual turning points: progressive knowledge domain visualization. Proc Natl Acad Sci USA. (2004) 101:5303–10. doi: 10.1073/pnas.0307513100
14.
Srinivasan A Purich J Correll M Battle L Setlur V Crisan A . From dashboard zoo to census: a case study with tableau public. IEEE Trans Vis Comput Graph. (2024) 2024:1–15. doi: 10.1109/TVCG.2024.3490259
15.
Corradi M Rubinstein I Andreoli R Manini P Caglieri A Poli D et al . Aldehydes in exhaled breath condensate of patients with chronic obstructive pulmonary disease. Am J Respir Crit Care Med. (2003) 167:1380–6. doi: 10.1164/rccm.200210-1253OC
16.
Tranchida PQ Franchina FA Dugo P Mondello L . Comprehensive two-dimensional gas chromatography-mass spectrometry: recent evolution and current trends. Mass Spectrom Rev. (2016) 35:524–34. doi: 10.1002/mas.21443
17.
Streckenbach B . Trends in direct breath analysis by secondary electrospray ionization mass spectrometry for clinical applications. Chimia. (2022) 76:322–6. doi: 10.2533/chimia.2022.322
18.
ERS . ERS Task force develops technical standard on exhaled biomarkers in lung disease. ERS-European Respiratory Society (2017) Available online at: https://www.ersnet.org/news-and-features/news/ers-task-force-develops-technical-standard-on-exhaled-biomarkers-in-lung-disease/(Accessed July 24, 2025).
19.
Pizzini A Filipiak W Wille J Ager C Wiesenhofer H Kubinec R et al . Analysis of volatile organic compounds in the breath of patients with stable or acute exacerbation of chronic obstructive pulmonary disease. J Breath Res. (2018) 12:036002. doi: 10.1088/1752-7163/aaa4c5
20.
Miekisch W Schubert JK Noeldge-Schomburg GFE . Diagnostic potential of breath analysis—focus on volatile organic compounds. Clin Chim Acta. (2004) 347:25–39. doi: 10.1016/j.cccn.2004.04.023
21.
Phillips M Gleeson K Hughes JM Greenberg J Cataneo RN Baker L et al . Volatile organic compounds in breath as markers of lung cancer: a cross-sectional study. Lancet. (1999) 353:1930–3. doi: 10.1016/S0140-6736(98)07552-7
22.
Horváth I Hunt J Barnes PJ Alving K Antczak A Baraldi E et al . Exhaled breath condensate: methodological recommendations and unresolved questions. Eur Respir J. (2005) 26:523–48. doi: 10.1183/09031936.05.00029705
23.
Horváth I Barnes PJ Loukides S Sterk PJ Högman M Olin A-C et al . A European Respiratory Society technical standard: exhaled biomarkers in lung disease. Eur Respir J. (2017) 49:1600965. doi: 10.1183/13993003.00965-2016
24.
Grassin-Delyle S Roquencourt C Moine P Saffroy G Carn S Heming N et al . Metabolomics of exhaled breath in critically ill COVID-19 patients: a pilot study. EBioMedicine. (2021) 63:103154. doi: 10.1016/j.ebiom.2020.103154
25.
Yoo EJ Kim JS Stransky S Spivack S Sidoli S . Advances in proteomics methods for the analysis of exhaled breath condensate. Mass Spectrom Rev. (2024) 43:713–22. doi: 10.1002/mas.21871
26.
Ren J-L Zhang A-H Kong L Wang X-J . Advances in mass spectrometry-based metabolomics for investigation of metabolites. RSC Adv. (2018) 8:22335–50. doi: 10.1039/c8ra01574k
27.
Foroughi Pour A Pietrzak M Dalton LA Rempała GA . High dimensional model representation of log-likelihood ratio: binary classification with expression data. BMC Bioinform. (2020) 21:156. doi: 10.1186/s12859-020-3486-x
28.
Klie S Martens L Vizcaíno JA Côté R Jones P Apweiler R et al . Analyzing large-scale proteomics projects with latent semantic indexing. J Proteome Res. (2008) 7:182–91. doi: 10.1021/pr070461k
29.
Van Berkel JJBN Dallinga JW Möller GM Godschalk RWL Moonen EJ Wouters EFM et al . A profile of volatile organic compounds in breath discriminates COPD patients from controls. Respir Med. (2010) 104:557–63. doi: 10.1016/j.rmed.2009.10.018
30.
Paredi P Kharitonov SA Leak D Ward S Cramer D Barnes PJ . Exhaled ethane, a marker of lipid peroxidation, is elevated in chronic obstructive pulmonary disease. Am J Respir Crit Care Med. (2000) 162:369–73. doi: 10.1164/ajrccm.162.2.9909025
31.
Ibrahim W Natarajan S Wilde M Cordell R Monks PS Greening N et al . A systematic review of the diagnostic accuracy of volatile organic compounds in airway diseases and their relation to markers of type-2 inflammation. ERJ Open Res. (2021) 7:00030–2021. doi: 10.1183/23120541.00030-2021
32.
Montuschi P Barnes PJ . New perspectives in pharmacological treatment of mild persistent asthma. Drug Discov Today. (2011) 16:1084–91. doi: 10.1016/j.drudis.2011.09.005
33.
Caldeira M Perestrelo R Barros AS Bilelo MJ Morête A Câmara JS et al . Allergic asthma exhaled breath metabolome: a challenge for comprehensive two-dimensional gas chromatography. J Chromatogr A. (2012) 1254:87–97. doi: 10.1016/j.chroma.2012.07.023
34.
van der Schee MP Palmay R Cowan JO Taylor DR . Predicting steroid responsiveness in patients with asthma using exhaled breath profiling. Clin Exp Allergy. (2013) 43:1217–25. doi: 10.1111/cea.12147
35.
Gordon SM Szidon JP Krotoszynski BK Gibbons RD O’Neill HJ . Volatile organic compounds in exhaled air from patients with lung cancer. Clin Chem. (1985) 31:1278–82. doi: 10.1093/clinchem/31.8.1278
36.
Jia Z Thavasi V Venkatesan T Lee P . Breath analysis for lung Cancer early detection-a clinical study. Metabolites. (2023) 13:197. doi: 10.3390/metabo13121197
37.
Khatua S Geltemeyer AM Gourishankar A . Tuberculosis: is the landscape changing?Pediatr Res. (2017) 81:265–70. doi: 10.1038/pr.2016.205
38.
Phillips M Cataneo RN Condos R Ring Erickson GA Greenberg J La Bombardi V et al . Volatile biomarkers of pulmonary tuberculosis in the breath. Tuberculosis (Edinb). (2007) 87:44–52. doi: 10.1016/j.tube.2006.03.004
39.
Syhre M Chambers ST . The scent of Mycobacterium tuberculosis. Tuberculosis. (2008) 88:317–23. doi: 10.1016/j.tube.2008.01.002
40.
Broza YY Mochalski P Ruzsanyi V Amann A Haick H . Hybrid volatolomics and disease detection. Angew Chem Int Ed Engl. (2015) 54:11036–48. doi: 10.1002/anie.201500153
41.
Chen H Qi X Zhang L Li X Ma J Zhang C et al . COVID-19 screening using breath-borne volatile organic compounds. J Breath Res. (2021) 15:57. doi: 10.1088/1752-7163/ac2e57
42.
Chatterjee S . Oxidative stress, inflammation, and disease In: DziublaTButterfieldD, editors. Oxidative Stress and Biomaterials. Cambridge: Academic Press (2016). 35–58.
43.
Ratcliffe N Wieczorek T Drabińska N Gould O Osborne A De Lacy CB . A mechanistic study and review of volatile products from peroxidation of unsaturated fatty acids: an aid to understanding the origins of volatile organic compounds from the human body. J Breath Res. (2020) 14:034001. doi: 10.1088/1752-7163/ab7f9d
44.
Boots AW van Berkel JJBN Dallinga JW Smolinska A Wouters EF van Schooten FJ . The versatile use of exhaled volatile organic compounds in human health and disease. J Breath Res. (2012) 6:027108. doi: 10.1088/1752-7155/6/2/027108
45.
Bos LDJ Sterk PJ Schultz MJ . Volatile metabolites of pathogens: a systematic review. PLoS Pathog. (2013) 9:e1003311. doi: 10.1371/journal.ppat.1003311
46.
Paredi P Kharitonov SA Barnes PJ . Elevation of exhaled ethane concentration in asthma. Am J Respir Crit Care Med. (2000) 162:1450–4. doi: 10.1164/ajrccm.162.4.2003064
47.
Hanahan D Weinberg RA . Hallmarks of cancer: the next generation. Cell. (2011) 144:646–74. doi: 10.1016/j.cell.2011.02.013
48.
Vander Heiden MG Cantley LC Thompson CB . Understanding the Warburg effect: the metabolic requirements of cell proliferation. Science. (2009) 324:1029–33. doi: 10.1126/science.1160809
49.
Liberti MV Locasale JW . The Warburg effect: how does it benefit Cancer cells?Trends Biochem Sci. (2016) 41:211–8. doi: 10.1016/j.tibs.2015.12.001
50.
Furuhashi T Matsumoto Y Ishii R Sugasawa T Ota S . Hypoxia and lactate influence VOC production in A549 lung cancer cells. Front Mol Biosci. (2023) 10:1274298. doi: 10.3389/fmolb.2023.1274298
51.
Kemnitz N Fuchs P Remy R Ruehrmund L Bartels J Klemenz A-C et al . Effects of contagious respiratory pathogens on breath biomarkers. Antioxidants. (2024) 13:172. doi: 10.3390/antiox13020172
52.
Ormerod KL Wood DLA Lachner N Gellatly SL Daly JN Parsons JD et al . Genomic characterization of the uncultured Bacteroidales family S24-7 inhabiting the guts of homeothermic animals. Microbiome. (2016) 4:36. doi: 10.1186/s40168-016-0181-2
53.
Cordeiro RDA Bittencourt PV Brilhante RSN Teixeira CEC Castelo-Branco DDSCM Silva STDC et al . Species of Candida as a component of the nasal microbiota of healthy horses. Med Mycol. (2013) 51:731–6. doi: 10.3109/13693786.2013.777858
54.
Huang YJ Nelson CE Brodie EL Desantis TZ Baek MS Liu J et al . Airway microbiota and bronchial hyperresponsiveness in patients with suboptimally controlled asthma. J Allergy Clin Immunol. (2011) 127:372–3. doi: 10.1016/j.jaci.2010.10.048
55.
Chen X Qiu C . Respiratory tract mucous membrane microecology and asthma. Ann Transl Med. (2019) 7:495. doi: 10.21037/atm.2019.09.06
56.
Wills-Karp M . Neutrophil ghosts worsen asthma. Sci Immunol. (2018) 3:eaau0112. doi: 10.1126/sciimmunol.aau0112
57.
Fan X Zhong R Liang H Zhong Q Huang H He J et al . Exhaled VOC detection in lung cancer screening: a comprehensive meta-analysis. BMC Cancer. (2024) 24:775. doi: 10.1186/s12885-024-12537-7
58.
Fens N Zwinderman AH van der Schee MP de Nijs SB Dijkers E Roldaan AC et al . Exhaled breath profiling enables discrimination of chronic obstructive pulmonary disease and asthma. Am J Respir Crit Care Med. (2009) 180:1076–82. doi: 10.1164/rccm.200906-0939OC
59.
Fabbri LM Romagnoli M Corbetta L Casoni G Busljetic K Turato G et al . Differences in airway inflammation in patients with fixed airflow obstruction due to asthma or chronic obstructive pulmonary disease. Am J Respir Crit Care Med. (2003) 167:418–24. doi: 10.1164/rccm.200203-183OC
60.
Mauad T Dolhnikoff M . Pathologic similarities and differences between asthma and chronic obstructive pulmonary disease. Curr Opin Pulm Med. (2008) 14:31–8. doi: 10.1097/MCP.0b013e3282f19846
61.
van Poelgeest J Shahbazi Khamas S Hallawa A D’Alessandro C Ferreira R Maitland-van der Zee AH et al . Exhaled volatile organic compounds associated with chronic obstructive pulmonary disease exacerbations-a systematic review and validation. J Breath Res. (2025) 19:adba06. doi: 10.1088/1752-7163/adba06
62.
Schleich FN Zanella D Stefanuto P-H Bessonov K Smolinska A Dallinga JW et al . Exhaled volatile organic compounds are able to discriminate between neutrophilic and eosinophilic asthma. Am J Respir Crit Care Med. (2019) 200:444–53. doi: 10.1164/rccm.201811-2210OC
63.
Sharma R Zang W Zhou M Schafer N Begley LA Huang YJ et al . Real time breath analysis using portable gas chromatography for adult asthma phenotypes. Meta. (2021) 11:265. doi: 10.3390/metabo11050265
64.
Meyer N Dallinga JW Nuss SJ Moonen EJC van Berkel JJBN Akdis C et al . Defining adult asthma endotypes by clinical features and patterns of volatile organic compounds in exhaled air. Respir Res. (2014) 15:136. doi: 10.1186/s12931-014-0136-8
65.
van de Kant KDG van der Sande LJTM Jöbsis Q van Schayck OCP Dompeling E . Clinical use of exhaled volatile organic compounds in pulmonary diseases: a systematic review. Respir Res. (2012) 13:117. doi: 10.1186/1465-9921-13-117
66.
Wilkinson M Maidstone R Loudon A Blaikley J White IR Singh D et al . Circadian rhythm of exhaled biomarkers in health and asthma. Eur Respir J. (2019) 54:1901068. doi: 10.1183/13993003.01068-2019
67.
Chou H Godbeer L Allsworth M Boyle B Ball ML . Progress and challenges of developing volatile metabolites from exhaled breath as a biomarker platform. Metabolomics. (2024) 20:72. doi: 10.1007/s11306-024-02142-x
68.
Berna AZ Schaber CL Bollinger LB Mwale M Mlotha-Mitole R Trehan I et al . Comparison of breath sampling methods: a post hoc analysis from observational cohort studies. Analyst. (2019) 144:2026–33. doi: 10.1039/c8an01823e
69.
Phillips M . Method for the collection and assay of volatile organic compounds in breath. Anal Biochem. (1997) 247:272–8. doi: 10.1006/abio.1997.2069
70.
Hanna GB Boshier PR Markar SR Romano A . Accuracy and methodologic challenges of volatile organic compound-based exhaled breath tests for Cancer diagnosis: a systematic review and Meta-analysis. JAMA Oncol. (2019) 5:e182815. doi: 10.1001/jamaoncol.2018.2815
71.
MSI Board Members Sansone S-A Fan T Goodacre R Griffin JL Hardy NW et al . The metabolomics standards initiative. Nat Biotechnol. (2007) 25:846–8. doi: 10.1038/nbt0807-846b
72.
Jung AE Davidson CN Land CJ Dash AI Guess BT Edmonds HS et al . Impact of thermal desorption tubes on the variability of exhaled breath data. J Breath Res. (2023) 18:016008. doi: 10.1088/1752-7163/ad15a3
73.
Lin G-P Vadhwana B Belluomo I Boshier PR Španěl P Hanna GB . Cross platform analysis of volatile organic compounds using selected ion flow tube and proton-transfer-reaction mass spectrometry. J Am Soc Mass Spectrom. (2021) 32:1215–23. doi: 10.1021/jasms.1c00027
74.
Zhang L Li X Chen H Wu Z Hu M Yao M . Haze air pollution health impacts of breath-borne VOCs. Environ Sci Technol. (2022) 56:8541–51. doi: 10.1021/acs.est.2c01778
75.
Henderson B Ruszkiewicz DM Wilkinson M Beauchamp JD Cristescu SM Fowler SJ et al . A benchmarking protocol for breath analysis: the peppermint experiment. J Breath Res. (2020) 14:046008. doi: 10.1088/1752-7163/aba130
76.
Hatch A Arulvasan W Birch O Swann S Coplowe S Ratiu A et al . “Introducing breath biopsy VOC atlas: a list of known breath VOCS for breath-based biomarker discovery,” B69 Airway injury and repair: mechanisms and treatment american thoracic society international conference abstracts. New York, USA: American Thoracic Society (2023). p. A4050–A4051.
77.
Fijten RRR Smolinska A Drent M Dallinga JW Mostard R Pachen DM et al . The necessity of external validation in exhaled breath research: a case study of sarcoidosis. J Breath Res. (2017) 12:016004. doi: 10.1088/1752-7163/aa8409
78.
Munafò MR Nosek BA Bishop DVM Button KS Chambers CD du Sert NP et al . A manifesto for reproducible science. Nat Hum Behav. (2017) 1:0021. doi: 10.1038/s41562-016-0021
79.
Azim A Rezwan FI Barber C Harvey M Kurukulaaratchy RJ Holloway JW et al . Measurement of exhaled volatile organic compounds as a biomarker for personalised medicine: assessment of short-term repeatability in severe asthma. J Pers Med. (2022) 12:1635. doi: 10.3390/jpm12101635
80.
Smolinska A Hauschild A-C Fijten RRR Dallinga JW Baumbach J van Schooten FJ . Current breathomics--a review on data pre-processing techniques and machine learning in metabolomics breath analysis. J Breath Res. (2014) 8:027105. doi: 10.1088/1752-7155/8/2/027105
81.
Li L . Dimension reduction for high-dimensional data. Methods Mol Biol. (2010) 620:417–34. doi: 10.1007/978-1-60761-580-4_14
82.
Serkova NJ Standiford TJ Stringer KA . The emerging field of quantitative blood metabolomics for biomarker discovery in critical illnesses. Am J Respir Crit Care Med. (2011) 184:647–55. doi: 10.1164/rccm.201103-0474CI
83.
Lee D-K Na E Park S Park JH Lim J Kwon SW . In vitro tracking of intracellular metabolism-derived Cancer volatiles via isotope labeling. ACS Cent Sci. (2018) 4:1037–44. doi: 10.1021/acscentsci.8b00296
84.
Zhang S Hagens LA Heijnen NFL Smit MR Brinkman P Fenn D et al . Breath metabolomics for diagnosis of acute respiratory distress syndrome. Crit Care. (2024) 28:96. doi: 10.1186/s13054-024-04882-7
85.
Ferrari R Lacaze I Le Faouder P Bertrand-Michel J Oger C Galano J-M et al . Cyclooxygenases and lipoxygenases are used by the fungus Podospora anserina to repel nematodes. Biochim Biophys Acta Gen Subj. (2018) 1862:2174–82. doi: 10.1016/j.bbagen.2018.07.012
86.
Hooper LV Littman DR Macpherson AJ . Interactions between the microbiota and the immune system. Science. (2012) 336:1268–73. doi: 10.1126/science.1223490
87.
Smith K McCoy KD Macpherson AJ . Use of axenic animals in studying the adaptation of mammals to their commensal intestinal microbiota. Semin Immunol. (2007) 19:59–69. doi: 10.1016/j.smim.2006.10.002
88.
Zhang Y Wan Y Xin X Qiao Y Qiao W Ping J et al . Signals from intestinal microbiota mediate the crosstalk between the lung-gut axis in an influenza infection mouse model. Front Immunol. (2024) 15:1435180. doi: 10.3389/fimmu.2024.1435180
89.
Ding K Chen J Zhan W Zhang S Chen Y Long S et al . Microbiome links cigarette smoke-induced chronic obstructive pulmonary disease and dietary Fiber via the gut-lung Axis: a narrative review. COPD. (2021) 19:10–7. doi: 10.1080/15412555.2021.2019208
90.
Xu X Li J Zhang Y Zhang L . Arachidonic acid 15-lipoxygenase: effects of its expression, metabolites, and genetic and epigenetic variations on airway inflammation. Allergy Asthma Immunol Res. (2021) 13:684–96. doi: 10.4168/aair.2021.13.5.684
91.
He Y Peng J Jia N Wang X Ma J Wang H et al . Up-regulation of growth-related gene expression in tobacco by volatile compounds released by Bacillus velezensis WSW007. Sci Rep. (2024) 14:18087. doi: 10.1038/s41598-024-68274-1
92.
Rieber N Zapatka M Lasitschka B Jones D Northcott P Hutter B et al . Coverage bias and sensitivity of variant calling for four whole-genome sequencing technologies. PLoS One. (2013) 8:e66621. doi: 10.1371/journal.pone.0066621
93.
Gashimova E Osipova A Temerdashev A Porkhanov V Polyakov I Perunov D et al . Exhaled breath analysis using GC-MS and an electronic nose for lung cancer diagnostics. Anal Methods. (2021) 13:4793–804. doi: 10.1039/d1ay01163d
94.
Chatterjee S . Chapter two-oxidative stress, inflammation, and disease In: DziublaTButterfieldDA, editors. Oxidative stress and biomaterials. London, UK: Academic Press (2016). 35–58.
95.
Wilde MJ Cordell RL Salman D Zhao B Ibrahim W Bryant L et al . Breath analysis by two-dimensional gas chromatography with dual flame ionisation and mass spectrometric detection - method optimisation and integration within a large-scale clinical study. J Chromatogr A. (2019) 1594:160–72. doi: 10.1016/j.chroma.2019.02.001
96.
Chu Y Ge D Zhou J Liu Y Zheng X Liu W et al . Controlling glycolysis to generate characteristic volatile organic compounds of lung cancer cells. Sci Rep. (2024) 14:16561. doi: 10.1038/s41598-024-67379-x
97.
Yang C Sudderth J Dang T Bachoo RM McDonald JG DeBerardinis RJ . Glioblastoma cells require glutamate dehydrogenase to survive impairments of glucose metabolism or Akt signaling. Cancer Res. (2009) 69:7986–93. doi: 10.1158/0008-5472.CAN-09-2266
98.
Baggetto LG Lehninger AL . Formation and utilization of acetoin, an unusual product of pyruvate metabolism by Ehrlich and AS30-D tumor mitochondria. J Biol Chem. (1987) 262:9535–41. PMID:
99.
Informatik Spektrum The Good, the Bad and the Ugly of terminology in Cross Domain Fusion|Informatik Spektrum. Available online at: https://link.springer.com/article/10.1007/s00287-022-01511-x (Accessed July 24, 2025).
100.
Kang Y Li L Kang X Zhao Y Cai Y . Gut microbiota and metabolites in myasthenia gravis: early diagnostic biomarkers and therapeutic strategies. Clin Immunol. (2022) 245:109173. doi: 10.1016/j.clim.2022.109173
101.
Johnson C Ivanisevic J Siuzdak G . Metabolomics: beyond biomarkers and towards mechanisms. Nat Rev Mol Cell Biol. (2016) 17:451–9. doi: 10.1038/nrm.2016.25
102.
Xia J Broadhurst DI Wilson M Wishart DS . Translational biomarker discovery in clinical metabolomics: an introductory tutorial. Metabolomics. (2013) 9:280–99. doi: 10.1007/s11306-012-0482-9
103.
Tian J Zhang Q Peng M Guo L Zhao Q Lin W et al . Exhaled volatile organic compounds as novel biomarkers for early detection of COPD, asthma, and PRISm: a cross-sectional study. Respir Res. (2025) 26:173. doi: 10.1186/s12931-025-03242-5
104.
Meliante PG Zoccali F Cascone F Di Stefano V Greco A de Vincentiis M et al . Molecular pathology, oxidative stress, and biomarkers in obstructive sleep apnea. Int J Mol Sci. (2023) 24:5478. doi: 10.3390/ijms24065478
105.
Hao Z Mayer W Xia J Li G Qin L Feng Z . Ontology alignment with semantic and structural embeddings. J Web Semant. (2023) 78:100798. doi: 10.1016/j.websem.2023.100798
106.
Springer Link Transformer Based Semantic Relation Typing for Knowledge Graph Integration. Available online at: https://link.springer.com/chapter/10.1007/978-3-031-33455-9_7 (Accessed July 24, 2025).
107.
Springer NLP Applications for Big Data Analytics Within Healthcare. Available online at: https://link.springer.com/chapter/10.1007/978-981-19-1076-0_13 (Accessed July 24, 2025)
108.
Tsugawa H Tsujimoto Y Arita M Bamba T Fukusaki E . GC/MS based metabolomics: development of a data mining system for metabolite identification by using soft independent modeling of class analogy (SIMCA). BMC Bioinform. (2011) 12:131. doi: 10.1186/1471-2105-12-131
109.
Cao J Jiang T Xu W . Miniature mass spectrometry for VOCs analysis: recent developments in instrumentation and applications. Rapid Commun Mass Spectrom. (2025) 39:e10088. doi: 10.1002/rcm.10088
110.
Zhang W Wang X Xia Y Ouyang Z . Ambient ionization and miniature mass spectrometry Systems for Disease Diagnosis and Therapeutic Monitoring. Theranostics. (2017) 7:2968–81. doi: 10.7150/thno.19410
111.
Zamkah A Hui T Andrews S Dey N Shi F Sherratt RS . Identification of suitable biomarkers for stress and emotion detection for future personal affective wearable sensors. Biosensors. (2020) 10:40. doi: 10.3390/bios10040040
112.
Harren FJM Cristescu SM . Online, real-time detection of volatile emissions from plant tissue. AoB Plants. (2013) 5:plt 003. doi: 10.1093/aobpla/plt003
113.
Wehinger A Schmid A Mechtcheriakov S . Lung cancer detection by proton transfer reaction mass-spectrometric analysis of human breath gas. Int J Mass Spectrom. (2007) 265:49–59. doi: 10.1016/j.ijms.2007.05.012
114.
Cristescu SM Gietema HA Blanchet L Kruitwagen CLJJ Munnik P van Klaveren RJ et al . Screening for emphysema via exhaled volatile organic compounds. J Breath Res. (2011) 5:046009. doi: 10.1088/1752-7155/5/4/046009
115.
Zuo W Bai W Gan X Xu F Wen G Zhang W . Detection of lung Cancer by analysis of exhaled gas utilizing extractive electrospray ionization-mass spectroscopy. J Biomed Nanotechnol. (2019) 15:633–46. doi: 10.1166/jbn.2019.2719
116.
Farraia MV Cavaleiro Rufo J Paciência I Mendes F Delgado L Moreira A . The electronic nose technology in clinical diagnosis: a systematic review. Porto Biomed J. (2019) 4:e42. doi: 10.1097/j.pbj.0000000000000042
117.
Montuschi P Mores N Trové A Mondino C Barnes PJ . The electronic nose in respiratory medicine. Respiration. (2013) 85:72–84. doi: 10.1159/000340044
118.
Zhu J Zhou J Feng B Pan Q Yang J Lang G et al . MSCs alleviate LPS-induced acute lung injury by inhibiting the proinflammatory function of macrophages in mouse lung organoid-macrophage model. Cell Mol Life Sci. (2024) 81:124. doi: 10.1007/s00018-024-05150-1
119.
Wang H-M Zhang C-Y Peng K-C Chen Z-X Su J-W Li Y-F et al . Using patient-derived organoids to predict locally advanced or metastatic lung cancer tumor response: a real-world study. Cell Rep Med. (2023) 4:100911. doi: 10.1016/j.xcrm.2022.100911
120.
Liu Q Niu Y Pei Z Yang Y Xie Y Wang M et al . Gas 6-Axl signal promotes indoor VOCs exposure-induced pulmonary fibrosis via pulmonary microvascular endothelial cells-fibroblasts cross-talk. J Hazard Mater. (2024) 474:134786. doi: 10.1016/j.jhazmat.2024.134786
121.
Qi X Wang S Fang C Jia J Lin L Yuan T . Machine learning and SHAP value interpretation for predicting comorbidity of cardiovascular disease and cancer with dietary antioxidants. Redox Biol. (2025) 79:103470. doi: 10.1016/j.redox.2024.103470
122.
Wu H Jin S Xiang C Tang J Xian J Zhang J et al . GPS: harnessing data fusion strategies to improve the accuracy of machine learning-based genomic and phenotypic selection. Plant Commun. (2025) 101416:101416. doi: 10.1016/j.xplc.2025.101416
123.
Wang G Li Z Li G Dai G Xiao Q Bai L et al . Real-time liver tracking algorithm based on LSTM and SVR networks for use in surface-guided radiation therapy. Radiat Oncol. (2021) 16:13. doi: 10.1186/s13014-020-01729-7
124.
Buszewski B Kesy M Ligor T Amann A . Human exhaled air analytics: biomarkers of diseases. Biomed Chromatogr. (2007) 21:553–66. doi: 10.1002/bmc.835
125.
Machado RF Laskowski D Deffenderfer O Burch T Zheng S Mazzone PJ et al . Detection of lung cancer by sensor array analyses of exhaled breath. Am J Respir Crit Care Med. (2005) 171:1286–91. doi: 10.1164/rccm.200409-1184OC
126.
Phillips M Cataneo RN Cummin ARC Gagliardi AJ Gleeson K Greenberg J et al . Detection of lung cancer with volatile markers in the breath. Chest. (2003) 123:2115–23. doi: 10.1378/chest.123.6.2115
127.
Nakhleh MK Amal H Jeries R Broza YY Aboud M Gharra A et al . Diagnosis and Classification of 17 Diseases from 1404 Subjects via Pattern Analysis of Exhaled Molecules. ACS Nano. (2017) 11:112–25. doi: 10.1021/acsnano.6b04930
128.
Dragonieri S Schot R Mertens BJA Le Cessie S Gauw SA Spanevello A et al . An electronic nose in the discrimination of patients with asthma and controls. J Allergy Clin Immunol. (2007) 120:856–62. doi: 10.1016/j.jaci.2007.05.043
129.
Aurora P Bush A Gustafsson P Oliver C Wallis C Price J et al . Multiple-breath washout as a marker of lung disease in preschool children with cystic fibrosis. Am J Respir Crit Care Med. (2005) 171:249–56. doi: 10.1164/rccm.200407-895OC
130.
Güntner AT Abegg S Königstein K Gerber PA Schmidt-Trucksäss A Pratsinis SE . Breath Sensors for Health Monitoring. ACS Sens. (2019) 4:268–80. doi: 10.1021/acssensors.8b00937
131.
Wheelock CE Goss VM Balgoma D Nicholas B Brandsma J Skipp PJ et al . Application of 'omics technologies to biomarker discovery in inflammatory lung diseases. Eur Respir J. (2013) 42:802–25. doi: 10.1183/09031936.00078812
132.
Saalberg Y Wolff M . VOC breath biomarkers in lung cancer. Clin Chim Acta. (2016) 459:5–9. doi: 10.1016/j.cca.2016.05.013
133.
Pauling L Robinson AB Teranishi R Cary P . Quantitative analysis of urine vapor and breath by gas-liquid partition chromatography. Proc Natl Acad Sci U S A. (1971) 68:2374–6. doi: 10.1073/pnas.68.10.2374
134.
Hakim M Broza YY Barash O Peled N Phillips M Amann A et al . Volatile organic compounds of lung cancer and possible biochemical pathways. Chem Rev. (2012) 112:5949–66. doi: 10.1021/cr300174a
135.
Bajtarevic A Ager C Pienz M Klieber M Schwarz K Ligor M et al . Noninvasive detection of lung cancer by analysis of exhaled breath. BMC Cancer. (2009) 9:348. doi: 10.1186/1471-2407-9-348
136.
de Lacy CB Amann A Al-Kateb H Flynn C Filipiak W Khalid T et al . A review of the volatiles from the healthy human body. J Breath Res. (2014) 8:014001. doi: 10.1088/1752-7155/8/1/014001
137.
Fuchs P Loeseken C Schubert JK Miekisch W . Breath gas aldehydes as biomarkers of lung cancer. Int J Cancer. (2010) 126:2663–70. doi: 10.1002/ijc.24970
Summary
Keywords
mass spectrometry, breath test, respiratory diseases, volatile organic compounds, bibliometrics, biomarkers
Citation
Zhou Y, Qiu X, Yuan T, Wang Q, Du L, Wang L and Ding Z (2025) Research hotspots and frontiers of application of mass spectrometry breath test in respiratory diseases. Front. Med. 12:1618588. doi: 10.3389/fmed.2025.1618588
Received
26 April 2025
Accepted
29 July 2025
Published
13 August 2025
Volume
12 - 2025
Edited by
Yong-Xiao Wang, Albany Medical College, United States
Reviewed by
Venkata Ramireddy Narala, Yogi Vemana University, India
Hongxiao Li, Chinese Academy of Medical Sciences and Peking Union Medical College, China
Updates
Copyright
© 2025 Zhou, Qiu, Yuan, Wang, Du, Wang and Ding.
This is an open-access article distributed under the terms of the Creative Commons Attribution License (CC BY). The use, distribution or reproduction in other forums is permitted, provided the original author(s) and the copyright owner(s) are credited and that the original publication in this journal is cited, in accordance with accepted academic practice. No use, distribution or reproduction is permitted which does not comply with these terms.
*Correspondence: Lihua Wang, 2721322182@qq.comZhaohui Ding, 417894682@qq.com
Disclaimer
All claims expressed in this article are solely those of the authors and do not necessarily represent those of their affiliated organizations, or those of the publisher, the editors and the reviewers. Any product that may be evaluated in this article or claim that may be made by its manufacturer is not guaranteed or endorsed by the publisher.