Abstract
Objective:
To investigate the longitudinal association between the triglyceride-glucose (TyG) index and activities of daily living (ADL) disability in middle-aged and older adults with arthritis.
Methods:
We analyzed data from the China Health and Retirement Longitudinal Study (CHARLS, 2015–2018), including 2,695 arthritis patients without baseline ADL disability. The TyG index was calculated as ln [fasting triglycerides (mg/dL) × fasting plasma glucose (mg/dL)/2]. ADL disability was defined as a score of ≥ 1 based on combined basic and instrumental ADL assessments. Multivariable Cox proportional hazards models were employed to analyze the association, with potential non-linear relationship explored using restricted cubic splines.
Results:
Over a median follow-up of 35.98 months, 369 participants (13.69%) developed ADL disability. In fully adjusted models, each 1-unit increase in TyG index was associated with a 26% elevated risk of ADL disability (Hazard ratio [HR] = 1.26, 95% confidence interval [CI]: 1.05–1.51). Compared to the Low TyG, the moderate-High TyG and High TyG showed 40% (HR = 1.40, 95%CI: 1.02–1.92) and 64% (HR = 1.64, 95%CI: 1.18–2.29) increased risks, respectively (P-trend = 0.003). Restricted cubic spline analysis revealed that higher levels of TyG index (> 8.65) were associated with progressively higher ADL disability risk. Subgroup analyses indicated greater risk amplification in younger patients (< 60 years: High TyG vs. Low TyG HR = 1.98, 95%CI: 1.09–3.60). Sensitivity analyses showed that these associations remained statistically significant across multiple analytic approaches, including analyses of unimputed data (HR = 1.43, 95% CI: 1.10–1.86), weighted Cox models, directed acyclic graph-based minimum adequate adjustment, and competing-risks models.
Conclusion:
Elevated TyG index shows a significant independent association with ADL disability in arthritis patients. These findings provide mechanistic support for the “metabolic-joint axis” hypothesis and suggest that metabolic monitoring might facilitate identification of individuals with elevated risk profiles of functional decline. The TyG index may serve as an economical risk assessment tool in primary care settings.
1 Introduction
Arthritis, a degenerative inflammatory disease strongly associated with aging, primarily manifests as two subtypes: osteoarthritis and rheumatoid arthritis. As a leading global cause of disability, its burden is escalating rapidly with population aging (1). The Health, Well-Being, and Aging in Latin America and the Caribbean (SABE) study revealed that 23.8%–55.6% of arthritis patients aged ≥ 60 years experience limitations in activities of daily living (ADL) (2), while Mexico’s The Community Oriented Program for the Control of Rheumatic Diseases (COPCORD) project further demonstrated a 21.4% arthritis-related disability rate among those over 65 (3). Projections from the US National Health Interview Survey indicate that ADL disability prevalence among arthritis patients could exceed 11.4% by 2040 (4). ADL disability not only causes a precipitous decline in patients’ quality of life, but also leads to an annual wage loss of more than $65 billion and direct healthcare costs of more than $100 billion (5, 6). While traditional views attribute ADL disability to cartilage degeneration and mechanical stress, emerging evidence suggests metabolic dysregulation may accelerate functional decline through the “metabolic-joint axis” (7, 8).
Type 2 diabetes mellitus is identified as an independent risk factor for arthritis, with pathogenic mechanisms involving hyperglycemia-induced oxidative stress, chronic inflammation (e.g., IL-6 and TNF-α upregulation), and insulin resistance (IR)-associated muscle atrophy and neuropathy (9, 10). Notably, IR itself—beyond being a prediabetic marker—directly impairs joint function by disrupting cartilage matrix synthesis (collagen-proteoglycan imbalance) and exacerbating systemic low-grade inflammation (11, 12).
The triglyceride-glucose (TyG) index, mathematically expressed as ln[fasting triglycerides (mg/dL) × fasting glucose (mg/dL)/2], integrates lipid-glucose co-regulation dynamics. This dual-marker approach captures both β-cell dysfunction (reflected by glucose elevation) and dysregulated adipose tissue lipolysis (manifested as triglyceride accumulation), thereby providing higher sensitivity for early insulin signaling impairment detection compared to isolated hyperglycemia or dyslipidemia (13). As a well-validated insulin resistance biomarker showing robust correlations with both hyperinsulinemic-euglycemic clamp measurements and HOMA-IR (14, 15), the TyG index offers exceptional clinical practicality in primary healthcare. Unlike the clamp technique (labor-intensive and costly) or HOMA-IR (requiring precise insulin assays), the TyG index requires only fasting lipid and glucose measurements (16). However, existing research predominantly focuses on cardiovascular outcomes, leaving its risk association for ADL disability in arthritis populations unexplored.
Utilizing the China Health and Retirement Longitudinal Study (CHARLS) cohort, this study examines the association between TyG index and ADL disability risk among middle-aged and older adults with arthritis. We hypothesize that the TyG index, as a composite metabolic indicator, is associated with increased risk of ADL disability. Demonstration of this association could inform more comprehensive intervention strategies, potentially integrating metabolic monitoring with joint care approaches. This aligns with WHO’s healthy aging objectives by identifying a modifiable biomarker for multifactorial chronic disease management.
2 Materials and methods
2.1 Data sources
This study utilized data from CHARLS database to conduct a three-year prospective cohort analysis (2015–2018). A three-year observation window was adopted to adequately capture longitudinal variations in the TyG index and ADL disability while mitigating follow-up attrition risks. CHARLS, a nationally representative cohort of community-dwelling adults aged ≥ 45 years across 28 Chinese provinces, initially enrolled 17,708 participants from 150 county-level districts during its baseline survey (2011). Subsequent follow-ups were conducted biennially or triennially through 2020. The study protocol received ethical approval from the Peking University Biomedical Ethics Committee (IRB00001052–11015), with written informed consent obtained from all participants.
2.2 Study population and outcome
The study population comprised arthritis patients identified from the CHARLS database. Detailed inclusion flow is illustrated in Figure 1. The primary outcome was the occurrence of ADL disability.
FIGURE 1

Flow chart of patients selection.
2.3 Inclusion and exclusion criteria
Inclusion criteria:
-
(1)
Patients diagnosed with arthritis in the 2015 wave: The diagnosis of arthritis was based on self-reported medical history data collected through standardized questionnaires. Participants who answered “yes” to the structured question “Have you ever been diagnosed with arthritis by a doctor?” during baseline and follow-up surveys were considered to have arthritis
-
(2)
Complete fasting blood glucose and triglyceride data in the 2015 wave (fasting ≥ 8 h)
-
(3)
Complete ADL assessment data at both baseline (2015) and follow-up (2018) waves
Exclusion criteria:
-
(1)
pre-existing ADL disability in the 2015 wave
-
(2)
> 20% missing data across variables
2.4 Data extraction
2.4.1 Assessment of the TyG index
The following formula was used to determine the TyG index: ln [triglyceride concentration (mg/dL) × fasting blood glucose concentration (mg/dL)/2].
2.4.2 ADL disability assessment
Activities of Daily Living (ADL) disability was assessed through two components: basic ADL (BADL, 6 items) and instrumental ADL (IADL, 5 items). BADL quantified essential self-care abilities: bathing, dressing, indoor mobility, toileting, feeding, and continence control. IADL evaluated complex task performance: housekeeping, cooking, shopping, financial management, and medication adherence. Existing evidence supports BADL and IADL as independent predictors of functional disability in older adults (17, 18). Each item was scored dichotomously (0 = independent, 1 = assistance required). The total ADL score (range 0–11) was derived from the sum of BADL (6 items) and IADL (5 items) scores, with higher values indicating greater disability. Using a validated cutoff, participants with total scores ≥ 1 were classified as having ADL disability (coded 1), while scores = 0 indicated functional independence (coded 0) (19).
2.4.3 Covariates
The analysis incorporated covariates spanning four domains: sociodemographic characteristics, health behaviors and comorbidities, physical pain assessment, and muscle strength measurements. Sociodemographic covariates included age (continuous), sex (male/female), residence (urban/rural), highest educational attainment (illiterate, primary school, middle school, high school or above), and annual household income (continuous). Educational classification followed self-reported criteria: illiteracy was defined as no formal education; completion of elementary curriculum or demonstrated basic literacy skills qualified as primary education; middle school graduation denoted middle school level; high school or higher graduation indicated high school or above. Health behavior covariates comprised body mass index (BMI, continuous), smoking history (≥ 100 cumulative cigarettes smoked in lifetime), and alcohol consumption (abstinence in the past year). Diagnostic criteria for comorbidities were as follows: hypertension required either self-reported physician diagnosis or on-site measurement of systolic blood pressure ≥ 140 mmHg and/or diastolic blood pressure ≥ 90 mmHg; diabetes encompassed self-reported diagnosis or laboratory-confirmed fasting glucose abnormalities/impaired glucose tolerance. Physical pain was assessed using a standardized questionnaire capturing presence/absence of pain in 12 anatomical regions (head, shoulders, arms, wrists, fingers, back, waist, hips, legs, knees, ankles) coded as binary variables (yes/no). Grip strength was measured bilaterally using a Jamar Plus + digital dynamometer with two trials per hand. Participants unable to complete testing due to severe pain, joint swelling, or postoperative conditions were excluded. The maximum grip strength value from either hand was analyzed.
2.5 Statistical analysis
All statistical analyses were performed using R software (version 4.4.0). To ensure data quality, potential outliers were first identified and treated using the interquartile range (IQR) method, with all outliers treated as missing values. For missing data, variables with > 20% missingness were excluded, while those with ≤ 20% missingness were handled using multiple imputation by chained equations.
The study subjects were divided into 4 groups based on quartiles of TyG index levels, namely Low TyG, Moderate-Low TyG, Moderate-High TyG, and High TyG. Continuous variables were described as mean ± standard deviation for normally distributed data (compared using one-way ANOVA) or median (IQR) for non-normally distributed data (compared using Kruskal-Wallis test). Categorical variables were presented as counts (percentages) [n (%)], with between-group differences assessed by χ2 test or Fisher’s exact test. Additionally, participants were categorized into independence and disability groups based on ADL disability occurrence during follow-up.
To examine the association between TyG index and ADL disability in arthritis patients, Cox proportional hazards models were employed to estimate hazard ratios (HR) and 95% confidence intervals (CI). Three progressively adjusted models were constructed: Model 1 adjusted for age, sex (female/male), residence (urban/rural), education (illiteracy/elementary school/middle school/high school or above) and Income; Model 2 additionally adjusted for bmi, smoking (no/yes), drinking (no/yes), hypertension (no/yes) and diabetes (no/yes); Model 3 further adjusted for headache (no/yes), shoulder pain (no/yes), arm pain (no/yes), wrist pain (no/yes), finger pain (no/yes), back pain (no/yes), lumbar pain (no/yes), hip pain (no/yes), leg pain (no/yes), knee pain (no/yes), ankle pain (no/yes) and grip strength. TyG index was analyzed both as a continuous variable (per SD increment) and categorical variable (quartiles).
To prevent overfitting, variance inflation factors (VIF) were calculated (VIF ≥ 5 indicating multicollinearity). Potential non-linear relationship were explored using restricted cubic splines (RCS, 4 knots). Subgroup analyses were performed by stratifying participants according to age (< 60 years/ > = 60 years), sex (female/male), residence (urban/rural), education (illiteracy/elementary school/middle school/high school or above), BMI (< 25 kg/m2/ > = 25 kg/m2), smoking (no/yes), drinking (no/yes), hypertension (no/yes) and diabetes (no/yes). To ensure the robustness of our findings, we conducted comprehensive sensitivity analyses employing multiple advanced statistical approaches. First, a robust weighted Cox proportional hazards model was utilized, with weights derived from deviance residuals, to minimize the potential influence of outliers on effect estimates. Second, we performed complete-case analyses using unimputed raw data (Outliers were treated as missing values) to evaluate potential bias introduced by missing data. Third, covariates were systematically adjusted based on the minimal sufficient adjustment set (MSAS) derived from causal directed acyclic graphs (DAGs) to strengthen causal inference (Supplementary Figure 1). The DAGs-based MSAS adjustment included age, sex (female/male), education (illiteracy/elementary school/middle school/high school or above), income, BMI, diabetes (no/yes), finger pain (no/yes), and knee pain (no/yes). Finally, to account for competing risks, we applied the Fine-Gray subdistribution hazards model when analyzing the risk of ADL disability, with death treated as a competing event. All statistical tests were two-tailed, with P < 0.05 considered statistically significant.
3 Results
3.1 Baseline characteristics of patients
This study ultimately included 2,695 eligible arthritis patients. As shown in Table 1, participants were stratified into four groups by TyG index quartiles: Low TyG (n = 674), Moderate-Low TyG (n = 674), Moderate-High TyG (n = 674), and High TyG (n = 673). Baseline characteristics revealed a cohort comprising 949 males (35.21%) and 1,746 females (64.79%), with a median age of 62 years. During a mean follow-up of 35.98 months, 369 patients (13.69%) developed ADL disability. Patients stratified by TyG quartiles exhibited significant intergroup differences in age, sex distribution, residential status, household income, BMI, smoking rate, hypertension prevalence, diabetes prevalence and upper limb pain incidence (all P < 0.05), while no significant differences were observed in other measured covariates. Notably, ADL disability rates showed a significant ascending trend across ascending TyG index quartiles (Low TyG:10.68% vs Moderate-Low TyG:13.65% vs Moderate-High TyG:14.39% vs High TyG:16.05%, P < 0.05).
TABLE 1
| Variable | Overall (N = 2695) | Low TyG (N = 674) | Moderate-Low TyG (N = 674) | Moderate-High TyG (N = 674) | High TyG (N = 673) | P |
| Age, years, median (IQR) | 62.00 (56.00,68.00) | 62.50 (57.00,68.00) | 63.00 (56.00,69.00) | 62.00 (56.00,68.00) | 62.00 (55.00,67.00) | 0.031 |
| Sex, n (%) | <0.001 | |||||
| Female | 1,746.00 (64.79) | 373.00 (55.34) | 445.00 (66.02) | 451.00 (66.91) | 477.00 (70.88) | |
| Male | 949.00 (35.21) | 301.00 (44.66) | 229.00 (33.98) | 223.00 (33.09) | 196.00 (29.12) | |
| Residence, n (%) | <0.001 | |||||
| Urban | 853.00 (31.65) | 163.00 (24.18) | 195.00 (28.93) | 212.00 (31.45) | 283.00 (42.05) | |
| Rural | 1,842.00 (68.35) | 511.00 (75.82) | 479.00 (71.07) | 462.00 (68.55) | 390.00 (57.95) | |
| Education, n (%) | 0.050 | |||||
| Illiteracy | 1,450.00 (53.80) | 384.00 (56.97) | 387.00 (57.42) | 343.00 (50.89) | 336.00 (49.93) | |
| Elementary school | 619.00 (22.97) | 150.00 (22.26) | 140.00 (20.77) | 173.00 (25.67) | 156.00 (23.18) | |
| Middle school | 452.00 (16.77) | 104.00 (15.43) | 109.00 (16.17) | 112.00 (16.62) | 127.00 (18.87) | |
| High school or above | 174.00 (6.46) | 36.00 (5.34) | 38.00 (5.64) | 46.00 (6.82) | 54.00 (8.02) | |
| Income, Ten thousand yuan, median (IQR) | 0.28 (0.10,1.94) | 0.23 (0.08,0.99) | 0.30 (0.10,1.60) | 0.29 (0.12,1.96) | 0.47 (0.12,2.76) | <0.001 |
| BMI, kg/m2, median (IQR) | 23.76 (21.48,26.54) | 22.12 (19.95,24.32) | 23.27 (21.12,25.63) | 24.54 (22.15,26.95) | 25.64 (23.34,28.24) | <0.001 |
| Smoking, n (%) | <0.001 | |||||
| No | 2,102.00 (78.00) | 479.00 (71.07) | 522.00 (77.45) | 549.00 (81.45) | 552.00 (82.02) | |
| Yes | 593.00 (22.00) | 195.00 (28.93) | 152.00 (22.55) | 125.00 (18.55) | 121.00 (17.98) | |
| Drinking, n (%) | 0.065 | |||||
| No | 1,931.00 (71.65) | 456.00 (67.66) | 488.00 (72.40) | 493.00 (73.15) | 494.00 (73.40) | |
| Yes | 764.00 (28.35) | 218.00 (32.34) | 186.00 (27.60) | 181.00 (26.85) | 179.00 (26.60) | |
| Hypertension, n (%) | <0.001 | |||||
| No | 1,201.00 (44.56) | 381.00 (56.53) | 311.00 (46.14) | 271.00 (40.21) | 238.00 (35.36) | |
| Yes | 1,494.00 (55.44) | 293.00 (43.47) | 363.00 (53.86) | 403.00 (59.79) | 435.00 (64.64) | |
| Diabetes, n (%) | <0.001 | |||||
| No | 2,126.00 (78.89) | 616.00 (91.39) | 579.00 (85.91) | 525.00 (77.89) | 406.00 (60.33) | |
| Yes | 569.00 (21.11) | 58.00 (8.61) | 95.00 (14.09) | 149.00 (22.11) | 267.00 (39.67) | |
| Headache, n (%) | 0.190 | |||||
| No | 1,959.00 (72.69) | 497.00 (73.74) | 502.00 (74.48) | 469.00 (69.58) | 491.00 (72.96) | |
| Yes | 736.00 (27.31) | 177.00 (26.26) | 172.00 (25.52) | 205.00 (30.42) | 182.00 (27.04) | |
| Shoulder pain, n (%) | 0.135 | |||||
| No | 1,925.00 (71.43) | 476.00 (70.62) | 503.00 (74.63) | 465.00 (68.99) | 481.00 (71.47) | |
| Yes | 770.00 (28.57) | 198.00 (29.38) | 171.00 (25.37) | 209.00 (31.01) | 192.00 (28.53) | |
| Arm pain, n (%) | 0.048 | |||||
| No | 2,081.00 (77.22) | 512.00 (75.96) | 531.00 (78.78) | 500.00 (74.18) | 538.00 (79.94) | |
| Yes | 614.00 (22.78) | 162.00 (24.04) | 143.00 (21.22) | 174.00 (25.82) | 135.00 (20.06) | |
| Wrist pain, n (%) | 0.335 | |||||
| No | 2,218.00 (82.30) | 553.00 (82.05) | 559.00 (82.94) | 541.00 (80.27) | 565.00 (83.95) | |
| Yes | 477.00 (17.70) | 121.00 (17.95) | 115.00 (17.06) | 133.00 (19.73) | 108.00 (16.05) | |
| Finger pain, n (%) | 0.500 | |||||
| No | 2,186.00 (81.11) | 546.00 (81.01) | 545.00 (80.86) | 537.00 (79.67) | 558.00 (82.91) | |
| Yes | 509.00 (18.89) | 128.00 (18.99) | 129.00 (19.14) | 137.00 (20.33) | 115.00 (17.09) | |
| Back pain, n (%) | 0.108 | |||||
| No | 2,082.00 (77.25) | 502.00 (74.48) | 532.00 (78.93) | 514.00 (76.26) | 534.00 (79.35) | |
| Yes | 613.00 (22.75) | 172.00 (25.52) | 142.00 (21.07) | 160.00 (23.74) | 139.00 (20.65) | |
| Lumbar pain, n (%) | 0.289 | |||||
| No | 1,676.00 (62.19) | 405.00 (60.09) | 411.00 (60.98) | 424.00 (62.91) | 436.00 (64.78) | |
| Yes | 1,019.00 (37.81) | 269.00 (39.91) | 263.00 (39.02) | 250.00 (37.09) | 237.00 (35.22) | |
| Hip pain, n (%) | 0.065 | |||||
| No | 2,349.00 (87.16) | 580.00 (86.05) | 594.00 (88.13) | 573.00 (85.01) | 602.00 (89.45) | |
| Yes | 346.00 (12.84) | 94.00 (13.95) | 80.00 (11.87) | 101.00 (14.99) | 71.00 (10.55) | |
| Leg pain, n (%) | 0.980 | |||||
| No | 1,852.00 (68.72) | 463.00 (68.69) | 467.00 (69.29) | 463.00 (68.69) | 459.00 (68.20) | |
| Yes | 843.00 (31.28) | 211.00 (31.31) | 207.00 (30.71) | 211.00 (31.31) | 214.00 (31.80) | |
| Knee pain, n (%) | 0.580 | |||||
| No | 1,777.00 (65.94) | 445.00 (66.02) | 455.00 (67.51) | 431.00 (63.95) | 446.00 (66.27) | |
| Yes | 918.00 (34.06) | 229.00 (33.98) | 219.00 (32.49) | 243.00 (36.05) | 227.00 (33.73) | |
| Ankle pain, n (%) | 0.113 | |||||
| No | 2,236.00 (82.97) | 550.00 (81.60) | 565.00 (83.83) | 546.00 (81.01) | 575.00 (85.44) | |
| Yes | 459.00 (17.03) | 124.00 (18.40) | 109.00 (16.17) | 128.00 (18.99) | 98.00 (14.56) | |
| Grip strength, kg, median (IQR) | 27.80 (22.20,34.00) | 28.10 (23.00,34.00) | 27.20 (22.00,33.50) | 27.50 (22.00,34.50) | 27.10 (22.50,34.00) | 0.183 |
| ADL disability, n (%) | 0.035 | |||||
| No | 2,326.00 (86.31) | 602.00 (89.32) | 582.00 (86.35) | 577.00 (85.61) | 565.00 (83.95) | |
| Yes | 369.00 (13.69) | 72.00 (10.68) | 92.00 (13.65) | 97.00 (14.39) | 108.00 (16.05) | |
Baseline characteristics stratified by TyG index quartile groups.
Low TyG: 7.29 < TyG ≤ 8.28, Moderate-Low TyG: 8.28 < TyG ≤ 8.65, Moderate-High TyG: 8.65 < TyG ≤ 9.11, High TyG: 9.11 < TyG ≤ 11.23. TyG, triglyceride-glucose index; ADL, activities of daily living; BMI, body mass index; IQR, interquartile range.
Supplementary Table 1 presents the comparative results stratified by ADL disability status (independent group, n = 2,326 vs disability group, n = 369). Significant between-group differences (P < 0.05) were observed for the following variables: age, residence, education level, household income, alcohol consumption, hypertension, diabetes, lumbar pain, hip pain, leg pain, knee pain, ankle pain, grip strength, and TyG index. No statistically significant differences were found for the remaining observed indicators.
3.2 TyG index and ADL disability in arthritis patients
Multivariable-adjusted Cox proportional hazards regression analysis demonstrated that TyG index maintained significant risk association for ADL disability risk after adjusting for confounders, whether analyzed as a continuous or categorical variable (Table 2). Specifically, in the fully adjusted model (Model 3), each 1-unit increase in TyG index was associated with a 26% elevated risk of ADL disability (HR = 1.26, 95% CI: 1.05–1.51). When stratified by TyG index quartiles, compared with Low TyG (reference), Moderate-High TyG and High TyG groups exhibited 40% (HR = 1.40, 95% CI: 1.02–1.92) and 64% (HR = 1.64, 95% CI: 1.18–2.29) increased risks, respectively, with a statistically significant monotonic trend across quartiles (P-trend = 0.003). RCS analysis showed that higher levels of TyG index (> 8.65) were associated with an increased risk of ADL disability (Figure 2).
TABLE 2
| Continuous variable | TyG index (HR, 95% CI) | P for trenda | ||||
| Low TyG | Moderate-Low TyG | Moderate-High TyG | High TyG | |||
| Model 1 HR (95%CI) | 1.33 (1.13, 1.56)** | Ref. | 1.30 (0.95, 1.77) | 1.47 (1.08, 2.00)* | 1.77 (1.31, 2.41)*** | < 0.001 |
| Model 2 HR (95%CI) | 1.23 (1.03, 1.47)* | Ref. | 1.26 (0.92, 1.72) | 1.37 (1.00, 1.88)* | 1.59 (1.14, 2.21)* | 0.006 |
| Model 3 HR (95%CI) | 1.26 (1.05, 1.51)* | Ref. | 1.25 (0.91, 1.71) | 1.40 (1.02, 1.92)* | 1.64 (1.18, 2.29)** | 0.003 |
Association between TyG index and ADL disability.
Low TyG: 7.29 < TyG ≤ 8.28, Moderate-Low TyG: 8.28 < TyG ≤ 8.65, Moderate-High TyG: 8.65 < TyG ≤ 9.11, High TyG: 9.11 < TyG ≤ 11.23. TyG, triglyceride-glucose index; ADL, activities of daily living; CI, confidence interval; HR, hazard ratio; Ref, reference. Model 1 was adjusted for age, sex (female/male), Residence (urban/rural), education (illiteracy/elementary school/middle school/high school or above) and Income. Model 2 was additionally adjusted for bmi, smoking (no/yes), drinking (no/yes), hypertension (no/yes) and diabetes (no/yes). Model 3 was additionally adjusted for headache (no/yes),shoulder pain (no/yes), arm pain (no/yes), wrist pain (no/yes), finger pain (no/yes), back pain (no/yes), lumbar pain (no/yes), hip pain (no/yes), leg pain (no/yes), knee pain (no/yes), ankle pain (no/yes) and grip strength.
aP for trend was estimated by including the quartile of the TyG index as a continuous variable. *P < 0.05; **P < 0.01; ***P < 0.001.
FIGURE 2
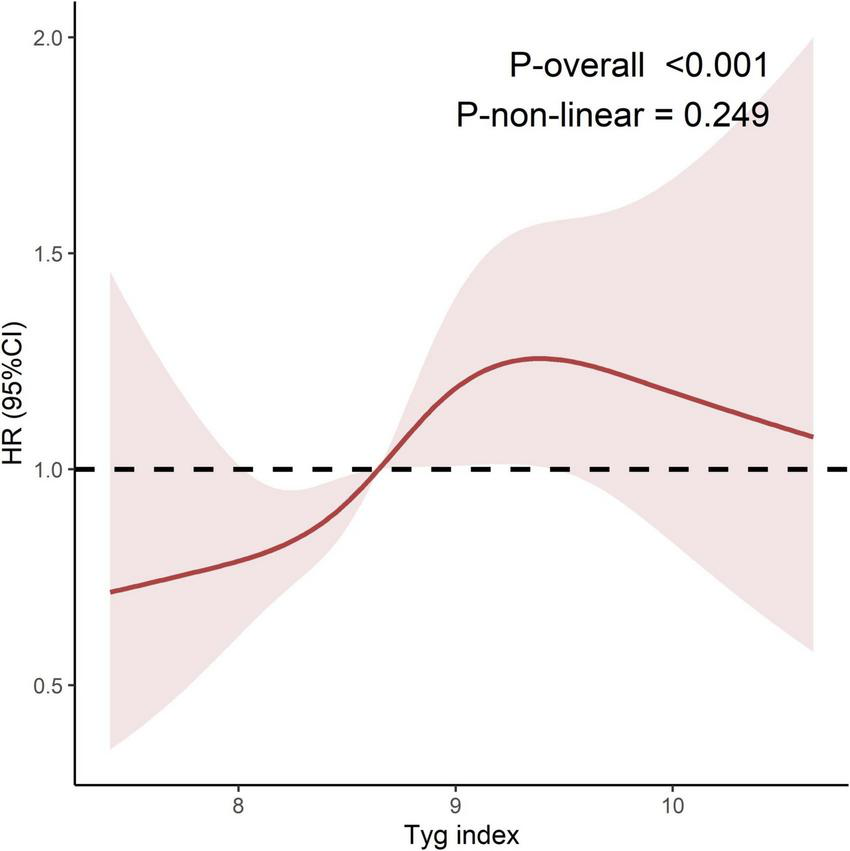
Restricted cubic spline regression of TyG index and ADL disability. TyG, triglyceride-glucose index; ADL, activities of daily living; CI, confidence interval; HR, Hazard ratio; Ref, Reference. Model adjusted for age, sex (female/male), Residence (urban/rural), education (illiteracy/elementary school/middle school/high school or above), Income, bmi, smoking (no/yes), drinking (no/yes), hypertension (no/yes), diabetes (no/yes, headache (no/yes), shoulder pain (no/yes), arm pain (no/yes), wrist pain (no/yes), finger pain (no/yes), back pain (no/yes), lumbar pain (no/yes), hip pain (no/yes), leg pain (no/yes), knee pain (no/yes), ankle pain (no/yes) and grip strength. The number of nodes was 4, and the reference value was 8.65.
3.3 Subgroup analysis
Subgroup analyses stratified by demographic and clinical characteristics (age, sex, residence, education level, BMI, smoking status, alcohol consumption, hypertension, and diabetes status) were conducted to evaluate the robustness of TyG index-ADL disability association (Table 3). In the continuous variable model, each unit increment in TyG index demonstrated significantly elevated risks of ADL disability across multiple subgroups: participants aged < 60 years (HR = 1.46, 95% CI: 1.06–2.01), males (HR = 1.54, 95% CI: 1.13–2.11), rural residents (HR = 1.29, 95% CI: 1.03–1.60), those with elementary education (HR = 1.51, 95% CI: 1.01–2.26), individuals with BMI ≥ 25 kg/m2 (HR = 1.35, 95% CI: 1.02–1.79), current smokers (HR = 1.65, 95% CI: 1.13–2.42), non-drinkers (HR = 1.23, 95% CI: 1.00–1.52), and participants without hypertension (HR = 1.56, 95% CI: 1.14–2.13) or diabetes (HR = 1.26, 95% CI: 1.01–1.57). Notably, with ADL disability risk exhibiting monotonic elevation across ascending TyG index quartiles (P-trend < 0.001). Interaction analyses identified significant effect modification by age strata (P-interaction = 0.039), with particularly pronounced TyG-ADL disability association in the younger subgroup (< 60 years: High TyG vs Low TyG HR = 1.98, 95% CI: 1.09–3.60) compared to older counterparts. No other stratified variables demonstrated statistically significant interaction effects.
TABLE 3
| Subgroup | Continuous variable | TyG index (HR, 95% CI) | P for trenda | P for interactionb | |||
| Low TyG | Moderate-Low TyG | Moderate-High TyG | High TyG | ||||
| Age | 0.039 | ||||||
| < 60 years | 1.46 (1.06, 2.01)* | Ref. | 0.79 (0.40, 1.58) | 1.87 (1.03, 3.41)* | 1.98 (1.09, 3.60)* | 0.003 | |
| ≥ 60 years | 1.12 (0.89, 1.41) | Ref. | 1.39 (0.97, 1.98) | 1.24 (0.85, 1.81) | 1.40 (0.93, 2.10) | 0.191 | |
| Sex | 0.145 | ||||||
| Female | 1.12 (0.89, 1.41) | Ref. | 1.03 (0.70, 1.53) | 1.04 (0.70, 1.55) | 1.25 (0.83, 1.88) | 0.278 | |
| Male | 1.54 (1.13, 2.11)* | Ref. | 1.52 (0.89, 2.57) | 2.34 (1.38, 3.97)** | 2.43 (1.36, 4.32)** | 0.001 | |
| Residence | 0.476 | ||||||
| Urban | 1.26 (0.89, 1.79) | Ref. | 0.76 (0.39, 1.50) | 0.80 (0.40, 1.57) | 1.15 (0.62, 2.13) | 0.482 | |
| Rural | 1.29 (1.03, 1.60)* | Ref. | 1.48 (1.03, 2.11)* | 1.66 (1.15, 2.41)** | 1.89 (1.27, 2.82)** | 0.002 | |
| Education | 0.177 | ||||||
| Illiteracy | 1.18 (0.93, 1.48) | Ref. | 1.36 (0.93, 2.00) | 1.37 (0.92, 2.04) | 1.49 (0.98, 2.27) | 0.084 | |
| Elementary school | 1.51 (1.01, 2.26)* | Ref. | 1.58 (0.76, 3.28) | 1.99 (0.98, 4.02) | 2.61 (1.22, 5.56)* | 0.011 | |
| Middle school | 1.25 (0.68, 2.28) | Ref. | 0.65 (0.23, 1.85) | 0.70 (0.25, 1.99) | 1.31 (0.48, 3.57) | 0.523 | |
| High school or above | 2.72 (0.55, 13.49) | Ref. | 0.03 (0.00, 1.04) | 0.50 (0.03, 7.19) | 0.46 (0.02, 9.21) | 0.633 | |
| BMI | 0.909 | ||||||
| < 25 kg/m2 | 1.19 (0.93, 1.53) | Ref. | 1.34 (0.93, 1.93) | 1.27 (0.85, 1.91) | 1.78 (1.16, 2.73)** | 0.016 | |
| ≥ 25 kg/m2 | 1.35 (1.02, 1.79)* | Ref. | 0.99 (0.54, 1.82) | 1.37 (0.77, 2.41) | 1.42 (0.80, 2.49) | 0.104 | |
| Smoking | 0.651 | ||||||
| No | 1.17 (0.95, 1.45) | Ref. | 1.21 (0.83, 1.75) | 1.25 (0.86, 1.82) | 1.43 (0.97, 2.11) | 0.080 | |
| Yes | 1.65 (1.13, 2.42)** | Ref. | 1.28 (0.71, 2.32) | 2.05 (1.10, 3.79)* | 2.60 (1.32, 5.14)** | 0.003 | |
| Drinking | 0.921 | ||||||
| No | 1.23 (1.00, 1.52)* | Ref. | 1.24 (0.87, 1.78) | 1.33 (0.92, 1.91) | 1.49 (1.02, 2.19)* | 0.045 | |
| Yes | 1.37 (0.93, 2.04) | Ref. | 1.22 (0.64, 2.35) | 1.77 (0.90, 3.50) | 2.29 (1.14, 4.61)* | 0.013 | |
| Hypertension | 0.589 | ||||||
| No | 1.56 (1.14, 2.13)* | Ref. | 1.17 (0.71, 1.91) | 1.39 (0.83, 2.34) | 2.01 (1.19, 3.39)** | 0.009 | |
| Yes | 1.10 (0.88, 1.39) | Ref. | 1.32 (0.87, 2.01) | 1.39 (0.92, 2.11) | 1.43 (0.92, 2.23) | 0.135 | |
| Diabetes | 0.270 | ||||||
| No | 1.26 (1.01, 1.57)* | Ref. | 1.12 (0.80, 1.56) | 1.37 (0.97, 1.94) | 1.56 (1.07, 2.26)* | 0.010 | |
| Yes | 1.25 (0.88, 1.76) | Ref. | 2.76 (0.99, 7.68) | 1.57 (0.58, 4.29) | 2.33 (0.87, 6.25) | 0.329 | |
Subgroup analyses of the association between TyG index and ADL disability.
Low TyG: 7.29 < TyG ≤ 8.28, Moderate-Low TyG: 8.28 < TyG ≤ 8.65, Moderate-High TyG: 8.65 < TyG ≤ 9.11, High TyG: 9.11 < TyG ≤ 11.23. TyG, triglyceride-glucose index; ADL, activities of daily living; CI, confidence interval; HR, hazard ratio; Ref, reference. Model adjusted for all variables except the subgroup variable, including age, sex (female/male), Residence (urban/rural), education (illiteracy/elementary school/middle school/high school or above), Income, bmi, smoking (no/yes), drinking (no/yes), hypertension (no/yes), diabetes (no/yes, headache (no/yes), shoulder pain (no/yes), arm pain (no/yes), wrist pain (no/yes), finger pain (no/yes), back pain (no/yes), lumbar pain (no/yes), hip pain (no/yes), leg pain (no/yes), knee pain (no/yes), ankle pain (no/yes) and grip strength. aP for trend was estimated by including the quartile of the TyG index as a continuous variable. bP for interaction was calculated by adding an interaction term of the quartile of the TyG index and the stratification variable in cox regression models. *P < 0.05; **P < 0.01; ***P < 0.001.
3.4 Sensitivity analysis
The sensitivity analyses consistently demonstrated the stability of our primary findings across different analytical approaches (Supplementary Table 2). In analyses using non-imputed data, each unit increase in TyG index remained significantly associated with ADL disability risk (HR = 1.43, 95% CI: 1.10–1.86). When examining TyG index by quartiles, we observed a consistent pattern of increasing risk estimates across successively higher quartiles (P-trend < 0.01). Specifically, participants in the High TyG quartile exhibited a 2.10-fold increased risk (HR = 2.10, 95% CI: 1.29–3.42) compared to the reference group, while those in the Moderate-High quartile showed a 1.74-fold increased risk (HR = 1.74, 95% CI: 1.09–2.78). These associations maintained statistical significance across various model specifications, including weighted Cox regression, DAG-based minimal sufficient adjustment, and competing risk analysis, supporting the robustness of our findings to different methodological assumptions.
4 Discussion
This study, which utilized the CHARLS longitudinal cohort, is the first to demonstrate a significant association between the TyG index and ADL disability in middle-aged and older adults with arthritis. Over a mean follow-up of 3 years, patients with elevated TyG indices exhibited a higher risk of ADL disability. Compared to the Low TyG, the High TyG was associated with a 64% increased risk of ADL disability, while each 1-unit increase in the TyG index corresponded to a 26% elevation in risk. These findings not only support the “metabolic-joint axis” theory but also suggest IR may contribute to functional decline in arthritis, offering novel therapeutic targets for clinical intervention.
Insulin resistance, a cardinal pathological feature of metabolic dysregulation, is characterized by progressive impairment of insulin-mediated glucose uptake and utilization in peripheral tissues, often occurring under normal or elevated circulating insulin levels. While the hyperinsulinemic-euglycemic clamp remains the gold standard for IR assessment, its clinical application is hindered by procedural complexity, time requirements, and high costs (20). Alternative biomarkers such as QUICKI and HOMA-IR, though widely used, face limitations due to their reliance on complex calculations or insulin assays (21, 22). In contrast, the TyG index has emerged as a practical and cost-effective alternative. Multiple studies confirm its strong correlation with clamp-measured insulin sensitivity (23, 24) and its superior diagnostic accuracy for metabolic syndrome compared to HOMA-IR, as evidenced by a significantly larger area under the ROC curve (15). Notably, the TyG index requires only routine fasting lipid and glucose measurements, enabling “minimal additional cost” implementation in primary care settings and large-scale epidemiological studies (25).
Prior research has predominantly focused on the relationship between metabolic syndrome and structural progression of arthritis. This study innovatively extends the investigation to functional outcomes. Consistent with the “metabolic arthropathy” hypothesis proposed by Zhuo et al. (7), elevated TyG indices may exacerbate functional impairment through multiple mechanisms: IR-induced hyperglycemia promotes “glucotoxicity,” leading to oxidative stress, accumulation of advanced glycation end products (AGEs), and inflammatory cytokine release, directly damaging joint tissues (26). Simultaneously, IR suppresses chondrocyte autophagy (e.g., reduced autophagic flux, enhanced Akt phosphorylation, and rpS6 protein synthesis), impairing metabolic waste clearance and accelerating cartilage degradation (27). In synovial cells, IR diminishes insulin’s inhibitory effects on matrix-degrading enzymes (MMP1 and MMP13) while activating the PI3K/mTOR/Akt/NF-κB pathway, fostering a pro-inflammatory microenvironment and sustained autophagy suppression (28). Additionally, IR-associated glucose metabolism dysregulation drives abnormal synovial glycolysis (e.g., upregulated phosphoglycerate kinase activity) and IL-34-mediated glycolytic amplification, promoting inflammatory macrophage polarization, Th1/Th17 cell activation, and synovial hyperplasia, thereby exacerbating joint destruction (29). IR further downregulates glucose transporters (Glut1/Glut4), reducing energy supply to cartilage and hastening degeneration (30). Collectively, these mechanisms disrupt joint metabolic homeostasis, establishing IR as a central driver of arthritis progression. The observed stronger association between TyG index and ADL disability in middle-aged participants (45–60 years) compared to their older counterparts (≥ 60 years) may reflect critical transitions in metabolic-joint pathophysiology during aging. In middle-aged individuals, several converging factors likely contribute to heightened metabolic vulnerability: (1) This life stage represents a pivotal window when early metabolic dysfunction begins to manifest clinically, yet age-related compensatory mechanisms remain underdeveloped. The musculoskeletal system retains sufficient functional reserve to reveal metabolic influences before being overwhelmed by advanced degenerative changes that dominate in later years. (2) Compared to older adults, middle-aged individuals typically maintain higher physical activity levels and greater mechanical loading demands, potentially amplifying the clinical impact of metabolic impairments on functional capacity.
Our findings support the integration of TyG index assessment into routine arthritis care to guide personalized treatment strategies. For patients with TyG levels > 8.65—particularly middle-aged individuals (45–60 years) who showed the strongest metabolic vulnerability—a dual approach targeting both metabolic dysfunction and joint health should be implemented. Clinicians should prioritize structured lifestyle interventions, including Mediterranean-style, low-glycemic diets and progressive resistance training, while considering adjunctive pharmacotherapy with insulin-sensitizing agents like metformin or GLP-1 receptor agonists for high-risk patients. Rehabilitation programs should incorporate metabolic monitoring alongside targeted periarticular muscle strengthening to disrupt the cycle of metabolic deterioration and functional decline. Nursing teams play a crucial role in patient education, monitoring adherence to lifestyle modifications, and facilitating coordination between physicians, dietitians, and physical therapists. At the healthcare system level, incorporating TyG screening into standard arthritis assessments would enable early identification of at-risk patients, allowing for timely intervention during the critical middle-age window when metabolic management may be most effective in preserving function.
Several limitations of this study warrant careful consideration when interpreting the findings. First, reliance on a single database may introduce regional and selection biases, potentially limiting the generalizability of our results. Second, the exclusive use of self-reported arthritis diagnoses represents a notable limitation, as participant recall or reporting inaccuracies may lead to disease misclassification. Importantly, such non-differential misclassification would typically bias effect estimates toward the null hypothesis, suggesting that our observed associations may represent conservative estimates of the true relationship between TyG index and ADL disability risk. While this limitation precludes definitive conclusions about arthritis-specific mechanisms, the consistent results across sensitivity analyses strengthen confidence in the overall metabolic risk association. Additionally, the inability to distinguish between osteoarthritis and rheumatoid arthritis subtypes represents a significant constraint, as these conditions may demonstrate distinct metabolic pathways and differential associations with functional decline. Finally, the single baseline measurement of TyG index precluded our ability to examine temporal metabolic changes in relation to disability progression. Future studies should incorporate clinically confirmed arthritis diagnoses with subtype differentiation in multicenter cohorts, while implementing serial TyG measurements to assess dynamic metabolic changes. Complementary mechanistic studies combining advanced joint imaging with metabolomic profiling could elucidate subtype-specific pathways linking metabolic dysregulation to functional decline. These approaches would provide more robust evidence for potential clinical applications of TyG index monitoring in arthritis management.
5 Conclusion
This study demonstrates a strong, independent association between elevated TyG index and increased risk of ADL disability in middle-aged and older adults with arthritis, showing progressively higher risks with increasing TyG levels. These findings suggest the potential value of incorporating metabolic profiling into joint care strategies, with the TyG index representing a practical screening measure for identifying high-risk individuals.
Statements
Data availability statement
The original contributions presented in this study are included in this article/Supplementary material, further inquiries can be directed to the corresponding author.
Ethics statement
The studies involving humans were approved by The CHARLS study has gotten the approval for interviewing respondents and collecting data by the Biomedical Ethics Review Committee of Peking University (IRB00001052–11015), and the informed consent was required to sign by the respondents. The studies were conducted in accordance with the local legislation and institutional requirements. Written informed consent for participation was not required from the participants or the participants’ legal guardians/next of kin in accordance with the national legislation and institutional requirements.
Author contributions
LM: Visualization, Validation, Software, Writing – original draft, Formal Analysis, Investigation, Data curation. Y-lM: Writing – review and editing, Supervision. Z-mL: Supervision, Writing – review and editing. S-wJ: Supervision, Writing – review and editing. D-qL: Writing – review and editing, Project administration, Conceptualization.
Funding
The author(s) declare that no financial support was received for the research and/or publication of this article.
Acknowledgments
We extend our gratitude to the Wuhan University and Peking University for their contributions to the CHARLS Project, which made this research possible.
Conflict of interest
The authors declare that the research was conducted in the absence of any commercial or financial relationships that could be construed as a potential conflict of interest.
Generative AI statement
The authors declare that no Generative AI was used in the creation of this manuscript.
Publisher’s note
All claims expressed in this article are solely those of the authors and do not necessarily represent those of their affiliated organizations, or those of the publisher, the editors and the reviewers. Any product that may be evaluated in this article, or claim that may be made by its manufacturer, is not guaranteed or endorsed by the publisher.
Supplementary material
The Supplementary Material for this article can be found online at: https://www.frontiersin.org/articles/10.3389/fmed.2025.1618606/full#supplementary-material
References
1.
Safiri S Kolahi A Cross M Hill C Smith E Carson-Chahhoud K et al Prevalence, deaths, and disability-adjusted life years due to musculoskeletal disorders for 195 countries and territories 1990-2017. Arthritis Rheumatol. (2021). 73:702–14. 10.1002/art.41571
2.
Al Snih S Ray L Markides K . Prevalence of self-reported arthritis among elders from Latin America and the caribbean and among Mexican Americans from the southwestern United States.J Aging Health. (2006) 18:207–23. 10.1177/0898264305285661
3.
Rodriguez-Amado J Moreno-Montoya J Alvarez-Nemegyei J Goycochea-Robles M Sanin L Burgos-Vargas R et al The social gap index and the prevalence of osteoarthritis in the community: A cross-sectional multilevel study in Mexico. Clin Rheumatol. (2016) 35:175–82. 10.1007/s10067-014-2776-y
4.
Hootman J Helmick C Barbour K Theis K Boring M . Updated projected prevalence of self-reported doctor-diagnosed arthritis and arthritis-attributable activity limitation among US adults, 2015-2040.Arthritis Rheumatol. (2016) 68:1582–7. 10.1002/art.39692
5.
Holdgaard A Eckhardt-Hansen C Lund T Lassen C Sibiliz K Høfsten D et al Intensive group-based cognitive therapy in patients with cardiac disease and psychological distress-a randomized controlled trial protocol. Trials. (2021) 22:455. 10.1186/s13063-021-05405-3
6.
Hollander S McElhinney D Almond C McDonald N Chen S Kaufman B et al Rehospitalization after pediatric heart transplantation: Incidence, indications, and outcomes. Pediatr Transplant. (2017) 21: 10.1111/petr.12857
7.
Zhuo Q Yang W Chen J Wang Y . Metabolic syndrome meets osteoarthritis.Nat Rev Rheumatol. (2012) 8:729–37. 10.1038/nrrheum.2012.135
8.
Courties A Sellam J . Osteoarthritis and type 2 diabetes mellitus: What are the links?Diabetes Res Clin Pract. (2016) 122:198–206. 10.1016/j.diabres.2016.10.021
9.
Griffin T Huffman K . Editorial: Insulin resistance: Releasing the brakes on synovial inflammation and osteoarthritis?Arthritis Rheumatol. (2016) 68:1330–3. 10.1002/art.39586
10.
Nicolau J Lequerré T Bacquet H Vittecoq O . Rheumatoid arthritis, insulin resistance, and diabetes.Joint Bone Spine. (2017) 84:411–6. 10.1016/j.jbspin.2016.09.001
11.
Claassen H Schicht M Paulsen F . Impact of sex hormones, insulin, growth factors and peptides on cartilage health and disease.Prog Histochem Cytochem. (2011) 45:239–93. 10.1016/j.proghi.2010.11.002
12.
Hart D Doyle D Spector T . Association between metabolic factors and knee osteoarthritis in women: The Chingford study.J Rheumatol. (1995) 22:1118–23.
13.
Tao L Xu J Wang T Hua F Li J . Triglyceride-glucose index as a marker in cardiovascular diseases: Landscape and limitations.Cardiovasc Diabetol. (2022) 21:68. 10.1186/s12933-022-01511-x
14.
Du T Yuan G Zhang M Zhou X Sun X Yu X . Clinical usefulness of lipid ratios, visceral adiposity indicators, and the triglycerides and glucose index as risk markers of insulin resistance.Cardiovasc Diabetol. (2014) 13:146. 10.1186/s12933-014-0146-3
15.
Jiao Y Su Y Shen J Hou X Li Y Wang J et al Evaluation of the long-term prognostic ability of triglyceride-glucose index for elderly acute coronary syndrome patients: A cohort study. Cardiovasc Diabetol. (2022) 21:3. 10.1186/s12933-021-01443-y
16.
Gao J Hao Q Gao M Zhang K Li X Wang J et al Triglyceride-glucose index in the development of peripheral artery disease: Findings from the atherosclerosis risk in communities (ARIC) study. Cardiovasc Diabetol. (2021) 20:126. 10.1186/s12933-021-01319-1
17.
Zhang Y Xiong Y Yu Q Shen S Chen L Lei X . The activity of daily living (ADL) subgroups and health impairment among Chinese elderly: A latent profile analysis.BMC Geriatr. (2021) 21:30. 10.1186/s12877-020-01986-x
18.
Yang F Gu D . Predictability of frailty index and its components on mortality in older adults in China.BMC Geriatr. (2016) 16:145. 10.1186/s12877-016-0317-z
19.
Belgrave M Palmer K Luger Motyka T . Creative aging in virtual spaces: Using museum content and music therapy to explore cultural diversity.Front Med (Lausanne). (2023) 10:1273000. 10.3389/fmed.2023.1273000
20.
Greenfield M Doberne L Kraemer F Tobey T Reaven G . Assessment of insulin resistance with the insulin suppression test and the euglycemic clamp.Diabetes. (1981) 30:387–92. 10.2337/diab.30.5.387
21.
Brun J Ghanassia E Fédou C Bordenave S Raynaud de Mauverger E Mercier J . Assessment of insulin sensitivity (S I) and glucose effectiveness (S G) from a standardized hyperglucidic breakfast test in type 2 diabetics exhibiting various levels of insulin resistance.Acta Diabetol. (2013) 50:143–53. 10.1007/s00592-010-0232-2
22.
Matthews D Hosker J Rudenski A Naylor B Treacher D Turner R . Homeostasis model assessment: Insulin resistance and beta-cell function from fasting plasma glucose and insulin concentrations in man.Diabetologia. (1985) 28:412–9. 10.1007/BF00280883
23.
Zhao Q Zhang T Cheng Y Ma Y Xu Y Yang J et al Impacts of triglyceride-glucose index on prognosis of patients with type 2 diabetes mellitus and non-ST-segment elevation acute coronary syndrome: Results from an observational cohort study in China. Cardiovasc Diabetol. (2020) 19:108. 10.1186/s12933-020-01086-5
24.
Mohd Nor N Lee S Bacha F Tfayli H Arslanian S . Triglyceride glucose index as a surrogate measure of insulin sensitivity in obese adolescents with normoglycemia, prediabetes, and type 2 diabetes mellitus: Comparison with the hyperinsulinemic-euglycemic clamp.Pediatr Diabetes. (2016) 17:458–65. 10.1111/pedi.12303
25.
Li S Guo B Chen H Shi Z Li Y Tian Q et al The role of the triglyceride (triacylglycerol) glucose index in the development of cardiovascular events: A retrospective cohort analysis. Sci Rep. (2019) 9:7320. 10.1038/s41598-019-43776-5
26.
Li Q Wen Y Wang L Chen B Chen J Wang H et al Hyperglycemia-induced accumulation of advanced glycosylation end products in fibroblast-like synoviocytes promotes knee osteoarthritis. Exp Mol Med. (2021) 53:1735–47. 10.1038/s12276-021-00697-6
27.
Ribeiro M López de Figueroa P Blanco FJ Mendes AF Caramés B . Insulin decreases autophagy and leads to cartilage degradation.Osteoarthritis Cartilage. (2016) 24:731–9. 10.1016/j.joca.2015.10.017
28.
Qiao L Li Y Sun S . Insulin exacerbates Inflammation in fibroblast-like synoviocytes.Inflammation. (2020) 43:916–36. 10.1007/s10753-020-01178-0
29.
Van Raemdonck K Umar S Palasiewicz K Volin M Elshabrawy H Romay B et al Interleukin-34 reprograms glycolytic and osteoclastic rheumatoid arthritis macrophages via syndecan 1 and macrophage colony-stimulating factor receptor. Arthritis Rheumatol. (2021) 73:2003–14. 10.1002/art.41792
30.
Li K Ji X Seeley R Lee W Shi Y Song F et al Impaired glucose metabolism underlies articular cartilage degeneration in osteoarthritis. FASEB J. (2022) 36:e22377. 10.1096/fj.202200485R
Summary
Keywords
triglyceride-glucose index, arthritis, activities of daily living, aging, CHARLS
Citation
Ma L, Mu Y-l, Liu Z-m, Jiang S-w and Li D-q (2025) Association between triglyceride-glucose index and activities of daily living disability among middle-aged and older patients with arthritis: longitudinal evidence from CHARLS. Front. Med. 12:1618606. doi: 10.3389/fmed.2025.1618606
Received
26 April 2025
Accepted
16 June 2025
Published
09 July 2025
Volume
12 - 2025
Edited by
Roshan Kumar Mahat, Dharanidhar Medical College and Hospital, India
Reviewed by
Marius Militaru, Victor Babes University of Medicine and Pharmacy, Romania
Daidi Li, Charité University Medicine Berlin, Germany
Kahkashan Naaz, Institute of Medical Sciences and Sum Hospital, India
Updates
Copyright
© 2025 Ma, Mu, Liu, Jiang and Li.
This is an open-access article distributed under the terms of the Creative Commons Attribution License (CC BY). The use, distribution or reproduction in other forums is permitted, provided the original author(s) and the copyright owner(s) are credited and that the original publication in this journal is cited, in accordance with accepted academic practice. No use, distribution or reproduction is permitted which does not comply with these terms.
*Correspondence: De-qiang Li, lideqiangsdu@126.com
Disclaimer
All claims expressed in this article are solely those of the authors and do not necessarily represent those of their affiliated organizations, or those of the publisher, the editors and the reviewers. Any product that may be evaluated in this article or claim that may be made by its manufacturer is not guaranteed or endorsed by the publisher.