Abstract
Background:
Cholecystectomy has been linked with adverse metabolic outcomes, but its specific association with body mass index (BMI) and the underlying mechanisms remain insufficiently understood. This study aimed to assess the impact of cholecystectomy on BMI and examine the mediating role of hepatic steatosis.
Methods:
A total of 7,452 adults were included in this cross-sectional analysis. Baseline demographic, clinical, and laboratory data were compared between participants with and without cholecystectomy. Multivariable linear regression was used to evaluate the relationship between cholecystectomy and BMI, with progressive adjustment for demographic, clinical, and metabolic-inflammatory confounders. Subgroup and stratified analyses, propensity score modeling, and causal mediation analysis were conducted to validate findings and elucidate potential mechanisms.
Results:
Participants with cholecystectomy were older (mean age 61.0 vs. 49.5 years), more likely to be female, and exhibited higher BMI (mean 31.8 ± 8.1 cholecystectomy group vs. 29.6 ± 7.3 non-cholecystectomy, p < 0.05) as well as increased prevalence of hypertension, diabetes, and markers of inflammation (all p < 0.05). Cholecystectomy was independently associated with higher BMI after adjustment for confounders (fully adjusted β = 0.84 kg/m2; 95% CI: 0.09–1.59; p = 0.027), a finding robust to propensity score methods (overlap weighting β = 0.91; 95% CI: 0.55–1.27; p < 0.001). Stratified analyses indicated a more pronounced BMI increase among younger patients ( ≤ 50 years, β = 2.3; 95% CI: 0.83–3.76; p = 0.002), with no significant difference observed across postoperative time intervals. Causal mediation analysis demonstrated that hepatic steatosis, quantified by controlled attenuation parameter (CAP), mediated approximately 46% of the association between cholecystectomy and increased BMI (ACME = 0.806 kg/m2, 95% CI: 0.321–1.314; p = 0.002), while a significant direct effect of cholecystectomy remained (ADE = 0.964, 95% CI: 0.131–1.801) in bootstrap validation.
Conclusions:
Cholecystectomy is independently associated with increased BMI, particularly among younger adults, and this relationship is partially mediated by hepatic steatosis. These findings highlight the need for long-term metabolic monitoring and targeted interventions in patients undergoing cholecystectomy.
Introduction
The advent of laparoscopic cholecystectomy in the late 1980s fundamentally transformed the management of gallstone disease (1). By the early 21st century, due to its minimally invasive nature and favorable safety profile—including low rates of mortality and morbidity—this procedure had become the standard therapeutic approach (2). Nonetheless, emerging evidence indicates that cholecystectomy is not without long-term consequences. Postoperative sequelae have attracted increasing scrutiny, with complications such as diarrhea—affecting approximately 13.3% of patients (3)—raising questions about possible postoperative changes in body weight, including both weight loss and weight gain. Most patients exhibit minimal fluctuations immediately after surgery, yet accumulating data indicate a gradual increase in body weight over time, particularly among individuals who receive dietary counseling 6 months postoperatively (4). In parallel, increasing attention has been paid to the role of the gallbladder and bile acids in systemic metabolic regulation. Notably, cholecystectomy affects bile acid storage and excretion, which may influence metabolic processes and lead to conditions like metabolic dysfunction-associated steatotic liver disease and metabolic syndrome (5). Consistent findings in animal models demonstrate increased hepatic fat accumulation following gallbladder removal (6). Furthermore, cholecystectomy has been linked to a higher risk of liver diseases, including nonalcoholic fatty liver disease, cirrhosis, and primary liver cancer (7). Despite these advances, the long-term association between cholecystectomy and changes in body mass index (BMI) remains inadequately characterized, and the mediating role of hepatic steatosis—precisely measured by controlled attenuation parameter (CAP)—in driving weight gain is undefined. To address this knowledge gap, the present population-based study investigates the association between cholecystectomy and BMI, with particular focus on the mediating effect of fatty liver disease in the long-term metabolic consequences of gallbladder removal.
Method
Research design
The National Health and Nutrition Examination Survey (NHANES) is a comprehensive, nationwide program that collects representative health data from both adults and children in the United States through interviews, physical examinations, and laboratory tests. The survey protocol was approved by the National Center for Health Statistics (NCHS) review board, and all participants provided informed consent. Data collection occurs biennially. For the purposes of this study, we utilized NHANES data from 2017 to 2020, as gallstone-related questionnaire responses were available only during this period. Although subsequent cycles (2021–2023) included questions on gallstones and cholecystectomy history, crucial information such as liver function tests and specific dates of surgery was not collected, precluding their inclusion in our analysis. Further information about the NHANES program and access to its data can be obtained from the official website (https://www.cdc.gov/nchs/nhanes/).
Study population
Baseline participation included 15,560 individuals who completed the initial assessment. Of these, 5,867 participants under 20 years of age and 994 individuals diagnosed with gallstones were excluded from the analysis. Further exclusions were made for participants with missing data on cholecystectomy status (n = 463) and body mass index (BMI) (n = 741). In addition, 43 participants lacking essential information on diabetes mellitus (n = 4), hypertension (n = 23), educational attainment (n = 9), work activity (n = 6), or smoking status (n = 1) were also excluded. After applying these criteria, a total of 7,452 participants remained eligible for analysis, comprising 254 individuals with a history of cholecystectomy and 7,198 without. The detailed inclusion and exclusion process is presented in Figure 1.
Figure 1

Flowchart for study population.
Definition of gallstones and gallbladder surgery
The presence of gallstones and history of gallbladder surgery were determined through structured participant interviews using standardized questions. Specifically, participants were asked: “Has a doctor or other health professional ever told you that you had gallstones? (MCQ550)” and “Have you ever had gallbladder surgery? (MCQ560).” Individuals who answered “yes” to the first question were classified as having gallstones, while those who answered “no” were considered free of gallstones. Similarly, respondents who replied “yes” to the second question were considered to have undergone gallbladder surgery, and those who replied “no” were classified as having no such surgical history. To ensure data quality and accuracy, real-time consistency checks were implemented through Computer-Assisted Personal Interview (CAPI) systems, and post-interview audits, including audio recording reviews, were conducted by National Center for Health Statistics (NCHS) staff.
Identification of covariates
Potential covariates for analysis were systematically identified in accordance with existing literature (8–11). This study utilized data extracted from the NHANES database, with key variables spanning several domains: ① Demographic information, such as sex, age, race, and education level (classified as below high school, high school graduate, or above high school); ② Socioeconomic status, assessed by the family poverty-to-income ratio (PIR); ③ Health conditions, specifically the presence of hypertension and diabetes; ④ Lifestyle factors, including levels of physical activity and smoking status; ⑤ Anthropometric measurements, comprising body mass index (BMI), waist and hip circumferences, and liver stiffness and Hepatic Steatosis assessed with ultrasound elastography; ⑥ and Laboratory data, including complete blood count, lipid profile, and liver function tests. Diagnoses of hypertension and diabetes were established based on a combination of self-reported questionnaire data, clinical examinations, and relevant laboratory findings. Physical activity was categorized using information from the NHANES Physical Activity Questionnaire (PAQ), while smoking status was determined based on participant responses in standardized surveys. The FibroScan® machine has incorporated a novel physical parameter (controlled attenuation parameter or CAPTM), which measures the ultrasound attenuation related to the presence of hepatic steatosis. The CAP measurement is recorded simultaneously with the liver stiffness measurement.
Statistical analysis
Continuous variables were summarized as mean ± standard deviation, and categorical variables were described as frequencies with corresponding percentages. Inter-group comparisons were performed using independent-sample t-tests or one-way ANOVA for continuous variables and Chi-square tests for categorical variables. To assess the relationship between cholecystectomy and incident BMI, individuals with the outcome at baseline were excluded. The primary analysis employed multivariable linear regression to evaluate the association between cholecystectomy and BMI, treating BMI as a continuous outcome variable. Secondary analyses included logistic regression models when clinically relevant dichotomizations of BMI were considered. Subgroup analyses were conducted to examine potential effect modification across clinically relevant strata. To minimize potential confounding, propensity score methods were applied. Propensity scores were estimated using logistic regression based on prespecified covariates, and propensity score matching or weighting (including overlap weighting) was conducted as appropriate. Causal mediation analyses were performed to assess the mediating role of hepatic steatosis—quantified by controlled attenuation parameter (CAP)—in the association between cholecystectomy and BMI outcomes. Mediation effects were assessed using R's mediation package with 5,000 bootstrap iterations for robust confidence interval estimation. Missing data were handled using multiple imputation techniques when applicable. Statistical analyses were performed using R (version 3.3.2) and Free Statistics software (version 2.1.1). Two-sided p-values < 0.05 were considered statistically significant.
Results
Baseline characteristics
Table 1 presents the baseline characteristics of the 7,452 participants. The overall mean age was 49.8 ± 17.4 years, while individuals in the cholecystectomy group had a higher mean age of 61.0 ± 15.3 years. Among participants who underwent cholecystectomy, the female-to-male ratio was 2.22:1. The cholecystectomy group also exhibited a significantly higher mean BMI (31.8 ± 8.1) compared to the non-cholecystectomy group (p < 0.05). Furthermore, the prevalence of hypertension, diabetes mellitus, increased waist circumference, elevated white blood cell count, and higher hs-CRP levels were all significantly greater in participants with a history of cholecystectomy (all p < 0.05).
Table 1
| Variables | Total (n = 7,452) | Non-cholecystectomy (n = 7,198) | Cholecystectomy (n = 254) | P value |
|---|---|---|---|---|
| Age, Mean ± SD | 49.8 ± 17.4 | 49.5 ± 17.4 | 61.0 ± 15.3 | < 0.001 |
| Sex, n(%) | ||||
| Male | 3,776 (50.7) | 3,697 (51.4) | 79 (31.1) | < 0.001 |
| Female | 3,676 (49.3) | 3,501 (48.6) | 175 (68.9) | |
| Race, n(%) | ||||
| Non-Hispanic White | 2,498 (33.5) | 2,351 (32.7) | 147 (57.9) | < 0.001 |
| Non-Hispanic Black | 2,048 (27.5) | 2,002 (27.8) | 46 (18.1) | |
| Mexican American | 851 (11.4) | 829 (11.5) | 22 (8.7) | |
| Other race | 2,055 (27.6) | 2,016 (28) | 39 (15.4) | |
| Education level (year), n(%) | ||||
| < 9 | 575 (7.7) | 558 (7.8) | 17 (6.7) | < 0.001 |
| 9–12 | 2,600 (34.9) | 2,479 (34.4) | 121 (47.6) | |
| >12 | 4,277 (57.4) | 4,161 (57.8) | 116 (45.7) | |
| PIR, n(%) | ||||
| ≤ 1.3 | 1,826 (28.5) | 1,761 (28.4) | 65 (30.1) | |
| >1.3, < 3.5 | 2,494 (38.9) | 2,396 (38.7) | 98 (45.4) | |
| ≥3.5 | 2,095 (32.7) | 2,042 (32.9) | 53 (24.5) | |
| Smoking status, n(%) | ||||
| Never | 4,386 (58.9) | 4,256 (59.1) | 130 (51.2) | 0.021 |
| Former | 1,689 (22.7) | 1,615 (22.4) | 74 (29.1) | |
| Current | 1,377 (18.5) | 1,327 (18.4) | 50 (19.7) | |
| Moderate activity, n(%) | ||||
| No | 4,177 (56.1) | 4,024 (55.9) | 153 (60.2) | 0.172 |
| Yes | 3,275 (43.9) | 3,174 (44.1) | 101 (39.8) | |
| Hypertension, n(%) | ||||
| No | 5,293 (71.0) | 5,166 (71.8) | 127 (50) | < 0.001 |
| Yes | 2,159 (29.0) | 2,032 (28.2) | 127 (50) | |
| DM, n(%) | ||||
| No | 3,053 (84.2) | 2,770 (85.5) | 283 (73.9) | < 0.001 |
| Yes | 571 (15.8) | 471 (14.5) | 100 (26.1) | |
| BMI (kg/m2) | 29.6 ± 7.3 | 29.6 ± 7.3 | 31.8 ± 8.1 | < 0.001 |
| Waist circumference (cm) | 100.1 ± 16.6 | 99.9 ± 16.5 | 106.4 ± 17.1 | < 0.001 |
| TC (mg/dL) | 185.9 ± 39.4 | 186.1 ± 39.4 | 181.6 ± 38.4 | 0.075 |
| HDL (mg/dL) | 53.7 ± 15.5 | 53.7 ± 15.5 | 53.0 ± 15.3 | 0.465 |
| TG (mg/dL) | 108.7 ± 64.8 | 108.4 ± 64.0 | 116.1 ± 83.6 | 0.063 |
| ALT (U/L) | 22.3 ± 18.3 | 22.4 ± 18.5 | 20.4 ± 14.4 | 0.083 |
| AST (U/L) | 22.0 ± 14.1 | 22.0 ± 14.2 | 20.7 ± 10.9 | 0.137 |
| STB (mg/dL) | 0.5 ± 0.3 | 0.5 ± 0.3 | 0.5 ± 0.3 | 0.954 |
| hs-CRP (mg/L) | 2.2 (0.9, 4.0) | 2.2 (0.9, 4.0) | 3.2 (1.2, 5.5) | < 0.001 |
| WBC (109/L) | 7.2 ± 2.3 | 7.1 ± 2.3 | 7.6 ± 3.1 | < 0.001 |
| LSM (kPa) | 5.9 ± 4.6 | 5.9 ± 4.6 | 6.4 ± 4.5 | 0.051 |
| CAP (dB/m) | 263.6 ± 60.7 | 262.9 ± 60.6 | 282.1 ± 62.8 | < 0.001 |
Baseline characteristics of participants.
ALT, alanine aminotransferase; AST, aspartate aminotransferase; BMI, body mass index; DM, diabetes mellitus; PIR, poverty-to-income ratio; HDL, high-density lipoprotein; STB, Serum Total Bilirubin; hs-CRP, highsensitivity C-reactive protein; TC, total cholesterol; TG, triglycerides; WBC, white blood cell; LSM, Liver Stiffness Measurement; CAP, controlled attenuated parameter.
Associations between cholecystectomy and BMI
Univariate analysis identified multiple factors significantly associated with cholecystectomy status (Table 2). Demographic characteristics including age (p < 0.001), sex (p < 0.001), and race (p < 0.001) showed strong associations, with non-Hispanic White participants demonstrating the highest cholecystectomy prevalence (p < 0.001). Several metabolic and inflammatory markers were also significantly associated, including: Hypertension (OR 2.54, 95% CI 1.98–3.27), Diabetes mellitus (OR 2.15, 95% CI 1.61–2.88), BMI (OR 1.04, 95% CI 1.02–1.05, p < 0.001), Controlled attenuation parameter (CAP) scores (OR 1.01, 95% CI 1.0–1.01, p < 0.001), Elevated inflammatory markers (WBC: p = 0.002; hs-CRP: p = 0.04).
Table 2
| Variables | OR (95% CI) | P value | Variables | OR (95% CI) | P value |
|---|---|---|---|---|---|
| Age, Mean ± SD | 1.04 (1.03–1.05) | < 0.001* | Smoking status, n (%) | ||
| Sex, n (%) | Never | 1 (reference) | |||
| Male | 1 (reference) | Former | 1.5 (1.12–2.01) | 0.006* | |
| Female | 2.34 (1.79–3.06) | < 0.001* | Current | 1.23 (0.89–1.72) | 0.215 |
| Race, n (%) | Hypertension, n (%) | ||||
| Non-Hispanic White | 1 (reference) | No | 1 (reference) | ||
| Non-Hispanic Black | 0.37 (0.26–0.51) | < 0.001* | Yes | 2.54 (1.98–3.27) | < 0.001* |
| Mexican American | 0.42 (0.27–0.67) | < 0.001* | DM, n (%) | ||
| Other race | 0.31 (0.22–0.44) | < 0.001* | No | 1 (reference) | |
| Education (year), n (%) | Yes | 2.15 (1.61–2.88) | < 0.001* | ||
| < 9 | 1(reference) | BMI (kg/m2) | 1.04 (1.02–1.05) | < 0.001* | |
| 9–12 | 1.6 (0.96–2.68) | 0.073 | WC (cm) | 1.02 (1.01–1.03) | < 0.001* |
| >12 | 0.92 (0.55–1.53) | 0.736 | TC (mg/dL) | 1 (0.99–1) | 0.075 |
| PIR, Mean ± SD | HDL (mg/dL) | 1 (0.99–1.01) | 0.465 | ||
| ≤ 1.3 | 1(reference) | TG (mg/dL) | 1 (1) | 0.079 | |
| >1.3, < 3.5 | 1.11 (0.81–1.53) | 0.529 | ALT (U/L) | 0.99 (0.98–1) | 0.066 |
| ≥3.5 | 0.7 (0.49–1.02) | 0.061 | AST (U/L) | 0.99 (0.97–1) | 0.115 |
| Moderate activity, n (%) | LSM (kPa) | 1.02 (1–1.04) | 0.055 | ||
| No | 1(reference) | CAP (dB/m) | 1.01 (1–1.01) | < 0.001* | |
| Yes | 0.84 (0.65–1.08) | 0.172 | hs-CRP (mg/L) | 1.01 (1–1.02) | 0.04* |
| STB (mg/dL) | 0.99 (0.61–1.59) | 0.954 | WBC (109/L) | 1.06 (1.02–1.1) | 0.002* |
Association between covariates and cholecystectomy status.
* P < 0.05.
Potential confounders were identified through univariate screening (significance threshold p < 0.05), including demographic factors (sex, age, race), behavioral characteristics (smoking status), clinical comorbidities (hypertension, diabetes mellitus), and metabolic-inflammatory markers (CAP, WBC, and hs-CRP). Waist circumference was excluded from final models due to significant collinearity with BMI (variance inflation factor [VIF] = 5.30). Three progressively adjusted linear regression models (Table 3) were constructed to examine the cholecystectomy-BMI association: Model 1 (Demographic-adjusted model): β = 2.21 kg/m2 (95% confidence interval [CI]: 1.3–3.12; p < 0.001) (Adjusted for: Age, sex, race, smoking status). Model 2 (Clinical-adjusted model): β = 1.71 kg/m2 (95% CI: 0.82–2.6; p < 0.001) (Additional adjustments: Hypertension, diabetes mellitus). Model 3 (Fully-adjusted model): β = 0.84 kg/m2 (95% CI: 0.09–1.59; p = 0.027) (Additional adjustments: CAP, WBC, hs-CRP). Fully-adjusted model showed good fit (R2 = 0.359–0.361) and satisfied regression assumptions.
Table 3
| Exposure | Crude | Model 1 | Model 2 | Model 3 | ||||
|---|---|---|---|---|---|---|---|---|
| β (95%CI) | P | β (95%CI) | P | β (95%CI) | P | β (95%CI) | P | |
| Cholecystectomy | R 2 = 0.041 | R 2 = 0.085 | R 2 = 0.359 | |||||
| No | R0 (Ref) | R0 (Ref) | R0 (Ref) | R0 (Ref) | ||||
| Yes | 2.26 (1.34–3.18) | < 0.001* | 2.21 (1.3–3.12) | < 0.001* | 1.71 (0.82–2.6) | < 0.001* | 0.84 (0.09–1.59) | 0.027* |
Association between cholecystectomy and BMI.
Crude: Unadjusted. Model 1: Adjusted for sex, race, age, and smoke status. Model 2: Adjusted for sex, race, age, smoke status, hypertension, and diabetes mellitus. Model 3: Adjusted for sex, race, age, smoke status, hypertension, diabetes mellitus, CAP, WBC, and hs-CRP. *P < 0.05.
Stratified analyses based on additional variables
Stratified analyses revealed differential associations between cholecystectomy and BMI changes across demographic and clinical subgroups. Notably, younger patients ( ≤ 50 years) demonstrated a significant BMI increase following cholecystectomy (β = 2.3, 95% CI: 0.83–3.76, p = 0.002), whereas older patients (>50 years) showed no significant change (β = 0.37, 95% CI: −0.47–1.21). No significant interactions were detected for sex, socioeconomic indicators (education, poverty-income ratio), lifestyle factors (smoking, physical activity), or metabolic parameters (diabetes) (all P interaction > 0.05), demonstrating the robustness of the primary association across most population strata (Figure 2).
Figure 2

The relationship between cholecystectomy and BMI according to basic features. Except for the stratification component itself, each stratification factor was adjusted for all other variables [demographic factors (sex, age, race), behavioral characteristics (smoking status), clinical comorbidities (hypertension, diabetes mellitus), and metabolic-inflammatory markers (CAP, WBC, and hs-CRP)].
Comparative analysis of BMI changes by postoperative duration
BMI did not differ significantly across postoperative time intervals (Table 4). In the dichotomous analysis ( ≤ 5 years vs. >5 years post-cholecystectomy), the mean BMI was 30.8 ± 7.9 kg/m2 (n = 95) and 32.1 ± 8.1 kg/m2 (n = 177), respectively (independent t-test, p = 0.202; Cohen's d = 0.18, indicating a small effect size). For the trichotomous grouping ( ≤ 3 years, 3.1–6 years, >6.1 years), the mean BMI values were 30.7 ± 6.0 kg/m2 (n = 50), 31.4 ± 9.4 kg/m2 (n = 52), and 32.0 ± 8.2 kg/m2 (n = 170), respectively. One-way ANOVA indicated no significant difference between groups (F = 0.55, df = 2,269; p = 0.578; η2 = 0.004, representing a minimal effect size).
Table 4
| Grouping method | Postoperative time group | Sample Size (n) | BMI (Mean ±SD) | Statistical test method | P-value | Effect size |
|---|---|---|---|---|---|---|
| Dichotomous | ≤ 5 years | 95 | 30.8 ± 7.9 | Independent t-test | 0.202 | 0.18 (Small) |
| >5 years | 177 | 32.1 ± 8.1 | ||||
| Trichotomous | ≤ 3 years | 50 | 30.7 ± 6.0 | One-way ANOVA | 0.578 | η2 = 0.004 (Minimal) |
| 3.1–6 years | 52 | 31.4 ± 9.4 | (F = 0.55, df = 2,269) | |||
| >6.1 years | 170 | 32.0 ± 8.2 |
Comparative analysis of BMI changes across different postoperative time periods.
Propensity score analysis and model comparisons
The propensity score model demonstrated adequate discriminative capacity (AUC = 0.775, 95% CI: 0.673–0.776) (Figure 3). Post-matching balance diagnostics confirmed successful covariate adjustment, with all standardized mean differences (SMDs) < 0.10 across measured confounders (sex, age, race, hypertension, diabetes mellitus, CAP, white blood cell count, and CRP), indicating negligible residual imbalance (Supplementary Figure S1). The robustness of the cholecystectomy-BMI association was further validated by multiple propensity score approaches. While all methods agreed on the direction and significance of the effect, overlap weighting (Ow) yielded the most precise estimate (β = 0.91, 95% CI: 0.55–1.27, *p* < 0.001) (Table 5).
Figure 3

ROC Curve of the propensity score model demonstrating adequate discrimination.
Table 5
| Models | β (95%CI) | P-value |
|---|---|---|
| Crude | 2.26 (1.34–3.18) | < 0.001 |
| Multivariable | 0.79 (0.04–1.54) | 0.039 |
| PS-Adjusted | 1.02 (0.09–1.94) | 0.031 |
| PS-Matched | 1.36 (0.07–2.65) | 0.039 |
| IPTW | 1.45 (0.52–2.39) | 0.002 |
| SMRW | 0.85 (−0.1–1.81) | 0.08 |
| PA Weighting | 0.85 (0.5–1.21) | < 0.001 |
| Ow | 0.91 (0.55–1.27) | < 0.001 |
Propensity score analysis and model comparisons.
PS, Propensity Score; IPTW, Inverse Probability of Treatment Weighting;
SMRW, Standardized Mortality Ratio Weighting; Ow, Overlap Weighting.
Mediating role of fatty liver in the association between exposure and outcome
Causal mediation analysis (Figure 4) revealed that hepatic steatosis, as quantified by controlled attenuation parameter (CAP), significantly mediated the exposure-outcome association after adjusting for covariates (age, sex, race, smoke status, diabetes status, and white blood cell count). The mediated proportion reached 46.0% (95% CI: 22.7%−80.6%) in primary analysis vs. 45.6% (21.4%−87.4%) in bootstrap validation, with an average causal mediation effect (ACME) of 0.803 kg/m2 (95% CI: 0.321–1.270; P = 0.002) vs. 0.806 kg/m2 (95% CI: 0.321–1.314; P = 0.002) in bootstrap validation. The exposure maintained a significant direct effect (ADE = 0.964, 95% CI: 0.131–1.801; p = 0.03), with a total effect size of 1.772 (95% CI: 0.746–2.738; p < 0.001) in bootstrap validation.
Figure 4
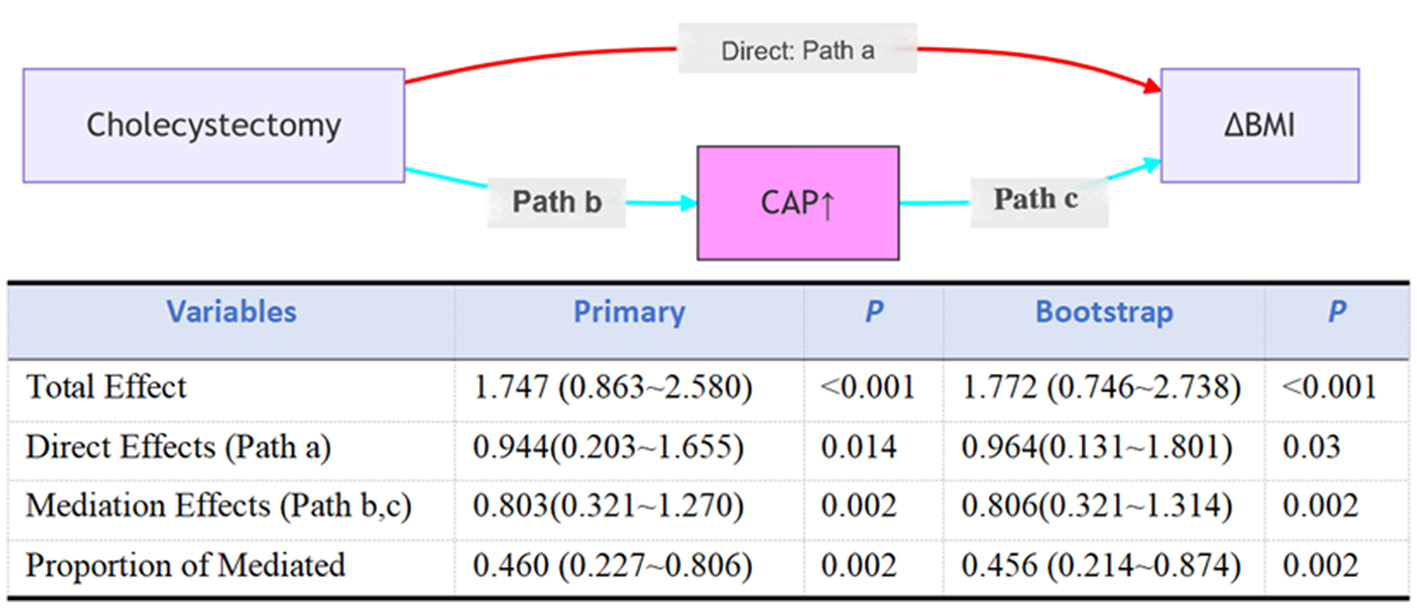
Mediation analysis for hepatic steatosis, as quantified by controlled attenuation parameter (CAP), in the association between cholecystectomy and BMI. Total effect: the overall impact of cholecystectomy (X) on BMI (Y), without considering the mediating effect of CAP (M); Direct effect: the direct impact of cholecystectomy (X) on BMI (Y) after controlling for the effect of CAP (M); Indirect effect: the indirect impact of cholecystectomy (X) on BMI (Y) through CAP (M); Percent mediation: the proportion of the indirect effect in the total effect, reflecting the importance of CAP (M) in the relationship between cholecystectomy and BMI. Adjusted for age, sex, race, smoke status, diabetes status, and white blood cell count.
Discussion
In this cross-sectional study, we investigated the relationship between cholecystectomy and BMI. Our findings demonstrate that cholecystectomy is an independent risk factor for increased BMI, particularly in young and middle-aged adults, with hepatic steatosis mediating nearly half of this effect (46%). These findings challenge the prevailing notion that post-cholecystectomy weight gain is attributable solely to dietary changes (4, 12, 13), and instead indicate a direct metabolic consequence of gallbladder removal (8).
Evidence from a cross-sectional study in China revealed a significantly higher prevalence of metabolic syndrome (MetS) among patients with a history of cholecystectomy (63.5%), compared with those with gallstones (47.0%) or without gallstone disease (30.3%) (14). However, the cross-sectional design limited causal inference. In contrast, a large-scale longitudinal cohort study from South Korea (9) the cross-sectional design limited causal inference. It is important to interpret previous results with caution, as the diagnosis of MetS relies on the presence of at least three out of five possible criteria (15). This composite nature introduces heterogeneity and potential confounding due to varying combinations of diagnostic components (16). To mitigate this limitation, our study focused on assessing the association between cholecystectomy and BMI, an objectively measured continuous variable, rather than using MetS as the primary endpoint. This design enhances the precision of our findings by minimizing diagnostic variability and reducing confounding from the differential weighting of MetS components. Supporting this approach, Chen et al. (17) observed an increased risk of GSD with a greater number of MetS components. To further isolate the effect of gallbladder removal, we excluded participants with pre-existing GSD from our analysis.
Mechanistically, cholecystectomy disrupts the physiological pattern of bile acid secretion, leading to altered signaling through FXR, GPBAR-1, and FGF19 in multiple tissues (18). These molecular changes are implicated in insulin resistance, the development of hepatic steatosis, and dysregulated lipid profiles (19). Importantly, our findings quantify the mediating role of fatty liver, which explains approximately 46% of the pathway from cholecystectomy to increased BMI. This result highlights fatty liver as a key intermediary, not merely a concurrent condition. However, as with any cross-sectional mediation analysis, this estimate should be interpreted with caution, as it could be influenced by pre-existing metabolic conditions that may contribute to both hepatic steatosis and the need for cholecystectomy. Additionally, changes in the gut microbiota following cholecystectomy may further contribute to metabolic dysregulation (20). Subgroup analysis in our study revealed a more pronounced effect in younger individuals ( ≤ 50 years). This greater vulnerability may be due to higher metabolic plasticity and less mature compensatory mechanisms in younger adults, making them more sensitive to disruptions in biliary physiology. Age-related differences in bile acid processing have also been observed, with young rat livers showing increased biotransformation compared to adults (21). In contrast, older patients often experience more postoperative complications, which may reflect different underlying pathophysiological processes (22, 23). Clinically, these findings underscore the importance of postoperative metabolic monitoring and lifestyle counseling, especially for younger patients undergoing cholecystectomy.
Although the observed mean BMI differences were modest, they may carry meaningful clinical implications at the population level, as a 1–2 kg/m2 increase is associated with a 15–20% higher risk of metabolic syndrome and a 5–10% increased cardiovascular disease risk (24). These effects could be especially pronounced in younger patients ( ≤ 50 years), who showed a greater BMI increase of 2.3 kg/m2—comparable to weight gain typically occurring over 5–8 years in midlife. The lack of significant association between postoperative intervals and BMI changes should be interpreted cautiously, primarily due to recall bias from self-reported surgical history. Inaccurate recollection of surgery dates may misclassify exposure timing and dilute measurable effects, likely contributing to the null findings.
Cholecystectomy is an effective treatment with low rates of mortality and morbidity (2, 25). Studies consistently show that while elective cholecystectomy carries relatively low risk in elderly patients, mortality rates remain notably higher than zero, particularly in those over 70 years (26, 27). However, cholecystectomy may contribute to long-term metabolic complications by altering digestive physiopathology. Evidence indicates that cholecystectomy can disrupt the enterohepatic circulation of bile acids, which may in turn affect glucose, insulin, and lipid metabolism (9, 19). This disruption can also lead to gut dysbiosis, manifesting as reduced microbial diversity and an increased abundance of pro-inflammatory bacteria (28). After cholecystectomy, bile acids flow continuously into the intestine, disrupting enterohepatic cycling and promoting dysbiosis. This includes reduced diversity, depletion of beneficial short-chain fatty acid-producing bacteria, and expansion of pro-inflammatory taxa (19, 28). Bile acids act as signaling molecules through receptors such as FXR and TGR5, which regulate glucose, lipid, and energy homeostasis (5). Interestingly, FXR-deficient mice on a methionine- and choline-deficient diet showed less hepatic steatosis but increased inflammation and fibrosis compared to wild-type mice, possibly due to elevated hepatic bile acid levels inhibiting fatty acid uptake and triglyceride accumulation (29). Thus, the gallbladder serves as a physiological regulator of bile acid metabolism, contracting rhythmically in response to meals to maintain metabolic homeostasis (30, 31). Together, these findings underscore the integral role of the gallbladder in metabolic regulation through bile acid-mediated pathways.
In summary, this cross-sectional study suggests an association between cholecystectomy and increased BMI, with hepatic steatosis appearing to mediate a substantial portion of this relationship, particularly in younger adults. These findings highlight the need for further investigation into the potential metabolic consequences of cholecystectomy and suggest that clinicians might consider metabolic monitoring in post-operative care, especially for younger patients.
Limitations
This study has several important limitations. First, the cross-sectional design fundamentally limits causal inference, as temporal sequence between cholecystectomy and BMI change cannot be established. Second, although mediation analysis suggested a significant role of hepatic steatosis, unmeasured confounding—particularly by pre-existing metabolic conditions—threatens interpretability. Specifically, baseline steatosis may have contributed to both gallstone formation (leading to surgery) and subsequent BMI increase, potentially inflating the estimated mediation effect. Third, selection bias may arise from missing preoperative metabolic profiles and exclusion of participants with incomplete data. Finally, measurement error from self-reported surgery history and unaccounted lifestyle changes post-surgery may further bias effect estimates. While propensity score and multiple imputation methods were employed, residual confounding remains plausible.
Statements
Data availability statement
The datasets presented in this study can be found in online repositories. The names of the repository/repositories and accession number(s) can be found in the article/Supplementary material.
Ethics statement
The studies involving humans were approved by National Center for Health Statistics (NCHS) review board. The studies were conducted in accordance with the local legislation and institutional requirements. Written informed consent for participation was not required from the participants or the participants' legal guardians/next of kin in accordance with the national legislation and institutional requirements. Written informed consent was obtained from the individual(s) for the publication of any potentially identifiable images or data included in this article.
Author contributions
JC: Writing – original draft, Writing – review & editing, Data curation, Supervision, Project administration. WM: Data curation, Writing – review & editing, Validation, Methodology. Qj: Supervision, Validation, Investigation, Writing – review & editing. XH: Writing – review & editing, Supervision, Visualization, Validation. YT: Validation, Supervision, Writing – review & editing. FZ: Data curation, Methodology, Writing – review & editing, Writing – original draft, Supervision. TL: Data curation, Visualization, Formal analysis, Methodology, Validation, Conceptualization, Writing – original draft, Software, Writing – review & editing, Resources.
Funding
The author(s) declare that no financial support was received for the research and/or publication of this article.
Acknowledgments
The authors thank the National Center for Health Statistics for data access and all participants and staff involved in the study.
Conflict of interest
The authors declare that the research was conducted in the absence of any commercial or financial relationships that could be construed as a potential conflict of interest.
Generative AI statement
The author(s) declare that no Gen AI was used in the creation of this manuscript.
Any alternative text (alt text) provided alongside figures in this article has been generated by Frontiers with the support of artificial intelligence and reasonable efforts have been made to ensure accuracy, including review by the authors wherever possible. If you identify any issues, please contact us.
Publisher’s note
All claims expressed in this article are solely those of the authors and do not necessarily represent those of their affiliated organizations, or those of the publisher, the editors and the reviewers. Any product that may be evaluated in this article, or claim that may be made by its manufacturer, is not guaranteed or endorsed by the publisher.
Supplementary material
The Supplementary Material for this article can be found online at: https://www.frontiersin.org/articles/10.3389/fmed.2025.1620036/full#supplementary-material
Supplementary Figure S1Standardized mean differences of covariates before and after matching.
References
1.
Al-Mulhim AA . Current trends in laparoscopic cholecystectomy. J Family Commun Med. (1997) 4:33–40. 10.4103/2230-8229.98423
2.
Buia A Stockhausen F Hanisch E . Laparoscopic surgery: a qualified systematic review. World J Methodol. (2015) 5:238–54. 10.5662/wjm.v5.i4.238
3.
Farahmandfar MR Chabok M Alade MO Bouhelal A Patel B . Post cholecystectomy diarrhoea-a systematic review. Surgical Sci. (2012) 3:332–8. 10.4236/ss.2012.36065
4.
Yazdankhah Kenary A Yaghoobi Notash A Jr . Nazari M, Yaghoobi Notash A, Borjian A, Afshin N, et al. Measuring the rate of weight gain and the influential role of diet in patients undergoing elective laparoscopic cholecystectomy: a 6-month follow-up study. Int J Food Sci Nutr. (2012) 63:645–8. 10.3109/09637486.2011.644767
5.
Lange AH Pedersen MG Ellegaard AM Nerild HH Brønden A Sonne DP et al . The bile-gut axis and metabolic consequences of cholecystectomy. Eur J Endocrinol. (2024) 190:R1–9. 10.1093/ejendo/lvae034
6.
Amigo L Husche C Zanlungo S Lutjohann D Arrese M Miquel JF et al . Cholecystectomy increases hepatic triglyceride content and very-low-density lipoproteins production in mice. Liver Int. (2011) 31:52–64. 10.1111/j.1478-3231.2010.02361.x
7.
Luo D Chen X Dai Y Kuang F Kang M Li B et al . Cholecystectomy and risk of liver disease: a systematic review and meta-analysis of 27 million individuals. Int J Surg. (2023) 109:1420–9. 10.1097/JS9.0000000000000332
8.
Sezer S Demirci S Kara M . Metabolic dysfunction associated fatty liver disease in long-term cholecystectomy patients: a cross-sectional study. Turk J Gastroenterol. (2024) 36:162–8. 10.5152/tjg.2024.24337
9.
Huh JH Lee KJ Cho YK Moon S Kim YJ Han KD et al . Cholecystectomy increases the risk of metabolic syndrome in the Korean population: a longitudinal cohort study. Hepatobiliary Surg Nutr. (2023) 12:523–33. 10.21037/hbsn-22-201
10.
Rodriguez-Antonio I Lopez-Sanchez GN Garrido-Camacho VY Uribe M Chavez-Tapia NC Nuno-Lambarri N . Cholecystectomy as a risk factor for non-alcoholic fatty liver disease development. HPB. (2020) 22:1513–20. 10.1016/j.hpb.2020.07.011
11.
Ruhl CE Everhart JE . Relationship of non-alcoholic fatty liver disease with cholecystectomy in the US population. Am J Gastroenterol. (2013) 108:952–8. 10.1038/ajg.2013.70
12.
Bretzke G . Body weight behavior after cholecystectomy. Zeitschrift fur die gesamte innere Medizin und ihre Grenzgebiete. (1986) 16:458–60.
13.
Altomare DF Rotelli MT Palasciano N . Diet after cholecystectomy. Curr Med Chem. (2019) 26:3662–5 10.2174/0929867324666170518100053
14.
Shen C Wu X Xu C Yu C Chen P Li Y . Association of cholecystectomy with metabolic syndrome in a Chinese population. PLoS One. (2014) 9:e88189. 10.1371/journal.pone.0088189
15.
Al-Mendalawi MD . Epidemiology of metabolic syndrome in Menoufia University students. Menoufia Med J. (2020) 33:332. 10.4103/mmj.mmj_1_19
16.
Dendukuri N Schiller I de Groot J Libman M Moons K Reitsma J et al . Concerns about composite reference standards in diagnostic research. BMJ. (2018) 360:j5779. 10.1136/bmj.j5779
17.
Chen LY Qiao QH Zhang SC Chen YH Chao GQ Fang LZ . Metabolic syndrome and gallstone disease. World J Gastroenterol. (2012) 18:4215–20. 10.3748/wjg.v18.i31.4215
18.
Garruti G Wang DQ Di Ciaula A Portincasa P . Cholecystectomy: a way forward and back to metabolic syndrome?Lab Invest. (2018) 98:4–6. 10.1038/labinvest.2017.129
19.
Di Ciaula A Garruti G Wang DQH Portincasa P . Cholecystectomy and risk of metabolic syndrome. Eur J Intern Med. (2018) 53:3–11. 10.1016/j.ejim.2018.04.019
20.
Xu F Yu Z Liu Y Du T Yu L Tian F et al . A high-fat, high-cholesterol diet promotes intestinal inflammation by exacerbating gut microbiome dysbiosis and bile acid disorders in cholecystectomy. Nutrients. (2023) 15:3829. 10.3390/nu15173829
21.
Baumgartner U Miyai K Hardison WGM . Modulation of hepatic biotransformation and biliary excretion of bile acid by age and sinusoidal bile acid load. Am J Physiol. (1987) 252:114–9. 10.1152/ajpgi.1987.252.1.G114
22.
Maqsood H Patel KH Ferdosi H Sill AM Wu B Buddensick TJ et al . Age-related differences pre-, intra-, and postcholecystectomy: A retrospective cohort study of 6,868 patients. Int J Surg. (2017) 39:119–26. 10.1016/j.ijsu.2017.01.046
23.
Lebedeva OV Bueverov AO Bueverova EL Nikitina LO . The influence of cholecystectomy at young age on the course of metabolic syndrome in women. Alm. Clin. Med. (2017) 45:384–91. 10.18786/2072-0505-2017-45-5-384-391
24.
Kim MS Kim WJ Khera AV Won HH . Association between adiposity and cardiovascular outcomes: an umbrella review and meta-analysis. Eur. Heart J. (2020). 42:3388–403. 10.1093/eurheartj/ehab454
25.
Oettinger W Orth K . [Cholecystectomy–the gold standard of therapy]. Langenbecks Archiv fur Chirurgie Supplement II, Verhandlungen der Deutschen Gesellschaft fur Chirurgie Deutsche Gesellschaft fur Chirurgie Kongress.New York: Springer (1990) p. 1197–200.
26.
Sandblom G Videhult P Crona Guterstam Y Svenner A Sadr-Azodi O . Mortality after a cholecystectomy: a population-based study. HPB. (2015) 17:239–43. 10.1111/hpb.12356
27.
Pérez Lara FJ de Luna Díaz R Moreno Ruiz J Suescun García R del Rey Moreno A Hernández Carmona JM et al . Laparoscopic cholecystectomy in patients over 70 years of age: review of 176 cases. Rev Esp Enferm Dig. (2006) 98:42–8. 10.4321/S1130-01082006000100006
28.
Raposo MA Oliveira ES Santos AD Guadagnini D Mourabit HE Housset C et al . Impact of cholecystectomy on the gut-liver axis and metabolic disorders. Clin Res Hepatol Gastroenterol. (2024) 48:102370. 10.1016/j.clinre.2024.102370
29.
Wu W Liu X Peng X Xue R Ji L Shen X et al . Bile acids override steatosis in farnesoid X receptor deficient mice in a model of non-alcoholic steatohepatitis. Biochem Biophys Res Commun. (2014) 448:50–5. 10.1016/j.bbrc.2014.04.048
30.
Housset C Chrétien Y Debray D Chignard N . Functions of the Gallbladder. Comprehen Physiol. (2016) 6:1549–77. 10.1002/j.2040-4603.2016.tb00717.x
31.
Qi L Tian Y Chen Y . Gall bladder: the metabolic orchestrator. Diabetes Metab Res Rev. (2019) 35:e3140. 10.1002/dmrr.3140
Summary
Keywords
cholecystectomy, body mass index, hepatic steatosis, mediation analysis, NHANES
Citation
Cao J, Mao W, Jiang Q, Huang X, Tan Y, Zuo F and Luo T (2025) Hepatic steatosis mediates the relationship between cholecystectomy and BMI increase: a population-based study. Front. Med. 12:1620036. doi: 10.3389/fmed.2025.1620036
Received
29 April 2025
Accepted
08 September 2025
Published
30 September 2025
Volume
12 - 2025
Edited by
Roxana Adriana Stoica, Carol Davila University of Medicine and Pharmacy, Romania
Reviewed by
Haowen Jiang, Shanghai Institute of Materia Medica, Chinese Academy of Sciences (CAS), China
Andreea Nelson Twakor, County Clinical Emergency Hospital of Constanta, Romania
Updates
Copyright
© 2025 Cao, Mao, Jiang, Huang, Tan, Zuo and Luo.
This is an open-access article distributed under the terms of the Creative Commons Attribution License (CC BY). The use, distribution or reproduction in other forums is permitted, provided the original author(s) and the copyright owner(s) are credited and that the original publication in this journal is cited, in accordance with accepted academic practice. No use, distribution or reproduction is permitted which does not comply with these terms.
*Correspondence: Tianping Luo robalance@163.com
†These authors share first authorship
Disclaimer
All claims expressed in this article are solely those of the authors and do not necessarily represent those of their affiliated organizations, or those of the publisher, the editors and the reviewers. Any product that may be evaluated in this article or claim that may be made by its manufacturer is not guaranteed or endorsed by the publisher.