Abstract
Background:
Reliable biomarkers for asthma identification and severity stratification remain lacking. The neutrophil-to-lymphocyte ratio (NLR) has emerged as a potential candidate, but evidence remains inconsistent. This study evaluates the value of NLR in distinguishing asthma patients from healthy controls and its correlation with disease severity.
Methods:
A systematically search was conducted across PubMed, Embase and Web of Science for studies reporting NLR levels in asthma patients and healthy controls. Pooled mean differences (MD) and 95% confidence intervals (CIs) were calculated using random-effects models. Receiver operating characteristic (ROC) curves assessed discriminative performance.
Results:
Nineteen studies (43,164 patients, 8,411 controls) were included. When comparing across different asthma severities, the NLR showed incremental increases across severity: mild vs. moderate asthma (MD = −0.41, 95% CI: −0.64 to −0.18, p = 0.0005), mild vs. severe (MD = −3.10, 95% CI: −6.26 to 0.06, p = 0.05), and moderate asthma vs. severe asthma (MD = −2.44, 95% CI: −5.31 to 0.44, p = 0.10). The comparison between severe and non-severe asthma also showed a significant difference (MD = −2.06, p < 0.0001). NLR robustly discriminated asthma from controls (AUC = 0.929) and severe from non-severe asthma (AUC = 0.914). Subgroup analyses revealed higher NLR differences in pediatric populations and developed regions.
Conclusion:
NLR is a promising biomarker for asthma and severity stratification, although its discriminative ability between moderate and severe stages is limited. Future studies should explore its role in predicting asthma progression and exacerbations.
Introduction
Asthma is a chronic respiratory disease characterized by airway inflammation and reversible airflow obstruction (1), affects over 300 million individuals worldwide and imposes a substantial burden on healthcare systems. Asthma is typically managed with a stepwise approach centered on anti-inflammatory therapy, especially inhaled corticosteroids (ICS) (2), For patients with more severe disease, additional treatments such as long-acting β₂-agonists (LABAs), leukotriene receptor antagonists (LTRAs), or biologic agents may be used (3). However, therapeutic optimization depends on timely and accurate diagnosis, which remains a challenge, highlighting the need for reliable biomarkers. Traditional diagnostic methods, such as spirometry, are useful for assessing airflow limitation but are not effective for early detection or predicting the occurrence of asthma, particularly when symptoms are not yet evident (4), underscoring the urgent need for accessible, cost-effective biomarkers to guide clinical decision-making.
The neutrophil-to-lymphocyte ratio (NLR), a simple and cost-effective marker of systemic inflammation, has emerged as a candidate biomarker for asthma (5). NLR reflects the interplay between neutrophilic and lymphocytic immune pathways-key drivers of asthma heterogeneity (6). While preliminary studies suggest elevated NLR correlates with asthma severity and exacerbations (7, 8), existing evidence is limited by methodological inconsistencies, insufficient exploration of confounding factors (e.g., age, geographic disparities), and a lack of standardized thresholds for clinical application.
This systematic review and meta-analysis aims to compare NLR levels between asthma patients and healthy controls, and to examine its variation across subgroups stratified by asthma severity. Additionally, we will investigate how demographic factors such as age and geographic region influence NLR differences. By synthesizing existing evidence, our findings aim to bridge critical knowledge gaps, offering insights for integrating NLR into standardized diagnostic frameworks to enhance precision in asthma management.
Methods
Search strategy and selection criteria
A comprehensive literature search was conducted in PubMed, Embase, and Web of Science from inception to 2025 using the following terms: “NLR” OR “neutrophil-to-lymphocyte ratio” OR “neutrophil lymphocyte ratio” OR “neutrophil/lymphocyte ratio” OR “inflammatory biomarker*” AND “asthma” OR “bronchial asthma” OR “asthma exacerbation*. Studies were included if they: (1) Involved asthma patients of any severity, with or without exacerbations, as well as healthy control groups. (2) Reported NLR levels in asthma patients and controls, or among asthma severity subgroups. Studies were excluded if they (1) Did not provide original NLR data or based on non-human subjects. (2) Lacked a clear or confirmed asthma diagnosis or did not include a control group or relevant comparisons between different asthma severity levels.(3) Provided incomplete data such as missing NLR values or sample sizes.
Data extraction and quality assessment
Two independent reviewers screened the studies and extracted the following data: first author, publication year, country, sample size, participant age, and reported NLR levels. Disagreements were resolved by a third reviewer. The extracted date included first authors’ name, publication year, country, sample size, age, NLR level. Newcastle–Ottawa Scale (NOS) were used to assess the quality of each study, which assesses three aspects: selection (4 items), comparability (1 item), and outcome (3 items). Studies were assigned a score between 0 and 9 stars, with studies scoring 7 or more considered high quality. Studies with 7 or more stars were also regarded as high quality (9).
Statistical analysis
Meta-analyses were performed to compare NLR levels between asthma patients and healthy controls, as well as among asthma subgroups (non-severe vs. severe; mild, moderate, and severe). Continuous data were expressed as mean differences (MD) with corresponding 95% confidence intervals (CIs), and results were presented in forest plots. Heterogeneity was assessed using the Q statistic (p < 0.05) and I2 statistics. An I2 value < 50% indicated low heterogeneity, allowing the use of a fixed-effects model, otherwise, a random-effects model was used. Sensitivity analyses were performed by sequentially removing each study to assess the robustness of the results. Subgroup analyses were conducted based on participant age (<18 vs. ≥18 years) and country development status (developed vs. developing). Publication bias was evaluate using Begg’s and Egger’s tests and visually through funnel plots. A p < 0.05 was considered indicative of significant bias. All statistical analyses were performed using Stata software (version 12.0; StataCorp, Texas, United States).
Result
A systematic literature search was conducted in PubMed, EmBase, and the Cochrane Library following PRISMA guidelines. The initial search identified 378 relevant publications. After duplicate removal (n = 21), 357 articles were further evaluated based on title and abstract screening, 321 articles were excluded. Full texts evaluation was conducted for remaining 36 articles, with 5 excluded due to the lack of a control group and 12 excluded for not meeting inclusion criteria. Finally, 19 studies were included in the meta-analysis (Figure 1).
Figure 1

PRISMA flow diagram.
Study characteristics
The baseline characteristic of the included studies and participants are summarized in Tables 1–3. As shown in Table 1, most studies reported significantly higher NLR values in asthma patients compared to healthy controls (5, 6, 10–24). The mean NLR values in the asthma group ranged approximately from 1.80 to 8.58, while in the control group they ranged from 1.01 to 2.42. Table 2 presents the comparison between severe asthma (SA) and non-severe asthma (NSA) groups (25, 26). Across studies, the SA group consistently showed higher NLR values, with reported means ranging from 1.90 to 9.69 in SA, compared to 0.90 to 2.40 in NSA. Table 3 summarizes the NLR across asthma subgroups with varying levels of exacerbation severity (mild, moderate, and severe). An overall increasing trend in NLR values is observed with escalating disease severity. In the majority of included studies, patients with severe asthma consistently exhibit higher mean NLR levels compared to those with moderate or mild forms.
Table 1
| Author | Year | Country | Sample | Age | NLR | |||
|---|---|---|---|---|---|---|---|---|
| Asthma | Control | Asthma | Control | Asthma | Control | |||
| Nacaroglu HT (10) | 2016 | Turkey | 54 | 94 | 10.00 ± 3.00 | 14.08 ± 3.33 | 4.90 ± 8.10 | 1.50 ± 1.2 |
| Pan RL (11) | 2023 | China | 89 | 53 | 6.00 ± 2.96 | 8.00 ± 2.22 | 2.97 ± 2.54 | 1.08 ± 0.54 |
| Dogru (12) | 2015 | Turkey | 469 | 170 | 8.58 ± 3.25 | 8.71 ± 3.03 | 8.58 ± 3.25 | 1.77 ± 1.71 |
| Shi G (13) | 2017 | China | 175 | 130 | 49.00 ± 14.00 | 49.51 ± 13.58 | 1.99 ± 1.15 | 1.68 ± 0.15 |
| Hendy (14) | 2018 | Egypt | 45 | 45 | 37.82 ± 14.54 | 33.07 ± 10.89 | 2.77 ± 1.80 | 1.40 ± 0.52 |
| Zhu XM (6) | 2021 | China | 86 | 38 | 6.00 ± 2.96 | 7.00 ± 2.96 | 3.08 ± 2.67 | 1.01 ± 0.46 |
| Beyhan Sagmen S (15) | 2019 | Turkey | 80 | 22 | 41.50 ± 11.60 | 42.00 ± 10.50 | 1.80 ± 0.67 | 1.80 ± 0.37 |
| Ke J (5) | 2023 | China | 6,414 | 41,891 | 45.36 ± 0.29 | 47.58 + 0.19 | 2.00 ± 0.82 | 2.00 ± 0.82 |
| Wawryk-Gawda E (16) | 2023 | Poland | 375 | 107 | 3.72 ± 2.67 | 6.10 ± 4.17 | 3.42 ± 4.05 | 1.94 ± 1.91 |
| Darwesh M (17) | 2020 | Iraq | 50 | 50 | NA | NA | 2.06 ± 1.31 | 2.42 ± 0.50 |
| Singh B (18) | 2023 | India | 50 | 50 | 63.00 ± 8.20 | 62.00 ± 7.90 | 1.96 ± 0.08 | 1.08 ± 0.07 |
| Yildiz E (19) | 2022 | Turkey | 150 | 150 | NA | NA | 2.80 ± 1.40 | 1.70 ± 0.50 |
| Tahseen R (20) | 2022 | India | 60 | 32 | 41.05 ± 10.38 | 38.53 ± 6.23 | 2.37 ± 1.11 | 1.53 ± 0.54 |
| Gungen AC (21) | 2017 | Turkey | 142 | 104 | 48.40 ± 11.40 | 51.80 ± 13.10 | 2.20 ± 1.20 | 1.83 ± 1.02 |
| Sobeih A (22) | 2024 | Egypt | 44 | 44 | 10.89 ± 3.57 | 10.31 ± 2.53 | 2.23 ± 0.48 | 1.64 ± 0.38 |
| Bedolla-Barajas M (23) | 2022 | Mexico | 53 | 109 | 33.8 ± 12.0 | 32.4 ± 10.4 | 1.80 ± 0.61 | 1.71 ± 0.54 |
| Obeagu EI (24) | 2023 | Uganda | 75 | 75 | NA | NA | 4.07 ± 1.06 | 1.93 ± 0.61 |
Demographic characteristics and NLR values in asthma patients and healthy controls.
Table 2
| Author | Year | Country | Sample | NLR | ||
|---|---|---|---|---|---|---|
| SA | NSA | SA | NSA | |||
| Nacaroglu HT (10) | 2016 | Turkey | 54 | 54 | 4.90 ± 8.10 | 2.40 ± 0.30 |
| Pan RL (11) | 2023 | China | 81 | 8 | 4.90 ± 8.10 | 1.97 ± 4.85 |
| Shi G (13) | 2017 | China | 97 | 175 | 9.69 ± 9.84 | 1.99 ± 1.15 |
| Hendy (14) | 2018 | Egypt | 20 | 25 | 3.31 ± 1.97 | 2.09 ± 1.53 |
| Beyhan Sagmen S (15) | 2019 | Turkey | 46 | 34 | 1.90 ± 0.81 | 1.60 ± 0.44 |
| Darwesh M (17) | 2020 | Iraq | NM | NM | 3.70 ± 1.40 | 2.20 ± 1.10 |
| Mochimaru T (25) | 2018 | Japan | 46 | 58 | 2.48 ± 0.14 | 2.07 ± 0.13 |
| Asseri AA (26) | 2024 | Saudi Arabia | 128 | 131 | 7.00 ± 6.80 | 0.90 ± 0.70 |
| Gungen (21) | 2017 | Turkey | 69 | 73 | 2.51 ± 1.33 | 2.00 ± 1.10 |
Demographic and NLR data in severe versus non-severe asthma.
Table 3
| Author | Year | Country | Sample | NLR | ||||
|---|---|---|---|---|---|---|---|---|
| Mild | Moderate | Severe | Mild | Moderate | Severe | |||
| Pan RL (11) | 2023 | China | 54 | 17 | 10 | 2.67 ± 1.80 | 3.41 ± 2.67 | 7.35 ± 6.41 |
| Zhu XM (6) | 2021 | China | 54 | 17 | 15 | 2.74 ± 1.87 | 3.40 ± 2.47 | 7.28 ± 3.23 |
| Tahseen R (20) | 2022 | India | 30 | 30 | NA | 2.06 ± 0.51 | 2.68 ± 1.44 | NA |
| Darwesh M (17) | 2020 | Iraq | NA | NA | NA | 0.80 ± 0.70 | 2.20 ± 1.10 | 3.70 ± 1.40 |
| Sobeih A (22) | 2024 | Egypt | 24 | 14 | 6 | 1.83 ± 0.39 | 2.17 ± 0.41 | 2.59 ± 0.60 |
Demographic and NLR data among different exacerbated asthma groups.
NLR in asthma patients compared to healthy controls
Seventeen studies investigating the NLR in asthma patients and healthy controls, including a total of 43,164 asthma patients and 8,411 healthy controls, are summarized in Table 2. The reshults showed that asthma patients had significantly higher NLR levels compared control (MD = −1.13; 95% CI: −1.53 to −0.74, p < 0.0001), However, there was significant heterogeneity across included studies (I2 = 100%; p < 0.00001; Figure 2).
Figure 2

Forest plot comparing the NLR between asthma patients and healthy controls across 17 studies. The mean difference (MD) and 95% confidence intervals (CI) were calculated using a random-effects model.
NLR in asthma patients by disease severity
The details of the nine studies comparing the NLR between severe asthma (SA) and non-severe asthma (NSA) are summarized in Table 3. These studies involved 558 NSA patients and 541 SE patients. The results showed that patients with SA has significantly higher NLR levels than those with NSA (MD = −2.06; 95% CI: −2.85 to −1.27, p < 0.00001; Figure 3A).
Figure 3

Forest plots of NLR across asthma severity subgroups. (A) Comparison between non-severe asthma (NSA) and severe asthma (SA). (B) Comparisons among mild, moderate, and severe asthma groups.
In addition, five studies assessed NLR differences among mild, moderate, and severe asthma groups. The comparison between mild and moderate asthma showed a statistically significant difference (MD = −0.41; 95% CI: −0.64 to −0.18, p = 0.0005). The mean difference between mild and severe asthma was −3.10 (95% CI: −6.26 to 0.06; p = 0.05), suggesting a trend toward higher NLR in severe cases. The comparison between moderate and severe asthma revealed a non-significant difference (MD = −2.44; 95% CI: −5.31 to 0.44; p = 0.1), although the trend suggested higher NLR levels in severe cases (Figure 3B).
Subgroup analyses by age and country development status
Subgroup analyses were performed based on patient age and the development status of the countries. In studies from developed countries, the NLR was significantly higher in asthma patients compared to controls (MD = −1.80; 95% CI: −3.05 to −0.55, p = 0.005). Similarly, studies conducted in developing countries also showed a significant difference, with a pooled MD of −0.94 (95% CI: −1.28 to −0.60; p < 0.0001; I2 = 97%; Figure 4). Age-based subgroup analysis showed that in studies involving patients under 18 years, asthma patients had significantly higher NLR levels than controls (MD = −2.69; 95% CI: −5.02 to −0.37; p = 0.02; I2 = 99%). For those over 18 years of age, a significant difference was also observed (MD = −0.46; 95% CI: −0.89 to −0.04; p = 0.03; I2 = 100%; Figure 5).
Figure 4

Forest plots of NLR across asthma patient subgroups by country development status.
Figure 5
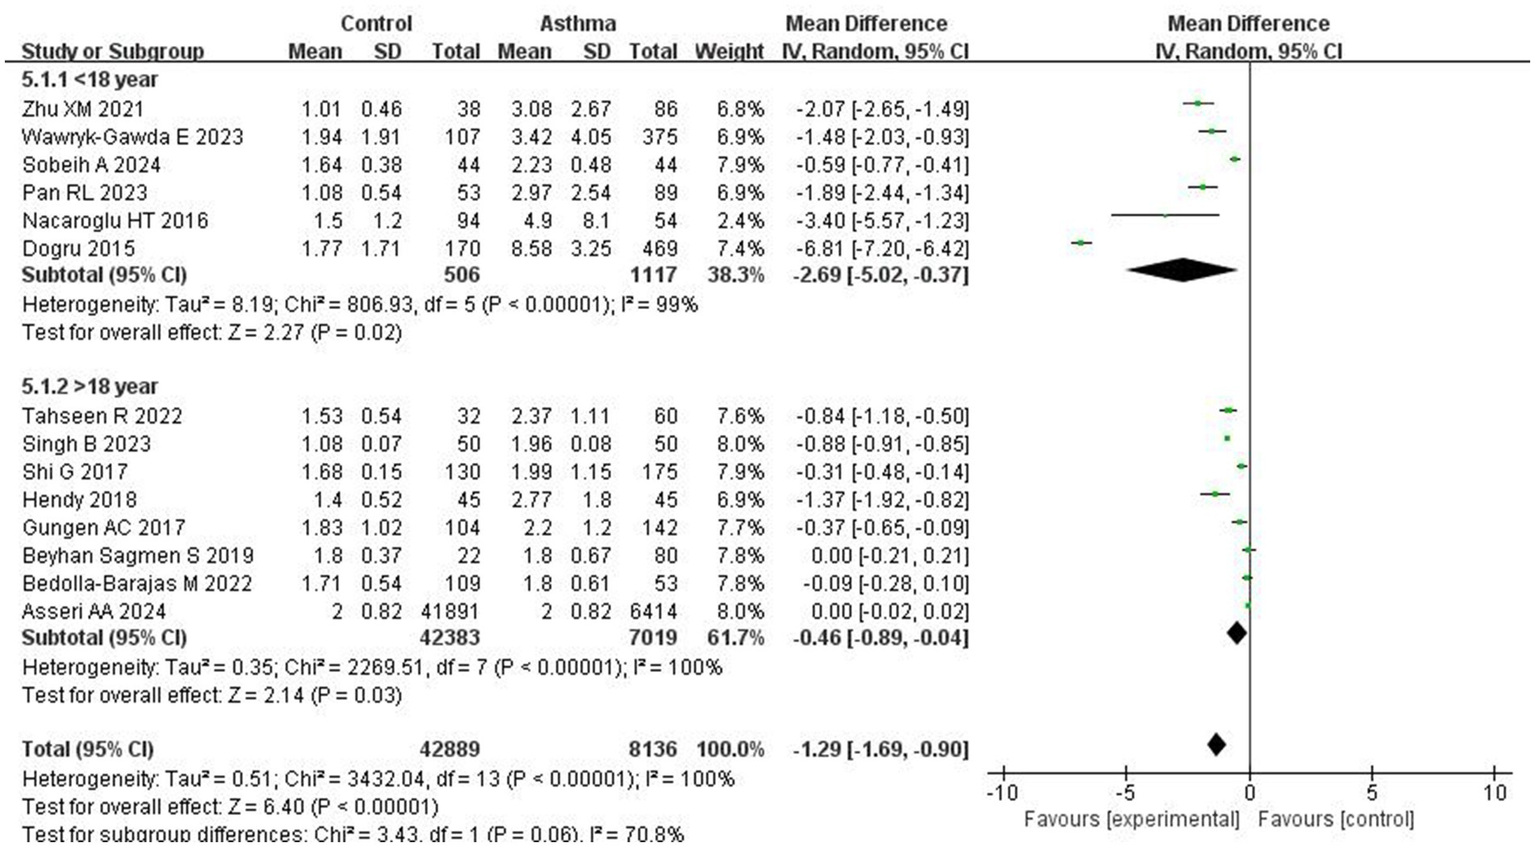
Forest plots of NLR across asthma patient subgroups by age.
Sensitivity analysis
Sensitivity analyses were performed by sequentially excluding individual studies from the Control vs. Asthma and NSA vs. SA comparisons. The results remained consistent, indicating no single study significantly influenced the overall effect size. In the Control vs. Asthma group, all 17 studies showed significant negative mean differences (MDs), with I2 ranging from 96 to 100%. In the NSA vs. SA group, all studies similarly reported significant negative MDs, with I2 ranging from 90 to 96%, confirming the robustness of the meta-analysis findings (Table 4).
Table 4
| Study | MD | 95%CI | I2 | p |
|---|---|---|---|---|
| Control vs. Asthma | ||||
| Nacaroglu | −1.08 | −1.48,-0.69 | 100 | <0.0001 |
| Pan | −1.09 | −1.49,-0.68 | 100 | <0.0001 |
| Dogru | −0.75 | −1.09--0.40 | 100 | <0.0001 |
| Shi G | −1.19 | −1.60,-0.78 | 100 | <0.0001 |
| Hendy | −1.12 | −1.52,-0.71 | 100 | <0.0001 |
| Zhu | −1.08 | −1.48,-0.67 | 100 | <0.0001 |
| Beyhan Sagmen | −1.21 | −1.62,0.80 | 100 | <0.0001 |
| Asseri | −1.27 | −2.02,-0.53 | 100 | <0.0001 |
| Wawryk-Gawda | −1.11 | −1.52,-0.71 | 100 | <0.0001 |
| Darwesh | −1.23 | −1.64,-0.82 | 100 | <0.0001 |
| Singh | −1.30 | −1.85,-0.75 | 99 | <0.0001 |
| Yildiz | −1.13 | −1.54,-0.73 | 100 | <0.0001 |
| Tahseen | −1.15 | −1.56,-0.75 | 100 | <0.0001 |
| Gungen | −1.18 | −1.59,-0.78 | 100 | <0.0001 |
| Sobeih | −1.17 | −1.58,-0.76 | 100 | <0.0001 |
| Bedolla-Barajas | −1.21 | −1.62,0.79 | 100 | <0.0001 |
| Obeagu | −1.06 | −1.46,-0.67 | 100 | <0.0001 |
| NSA vs. SA | ||||
| Nacaroglu | −2.02 | −2.84,-1.20 | 96 | <0.0001 |
| Pan | −2.11 | −2.92,-1.30 | 96 | <0.0001 |
| Shi | −1.44 | −2.12,-0.75 | 94 | <0.0001 |
| Hendy | −2.21 | −3.07.-1.34 | 96 | <0.0001 |
| Beyhan | −2.66 | −3.91,-1.41 | 96 | <0.0001 |
| Mochimaru | −2.69 | −4.11,-1.26 | 96 | <0.0001 |
| Asseri | −1.13 | −1.71,-0.55 | 90 | <0.0001 |
| Gungen | −2.49 | −3.48,-1.50 | 96 | <0.0001 |
Sensitivity analysis of the association between NLR and asthma.
Assessment of publication bias
Publication bias was assessed using both Egger’s regression test and Begg’s rank correlation test. In the comparison between the Control and Asthma groups, the Egger’s test indicated a trend toward funnel plot asymmetry (z = −1.9374, p = 0.0527), while Begg’s test showed no evidence of publication bias (Kendall’s tau = 0.0075, p = 0.9670; Figure 6A). For the comparison between NSA and SA, Egger’s test revealed potential publication bias (z = −2.0570, p = 0.0397). To explore the potential impact of this bias, a trim-and-fill analysis was conducted, which suggested that four missing studies were needed to restore symmetry. After adjustment, the pooled MD decreased to −0.41 (95% CI: −0.59 to −0.22, I2 = 0, p < 0.001). Begg’s test showed no evidence of bias (Kendall’s tau = −0.4286, p = 0.1789; Figure 6B).
Figure 6
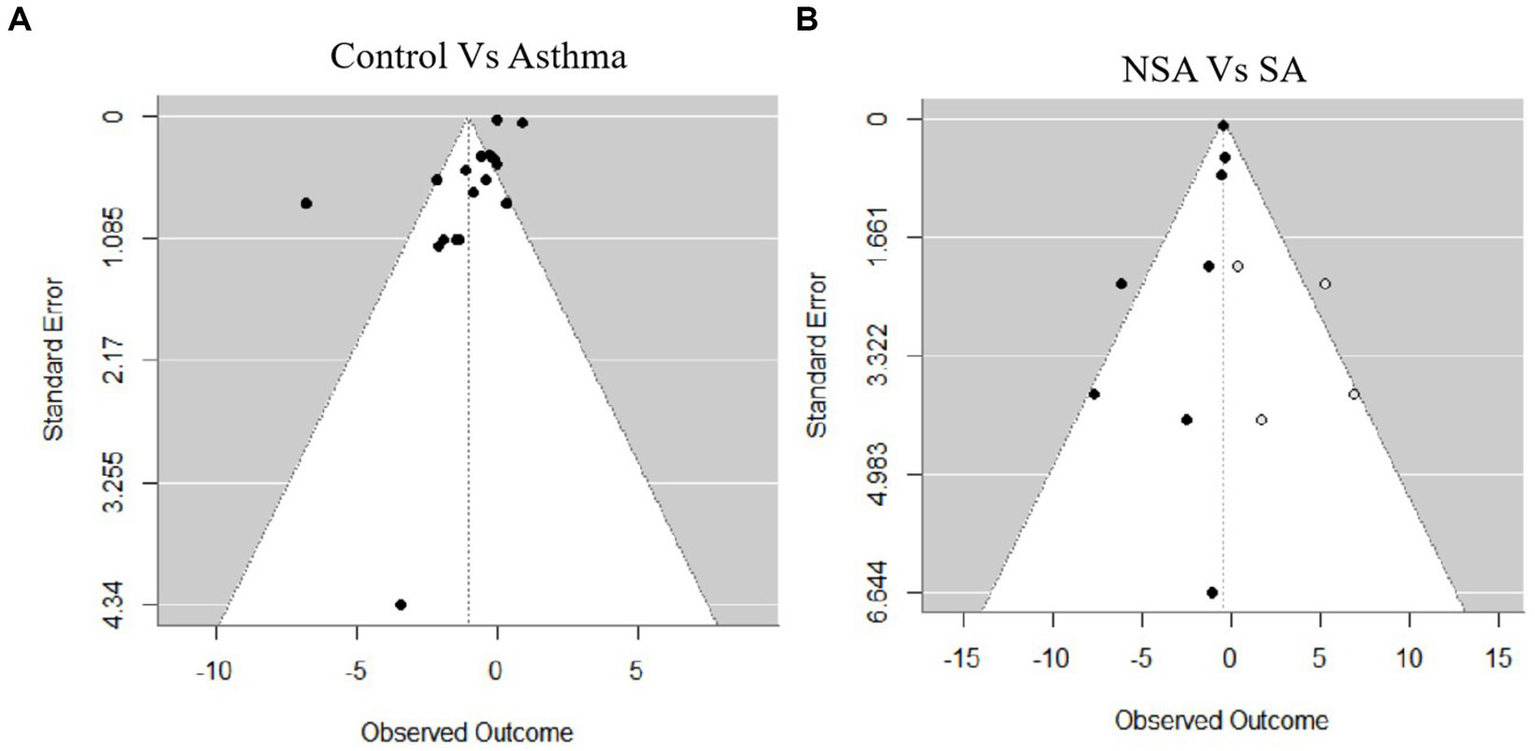
Funnel plots for publication bias. (A) Control vs. asthma. (B) Non-severe asthma (NSA) vs. severe asthma (SA).
ROC analysis
ROC analysis showed that NLR had good diagnostic performance across various asthma group comparisons. For distinguishing Asthma from Control, the AUC was 0.929 with a cutoff of 1.95 (sensitivity: 88.2%, specificity: 88.2%). Between NSA and SA, the AUC was 0.914 (cutoff: 2.44; sensitivity: 88.9%, specificity: 100%). The comparison of Mild vs. Moderate Asthma yielded an AUC of 0.800 (cutoff: 2.12; sensitivity: 100%, specificity: 60%). For Mild vs. Severe Asthma, the AUC reached 1.000, with both sensitivity and specificity at 100% (cutoff: 2.21). In Moderate vs. Severe Asthma, the AUC was 0.875 (cutoff: 3.55; sensitivity: 75%, specificity: 100%; Figure 7; Table 5).
Figure 7
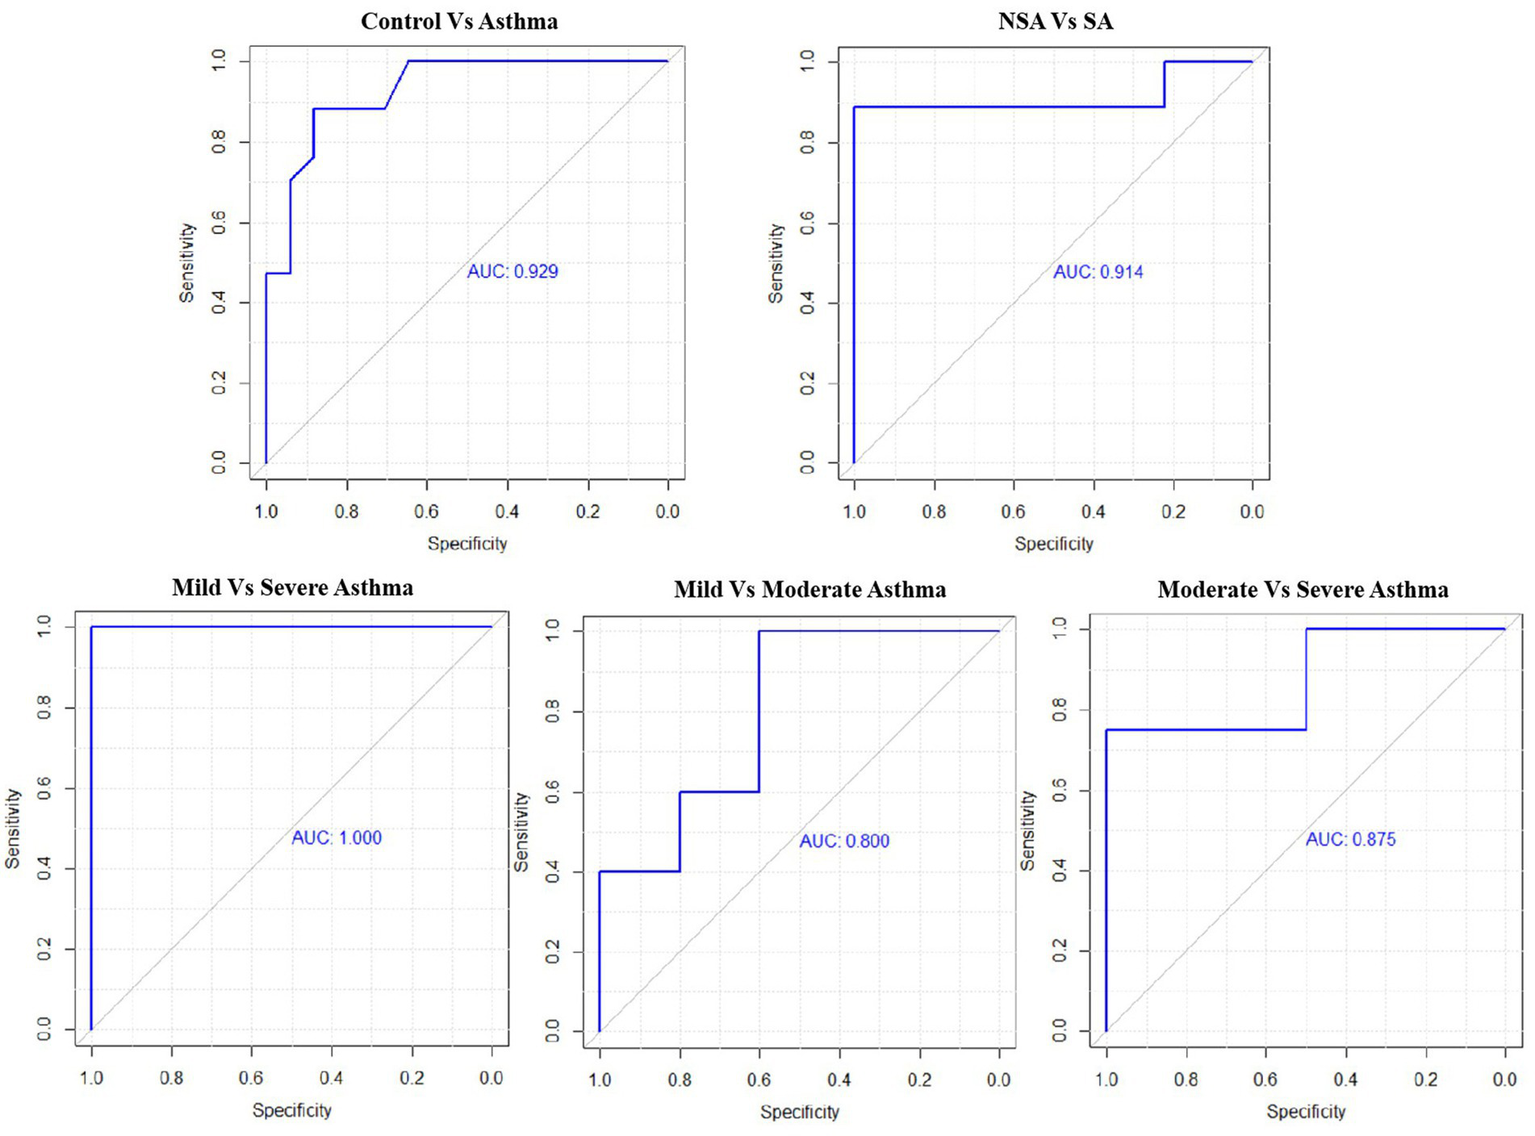
Receiver operating characteristic (ROC) curves for NLR across asthma severity subgroups.
Table 5
| Comparison | Cutoff | Sensitivity | Specificity | AUC |
|---|---|---|---|---|
| Control vs. Asthma | 1.95 | 0.882 | 0.882 | 0.929 |
| NSA vs. SA | 2.44 | 0.889 | 1 | 0.914 |
| Mild vs. Moderate | 2.12 | 1 | 0.600 | 0.800 |
| Mild vs. Severe | 2.21 | 1 | 1 | 1 |
| Moderate vs. Severe | 3.55 | 0.750 | 1 | 0.875 |
Predict value of NLR among different exacerbated asthma groups.
Discussion
This systematic review and meta-analysis evaluated the NLR as a biomarker reflecting systemic inflammation in asthma and its association with disease severity. Our findings demonstrate that NLR levels are significantly higher in asthma patients compared to healthy controls, with marked differences between severe and non-severe asthma groups. Notably, NLR effectively distinguished mild from moderate asthma, and showed a trend toward significance when comparing mild and severe asthma. However, the difference between moderate and severe asthma did not reach statistical significance.
These results align with previous meta-analyses by Huang et al (27) and Tahseen et al (28), who reported elevated NLR levels in asthma patients, particularly during exacerbations and in severe cases. Huang et al., however, included only six studies and focused primarily on acute exacerbations, while Tahseen et al. found significantly higher NLR levels in severe asthma compared to non-severe cases, suggesting a possible association between NLR and asthma severity. However, both studies were limited by small sample sizes and lacked detailed stratification across multiple severity levels.
The elevated NLR observed in asthma patients, particularly those with severe asthma, can be understood through the pathophysiology of disease. Asthma is characterized by chronic airway inflammation involving both neutrophils and lymphocytes (29, 30). Neutrophils, typically responsible for the innate immune response against infections, are often elevated in the airways of patients with asthma (31, 32). Their accumulation contributes to persistent inflammation, tissue injury, and airway remodeling—features that correlate with increased disease severity. Conversely, lymphocytes mediate allergic responses and adaptive immunity (33). An elevated NLR reflects a shift toward neutrophilic dominance and systemic inflammation, potentially serving as a surrogate marker for asthma severity and immune dysregulation. This pathophysiological relationship is supported by our ROC analysis, which demonstrated high diagnostic performance of NLR in distinguishing asthma patients from healthy controls (AUC = 0.929) and severe asthma from non-severe asthma (AUC = 0.914). However, the lower accuracy observed when differentiating mild from moderate asthma (AUC = 0.800) suggests that NLR may be less sensitive to subtle inflammatory changes in less advanced disease stages. This discrepancy may be attributed to overlapping inflammatory phenotypes in these stages (34), especially in patients with established airway remodeling or chronic neutrophilic burden. Additionally, relatively limited number of direct comparisons may have reduced the statistical power to detect subtle differences.
Subgroup analyses revealed significant geographic and age-related disparities in NLR levels Asthma patients in developed countries exhibited larger NLR differences compared to controls than those in developing regions, likely due to higher detection of severe phenotypes, greater environmental pollutant exposure (e.g., PM2.5), and improved healthcare access (35, 36). Conversely, underdiagnosis and limited treatment in developing areas may attenuate NLR elevations. Age stratification showed pediatric patients had markedly higher NLR differences than adults, potentially reflecting immature immune regulation favoring neutrophilic inflammation. Adults’ lower NLR differences may result from long-term anti-inflammatory therapy or adaptive immune modulation (16, 37). High heterogeneity across subgroups (I2 > 97%) underscores the influence of individual and environmental confounders. In addition to geographic and age-related factors, the variability in how asthma severity was defined across the included studies may also have contributed to the observed heterogeneity. Although all studies applied objective or guideline-based criteria, such as pulmonary function (FEV₁%), FeNO levels, bronchial provocation tests, reversibility testing, or adherence to GINA guidelines, there was no single unified standard across studies. Nonetheless, the consistent use of standardized clinical tools ensures a reasonable level of comparability and supports the validity of the pooled findings.
Several biomarkers have been integrated into clinical practice to guide treatment decisions in asthma, particularly in patients with severe or treatment-resistant disease. Among these, blood eosinophils, serum IgE, fractional exhaled nitric oxide (FeNO), and periostin are the most established and widely used, especially in identifying type 2 (T2)-high phenotypes that may benefit from corticosteroids or biologic therapies (38, 39). However, these biomarkers have limitations, including variable availability, higher cost, and limited utility in certain asthma phenotypes, such as those with non-eosinophilic or mixed inflammatory patterns. In this context, there is growing interest in identifying practical, affordable, and broadly applicable biomarkers to support individualized asthma management.
The NLR, derived from routine blood tests, has been proposed as an accessible marker of systemic inflammation. Although not specific to asthma, our meta-analysis demonstrates a consistent association between elevated NLR and greater disease severity. While this study did not stratify patients by inflammatory endotype, these findings support the potential utility of NLR as a supplementary tool, particularly in settings where conventional biomarkers are unavailable or less informative.
Despite these efforts, several limitations should be acknowledged. First, the overall heterogeneity observed in the pooled analyses was substantial, which may affect the generalizability of the findings. While we employed a random-effects model and conducted subgroup and sensitivity analyses to explore potential sources, residual variability likely remains. Second, although NLR levels increased with asthma severity, its ability to clearly differentiate between moderate and severe asthma stages was limited, suggesting that NLR alone may not fully capture nuanced inflammatory changes across disease progression. Third, most of the included studies were retrospective in design, introducing potential selection and information biases and underscoring the need for future prospective studies to validate and refine the clinical applicability of NLR in asthma management.
Conclusion
This systematic review and meta-analysis confirms that the NLR is elevated in asthma patients compared to healthy controls, with levels increasing alongside disease severity. Subgroup analyses revealed more pronounced NLR differences in pediatric populations and studies from developed countries. While NLR effectively distinguished asthma and severe cases, its ability to differentiate between moderate and severe asthma was limited. These findings support the potential role of NLR as a biomarker for asthma identification and severity stratification. Future prospective studies are needed to validate standardized thresholds and to explore its combined use with other indicators for improved precision across all severity stages.
Statements
Data availability statement
The original contributions presented in the study are included in the article/supplementary material, further inquiries can be directed to the corresponding author/s.
Author contributions
LJ: Conceptualization, Data curation, Methodology, Software, Writing – original draft. JG: Formal analysis, Funding acquisition, Investigation, Writing – original draft. KD: Data curation, Methodology, Writing – original draft. YY: Conceptualization, Funding acquisition, Supervision, Writing – review & editing.
Funding
The author(s) declare that financial support was received for the research and/or publication of this article. This work was supported by the Xi’an Science and Technology Planning Project (22YXYJ0136). YY acknowledges research funding from the Xi’an Science and Technology Bureau.
Conflict of interest
The authors declare that the research was conducted in the absence of any commercial or financial relationships that could be construed as a potential conflict of interest.
Generative AI statement
The author(s) declare that no Gen AI was used in the creation of this manuscript.
Publisher’s note
All claims expressed in this article are solely those of the authors and do not necessarily represent those of their affiliated organizations, or those of the publisher, the editors and the reviewers. Any product that may be evaluated in this article, or claim that may be made by its manufacturer, is not guaranteed or endorsed by the publisher.
References
1.
Miller RL Grayson MH Strothman K . Advances in asthma: new understandings of asthma's natural history, risk factors, underlying mechanisms, and clinical management. J Allergy Clin Immunol. (2021) 148:1430–41. doi: 10.1016/j.jaci.2021.10.001
2.
Bleecker ER Menzies-Gow AN Price DB Bourdin A Sweet S Martin AL et al . Systematic literature review of systemic corticosteroid use for asthma management. Am J Respir Crit Care Med. (2020) 201:276–93. doi: 10.1164/rccm.201904-0903SO
3.
Global Initiative for Asthma . Global strategy for asthma management and prevention, (2025). Available from: https://ginasthma.org/reports (Accessed June 17, 2025).
4.
Yimlamai S Ruangnapa K Anuntaseree W Saelim K Prasertsan P Sirianansopa K . A longitudinal study of a selected pediatric asthmatic population with Normal and abnormal spirometry at baseline: an emphasis on treatment outcomes. J Asthma Allergy. (2024) 17:61–8. doi: 10.2147/JAA.S432648
5.
Ke J Qiu F Fan W Wei S . Associations of complete blood cell count-derived inflammatory biomarkers with asthma and mortality in adults: a population-based study. Front Immunol. (2023) 14:1205687. doi: 10.3389/fimmu.2023.1205687
6.
Zhu X Zhou L Li Q Pan R Zhang J Cui Y . Combined score of C-reactive protein level and neutrophil-to-lymphocyte ratio: a novel marker in distinguishing children with exacerbated asthma. Int J Immunopathol Pharmacol. (2021) 35:20587384211040641. doi: 10.1177/20587384211040641
7.
Xu M Zhou L Zhang J Luo S Zhao Y Xiong W . Neutrophil to lymphocyte ratio in pediatric patients with asthmatic exacerbation and community-acquired pneumonia. BMC Pediatr. (2023) 23:640. doi: 10.1186/s12887-023-04456-6
8.
Moosmann J Krusemark A Dittrich S Ammer T Rauh M Woelfle J et al . Age- and sex-specific pediatric reference intervals for neutrophil-to-lymphocyte ratio, lymphocyte-to-monocyte ratio, and platelet-to-lymphocyte ratio. Int J Lab Hematol. (2022) 44:296–301. doi: 10.1111/ijlh.13768
9.
Stang A . Critical evaluation of the Newcastle-Ottawa scale for the assessment of the quality of nonrandomized studies in meta-analyses. Eur J Epidemiol. (2010) 25:603–5. doi: 10.1007/s10654-010-9491-z
10.
Nacaroglu HT İsgüder R Bent S Erdem Bahceci S Ceylan G Korkmaz HA et al . Can neutrophil/lymphocyte ratio be a novel biomarker of inflammation in children with asthma?Eur J Inflamm. (2016) 14:109–12. doi: 10.1177/1721727X16660558
11.
Pan R Ren Y Li Q Zhu X Zhang J Cui Y et al . Neutrophil-lymphocyte ratios in blood to distinguish children with asthma exacerbation from healthy subjects. Int J Immunopathol Pharmacol. (2023) 37:3946320221149849. doi: 10.1177/03946320221149849
12.
Dogru M Yesiltepe Mutlu RG . The evaluation of neutrophil-lymphocyte ratio in children with asthma. Allergol Immunopathol (Madr). (2016) 44:292–6. doi: 10.1016/j.aller.2015.09.005
13.
Shi G Zhao JW Ming L . Clinical significance of peripheral blood neutrophil-lymphocyte ratio and platelet-lymphocyte ratio in patients with asthma. Nan Fang Yi Ke Da Xue Xue Bao. (2017) 37:84–8. doi: 10.3969/j.issn.1673-4254.2017.01.15
14.
Hendy R Elawady M Mansour A . Assessment of neutrophil/lymphocyte percentage in bronchial asthma. Egypt J Chest Dis Tuberc. (2019) 68:74. doi: 10.4103/ejcdt.ejcdt_112_18
15.
Sagmen B S Kıral N . The evaluation of neutrophil-to-lymphocyte ratio and platelet-to-lymphocyte ratio in asthma control. Rev Fr Allergol. (2020) 60:20–3. doi: 10.1016/j.reval.2019.09.001
16.
Wawryk-Gawda E Zybowska M Ostrowicz K . The neutrophil to lymphocyte ratio in children with bronchial asthma. J Clin Med. (2023) 12:2–8. doi: 10.3390/jcm12216869
17.
Darwesh MA-S Abd Alhaleem IS Al-Obaidy MWS . The correlation between asthma severity and neutrophil to lymphocyte ratio. Eur J Med Health Sci. (2020) 2:1–8. doi: 10.24018/ejmed.2020.2.2.67
18.
Singh B Dutta V Singh S Pundit P . Diagnostic insights from chemometric analysis of hemogram inflammatory indexes in male smokers with and without asthma or chronic obstructive pulmonary disease. Int J Lab Hematol. (2024) 46:627–36. doi: 10.1111/ijlh.14264
19.
Yildiz EAF Kuzu S Koca B . Eosinophil to lymphocyte and neutrophil to lymphocyte ratio as a new predictive and prognostic factor at the both asthma and allergic rhinitis. Acta Med Mediterr. (2020) 36:329–33. doi: 10.31923/pooltext-preprint-3365-0093-0026
20.
Tahseen R Parvez M Kumar GS Jahan P . Combined neutrophil-to-lymphocyte ratio and serum neutrophil elastase. Biomed Biotechnol Res J. (2022) 6:538–42. doi: 10.4103/bbrj.bbrj
21.
Adil G Can YA . The correlation between asthma disease and neutrophil to lymphocyte ratio. Res J Allergy Immunol. (2017) 1:1–4.
22.
Sobeih SAD AA Ali AM Ismaiel Y . Neutrophils to lymphocytes ratio as a biomarker in pediatric asthma severity and control. Benha Med J. (2024) 42:419–33. doi: 10.21608/bmfj.2024.323823.2208
23.
Bedolla-Barajas M Morales-Romero J Hernandez-Colin DD Larenas-Linnemann D Mariscal-Castro J Flores-Razo MM et al . Beyond eosinophilia: inflammatory patterns in patients with asthma. J Asthma. (2022) 59:255–63. doi: 10.1080/02770903.2020.1852413
24.
Obeagu EIOG Igwe MC Okafor CJ Uwakwe OS et al . Inflammatory markers in patients with asthma in a tertiary hospital in Uganda. Acad J Health Sci. (2023) 38:94–7. doi: 10.3306/AJHS.2023.38.02.94
25.
Mochimaru T Ueda S Suzuki Y Asano K Fukunaga K . Neutrophil-to-lymphocyte ratio as a novel independent predictor of severe exacerbation in patients with asthma. Ann Allergy Asthma Immunol. (2019) 122:337–339.e1. doi: 10.1016/j.anai.2018.11.029
26.
Borchers A Pieler T . Programming pluripotent precursor cells derived from Xenopus embryos to generate specific tissues and organs. Genes (Basel). (2010) 1:413–26. doi: 10.3390/genes1030413
27.
Huang WJHG Zhan QM Chen JL Luo WT Wu LH Wu LY et al . The neutrophil to lymphocyte ratio as a novel predictor of asthma and its exacerbation: a systematic review and meta-analysis. Eur Rev Med Pharmacol Sci. (2020) 24:11719–28. doi: 10.26355/eurrev_202011_23819
28.
Tahseen R Parvez M Jahan P . Clinical utility of neutrophil-to-lymphocyte ratio in the assessment of asthma and its severity. Curr Med Res Pract. (2023) 13:137–41. doi: 10.4103/cmrp.cmrp_87_22
29.
Habib N Pasha MA Tang DD . Current understanding of asthma pathogenesis and biomarkers. Cells. (2022) 11:2764. doi: 10.3390/cells11172764
30.
Hammad H Lambrecht BN . The basic immunology of asthma. Cell. (2021) 184:2521–2. doi: 10.1016/j.cell.2021.04.019
31.
Li Y Yang T Jiang B . Neutrophil and neutrophil extracellular trap involvement in neutrophilic asthma: a review. Medicine (Baltimore). (2024) 103:e39342. doi: 10.1097/MD.0000000000039342
32.
Ravi VR Korkmaz FT De Ana CL Lu L Shao FZ Odom CV et al . Lung CD4(+) resident memory T cells use airway secretory cells to stimulate and regulate onset of allergic airway neutrophilic disease. Cell Rep. (2025) 44:115294. doi: 10.1016/j.celrep.2025.115294
33.
Chi H Pepper M Thomas PG . Principles and therapeutic applications of adaptive immunity. Cell. (2024) 187:2052–78. doi: 10.1016/j.cell.2024.03.037
34.
Han YY Zhang X Wang J Wang G Oliver BG Zhang HP et al . Multidimensional assessment of asthma identifies clinically relevant phenotype overlap: a cross-sectional study. J Allergy Clin Immunol Pract. (2021) 9:349–362.e18. doi: 10.1016/j.jaip.2020.07.048
35.
Cheng F He L Deng D Zhang J Liu C . Analysis of asthma incidence and mortality rates among children aged 0-14 in 204 countries from 1990 to 2019. J Asthma. (2025) 62:45–55. doi: 10.1080/02770903.2024.2386442
36.
Yuan L Tao J Wang J She W Zou Y Li R et al . Global, regional, national burden of asthma from 1990 to 2021, with projections of incidence to 2050: a systematic analysis of the global burden of disease study 2021. EClinicalMedicine. (2025) 80:103051. doi: 10.1016/j.eclinm.2024.103051
37.
Capitanio JP Del Rosso LA Spinner A . Variation in infant rhesus monkeys' (Macaca mulatta) neutrophil-to-lymphocyte ratio is associated with environmental conditions, emotionality, and cortisol concentrations, and predicts disease-related outcomes. Brain Behav Immun. (2023) 109:105–16. doi: 10.1016/j.bbi.2023.01.012
38.
Shah PA Brightling C . Biologics for severe asthma-which, when and why?Respirology. (2023) 28:709–21. doi: 10.1111/resp.14520
39.
Matera MG Rinaldi B Annibale R De Novellis V Cazzola M . The pharmacological management of asthma in adults: 2023 update. Expert Opin Pharmacother. (2024) 4:383–93. doi: 10.1111/resp.14520”10.1111/resp.14520
Summary
Keywords
asthma, neutrophil-to-lymphocyte ratio, severity stratification, systemic inflammation, meta-analysis
Citation
Jin L, Guo J, Deng K and Yao Y (2025) Neutrophil-to-lymphocyte ratio as a biomarker for asthma identification and severity stratification: a systematic review and meta-analysis. Front. Med. 12:1620695. doi: 10.3389/fmed.2025.1620695
Received
20 May 2025
Accepted
12 June 2025
Published
24 June 2025
Volume
12 - 2025
Edited by
Evangelia Fouka, National and Kapodistrian University of Athens, Greece
Reviewed by
Ourania Papaioannou, General University Hospital of Patras, Greece
Ilektra Voulgareli, University General Hospital Attikon, Greece
Updates
Copyright
© 2025 Jin, Guo, Deng and Yao.
This is an open-access article distributed under the terms of the Creative Commons Attribution License (CC BY). The use, distribution or reproduction in other forums is permitted, provided the original author(s) and the copyright owner(s) are credited and that the original publication in this journal is cited, in accordance with accepted academic practice. No use, distribution or reproduction is permitted which does not comply with these terms.
*Correspondence: Yang Yao, yaoyang1220@sina.com
†These authors have contributed equally to this work
Disclaimer
All claims expressed in this article are solely those of the authors and do not necessarily represent those of their affiliated organizations, or those of the publisher, the editors and the reviewers. Any product that may be evaluated in this article or claim that may be made by its manufacturer is not guaranteed or endorsed by the publisher.