 Ruikai Xu
 Zhonghua Liu
- Department of Rehabilitation, Zhongshan People’s Hospital, Zhongshan, Guangdong, China
Background and Objective: Aging and obesity are recognized as risk factors for cognitive decline. Hemoglobin (Hb) reflects oxygen supply capacity, while red blood cell distribution width (RDW) reflects levels of inflammation and oxidative stress. The hemoglobin-to-red blood cell distribution width ratio (HRR), by integrating the core physiological functions of Hb and RDW, can more comprehensively reflect the common mechanisms affecting aging, obesity, and cognitive function. The objective of this research was to explore the link between the HRR and cognitive performance among the obese population.
Methods: This cross-sectional study used data from the National Health and Nutrition Examination Survey (NHANES) and employed multiple regression analysis, smooth curve fitting, and subgroup analysis to investigate the relationship between HRR and cognitive function.
Results: 1,055 obese individuals aged ≥60 years participated in the study. After adjusting for covariates, HRR was significantly positively correlated with DSST scores (β = 14.45; 95% CI, 7.55–21.35) and total cognitive Z-scores (β = 1.53; 95% CI, 0.40–2.67). HRR was significantly negatively correlated with low cognitive function as assessed by DSST (OR = 0.04; 95% CI, 0.01–0.23). Compared to individuals with lower education levels, those with higher educational backgrounds showed a more pronounced positive correlation between HRR and DSST scores.
Conclusion: Maintaining a higher HRR may be an important strategy for protecting cognitive function in obese individuals aged ≥60 years.
1 Background
As humans age, there is often a decline in cognitive function, which significantly increases the risk of developing mild cognitive impairment and eventually dementia (1). In patients with dementia, cognitive impairment severely impacts quality of life and the ability to live independently (2).
Cognitive impairment has become a major public health issue (3). By the middle of the 21st century, it is projected that the number of individuals with cognitive impairment in the United States will exceed 21 million, while the global number of dementia patients will surpass 150 million (3, 4). This growing trend will impose substantial burdens on individuals, society, and the economy (5).
The relationship between obesity and cognitive impairment is particularly significant (6). Obesity increases the risk of developing Alzheimer’s disease, stroke-related dementia (6, 7). Obesity increases cognitive impairment risk via multiple mechanisms: High-fat diets trigger brain inflammation in areas like the hypothalamus and hippocampus, releasing inflammatory factors that damage neural structures (8–10). This process also causes lipid peroxidation, harming the blood-brain barrier (11). Insulin resistance in the brain impairs glucose use and synaptic function, while leptin resistance and ghrelin imbalance disrupt appetite control and reinforce rewards system sensitivity to fatty foods (12, 13). These mechanisms together reduce gray matter volume in key brain regions, degrade white matter integrity, decrease blood flow, and weaken network connectivity, ultimately worsening cognitive decline and dementia risk (14, 15).
As a core factor maintaining the homeostasis of cerebral oxygen supply, hemoglobin (Hb) participates in the regulation of cognitive function by regulating oxygen metabolism (16). When Hb levels decrease, the oxygen delivery through cerebral blood flow fails to match metabolic demands, which can induce functional impairment of brain cells and accelerate the progression of cognitive decline (16, 17). Red blood cell distribution width (RDW) is significantly correlated with systemic inflammatory response and oxidative stress levels, and these mechanisms are the common core pathophysiological pathways driving aging, obesity, and cognitive decline (18, 19). By integrating the oxygen supply regulatory function of Hb and the inflammation and oxidative stress signals reflected by RDW, hemoglobin-to-red blood cell distribution width ratio (HRR) constructs a multi-dimensional association mechanism with aging, obesity, and cognitive function. As a composite biomarker integrating the core physiological functions of Hb and RDW, HRR can more comprehensively reflect the common mechanisms affecting aging, obesity, and cognitive function including inflammation, oxidative stress, abnormal oxygen metabolism, and nerve damage, thereby overcoming the limitation that a single biomarker can only reflect local pathophysiological processes (14). The HRR has shown promise in predicting various diseases, including depression (20), coronary artery disease (21), stroke (22), osteoporosis (23), and metastatic kidney cancer (24) in recent years.
Notably, research on the HRR and cognitive function remains scarce, particularly among obese individuals aged ≥60 years. We hypothesize that in obese populations, higher HRR correlates with better cognitive performance, independent of confounders like age and comorbidities, potentially mediated by improved cerebral oxygenation and reduced systemic inflammation. This study explores HRR’s association with cognitive function in this group, examining whether elevated HRR acts as a cognitive protective factor–offering new insights into cognitive protection for obese older adults.
2 Materials and methods
2.1 Study population
This study focused on the NHANES dataset from 2011 to 2014 (25), with an initial inclusion of 19,931 participants. The NCHS Research Ethics Review Board approved all NHANES protocols of the survey (26). According to the NHANES database criteria, only individuals aged 60 years and above met the basic requirements for cognitive function testing. As shown in Figure 1, the study excluded participants with incomplete cognitive function test data (n = 16,997) and those with missing hemoglobin and red blood cell distribution width (RDW) data (n = 101). The remaining participants were classified into an obese population [Body mass index (BMI) ≥ 30 kg/m2, n = 1,055] and non-obese individuals (BMI < 30 kg/m2, n = 1,778).
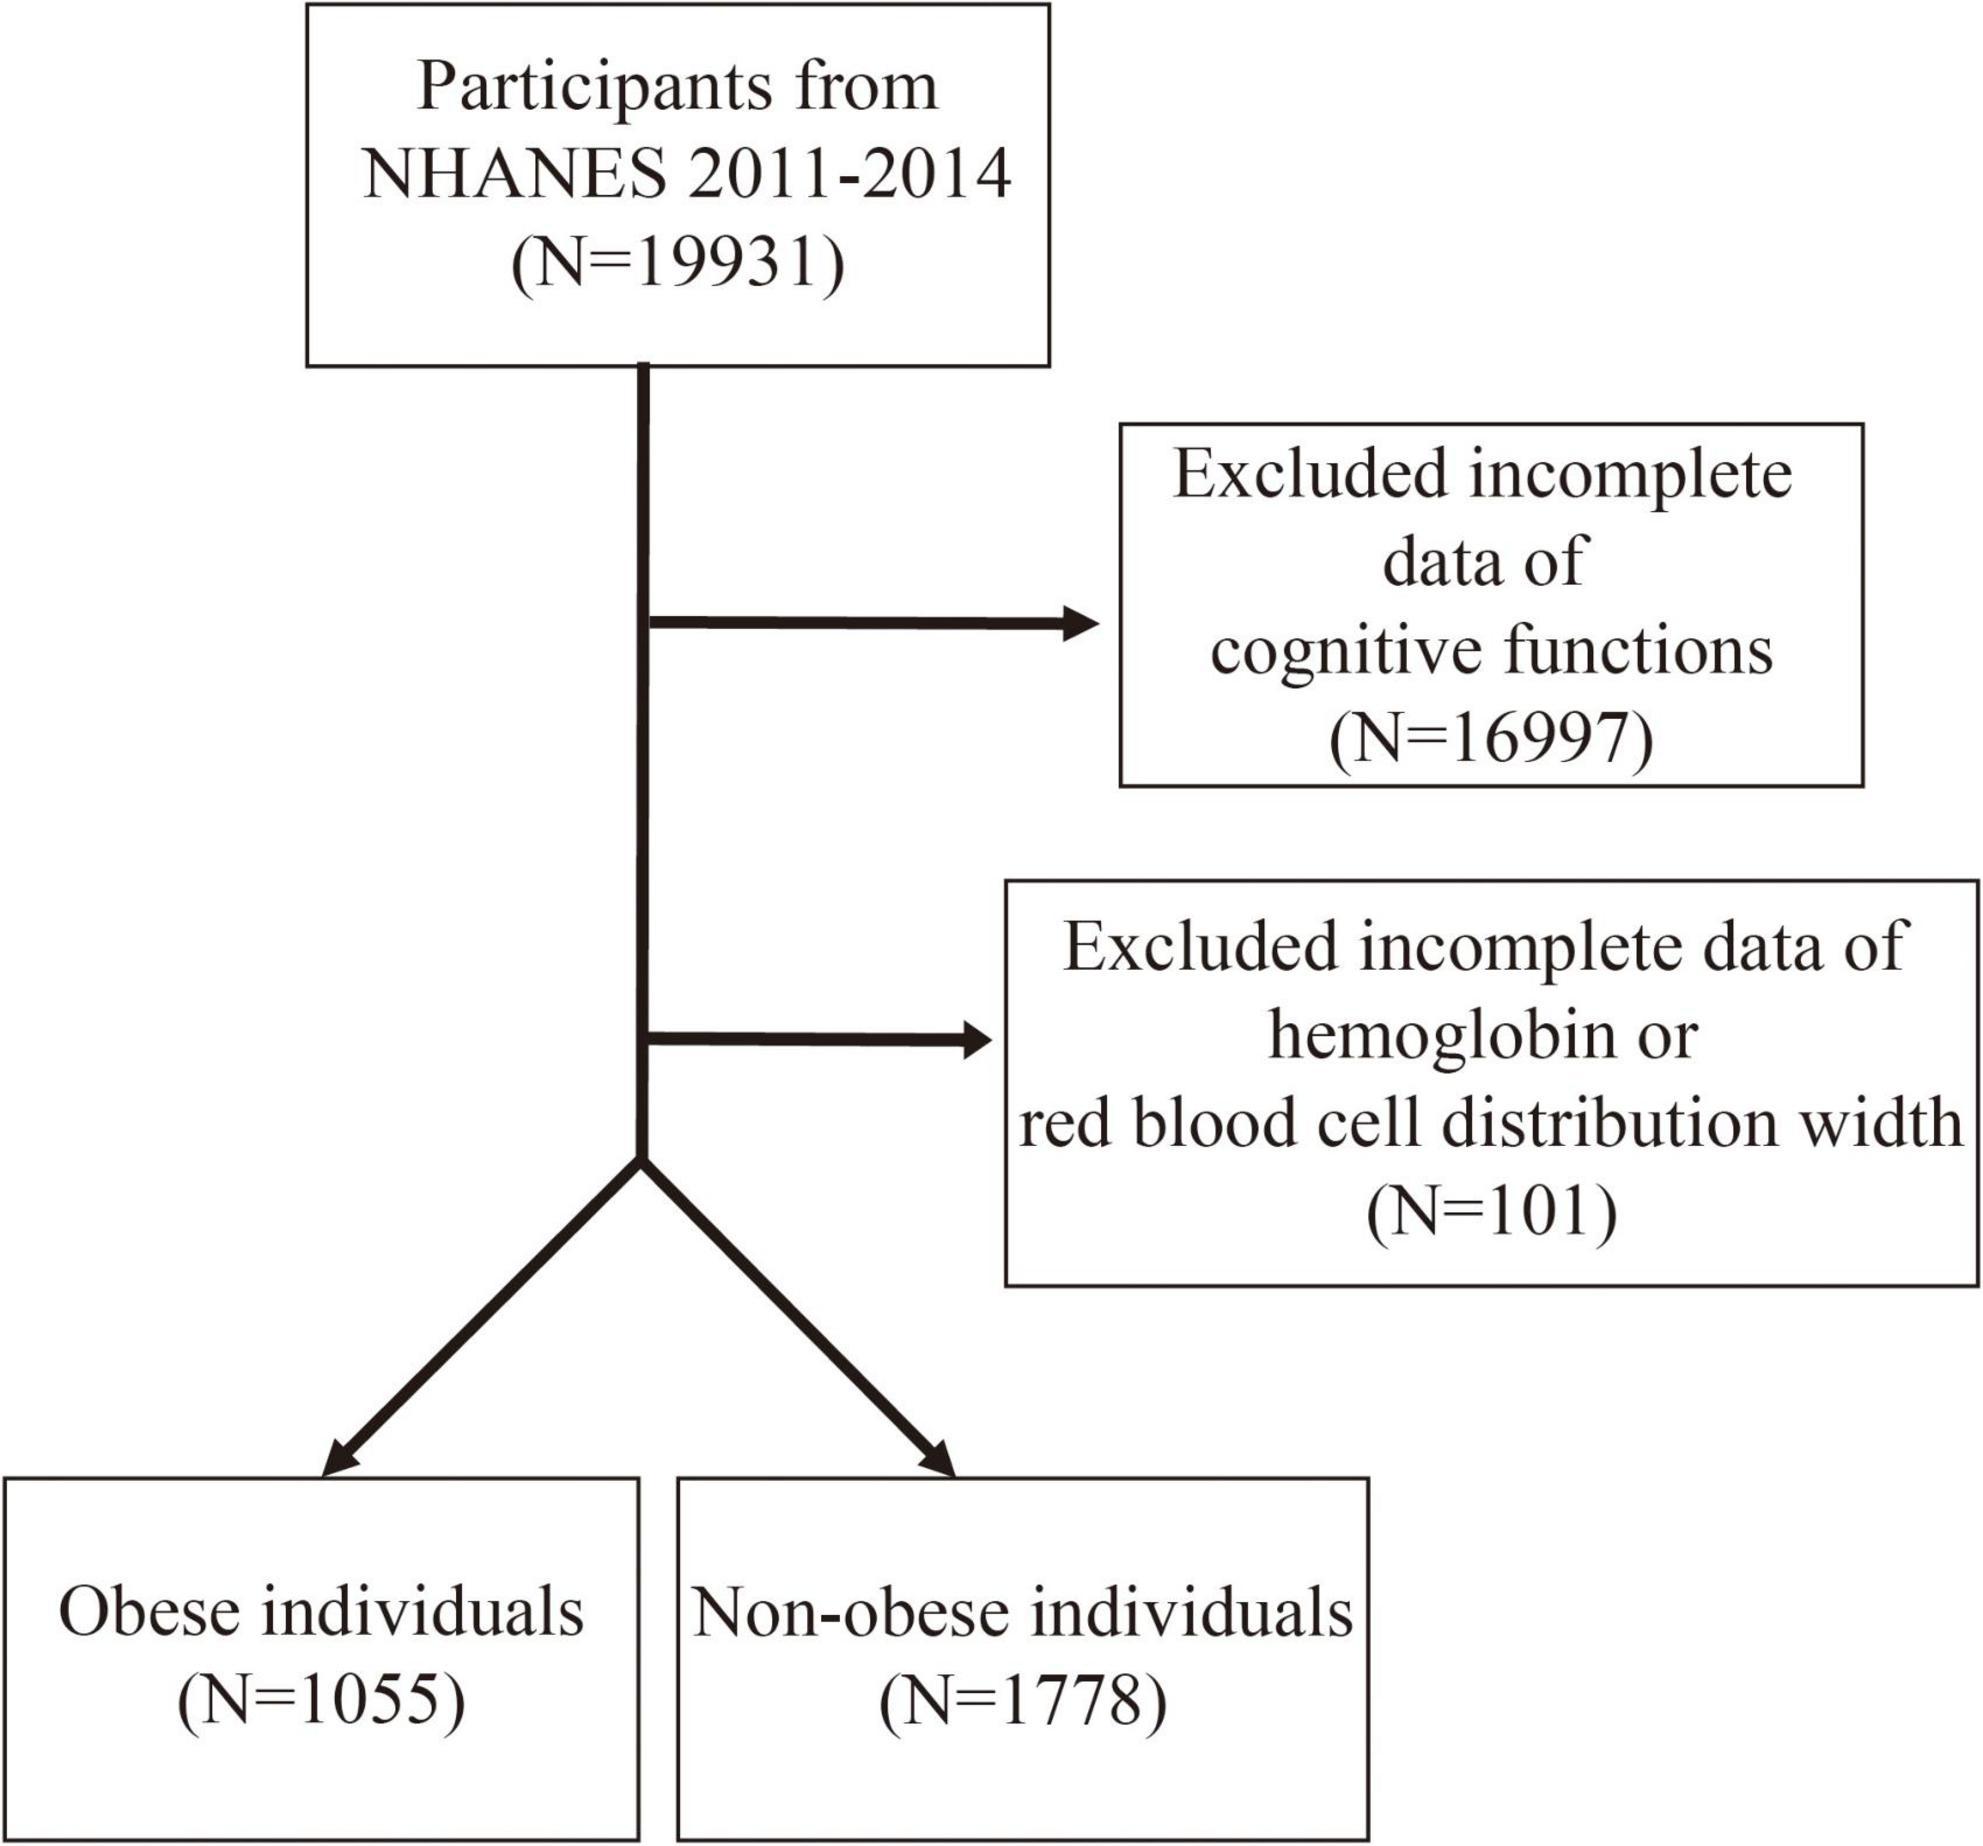
Figure 1. Flow chart of participants selection.
2.2 HRR calculation
The HRR was calculated based on the ratio of hemoglobin to RDW (21).
2.2.1 Cognitive function assessment
Cognitive function was assessed using the following tests: the word learning and recall modules from the Consortium to Establish a Registry for Alzheimer’s Disease (CERAD), the Animal Fluency Test (AFT), and the Digit Symbol Substitution Test (DSST) (27). Overall cognitive function was assessed using standardized total Z-scores [Z = (x−μ)/σ], where x is the specific test score, μ is the mean, and σ is the standard deviation (28). Low cognitive function (LCF) was defined as the lowest quartile of the test scores (19, 29), with Z-scores ≤ 2 indicating low risk of low cognitive function and Z-scores > 2 indicating high risk (High Risk of LCF by Z) (27, 30).
2.2.2 Covariates assessment
The covariates gathered for this study encompassed a range of demographic and health-related factors, including sex, age, race, education level, marital status, poverty-to-income ratio (PIR), BMI, smoking habits, alcohol use, and self-reported medical conditions such as diabetes, hypertension, cardiovascular diseases, and stroke.
2.3 Statistical analysis
All analyses were performed using EmpowerStats and R software. Participants were grouped according to HRR quartiles, and t-tests and chi-square tests were used to assess continuous and categorical variables, respectively. Multiple regression models were used to evaluate the relationship between HRR, both as a continuous variable and by quartile, and cognitive function. A smooth curve fitting model was applied to explore the relationship between HRR and cognitive test scores, as well as low cognitive function. Additionally, subgroup analyses and interaction analyses were conducted based on stratified factors such as age and sex. A P-value of <0.05 was considered statistically significant.
3 Results
3.1 Baseline characteristics
1,055 obese individuals aged ≥60 years were included, with a mean age of 68.65 ± 6.45 years. Among them, 57.16% were females, and 47.01% were non-Hispanic White. The mean hemoglobin-to-red blood cell distribution width ratio (HRR) was 1.01 ± 0.15. The mean scores for the CERAD, AFT, DSST tests, and the total Z-score were 26.06 ± 6.22, 16.86 ± 5.46, 46.11 ± 17.03, and −0.00 ± 2.40, respectively.
According to the CERAD, AFT, and DSST test scores, the cutoff points for low cognitive function were 22, 13, and 34, respectively. Scores below these cutoff points were considered to indicate low cognitive function (LCF), categorized as LCF by CERAD, LCF by AFT, and LCF by DSST.
Baseline information based on HRR quartiles is presented in Table 1. Table 1 presents the BMI characteristics of the obese population aged ≥60 years stratified by HRR quartiles. The total obese population had a mean BMI of 35.38 ± 5.33 kg/m2. Across HRR quartiles, BMI showed a decreasing trend: 36.63 ± 6.63 kg/m2 in Q1 (HRR range: 0.44–0.92), 35.74 ± 5.38 kg/m2 in Q2 (HRR range: 0.92–1.01), 34.84 ± 4.29 kg/m2 in Q3 (HRR range: 1.01–1.10), and 34.32 ± 4.44 kg/m2 in Q4 (HRR range: 1.11–1.43). A statistically significant difference in BMI among the HRR quartile groups was observed (P < 0.001).
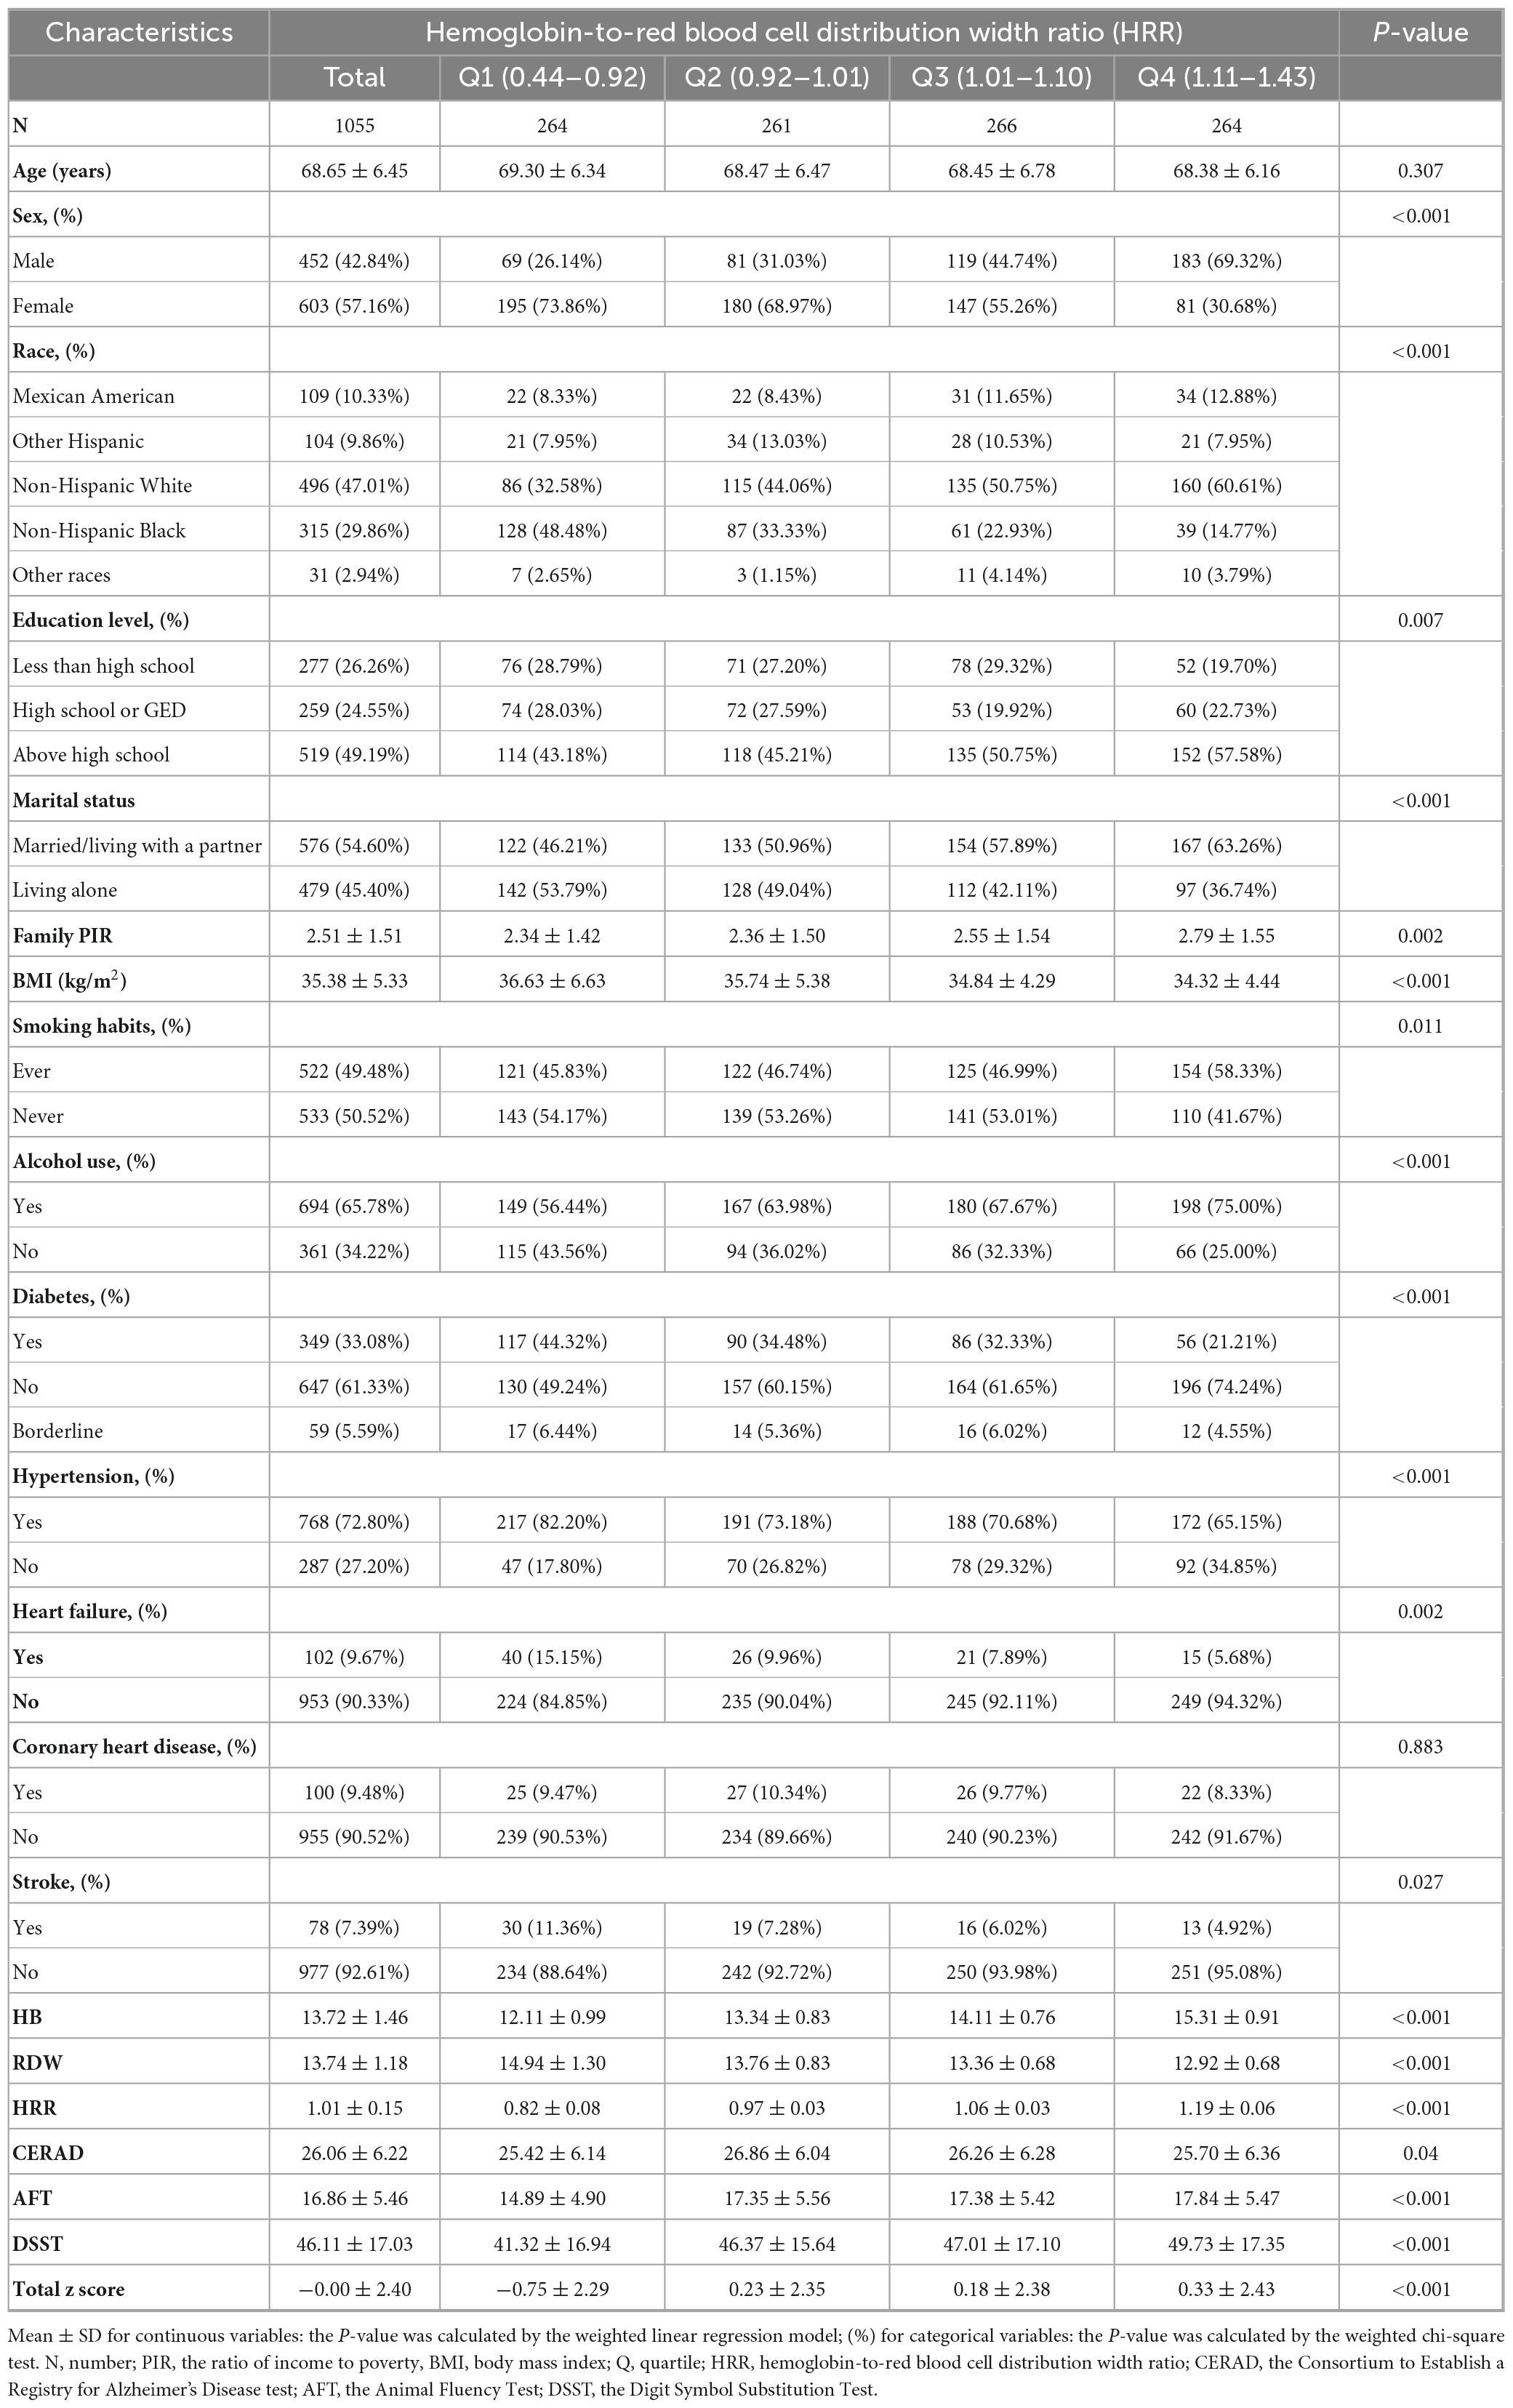
Table 1. Basic characteristics of participants by hemoglobin-to-red blood cell distribution width ratio among the obese population aged ≥60 years.
3.2 Association between HRR and cognitive function
Table 2 and Table 3 collectively illustrate the association between the HRR and cognitive function, including cognitive test scores and low cognitive function, among obese individuals aged ≥60 years across three regression models (Model 1: unadjusted; Model 2: adjusted for age, sex, and race; Model 3: fully adjusted for demographic, lifestyle, and comorbidity factors).

Table 2. Association between HRR and cognitive test scores among the obese population.
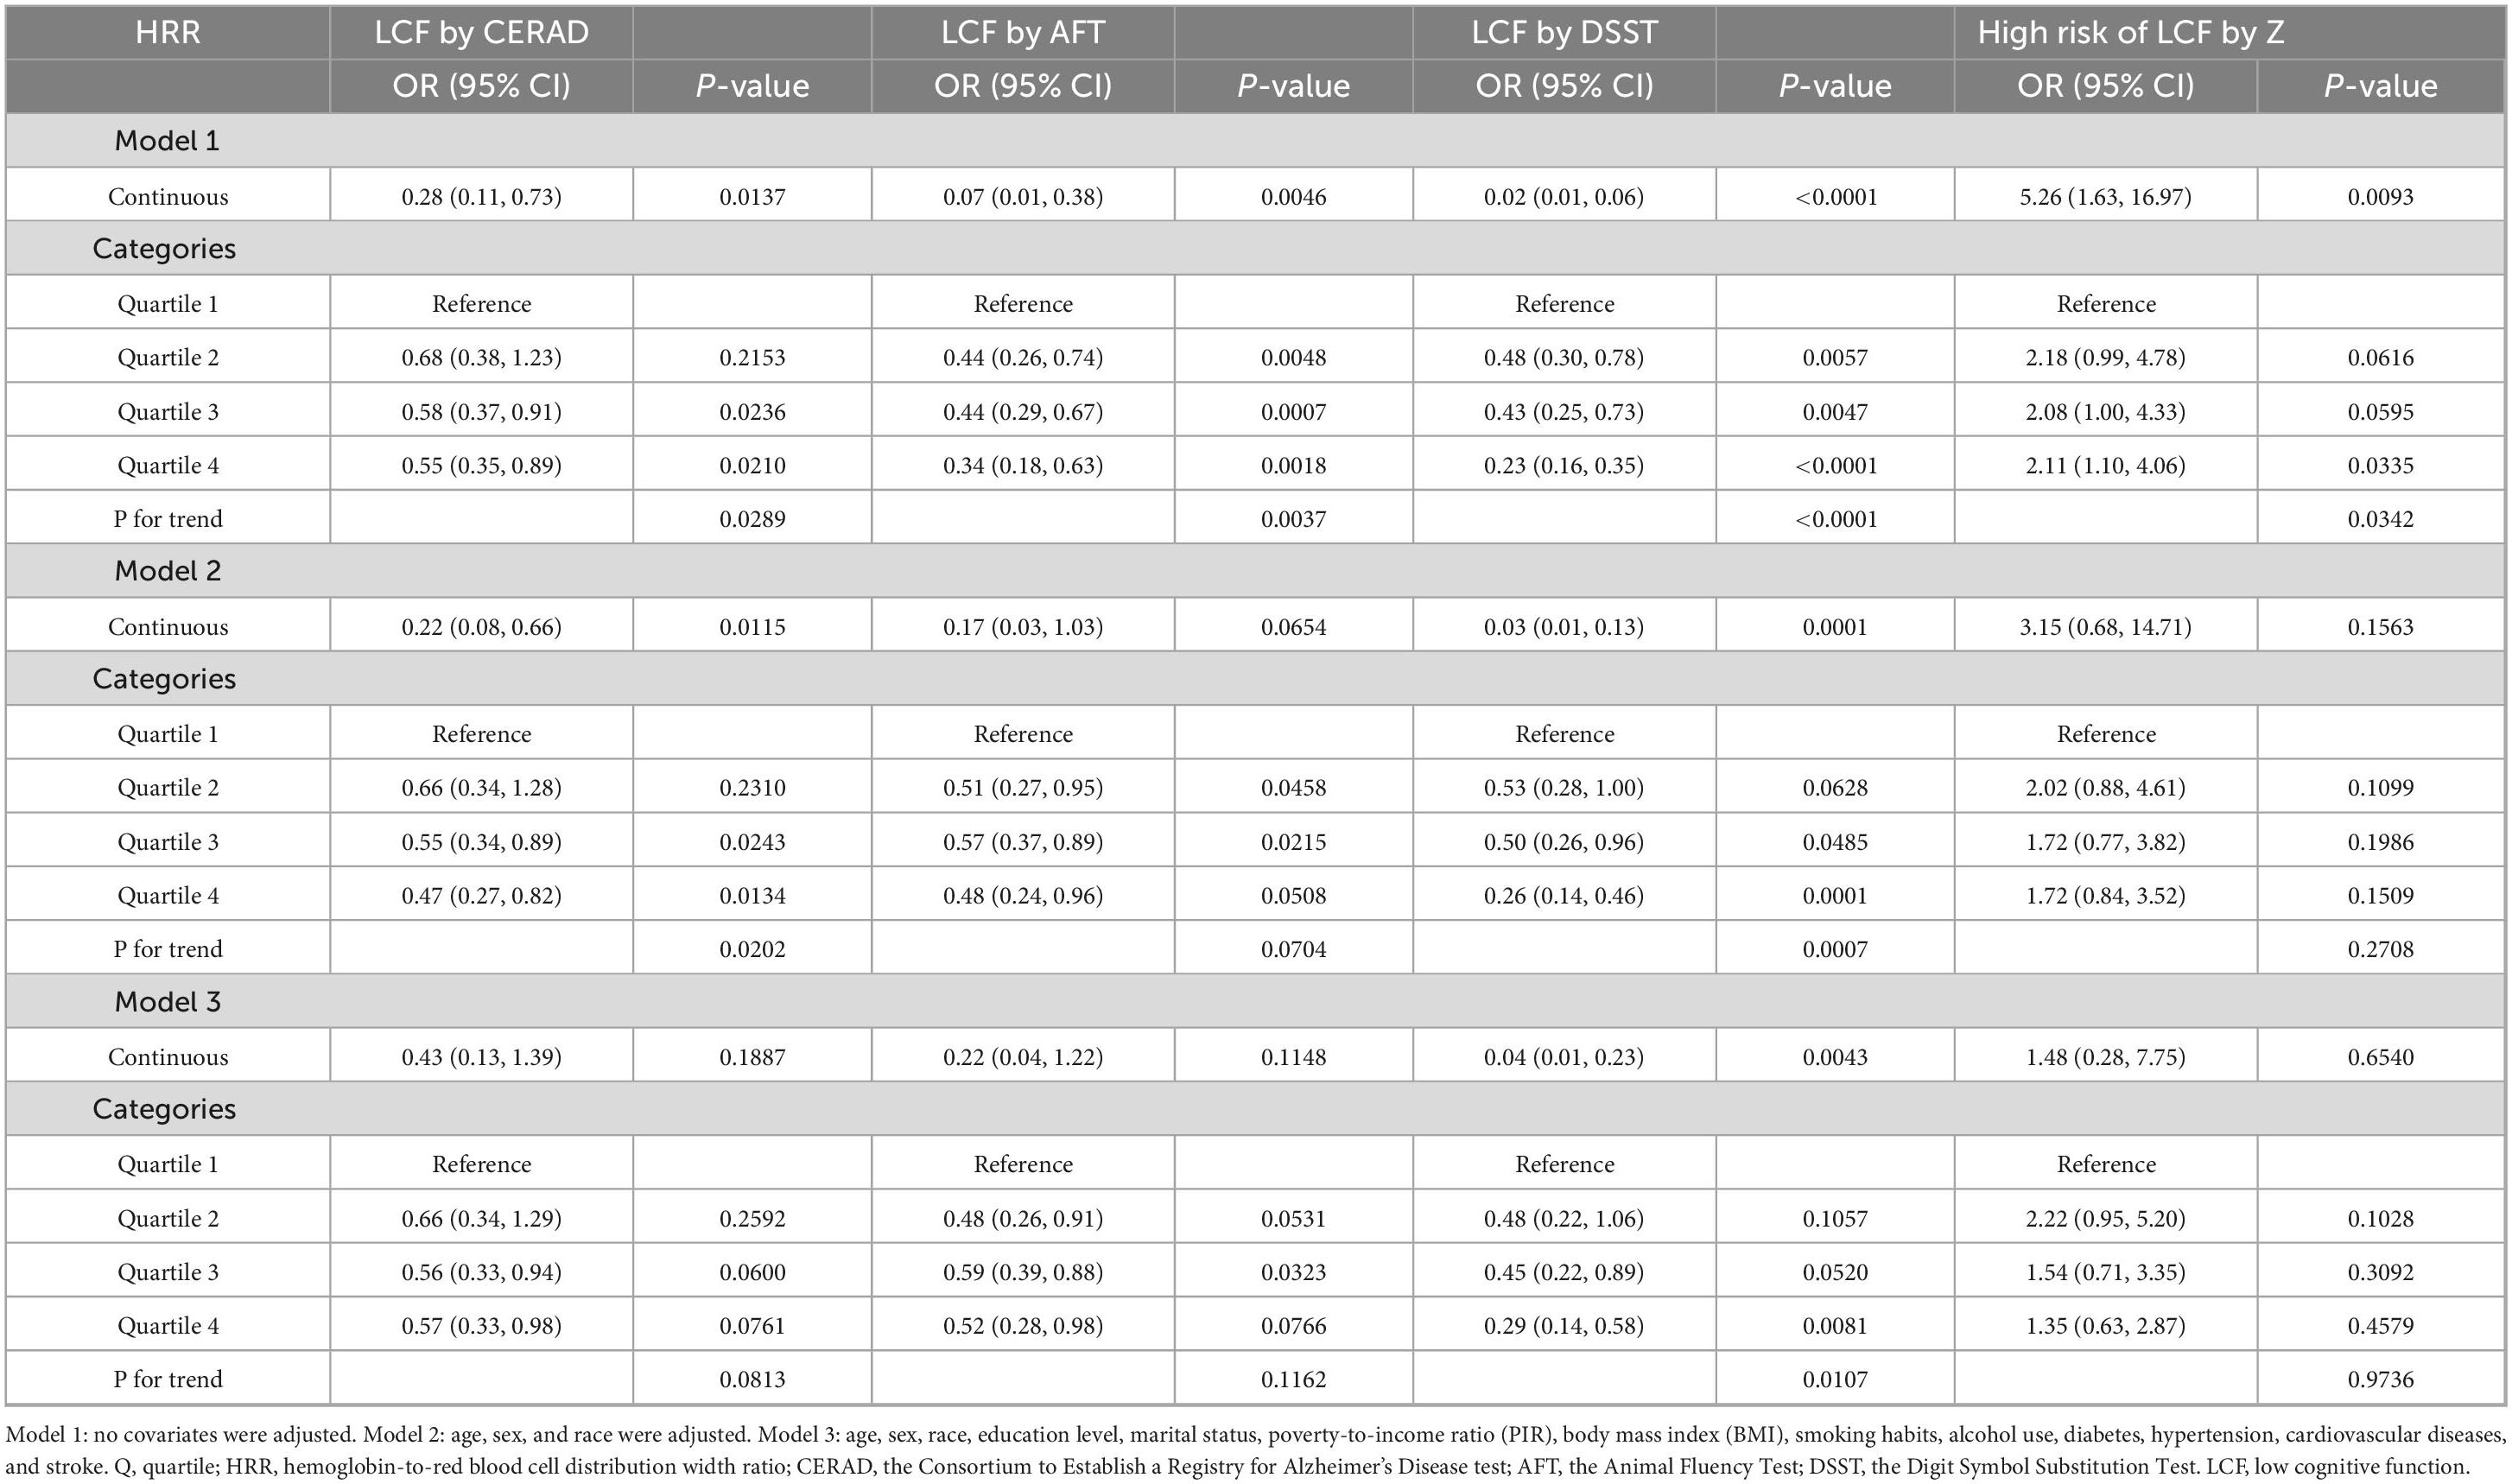
Table 3. Association between HRR and low cognitive function among the obese population.
For the CERAD test, Table 2 showed no significant association between HRR and CERAD scores in any model (all P > 0.05). Consistently, Table 3 revealed that the initial inverse association between HRR and CERAD-defined LCF in Model 1 (continuous HRR: OR = 0.28, 95% CI, 0.11–0.73, P = 0.0137) and Model 2 (continuous HRR: OR = 0.22, 95% CI, 0.08–0.66, P = 0.0115) weakened in Model 3, with no significant correlation (continuous HRR: OR = 0.43, 95% CI, 0.13–1.39, P = 0.1887; P for trend = 0.0813).
Regarding the AFT, Table 2 indicated a significant positive correlation between HRR and AFT scores in Model 1 (continuous HRR: β = 6.85, 95% CI, 3.53–10.17, P = 0.0003), which weakened after adjustment, becoming non-significant in Model 3 (β = 2.21, 95% CI, −0.69 to 5.10, P = 0.1664). Parallelly, Table 3 showed that the initial inverse association between HRR and AFT-defined LCF in Model 1 (continuous HRR: OR = 0.07, 95% CI, 0.01–0.38, P = 0.0046) was attenuated in Model 3, with no significant association (continuous HRR: OR = 0.22, 95% CI, 0.04–1.22, P = 0.1148; P for trend = 0.1162).
For the DSST, both tables demonstrated consistent and robust associations. Table 2 showed a significant positive correlation between HRR and DSST scores in Model 3 (continuous HRR: β = 14.45, 95% CI, 7.55–21.35, P = 0.0021; quartiles 2–4 vs. quartile 1: all P < 0.05; P for trend = 0.0055). Correspondingly, Table 3 revealed a significant inverse association between HRR and DSST-defined LCF in Model 3 (continuous HRR: OR = 0.04, 95% CI, 0.01–0.23, P = 0.0043; quartile 4 vs. quartile 1: OR = 0.29, 95% CI, 0.14–0.58, P = 0.0081; P for trend = 0.0107).
With respect to total cognitive Z-scores, Table 2 found a significant positive association with HRR in Model 3 (continuous HRR: β = 1.53, 95% CI, 0.40–2.67, P = 0.0240; quartiles 2–4 vs. quartile 1: all P < 0.05; P for trend = 0.0215). In contrast, Table 3 showed that the initial positive association between HRR and high risk of LCF by Z in Model 1 (continuous HRR: OR = 5.26, 95% CI, 1.63–16.97, P = 0.0093) was attenuated in Model 3, with no significant correlation (continuous HRR: OR = 1.48, 95% CI, 0.28–7.75, P = 0.6540; P for trend = 0.9736).
Overall, these results indicate that HRR is stably associated with DSST-related cognitive performance in obese population, showing a positive correlation with DSST scores and an inverse correlation with DSST-defined LCF in fully adjusted models, while its associations with CERAD, AFT, and high risk of LCF by total cognitive Z scores are not robust after comprehensive covariate adjustment.
Incidentally, We have conducted an analysis of the association between HRR and cognition in the non-obese (BMI < 30 kg/m2) populations. In Model 3, adjusted for covariates, there was no significant association between HRR and cognition in the non-obese population. Specifically, no significant correlation was found between HRR and CERAD, AFT, DSST, or total Z score. The results were as follows: HRR and CERAD (β = −1.95; 95% CI, −4.46 to 0.55), HRR and AFT (β = 1.16; 95% CI, −0.24 to 2.56), HRR and DSST (β = 3.30; 95% CI, −2.22 to 8.83), HRR and total Z score (β = 0.10; 95% CI, −0.57 to 0.76). Additionally, there was no significant association between HRR and LCF or high-risk groups. The specific results were: HRR and LCF by CERAD (OR = 1.69; 95% CI, 0.62–4.59), HRR and LCF by AFT (OR = 0.83; 95% CI, 0.34–2.03), HRR and LCF by DSST (OR = 0.40; 95% CI, 0.05–3.08), HRR and High Risk by Z (OR = 0.71; 95% CI, 0.22–2.32).
The smooth curve for HRR and CERAD scores showed a turning point at HRR = 0.94 (Figure 2A and Table 4). To the left of this point, HRR was positively correlated with CERAD scores (β = 6.43; 95% CI, 0.79–12.06; P = 0.0256). The smooth curve for HRR and AFT scores showed a turning point at HRR = 1.01 (Figure 2B and Table 4). To the left of this point, HRR was positively correlated with AFT scores (β = 6.11; 95% CI, 2.40–9.82; P = 0.0013). The smooth curve for HRR and DSST scores showed a turning point at HRR = 0.75 (Figure 2C and Table 4). To the right of this point, HRR was positively correlated with DSST scores (β = 13.22; 95% CI, 6.80–19.63; P < 0.0001). HRR showed a linear relationship with total Z-scores (LLR = 0.056) and was positively correlated with total Z-scores (β = 1.16; 95% CI, 0.28–2.05; P = 0.0101) (Figure 2D and Table 4). For low cognitive function: HRR did not show relationship with LCF by CERAD (Figure 2E and Table 4). HRR showed a linear relationship with LCF by AFT (LLR = 0.5), and in the LCF by AFT group, HRR was negatively correlated with the occurrence of low cognitive function (OR = 0.18; 95% CI, 0.06–0.57; P = 0.0035) (Figure 2F and Table 5). HRR showed a linear relationship with LCF by DSST (LLR = 0.324), and in the LCF by DSST group, HRR was negatively correlated with the occurrence of low cognitive function (OR = 0.17; 95% CI, 0.05–0.67; P = 0.0109) (Figure 2G and Table 5). In the High Risk of LCF by Z group, the smooth curve showed a positive correlation between HRR and high-risk low cognitive function, with a turning point at HRR = 0.94 (OR = 55.53; 95% CI, 1.47–2097.52; P = 0.0302) (Figure 2H and Table 5).

Figure 2. The non-linear associations between HRR and cognitive function. The solid red line represents the smooth curve fit between variables. Blue bands represent the 95% of confidence interval from the fit. (A) HRR and CERAD score; (B) HRR and AFT score; (C) HRR and DSST score; (D) HRR and total Z score; (E) HRR and LCF by CERAD; (F) HRR and LCF by AFT; (G) HRR and LCF by DSST; (H) HRR and High Risk of LCF by Z.
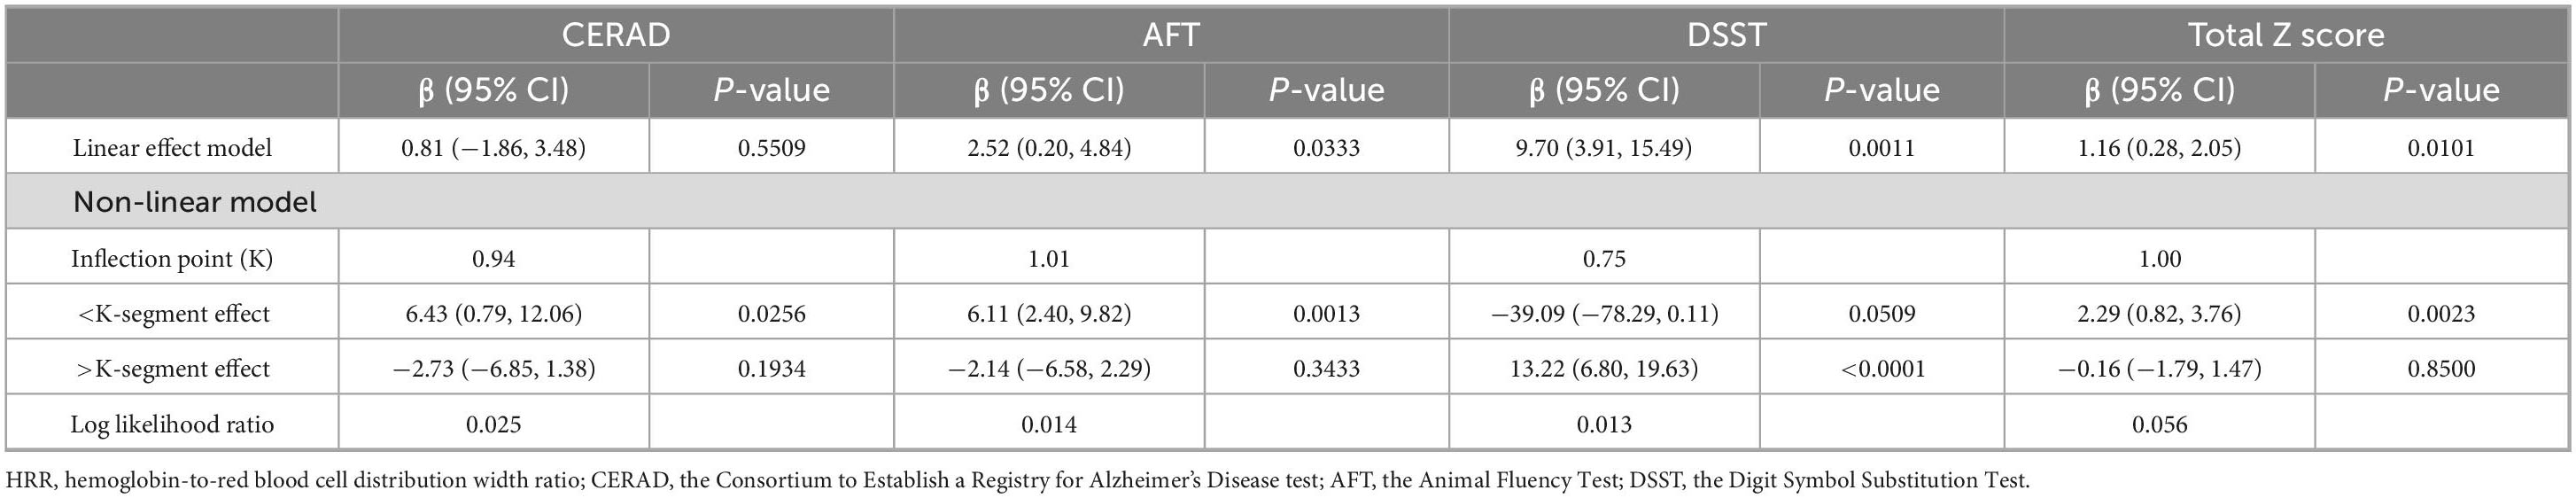
Table 4. Threshold effect analysis of HRR on cognitive test scores using a two-segment linear regression model among the obese population.
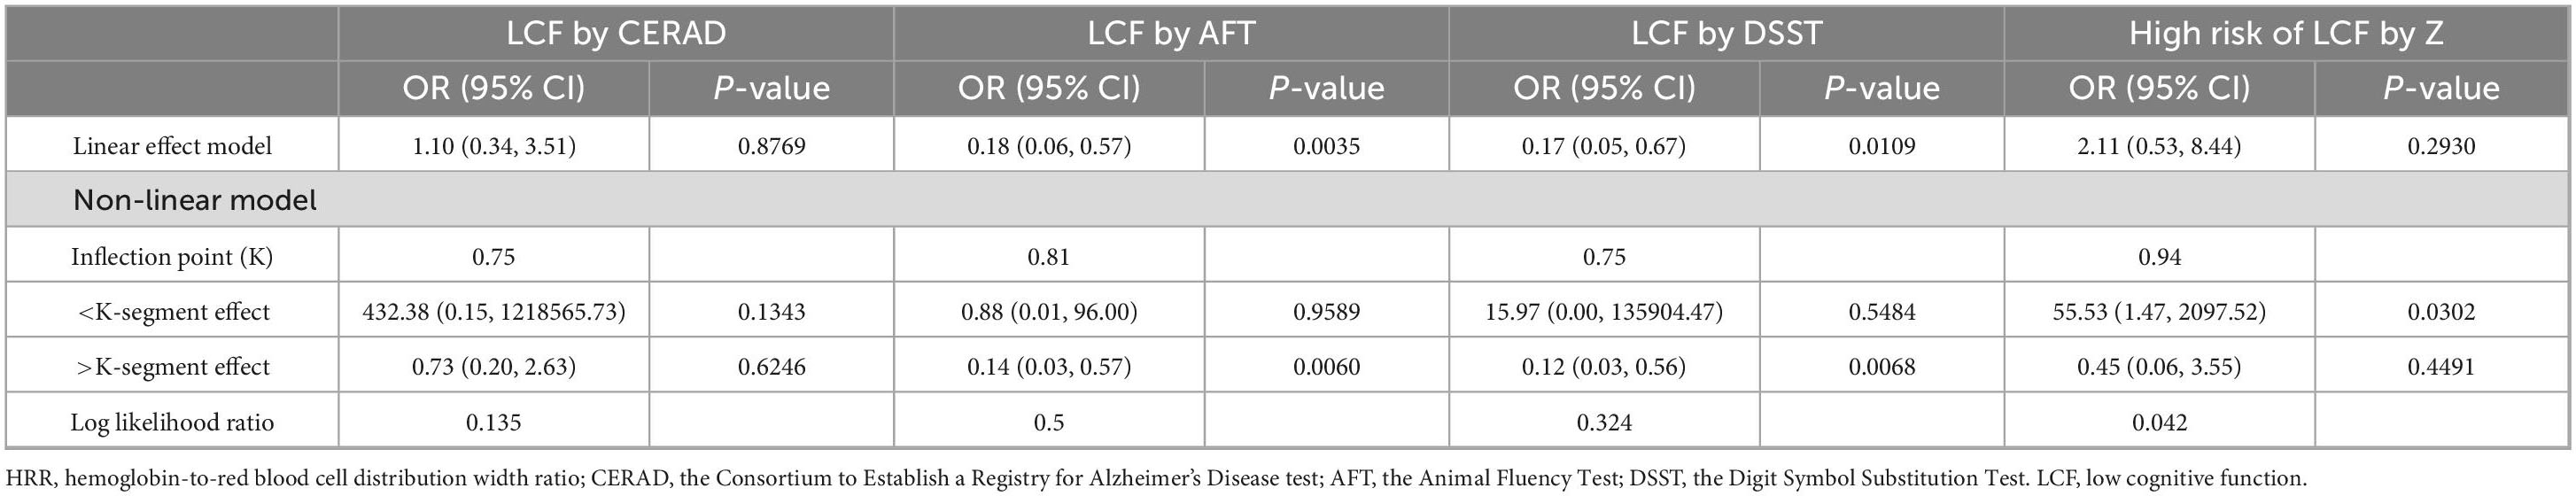
Table 5. Threshold effect analysis of HRR on low cognitive function using a two-segment linear regression model among the obese population.
3.3 Subgroup analyses
To further assess the effect of HRR in the obese population on cognitive test scores and low cognitive function, stratified analyses were performed based on age, sex, education level, smoking, alcohol consumption, family poverty-to-income ratio, diabetes, and cardiovascular diseases as covariates. The obese population consisted of 1,055 participants (452 men and 603 women), including 617 individuals aged <70 years and 438 aged ≥70 years. In terms of education level, 277 had less than high school education, 259 had high school or GED, and 519 had more than high school education. Regarding family poverty-to-income ratio, 176 had a ratio ≤1, and 879 had a ratio >1. Among them, 576 were married or living with parents, while 479 lived alone; additionally, 522 had a history of smoking, 533 had never smoked, 694 had a history of alcohol consumption, and 361 had no alcohol consumption. The population included 349 with diabetes, 647 without diabetes, and 59 with borderline glucose tolerance; 768 had hypertension, 287 did not; 102 had heart failure, 953 did not; 100 had coronary heart disease, 955 did not; and 78 had a history of stroke, 977 did not. In the stroke subgroup, HRR showed a stronger correlation with CERAD scores (P = 0.0119) (Figure 3A), AFT scores (P = 0.0108) (Figure 3B), and total Z-scores (P = 0.0033) (Figure 3D). In the high-education group, HRR was more strongly correlated with DSST scores (P = 0.0205) (Figure 3C).
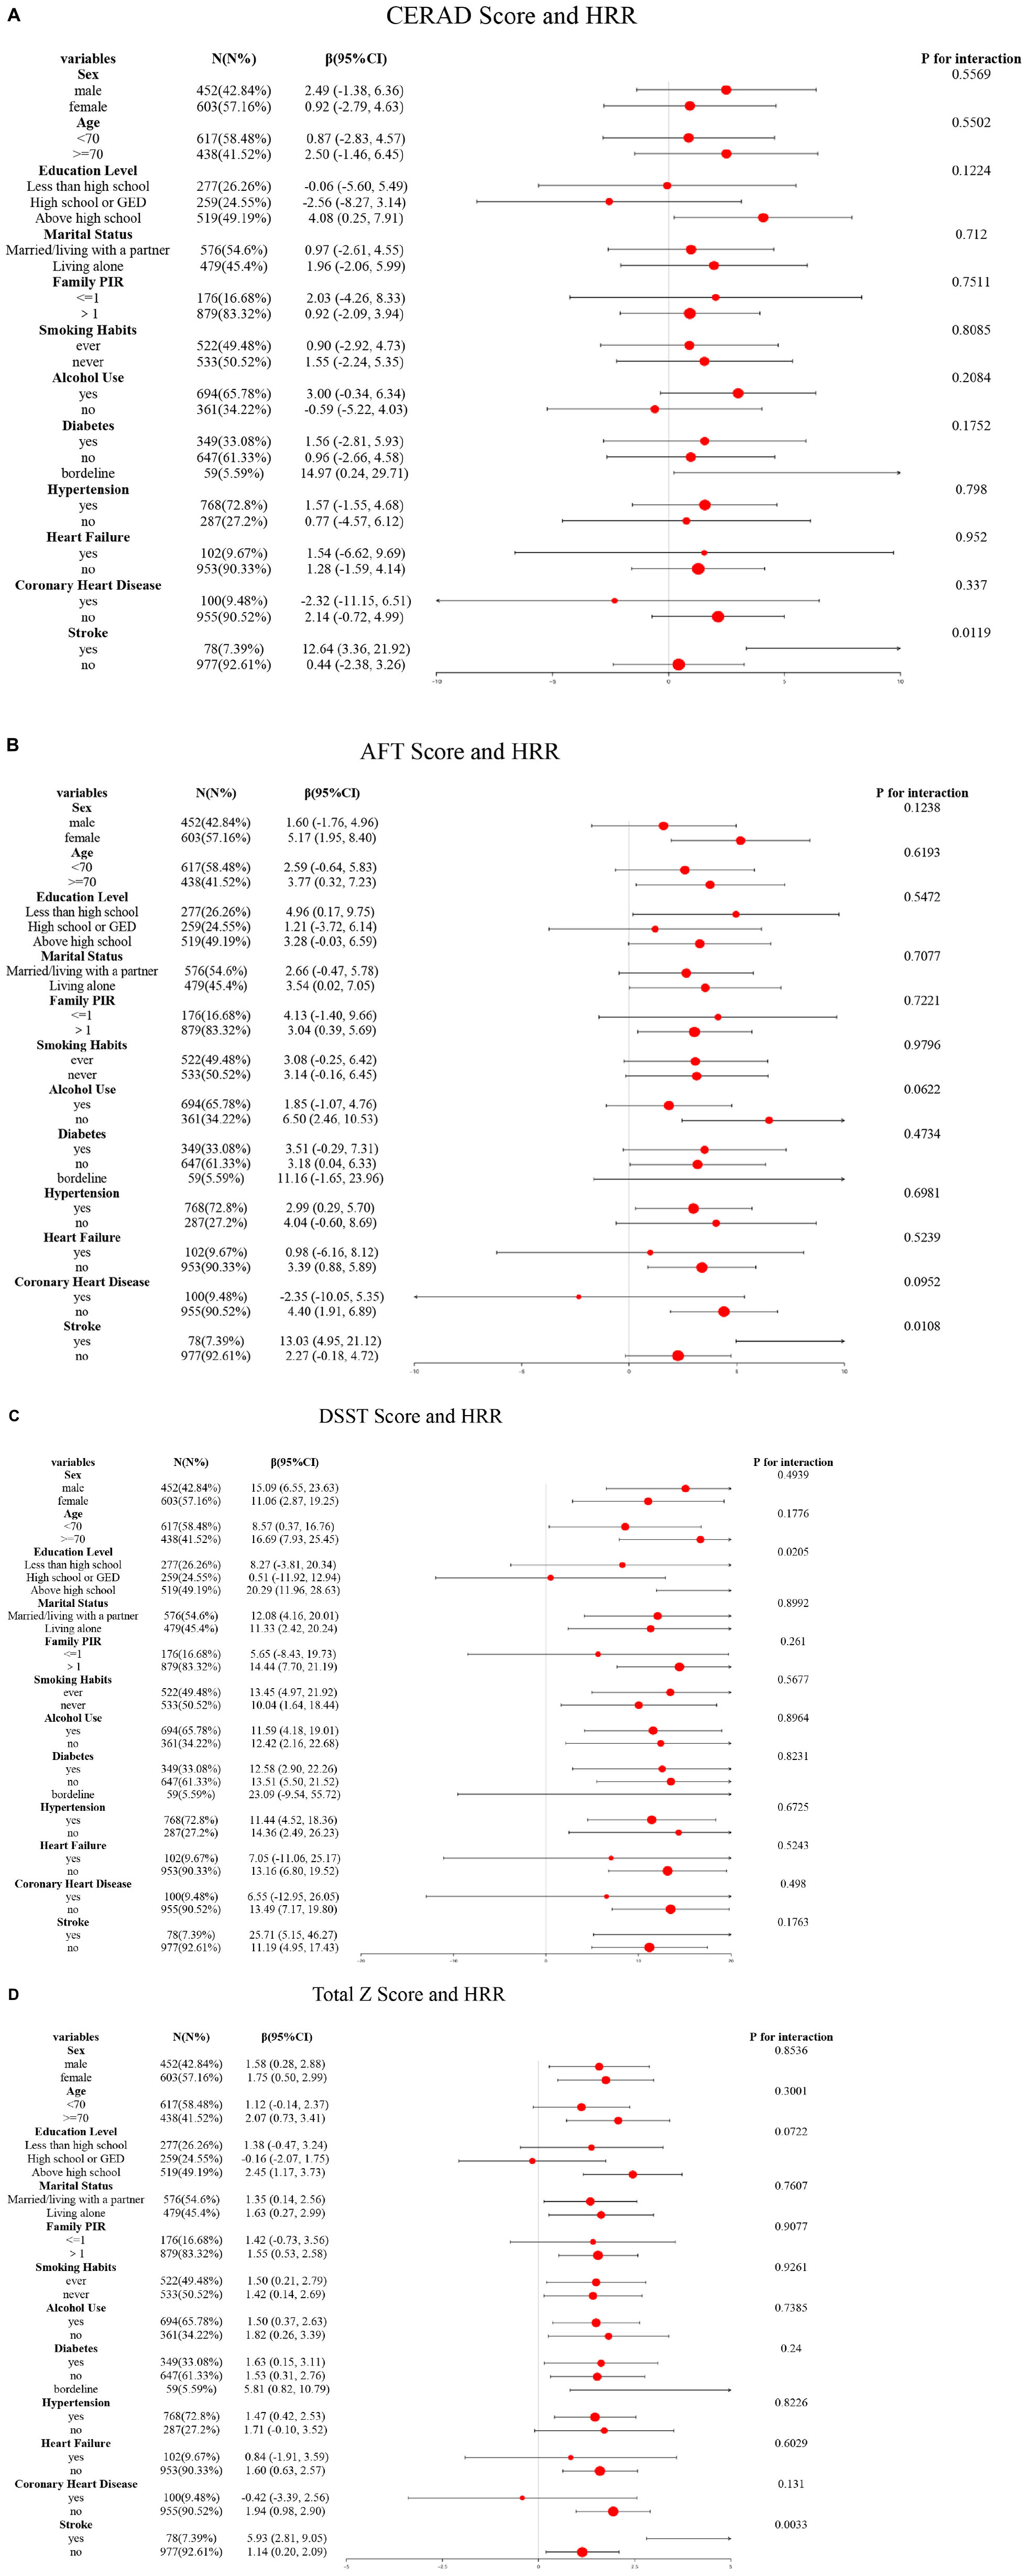
Figure 3. Subgroup logistic regression analysis for the association between HRR and cognitive scores. (A) HRR and CERAD score; (B) HRR and AFT score; (C) HRR and DSST score; (D) HRR and total Z score.
4 Discussion
The study results show that in obese individuals, higher HRR is associated with better DSST performance and reduced likelihood of scoring below the cognitive impairment threshold. The results of the study suggest that HRR may have a positive effect on certain cognitive functions, particularly in areas like reaction time, attention, and working memory. This highlights the potential of HRR as a biomarker for cognitive function and a tool for identifying individuals at risk for cognitive decline.
With the increase of age, obvious declines occur in multiple specific cognitive domains: processing speed continues to decline, affecting the performance of language fluency and other aspects; complex attention tasks such as selective attention and divided attention decline significantly, and working memory is affected by the slowdown of information processing; episodic memory and semantic memory decline; visual naming and verbal fluency decrease; visual construction ability reduces; abilities such as concept formation, abstract reasoning, mental flexibility and response inhibition in executive function decline (31, 32). The neurochemical properties and anatomical structure of the brain exhibit cumulative changes with age, with a significant decline in dopaminergic neuromodulation (32). The volume of gray and white matter gradually decreases, and the atrophy of polymodal cortical regions is particularly prominent, while the atrophy process of the hippocampus is accelerated by vascular factors (32). There are individual differences in the senescent changes of brain structure, especially the significant differences in the degree of age-related contraction in regions such as the lateral prefrontal cortex, prefrontal white matter, and hippocampus (32).
This study found that the protective effect of HRR on cognitive function was more pronounced in individuals with higher educational attainment, a result that can be theoretically explained by the mediating mechanism of cognitive reserve (33). In studies by Clare et al., educational level has been explicitly identified as a core component of cognitive reserve (33). Cognitive reserve buffers the impact of neuropathological changes on cognitive function by optimizing brain network recruitment strategies or activating alternative cognitive pathways (34). Higher educational attainment is often associated with greater cognitive reserve, which amplifies the protective effects of physiological processes reflected by HRR–such as oxygen supply status and inflammation–on cognition through enhancing neurovascular coupling efficiency or metabolic compensatory capacity (35).
In our study, a positive association between higher HRR and better cognitive performance was observed in obese individuals, but no such relationship was found in non-obese counterparts. This discrepancy may be attributed to the role of obesity in cognitive decline. Obesity is closely linked to various chronic diseases, and its negative impact on the brain is increasingly gaining attention (36). Obesity affects brain function and leads to cognitive decline through mechanisms such as neuroinflammation, oxidative stress, and alterations in the gut-brain axis (9, 36, 37). Anfal Al-Dalaeen et al. pointed out that neuroinflammation, oxidative stress, and reduced local blood flow induced by obesity jointly affect the brain (36). These factors disrupt the metabolic functions of the hypothalamus and the hippocampus, ultimately leading to cognitive impairment (36, 38). Alyson A. Miller et al. further emphasized that systemic inflammation and increased free fatty acids caused by obesity can lead to local inflammation in the hypothalamus, which then affects cognitive-related brain regions, such as the hippocampus and amygdala, thereby exacerbating cognitive decline (38, 39). Sarah-Jane Leigh et al. reviewed the relationship between obesity, high-fat diets, and cognitive impairment, finding that changes in the gut microbiome, systemic and central nervous system inflammation, and alterations in the blood-brain barrier are key mechanisms in this process (10, 37).
In our study, Model 3–adjusted for multiple covariates–still showed that higher HRR was positively associated with better cognitive performance, including higher DSST scores and reduced low cognitive function assessed by DSST, suggesting HRR could act as a biomarker for cognitive function in obese individuals. An increasing number of studies have shown a significant association between hemoglobin levels and cognitive function (40–44). Low hemoglobin levels have been identified as a potential risk factor for cognitive decline (42–48). Yi-Xuan Qiang et al. revealed that anemia is connected to a risk increase of more than 50% for all-cause dementia, with brain structure changes being a potential contributing factor that affects cognitive abilities (49). Laura M. Winchester et al. pointed out that lower hemoglobin levels were significantly associated with cognitive decline, particularly in the domains of reaction time and reasoning abilities (48). Andrea L. C. Schneider et al. also found that lower hemoglobin levels were negatively correlated with cognitive domains such as processing speed, attention, and working memory, as assessed by the DSST (16). In patients suffering from stroke, lower hemoglobin levels have been correlated with a higher likelihood of post-stroke cognitive impairment (50). Some studies have also found that higher hemoglobin levels in stroke patients are positively correlated with the maintenance of cognitive function (51). However, Raj C. Shah et al. highlighted that both very low and very high hemoglobin levels were associated with lower cognitive function, particularly in areas such as semantic memory and perceptual speed (52, 53). This suggests that hemoglobin may have a bidirectional effect on cognitive function. Despite these findings, some studies have not found a direct relationship between hemoglobin levels and cognitive function (16, 54, 55). Beydoun et al. found that in individuals with anemia, no significant association was observed between RDW and cognitive performance (54). By contrast, in non-anemic populations, the association between RDW and cognition was more consistent (54). This lack of association with anemia may be attributed to the elevated RDW in anemic individuals within the sample, which potentially masked the independent effect of hemoglobin (54). Chen et al.’s study recruited healthy old men from Taiwan, China, and used the Cognitive Abilities Screening Instrument Chinese version and the Wechsler Digit Span Task test for cognitive assessment (55). The study’s conclusions indicated that the association between hemoglobin levels and cognitive function was influenced by differences in study populations and cognitive assessment methods (55). Schneider et al. found in their study on different hemoglobin concentrations that the sample size of individuals with high hemoglobin was relatively small (21 men and 56 women), a limitation that compromised the statistical power of analyses examining associations between this group and cognitive function (16). In the prospective follow-up with a mean duration of 6 years, the study further revealed no significant associations between overall anemia or its subtypes and declines in cognitive function (16). This result may be attributed to multiple factors: the relatively young baseline age of the study participants (mean age 57 years), the relatively short follow-up period, and the presence of attrition bias–those who were lost to follow-up were predominantly older individuals with lower educational attainment and multiple vascular risk factors (16).
The influence of hemoglobin on cognitive function may be related to several mechanisms, such as chronic hypoxia, β-amyloid deposition, and neuroinflammation (52, 56). When hemoglobin levels are too low, cerebral blood flow cannot meet the oxygen demands, leading to impaired brain cell function and exacerbating cognitive decline (16, 17). Additionally, a reduction in erythropoietin receptor expression may worsen neural damage, further increasing the risk of cognitive decline (52). Different types of anemia may affect brain function through different mechanisms. For example, iron-deficiency anemia may impair cognitive function by interfering with key enzymes in brain cell metabolism (57), while vitamin B12 and folate deficiencies may exacerbate cognitive impairment by affecting the metabolism of homocysteine and acetylcholine (58).
As a core component of HRR, RDW serves as an indicator of red blood cell volume heterogeneity (18). Studies have demonstrated that RDW is associated with inflammation, oxidative stress, and other factors, which play critical roles in cognitive decline (18, 19). Elevated RDW has been associated with various health conditions, and studies suggest it may also serve as a marker for cognitive dysfunction (54, 59, 60). Yi-Xuan Qiang et al. identified a link between RDW levels and the risk of developing Alzheimer’s disease, suggesting that RDW could serve as a valuable biomarker for monitoring cognitive decline (49). Laura M. Winchester et al. found that lower RDW was associated with poorer language reasoning and memory abilities (48). Kyoung Min Kim et al. pointed out that individuals with higher RDW had worse cognitive function and slower gait (61).
The relationship between increased RDW and cognitive decline may be closely related to inflammatory responses (60). Chronic inflammation is one of the key mechanisms of cognitive decline. Systemic inflammation triggers amyloid deposition, activates microglia and astrocytes in the central nervous system, leading to neuroinflammation that damages neuronal structure and function, ultimately affecting cognitive function (62). Yuan Fang et al. found that peripheral inflammation, by disrupting the blood-brain barrier, activates inflammatory responses in the nervous system, further exacerbating cognitive impairment (59, 63).
In summary, an increase in HRR reflects the body’s ability to resist factors such as systemic inflammation and oxidative stress. These mechanisms, acting together, contribute to the protection of cognitive function.
5 Strengths and limitations
This study provides evidence of HRR as a potential biomarker for cognitive health in obese populations. However, due to the cross-sectional design, longitudinal clinical trials are needed to further clarify the causal relationship. While multi-ethnic groups were included, Southeast Asian and other Asian populations were underrepresented. Using BMI to classify obesity has inherent limitations: it relies solely on height and weight, failing to distinguish muscle from fat, and cannot reflect true fat distribution in metabolically obese but normal weight individuals. BMI obesity thresholds also vary by ethnicity. Moreover, the failure to comprehensively assess obesity by integrating multi-dimensional indicators such as body fat percentage, waist circumference, and visceral fat area weakens the accuracy and generalizability of the research conclusions (64, 65).
6 Conclusion
This study suggest that HRR may serve as a potential biomarker for reflecting cognitive function status: individuals with higher HRR levels demonstrated better performance in cognitive assessments. This discovery indicates that maintaining a higher HRR could be a potential intervention strategy for protecting the cognitive abilities of obese populations. However, this conclusion still requires further validation through longitudinal studies with larger sample sizes, multicenter clinical trials, and exploration of action mechanisms to clarify the clinical application value of HRR as a target for cognitive protection.
Data availability statement
The raw data supporting the conclusions of this article will be made available by the authors, without undue reservation.
Ethics statement
The studies involving humans were conducted in accordance with the Declaration of Helsinki and were approved by the NCHS Ethics Review Board. The patients/participants provided their written informed consent to participate in this study.
Author contributions
RX: Investigation, Writing – original draft, Data curation, Software, Methodology, Writing – review & editing. ZW: Writing – original draft. ZL: Writing – original draft, Writing – review & editing.
Funding
The author(s) declare that no financial support was received for the research and/or publication of this article.
Acknowledgments
We would like to thank all participants in this study.
Conflict of interest
The authors declare that the research was conducted in the absence of any commercial or financial relationships that could be construed as a potential conflict of interest.
Generative AI statement
The author(s) declare that no Generative AI was used in the creation of this manuscript.
Any alternative text (alt text) provided alongside figures in this article has been generated by Frontiers with the support of artificial intelligence and reasonable efforts have been made to ensure accuracy, including review by the authors wherever possible. If you identify any issues, please contact us.
Publisher’s note
All claims expressed in this article are solely those of the authors and do not necessarily represent those of their affiliated organizations, or those of the publisher, the editors and the reviewers. Any product that may be evaluated in this article, or claim that may be made by its manufacturer, is not guaranteed or endorsed by the publisher.
Abbreviations
Hb, hemoglobin; RDW, red blood cell distribution width; HRR, hemoglobin-to-red blood cell distribution width ratio; NHANES, National Health and Nutrition Examination Survey; CERAD, Consortium to Establish a Registry for Alzheimer’s Disease; AFT, Animal Fluency Test; DSST, Digit Symbol Substitution Test; LCF, low cognitive function; BMI, body mass index; PIR, poverty-to-income ratio.
References
1. Langa KM, Levine DA. The diagnosis and management of mild cognitive impairment: a clinical review. JAMA. (2014) 312:2551–61. doi: 10.1001/jama.2014.13806
2. Huang Z, Jordan JD, Zhang Q. Early life adversity as a risk factor for cognitive impairment and Alzheimer’s disease. Transl Neurodegener. (2023) 12:25. doi: 10.1186/s40035-023-00355-z
3. Kivipelto M, Mangialasche F, Snyder HM, Allegri R, Andrieu S, Arai H, et al. World-Wide FINGERS Network: a global approach to risk reduction and prevention of dementia. Alzheimers Dement. (2020) 16:1078–94. doi: 10.1002/alz.12123
4. Rajan KB, Weuve J, Barnes LL, McAninch EA, Wilson RS, Evans DA. Population estimate of people with clinical Alzheimer’s disease and mild cognitive impairment in the United States (2020-2060). Alzheimers Dement. (2021) 17:1966–75. doi: 10.1002/alz.12362
5. Mukadam N, Anderson R, Walsh S, Wittenberg R, Knapp M, Brayne C, et al. Benefits of population-level interventions for dementia risk factors: an economic modelling study for England. Lancet Healthy Longev. (2024) 5:100611. doi: 10.1016/S2666-7568(24)00117-X
6. Silva MVF, Loures C, de MG, Alves LCV, de Souza LC, Borges KBG, et al. Alzheimer’s disease: risk factors and potentially protective measures. J Biomed Sci. (2019) 26:33. doi: 10.1186/s12929-019-0524-y
7. Rost NS, Brodtmann A, Pase MP, van Veluw SJ, Biffi A, Duering M, et al. Post-Stroke Cognitive Impairment and Dementia. Circ Res. (2022) 130:1252–71. doi: 10.1161/CIRCRESAHA.122.319951
8. Morrison CD, Pistell PJ, Ingram DK, Johnson WD, Liu Y, Fernandez-Kim SO, et al. High fat diet increases hippocampal oxidative stress and cognitive impairment in aged mice: implications for decreased Nrf2 signaling. J Neurochem. (2010) 114:1581–9. doi: 10.1111/j.1471-4159.2010.06865.x
9. Tarantini S, Valcarcel-Ares MN, Yabluchanskiy A, Tucsek Z, Hertelendy P, Kiss T, et al. Nrf2 deficiency exacerbates obesity-induced oxidative stress, neurovascular dysfunction, blood-brain barrier disruption, neuroinflammation, amyloidogenic gene expression, and cognitive decline in mice, mimicking the aging phenotype. J Gerontol A Biol Sci Med Sci. (2018) 73:853–63. doi: 10.1093/gerona/glx177
10. Anita NZ, Zebarth J, Chan B, Wu C-Y, Syed T, Shahrul D, et al. Inflammatory markers in type 2 diabetes with vs. without cognitive impairment; a systematic review and meta-analysis. Brain Behav Immun. (2022) 100:55–69. doi: 10.1016/j.bbi.2021.11.005
11. Zanchi D, Depoorter A, Egloff L, Haller S, Mählmann L, Lang UE, et al. The impact of gut hormones on the neural circuit of appetite and satiety: a systematic review. Neurosci Biobehav Rev. (2017) 80:457–75. doi: 10.1016/j.neubiorev.2017.06.013
12. Arnold SE, Lucki I, Brookshire BR, Carlson GC, Browne CA, Kazi H, et al. High fat diet produces brain insulin resistance, synaptodendritic abnormalities and altered behavior in mice. Neurobiol Dis. (2014) 67:79–87. doi: 10.1016/j.nbd.2014.03.011
13. Lee Y-H, Hsu H-C, Kao P-C, Shiao Y-J, Yeh SH-H, Shie F-S, et al. Augmented insulin and leptin resistance of high fat diet-fed APPswe/PS1dE9 transgenic mice exacerbate obesity and glycemic dysregulation. Int J Mol Sci. (2018) 19:2333. doi: 10.3390/ijms19082333
14. Amen DG, Wu J, George N, Newberg A. Patterns of regional cerebral blood flow as a function of obesity in adults. J Alzheimers Dis. (2020) 77:1331–7. doi: 10.3233/JAD-200655
15. Kullmann S, Callaghan MF, Heni M, Weiskopf N, Scheffler K, Häring H-U, et al. Specific white matter tissue microstructure changes associated with obesity. Neuroimage. (2016) 125:36–44. doi: 10.1016/j.neuroimage.2015.10.006
16. Schneider ALC, Jonassaint C, Sharrett AR, Mosley TH, Astor BC, Selvin E, et al. Hemoglobin, anemia, and cognitive function: the atherosclerosis risk in communities study. J Gerontol A Biol Sci Med Sci. (2016) 71:772–9. doi: 10.1093/gerona/glv158
17. Zhang X, Le W. Pathological role of hypoxia in Alzheimer’s disease. Exp Neurol. (2010) 223:299–303. doi: 10.1016/j.expneurol.2009.07.033
18. Salvagno GL, Sanchis-Gomar F, Picanza A, Lippi G. Red blood cell distribution width: a simple parameter with multiple clinical applications. Crit Rev Clin Lab Sci. (2015) 52:86–105. doi: 10.3109/10408363.2014.992064
19. Yu B, Li M, Yu Z, Zhang H, Feng X, Gao A, et al. Red blood cell distribution width to albumin ratio (RAR) is associated with low cognitive performance in American older adults: NHANES 2011-2014. BMC Geriatr. (2025) 25:157. doi: 10.1186/s12877-025-05800-4
20. Xi L, Fang F, Zhou J, Xu P, Zhang Y, Zhu P, et al. Association of hemoglobin-to-red blood cell distribution width ratio and depression in older adults: a cross sectional study. J Affect Disord. (2024) 344:191–7. doi: 10.1016/j.jad.2023.10.027
21. Wang X-D, Li C, Hu J, Cao F, Zhu L, Zhu Y, et al. Hemoglobin-to-red blood cell distribution width ratio as a protective factor against coronary artery disease: a cross-sectional analysis of NHANES (2011-2018). Front Pharmacol. (2025) 16:1534479. doi: 10.3389/fphar.2025.1534479
22. Xiong Y, Xie S, Yao Y, Chen Y, Ding J, Zhou R, et al. Hemoglobin-to-red blood cell distribution width ratio is negatively associated with stroke: a cross-sectional study from NHANES. Sci Rep. (2024) 14:28098. doi: 10.1038/s41598-024-79520-x
23. Xiao Y, Pan H, Huang R, Wu P, Peng C, Luo J, et al. Association of hemoglobin-to-red blood cell distribution width ratio and bone mineral density in older adults. BMC Musculoskelet Disord. (2024) 25:866. doi: 10.1186/s12891-024-07984-z
24. Yılmaz H, Yılmaz A, Demirağ G. Prognostic significance of hemoglobin-to-red cell distribution width ratio in patients with metastatic renal cancer. Future Oncol. (2021) 17:3853–64. doi: 10.2217/fon-2021-0040
25. Centers for Disease Control and Prevention. NHANES Questionnaires, Datasets, and Related Documentation. Atlanta, GA: Centers for Disease Control and Prevention (2024).
26. Centers for Disease Control and Prevention. NCHS Ethics Review Board Approval. Atlanta, GA: Centers for Disease Control and Prevention (2023).
27. Tan Z, Nie Y, Yan N. Association between the geriatric nutritional risk index and cognitive functions in older adults: a cross-sectional study from National Health and Nutrition Examination Survey. Front Nutr. (2024) 11:1459638. doi: 10.3389/fnut.2024.1459638
28. Fan D, Wang T, Xiang J, Bai Y, Zhang L, Wang X. Neutrophil percentage-to-albumin ratio is associated with cognitive function in adults aged over 60 years: an analysis of data from the NHANES 2011-2014. J Alzheimers Dis. (2024) 102:150–61. doi: 10.1177/13872877241283849
29. Chen Y, Ding Y, Jin S, Zhang Y. Association between a body shape index and cognitive impairment among US older adults aged 40 years and above from a cross-sectional survey of the NHANES 2011-2014. Front Endocrinol. (2024) 15:1411701. doi: 10.3389/fendo.2024.1411701
30. Li W, Li S, Shang Y, Zhuang W, Yan G, Chen Z, et al. Associations between dietary and blood inflammatory indices and their effects on cognitive function in elderly Americans. Front Neurosci. (2023) 17:1117056. doi: 10.3389/fnins.2023.1117056
31. Harada CN, Natelson Love MC, Triebel KL. Normal cognitive aging. Clin Geriatr Med. (2013) 29:737–52. doi: 10.1016/j.cger.2013.07.002
32. Lindenberger U. Human cognitive aging: corriger la fortune? Science. (2014) 346:572–8. doi: 10.1126/science.1254403
33. Clare L, Wu Y-T, Teale JC, MacLeod C, Matthews F, Brayne C, et al. Potentially modifiable lifestyle factors, cognitive reserve, and cognitive function in later life: a cross-sectional study. PLoS Med. (2017) 14:e1002259. doi: 10.1371/journal.pmed.1002259
34. Richards M, Deary IJ. A life course approach to cognitive reserve: a model for cognitive aging and development? Ann Neurol. (2005) 58:617–22. doi: 10.1002/ana.20637
35. Ishikawa M, Kobari T, Ishikawa T, Kusaka G. Clinical neurovascular coupling through cerebrovascular reserve and cognitive function. J Neural Transm. (2025) 132:867–76. doi: 10.1007/s00702-025-02905-3
36. Al-Dalaeen A, Al-Domi H. Does obesity put your brain at risk? Diabetes Metab Syndr. (2022) 16:102444. doi: 10.1016/j.dsx.2022.102444
37. Leigh S-J, Morris MJ. Diet, inflammation and the gut microbiome: mechanisms for obesity-associated cognitive impairment. Biochim Biophys Acta Mol Basis Dis. (2020) 1866:165767. doi: 10.1016/j.bbadis.2020.165767
38. Miller AA, Spencer SJ. Obesity and neuroinflammation: a pathway to cognitive impairment. Brain Behav Immun. (2014) 42:10–21. doi: 10.1016/j.bbi.2014.04.001
39. Anita NZ, Kwan F, Ryoo SW, Major-Orfao C, Lin WZ, Noor S, et al. Cytochrome P450-soluble epoxide hydrolase derived linoleic acid oxylipins and cognitive performance in type 2 diabetes. J Lipid Res. (2023) 64:100395. doi: 10.1016/j.jlr.2023.100395
40. Jiang Z, Han, Xiaolei, Wang Y, Hou T, Cong L, et al. Red cell distribution width and dementia among rural-dwelling older adults: the MIND-China study. J Alzheimers Dis. (2021) 83:1187–98. doi: 10.3233/JAD-210517
41. Onem Y, Terekeci H, Kucukardali Y, Sahan B, Solmazgül E, Senol MG, et al. Albumin, hemoglobin, body mass index, cognitive and functional performance in elderly persons living in nursing homes. Arch Gerontol Geriatr. (2010) 50:56–9. doi: 10.1016/j.archger.2009.01.010
42. Sousa NDS, Menezes TN, de Silva N, de A, Eulálio M, et al. [Prevalence of anemia and correlation between the concentration of hemoglobin and cognitive factors among the elderly]. Cien Saude Colet. (2018) 23:935–44. doi: 10.1590/1413-81232018233.09082016
43. Trevisan C, Veronese N, Bolzetta F, De Rui M, Maggi S, Zambon S, et al. Low hemoglobin levels and the onset of cognitive impairment in older people: the PRO.V.A. Study. Rejuvenation Res. (2016) 19:447–55. doi: 10.1089/rej.2015.1768
44. Wang J, Wang C, Li X, Guo J, Dove A, Cui Z, et al. Association of anemia with cognitive function and dementia among older adults: the role of inflammation. J Alzheimers Dis. (2023) 96:125–34. doi: 10.3233/JAD-230483
45. Gattas BS, Ibetoh CN, Stratulat E, Liu F, Wuni GY, Bahuva R, et al. The Impact of Low Hemoglobin Levels on Cognitive Brain Functions. Cureus. (2020) 12:e11378. doi: 10.7759/cureus.11378
46. Glans I, Nägga K, Gustavsson A-M, Stomrud E, Nilsson PM, Melander O, et al. Associations of modifiable and non-modifiable risk factors with cognitive functions - a prospective, population-based, 17 years follow-up study of 3,229 individuals. Alzheimers Res Ther. (2024) 16:135. doi: 10.1186/s13195-024-01497-6
47. Murayama H, Shinkai S, Nishi M, Taniguchi Y, Amano H, Seino S, et al. Albumin, hemoglobin, and the trajectory of cognitive function in community-dwelling older Japanese: a 13-year longitudinal study. J Prev Alzheimers Dis. (2017) 4:93–9. doi: 10.14283/jpad.2016.113
48. Winchester LM, Powell J, Lovestone S, Nevado-Holgado AJ. Red blood cell indices and anaemia as causative factors for cognitive function deficits and for Alzheimer’s disease. Genome Med. (2018) 10:51. doi: 10.1186/s13073-018-0556-z
49. Qiang Y-X, Deng Y-T, Zhang Y-R, Wang H-F, Zhang W, Dong Q, et al. Associations of blood cell indices and anemia with risk of incident dementia: a prospective cohort study of 313,448 participants. Alzheimers Dement. (2023) 19:3965–76. doi: 10.1002/alz.13088
50. He W, Ruan Y, Yuan C, Luan X, He J. Hemoglobin, anemia, and poststroke cognitive impairment: a cohort study. Int J Geriatr Psychiatry. (2020) 35:564–71. doi: 10.1002/gps.5272
51. Yoshimura Y, Nagano F, Matsumoto A, Shimazu S, Shiraishi A, Kido Y, et al. Hemoglobin levels and cognitive trajectory: unveiling prognostic insights in post-stroke geriatric cohort. J Stroke Cerebrovasc Dis. (2024) 33:107856. doi: 10.1016/j.jstrokecerebrovasdis.2024.107856
52. Shah RC, Buchman AS, Wilson RS, Leurgans SE, Bennett DA. Hemoglobin level in older persons and incident Alzheimer disease: prospective cohort analysis. Neurology. (2011) 77:219–26. doi: 10.1212/WNL.0b013e318225aaa9
53. Shah RC, Wilson RS, Tang Y, Dong X, Murray A, Bennett DA. Relation of hemoglobin to level of cognitive function in older persons. Neuroepidemiology. (2009) 32:40–6. doi: 10.1159/000170905
54. Beydoun MA, Hossain S, Beydoun HA, Shaked D, Weiss J, Evans MK, et al. Red cell distribution width is directly associated with poor cognitive performance among nonanemic, middle-aged, urban adults. J Nutr. (2020) 150:128–39. doi: 10.1093/jn/nxz182
55. Chen H-H, Yeh H-L, Tsai S-J. Association of lower hemoglobin levels with depression, though not with cognitive performance, in healthy elderly men. Psychiatry Clin Neurosci. (2012) 66:367–9. doi: 10.1111/j.1440-1819.2012.02347.x
56. Wolters FJ, Zonneveld HI, Licher S, Cremers LGM, Heart Brain Connection Collaborative Research Group, Ikram MK, et al. Hemoglobin and anemia in relation to dementia risk and accompanying changes on brain MRI. Neurology. (2019) 93:e917–26. doi: 10.1212/WNL.0000000000008003
57. Camaschella C. Iron-deficiency anemia. N Engl J Med. (2015) 372:1832–43. doi: 10.1056/NEJMra1401038
58. Tardy A-L, Pouteau E, Marquez D, Yilmaz C, Scholey A. Vitamins and minerals for energy, fatigue and cognition: a narrative review of the biochemical and clinical evidence. Nutrients. (2020) 12:228. doi: 10.3390/nu12010228
59. Fang Y, Doyle MF, Alosco ML, Mez J, Satizabal CL, Qiu WQ, et al. Cross-sectional association between blood cell phenotypes, cognitive function, and brain imaging measures in the community-based framingham heart study. J Alzheimers Dis. (2022) 87:1291–305. doi: 10.3233/JAD-215533
60. Öztürk ZA, Ünal A, Yiğiter R, Yesil Y, Kuyumcu ME, Neyal M, et al. Is increased red cell distribution width (RDW) indicating the inflammation in Alzheimer’s disease (AD)? Arch Gerontol Geriatr. (2013) 56:50–4. doi: 10.1016/j.archger.2012.10.002
61. Kim KM, Lui L-Y, Browner WS, Cauley JA, Ensrud KE, Kado DM, et al. Association between variation in red cell size and multiple aging-related outcomes. J Gerontol A Biol Sci Med Sci. (2021) 76:1288–94. doi: 10.1093/gerona/glaa217
62. Heppner FL, Ransohoff RM, Becher B. Immune attack: the role of inflammation in Alzheimer disease. Nat Rev Neurosci. (2015) 16:358–72. doi: 10.1038/nrn3880
63. Wood H. Dementia: peripheral inflammation could be a prodromal indicator of dementia. Nat Rev Neurol. (2018) 14:127. doi: 10.1038/nrneurol.2018.8
64. Sweatt K, Garvey WT, Martins C. Strengths and limitations of BMI in the diagnosis of obesity: what is the path forward? Curr Obes Rep. (2024) 13:584–95. doi: 10.1007/s13679-024-00580-1
Keywords: hemoglobin, red blood cell distribution width ratio, cognitive function, obese, NHANES
Citation: Xu R, Wu Z and Liu Z (2025) Hemoglobin-to-red blood cell distribution width ratio: a new insight into cognitive protection for obese individuals. Front. Med. 12:1625542. doi: 10.3389/fmed.2025.1625542
Received: 09 May 2025; Accepted: 25 August 2025;
Published: 26 September 2025.
Edited by:
Lei Qin, University of International Business and Economics, ChinaReviewed by:
Azmi Eyiol, Konya Beyhekim State Hospital, TürkiyeNatasha Anita, University of California, San Diego, United States
Copyright © 2025 Xu, Wu and Liu. This is an open-access article distributed under the terms of the Creative Commons Attribution License (CC BY). The use, distribution or reproduction in other forums is permitted, provided the original author(s) and the copyright owner(s) are credited and that the original publication in this journal is cited, in accordance with accepted academic practice. No use, distribution or reproduction is permitted which does not comply with these terms.
*Correspondence: Zhonghua Liu, emhvbmdodWFfcmVoYUAxNjMuY29t