Abstract
Aim:
This study aims to develop a robust and lightweight deep learning model for early brain tumor detection using magnetic resonance imaging (MRI), particularly under constraints of limited data availability. Objective: To design a CNN-based diagnostic model that accurately classifies MRI brain scans into tumor-positive and tumor-negative categories with high clinical relevance, despite a small dataset. Methods: A five-layer CNN architecture—comprising three convolutional layers, two pooling layers, and a fully connected dense layer—was implemented using TensorFlow and TFlearn. A dataset of 189 grayscale brain MRI images was used, with balanced classes. The model was trained over 10 epochs and 202 iterations using the Adam optimizer. Evaluation metrics included accuracy, precision, recall, F1 Score, and ROC AUC.
Results:
The proposed model achieved 99% accuracy in both training and validation. Key performance metrics, including precision (98.75%), recall (99.20%), F1-score (98.87%), and ROC-AUC (0.99), affirmed the model’s reliability. The loss decreased from 0.412 to near zero. A comparative analysis with a baseline TensorFlow model trained on 1,800 images showed the superior performance of the proposed model.
Conclusion:
The results demonstrate that accurate brain tumor detection can be achieved with limited data using a carefully optimized CNN. Future work will expand datasets and integrate explainable AI for enhanced clinical integration.
1 Introduction
A technique for training a computer to create original representations from unprocessed data is called deep learning. The network’s popularity may be attributed to its hierarchical and layered structure. Convolutional Neural Networks (CNNs) acquire properties through an object compositional hierarchy, starting with simple edges and progressing to more intricate forms. By layering convolutional and pooling layers, this is achieved. By lowering the feature map, pooling combines similar traits into one, and each convolutional layer identifies local conjunctions of features from the preceding layer. Researchers in neuroscience have also benefited from deep learning, as they are starting to address issues related to neuroimaging. Deep Learning has garnered significant interest due to its ability to address problems across various domains, including medical image analysis. In Palestine, cancer is now the second leading cause of death for both men and women, but over the next decades, it is predicted to overtake all other causes of death (1).
Research has shown that the most effective means of lowering death from brain cancer is early diagnosis and treatment. A low-grade growth that develops slowly will eventually evolve into a neoplasm that grows rapidly. As a result, the first tumor identification and categorization helped to anticipate the prognosis and treatment plan by supporting the assessment of the tumor’s grade and aggressiveness. The diagnosis of brain tumors is mostly reliant on medical imaging (2). One of the most efficient methods currently used for tumor detection is magnetic resonance imaging (MRI). A powerful magnetic flux, radiofrequency pulses, and a laptop is employed to process tomography imaging data to produce detailed images of soft tissues and organs. It aids medical professionals in treating illnesses. The main reason for tomography’s popularity is that it is a more suitable designation than X-rays (3).
Noise significantly degrades medical images, including MRIs. This is largely due to knowledge acquisition systems, multiple sources of interference, operator error, and other factors that impact imaging mensuration processes and can lead to significant classification errors (4). This approach typically requires a basic microscope and may result in a different or incorrect diagnosis, yet it is often inappropriate when dealing with human life. It emphasizes the need for power-assisted systems, high-precision systems, or diagnostic systems (CADx) (5). The CADx system is essential for medical institutions, as it supports the judgments made by doctors and radiologists. It may be challenging to create a highly automated and economical diagnostic system as a result (6).
Gliomas are the most prevalent and aggressive kind of brain tumor, with a very short survival time for the highest grade. Therefore, therapy planning may be a crucial step in raising the medical patients’ standards of living. One popular imaging modality for evaluating these tumors may be MRI (7). These days, with numerous instances and massive volumes of objective data analysis, computer-based medical image analysis is gaining popularity due to its speed and intelligence, surpassing manual methods. By varying the excitation and repetition durations, magnetic resonance imaging may produce notably unique tissue types, making it an incredibly adaptable tool for studying various structures of interest. A single magnetic resonance imaging scan is insufficient to phase the growth and all of its subregions fully. Convolutional Neural Networks (CNNs) have demonstrated high effectiveness in identifying cell division events in two-dimensional microscopic anatomy pictures within the field of medical image analysis. When it comes to machine learning strategies, deep learning is undoubtedly the best option for many imaging tasks. The possibility of deep learning-based automated diagnosis of brain illnesses will arise from the availability of large neuroimaging data sets for training. MRI is a frequently used medical imaging method that offers information on the identification of brain tumors (8). One of the main challenges a physician has after reviewing the tomography data is determining how much time and effort to devote to tumor detection. These days, CNNs are used for the majority of picture classification problems due to their superior accuracy and precision over other currently used techniques. The accuracy and precision of tumor detection and identification have increased due to the use of CNNs for image classification (9).
2 Related work
Over the last 20 years, the detection of brain cancers using MRI has undergone significant advancements, thanks to the integration of deep learning (DL), traditional machine learning (ML), and conventional image processing techniques. This section discusses the main categories of methodologies and provides an overview of how our research contributes to and expands upon the existing body of literature.
2.1 Conventional techniques for machine learning and segmentation
Most of the early work uses unsupervised clustering and custom feature extraction. Due to their ability to separate picture intensities into clusters that represent normal and diseased tissue regions, segmentation techniques like fuzzy C-Means (FCM) and K-Means clustering have been widely used (10–12). Despite achieving basic localization, these methods were very susceptible to noise and required human parameter adjustment. Changes aimed at improving segmentation accuracy, such as region-expanding algorithms (13, 14) and gray-level histograms (15), were computationally expensive and inconsistent, particularly in low-contrast or early-stage tumors where borders were not obvious. For feature extraction and classification, further research employs learning vector quantization, support vector machines (SVMs), and artificial neural networks (ANNs) (16, 17). These earlier methods, however, sometimes did not work with diverse patient datasets and needed careful feature engineering.
2.2 Techniques based on deep learning and CNN
CNNs have been used extensively in medical imaging applications due to their effectiveness in computer vision (26, 27). CNNs eliminate the requirement for human feature design by automatically extracting hierarchical features. Models like AlexNet, VGG16, and ResNet have been modified to perform tasks related to brain tumor classification and segmentation (18, 19). Although these designs have demonstrated outstanding performance, they often rely on large, annotated datasets, which are challenging to collect in the medical field due to privacy concerns and high labeling costs. To manage volumetric MRI data and capture spatial relationships between image slices, 3D CNNs have been the subject of several studies (20). Although these models improve the accuracy of segmentation tasks, their computational cost makes them unsuitable for real-time applications or situations with limited resources. Similar studies have been conducted on Stacked Autoencoders (SAEs) and Deep Belief Networks (DBNs) (21), but in the lack of suitable data, training these deep models from scratch may lead to overfitting.
2.3 Domain adaptation and learning transfer
By utilizing pre-trained networks as feature extractors for MRI classification, which have been trained on natural image datasets such as ImageNet, researchers have employed transfer learning to reduce the need for large datasets (22, 23). When paired with domain-specific fine-tuning, it can accelerate training and enhance generalization. However, insufficient feature representations may result from the domain mismatch between natural and medical images. ResNet or InceptionV3 versions that have been carefully altered and work well on binary classification tasks are used in certain studies. Clinical safety criteria, such as recall and AUC, which are essential for real-world diagnosis, are seldom used to evaluate models.
2.4 Methods for multimodal MRI and synthesis
To collect different tissue contrasts, advanced segmentation algorithms often use several MRI modalities. Studies like the BraTS Challenge and BraSyn Benchmark (24, 25) demonstrate the challenges that arise when sequences are erratic or nonexistent, while also emphasizing the advantages of multimodal input. To fill in the gaps, several studies have explored the creation of synthetic MRIs using GANs or autoencoders; however, these methods require a complex design and are not ideal for use in situations with limited data.
3 Materials and methods
Cancer remains one of the most life-threatening diseases worldwide, and early detection is critical for effective treatment. MRI is a widely used, non-invasive imaging technique that helps identify abnormalities in the brain, including cancerous tumors. In recent years, machine learning—particularly image classification techniques—has demonstrated significant promise in improving the accuracy and speed of cancer detection using MRI. This study examines the DL-based application in developing a CNN for brain tumor detection using MRI scans. The proposed CNN architecture consists of five layers, specifically designed to classify MRI images into cancerous and non-cancerous categories with high accuracy.
3.1 Data acquisition
Data plays a crucial part in machine learning systems. The dataset utilized in this work was available from the UCI Machine Learning Repository and Kaggle, both of which are publicly accessible. The dataset downloaded from Kaggle and is accessible at https://www.kaggle.com/datasets/navoneel/brain-mri-images-for-brain-tumor-detection/data (last accessed: January 10, 2025), and the second dataset is available at https://www.kaggle.com/datasets/sartajbhuvaji/brain-tumor-classification-mri (last accessed: January 20, 2025).
3.2 Methodology and model architecture
The architecture employed in this study is based on a CNN design, which is particularly effective for image classification tasks. CNNs typically include the following core components:
-
Convolutional Layers: Extract feature maps from the input image using learned filters and apply non-linear activation functions (e.g., ReLU).
-
Pooling Layers: Reduce the spatial size of feature maps, enhance computational efficiency, and mitigate overfitting—max-pooling is the most commonly used technique.
-
Fully Connected (Dense) Layers: Interpret the extracted features and produce classification decisions; each neuron is connected to all neurons in the previous layer.
The proposed model consists of five primary layers: three convolutional layers, two max-pooling layers, and a fully connected dense layer. The architecture is implemented using the high-level TensorFlow Layers API, which streamlines the creation of neural networks by offering functions to define convolutional, pooling, and dense layers, along with activation functions and regularization options such as dropout.
Figure 1 illustrates the sequential layer-wise architecture of the CNN, clarifying the dimensional transformation of MRI data from input through convolution, pooling, and dense layers to the final binary classification. The model was trained using the Adam optimizer with the following parameters: ε = 1e-8, β₁ = 0.9, β₂ = 0.999, and a learning rate of 0.001. To avoid overfitting, a dropout layer with a 0.5 rate was added after the dense layer.
Figure 1

CNN architecture for brain tumor classification, showing layers for feature extraction and final classification from MRI input images.
The model processes grayscale MRI images resized to 128 × 128 × 1. The first convolutional layer applies 32 filters (3 × 3) with ReLU activation, followed by a 2 × 2 max-pooling operation. The second convolutional layer utilizes 64 filters (3 × 3) with ReLU activation and an additional 2 × 2 max-pooling operation. The third convolutional layer consists of 128 filters (3 × 3), followed by another pooling operation. The output of the convolutional stages is flattened and passed to a dense layer with 128 neurons, also using ReLU activation. Ultimately, a single output neuron with sigmoid activation yields a binary classification decision (tumor-positive or tumor-negative).
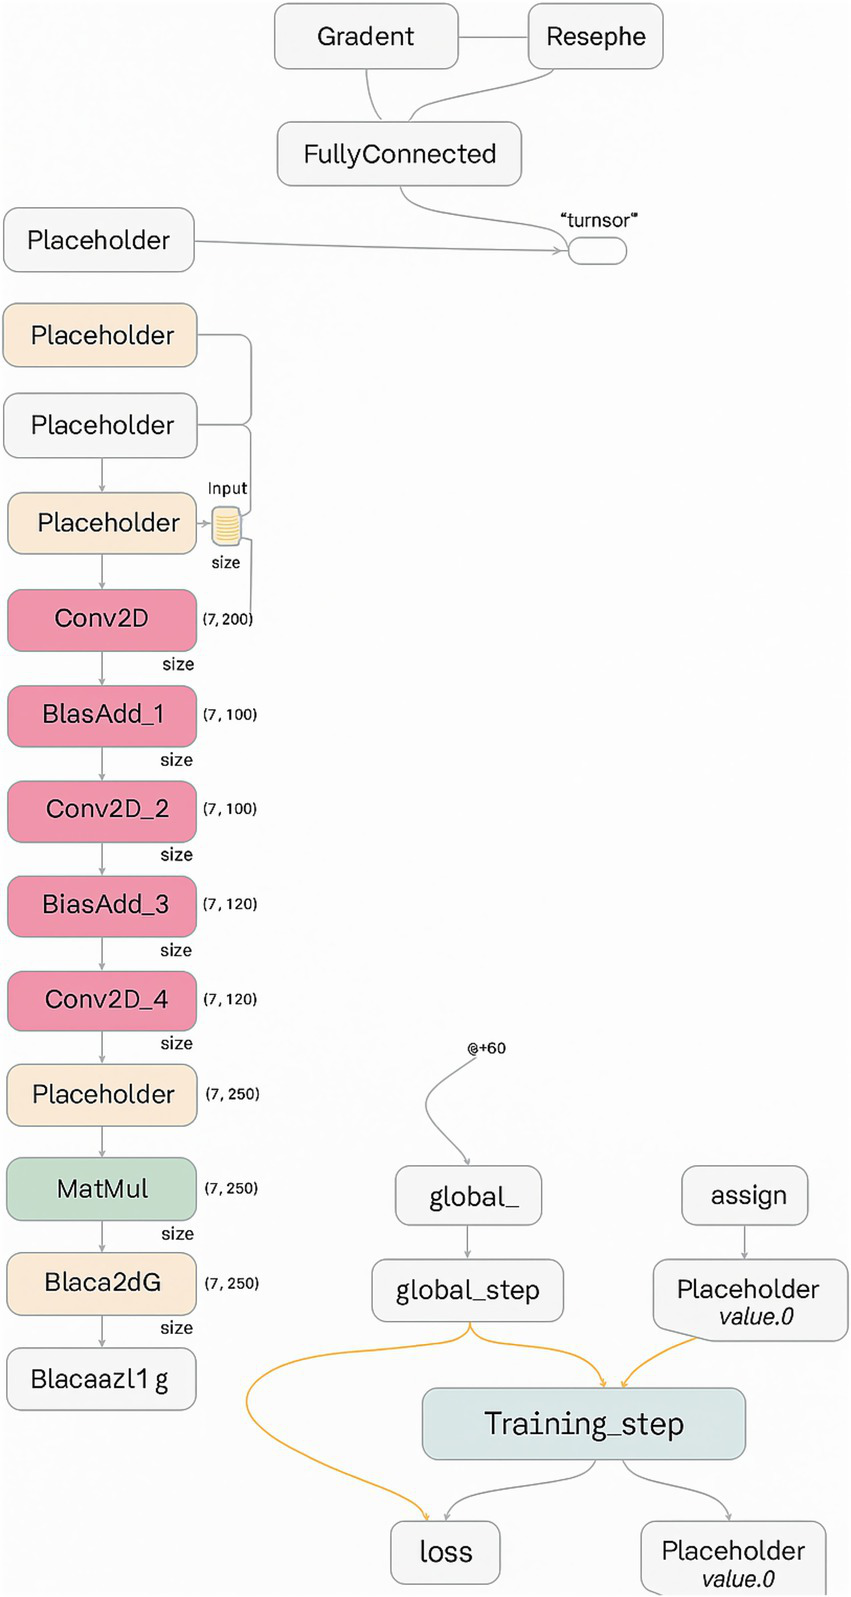
Figure 2 illustrates the initial layers of the CNN, including the first convolution and pooling layers. The initial convolutional and pooling layers extract low-level spatial features, such as edges and texture gradients, which are essential for differentiating tumor boundaries from normal tissue in MRI images, including edges, lines, and simple textures. The visual representation highlights how spatial information is preserved while dimensionality is reduced.
Figure 2
Feature extraction in early CNN layers showing low-level spatial features such as edges and textures derived from tumor MRI images.
Figure 3 illustrates the intermediate layers of the CNN, which include deeper convolutional layers with a greater number of filters. These layers extract high-level, abstract features such as tumor shapes, boundaries, and textures. These deeper layers abstract high-level semantic features such as irregular tumor shapes, enhancing the model’s ability to distinguish pathological from healthy brain structures.
Figure 3
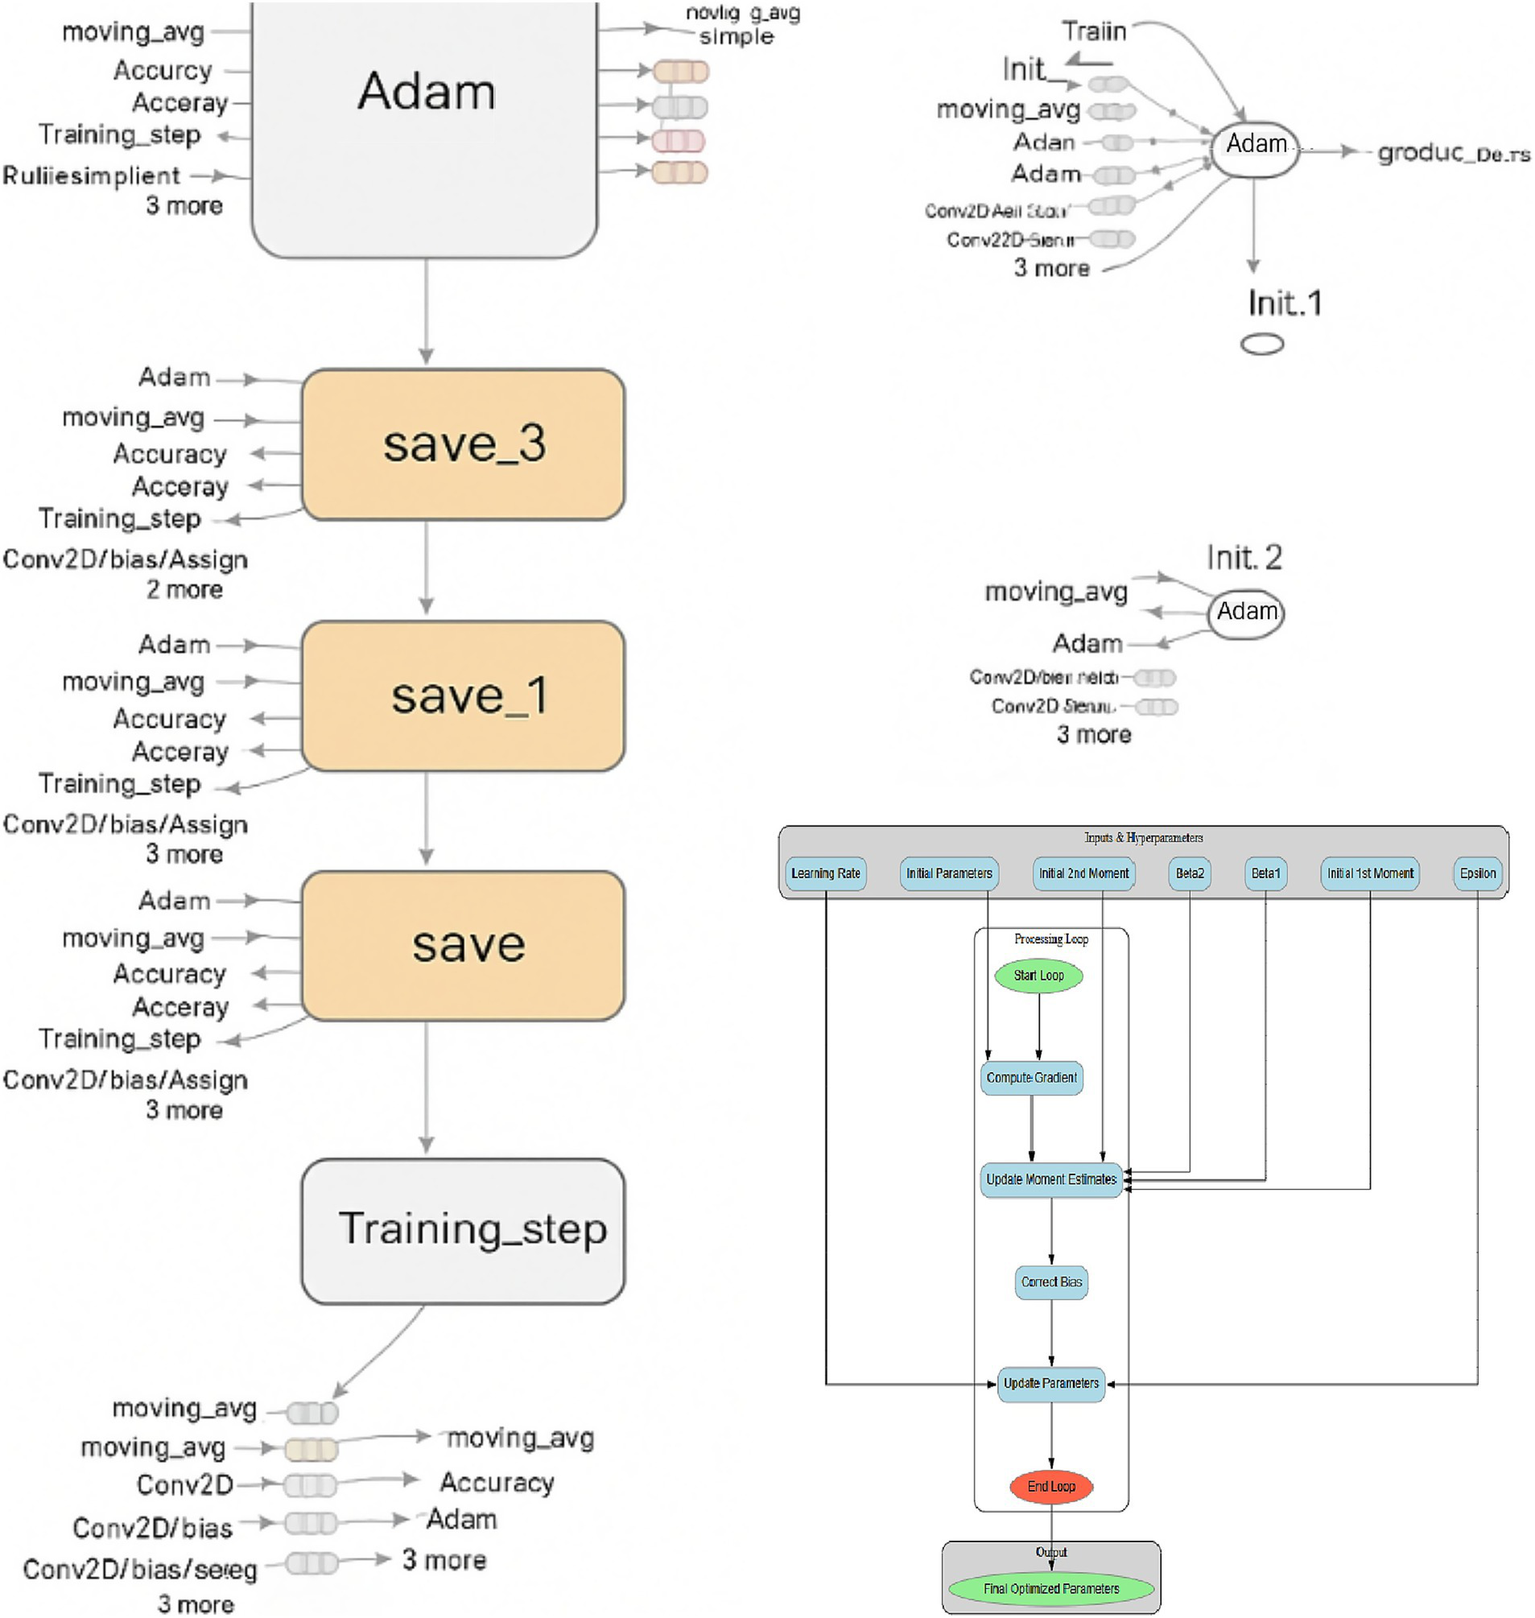
Intermediate CNN layers highlighting deeper convolutions and expanded feature maps that capture high-level tumor features.
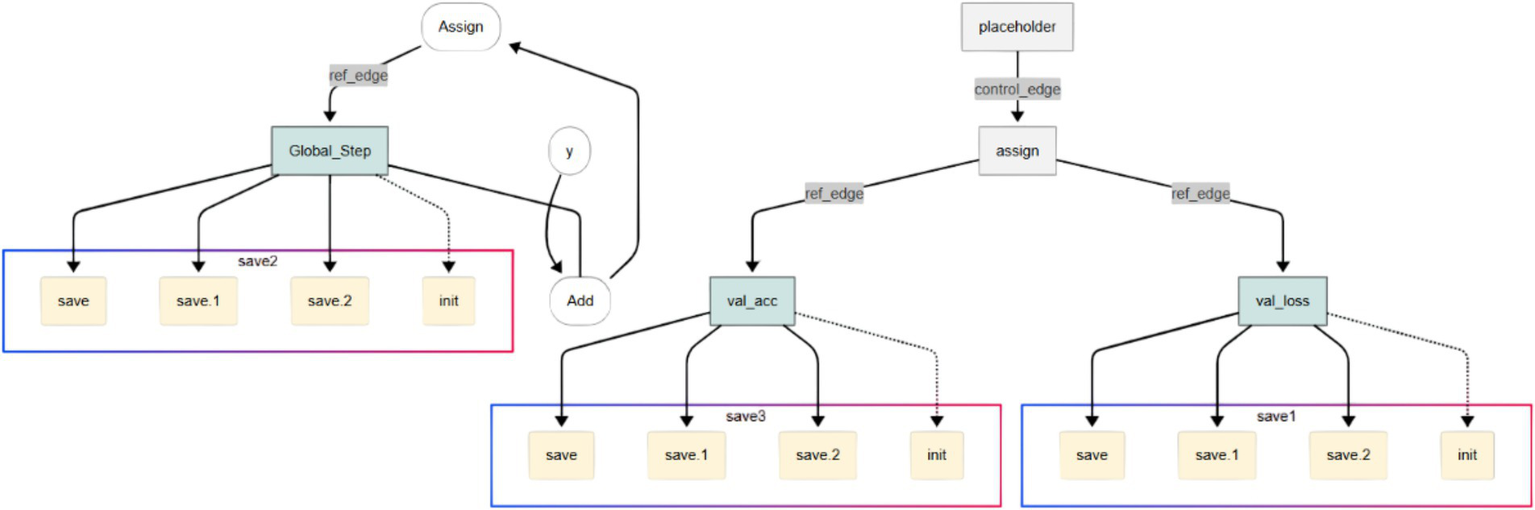
Figure 4 focuses on the final layers of the CNN, including the fully connected dense layer and the output neuron. These layers are responsible for interpreting the extracted features and making the final classification decision. The use of sigmoid activation in the output neuron enables the model to output a probability score indicating the presence or absence of a brain tumor.
Figure 4
Final CNN layers: dense and sigmoid output units responsible for probabilistic classification of tumor presence.
To complement these visual representations, Table 1 provides a detailed layer-wise summary of the CNN model, listing input/output dimensions, number of filters or neurons, kernel and pooling sizes, and activation functions used at each stage. Moreover, it offers a concise yet thorough reference for understanding the architecture’s design and function.
Table 1
| Layer type | Output shape | Activation | Notes |
|---|---|---|---|
| Input Layer | (128, 128, 1) | — | Grayscale MRI input |
| Conv2D | (128, 128, 32) | ReLU | 32 filters, 3 × 3 kernel |
| MaxPooling2D | (64, 64, 32) | — | 2 × 2 pool size |
| Conv2D | (64, 64, 64) | ReLU | 64 filters, 3 × 3 kernel |
| MaxPooling2D | (32, 32, 64) | — | 2 × 2 pool size |
| Conv2D | (32, 32, 128) | ReLU | 128 filters, 3 × 3 kernel |
| MaxPooling2D | (16, 16, 128) | — | 2 × 2 pool size |
| Flatten | (32768) | — | — |
| Dense | (128) | ReLU | Fully connected layer |
| Output (Dense) | (1) | Sigmoid | Binary classification output |
Layer-wise architecture of the proposed CNN model, detailing input/output shapes, filter counts, kernel sizes, activation functions, and pooling operations for each layer.
The TensorFlow Layers API enables the construction of these components with functions such as:
-
conv2d(): Defines 2D convolutional layers with specified parameters.
-
max_pooling2d(): Creates pooling layers to down-sample feature maps.
-
dense(): Builds fully connected layers for classification.
Due to the complexity of the computational graph, it is segmented for clarity across Figures 2–4, with each segment representing a critical stage in the data transformation and classification process.
4 Experimental setup and results
The proposed CNN model was trained and evaluated using a dataset comprising 189 MRI images, with an equal balance between cancerous and non-cancerous cases. The dataset was stratified into training, validation, and testing subsets to maintain balanced representation of tumor-positive and tumor-negative cases. Table 2 presents the data distribution according to the train and test splits. Training was performed for 10 epochs with a batch size of 18, yielding approximately 202 iterations. Key performance metrics, including accuracy, loss, and ROC-AUC, were monitored via TensorBoard throughout training. Hyperparameters were consistently maintained across experiments to enhance reproducibility. Tracking accuracy and loss over 202 iterations with TensorBoard enabled validation of stable convergence and early detection of overfitting, which is critical given the limited dataset size.
Table 2
| Dataset split | Number of images | Tumor-positive | Tumor-negative |
|---|---|---|---|
| Training | 133 | 67 | 66 |
| Validation | 28 | 14 | 14 |
| Testing | 28 | 14 | 14 |
| Total | 189 | 95 | 94 |
Dataset distribution across training, validation, and testing subsets, showing balanced representation of tumor-positive and tumor-negative MRI scans of the first dataset.
Because of the small sample size, we utilized TensorFlow’s “ImageDataGenerator” to supplement data in real time and increase generalization. The augmentation pipeline used horizontal flipping (p = 0.5) to mimic mirrored brain orientations, small-angle rotations (±10°) to account for head tilt variability, random zoom (±5%) and translations (±5% of image dimensions) to simulate patient positioning differences, and Gaussian noise injection (σ = 0.01) to simulate MRI scanner acquisition noise. The augmentation pipeline contained:
-
Horizontal Flipping: To represent mirrored anatomical configurations, has a chance of 0.5.
-
Rotation: Random small-angle rotations within ±10°, to account for minor patient head tilts.
-
Zoom: To mimic size differences across scanners, zoom in and out by up to 5%.
-
Translation: An image dimension from vertical and horizontal shift up to 5%.
-
Noise injection: MRI scanner acquisition noise is simulated using low-level Gaussian noise (σ = 0.01).
To accommodate for changes in intensity from scanner calibration, adjust brightness by ± 10%. To expose the model to a broader variety of real-world input conditions without needlessly extending the dataset on disk, these modifications to the training set were performed stochastically throughout each epoch. Each run started with a predefined random seed to maintain consistency. We can assure repeatability and back up our claims of strong generalization with short datasets by enabling other researchers to reproduce our preprocessing pipeline and see whether analogous augmentation tactics offer equivalent advances in other limited-data settings. In clinical contexts with limited and varied patient data, augmentation decreases overfitting, enhances feature diversity, and makes the model more usable.
The dataset used in this study consisted of MRI scans collected from multiple patients, with one representative scan per subject to minimize redundancy and prevent model bias. In cases where numerous scans were available per patient, only one scan was randomly selected to ensure that no patient’s data appeared in both the training and validation sets. This procedure prevents data leakage, ensuring that the model’s performance reflects genuine generalization rather than memorization of individual patient characteristics.
Figure 5 provides a visual overview of the dataset used in our experiments, distinguishing between cancerous and non-cancerous MRI brain scans. Our CNN effectively captured these differences in structural patterns and intensities for classification.
Figure 5
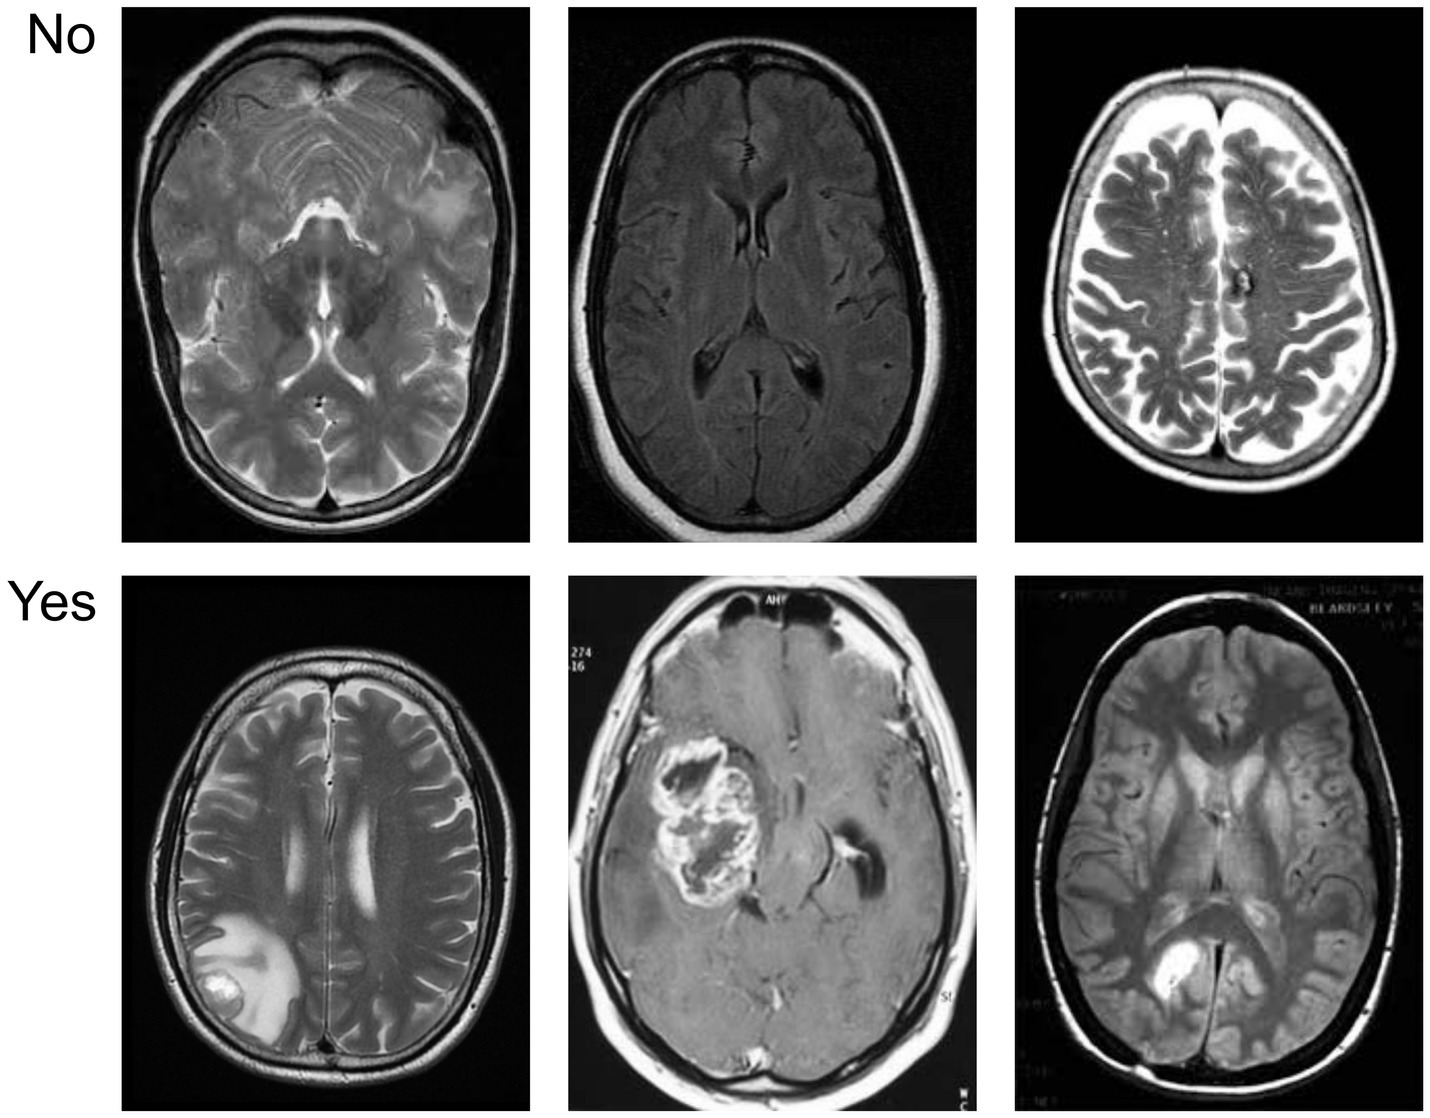
Sample visualization of the MRI dataset illustrating differences between tumor-positive and tumor-negative brain images.
The model was trained for 35 epochs (840 iterations), achieving a peak validation accuracy of 98%. The model’s high precision and recall indicate its potential as a clinical decision support tool to aid radiologists in more efficient brain tumor identification. Each training example that passes through the network in both forward and backward propagation constitutes one iteration.
The Adam optimiser was configured with a learning rate of 0.001, β₁ = 0.9, β₂ = 0.999, and ε = 10−8. These values are known to offer stable and efficient convergence in deep learning models, especially when working with small datasets. They were selected after preliminary tuning and cross-referencing with prior studies demonstrating similar use cases in MRI image classification. Although extensive hyperparameter tuning was beyond the scope of this study, the choice of hyperparameters was based on standard values widely adopted in the literature for medical image classification tasks.
Figure 6 displays the tumor segmentation output, highlighting spatial tumor regions. The trained model not only classifies the presence of tumors but also enables the visualization of the detected tumor region. This segmentation capability adds clinical value by providing spatial context for the tumor’s location and size.
Figure 6
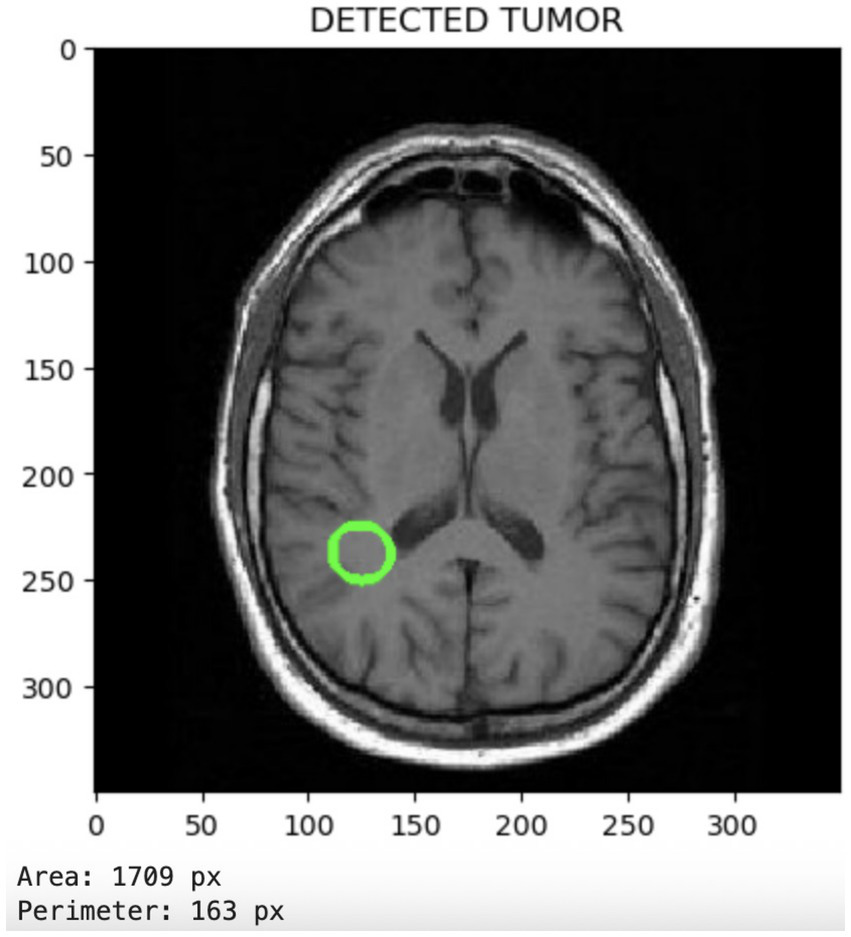
Segmentation output visualizing localized tumor regions, highlighting the model’s spatial discrimination capabilities.
Figure 7 illustrates the accuracy across iterations, which initially shows an uneven distribution but ultimately converges to zero as the iterations progress. The loss rate is a critical component of CNN and is used to improve the CNN architecture. Despite the limited dataset, the proposed model effectively minimizes loss and enhances accuracy. Figure 8 presents the Receiver Operating Characteristic (ROC) curve with an AUC of 0.99, illustrating excellent diagnostic ability.
Figure 7
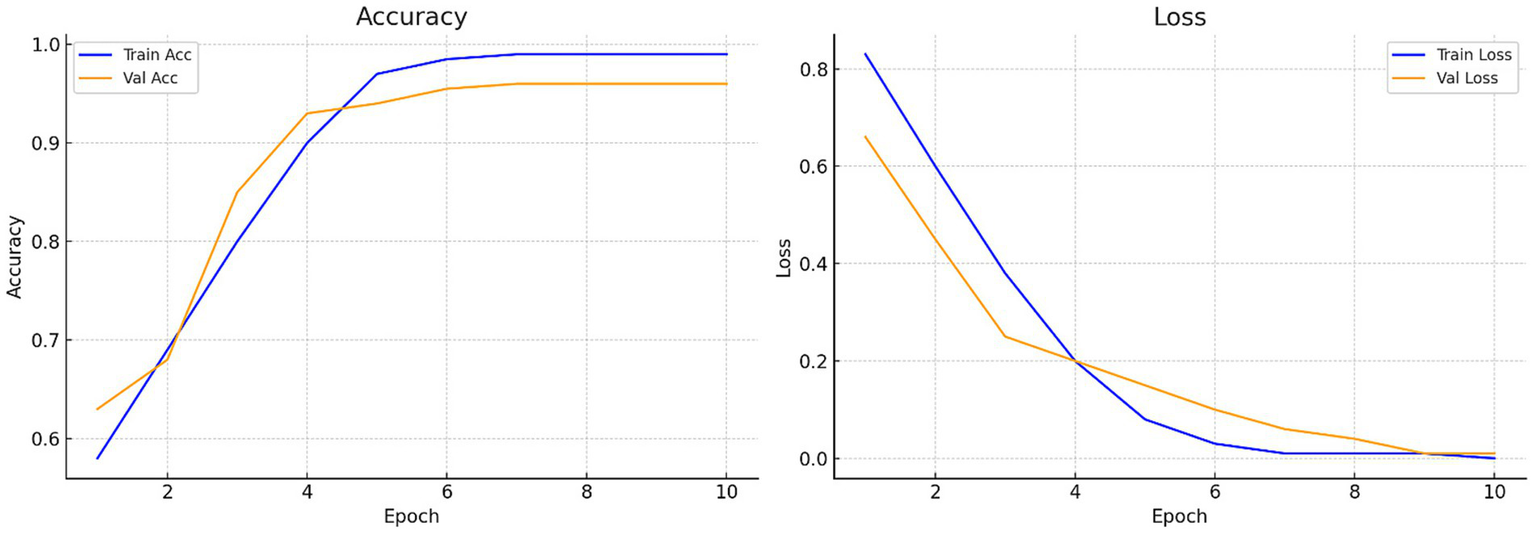
Accuracy and loss curves of the proposed model: Training loss progression illustrating reduction from 0.412 to near zero, reflecting stable model convergence.
Figure 8
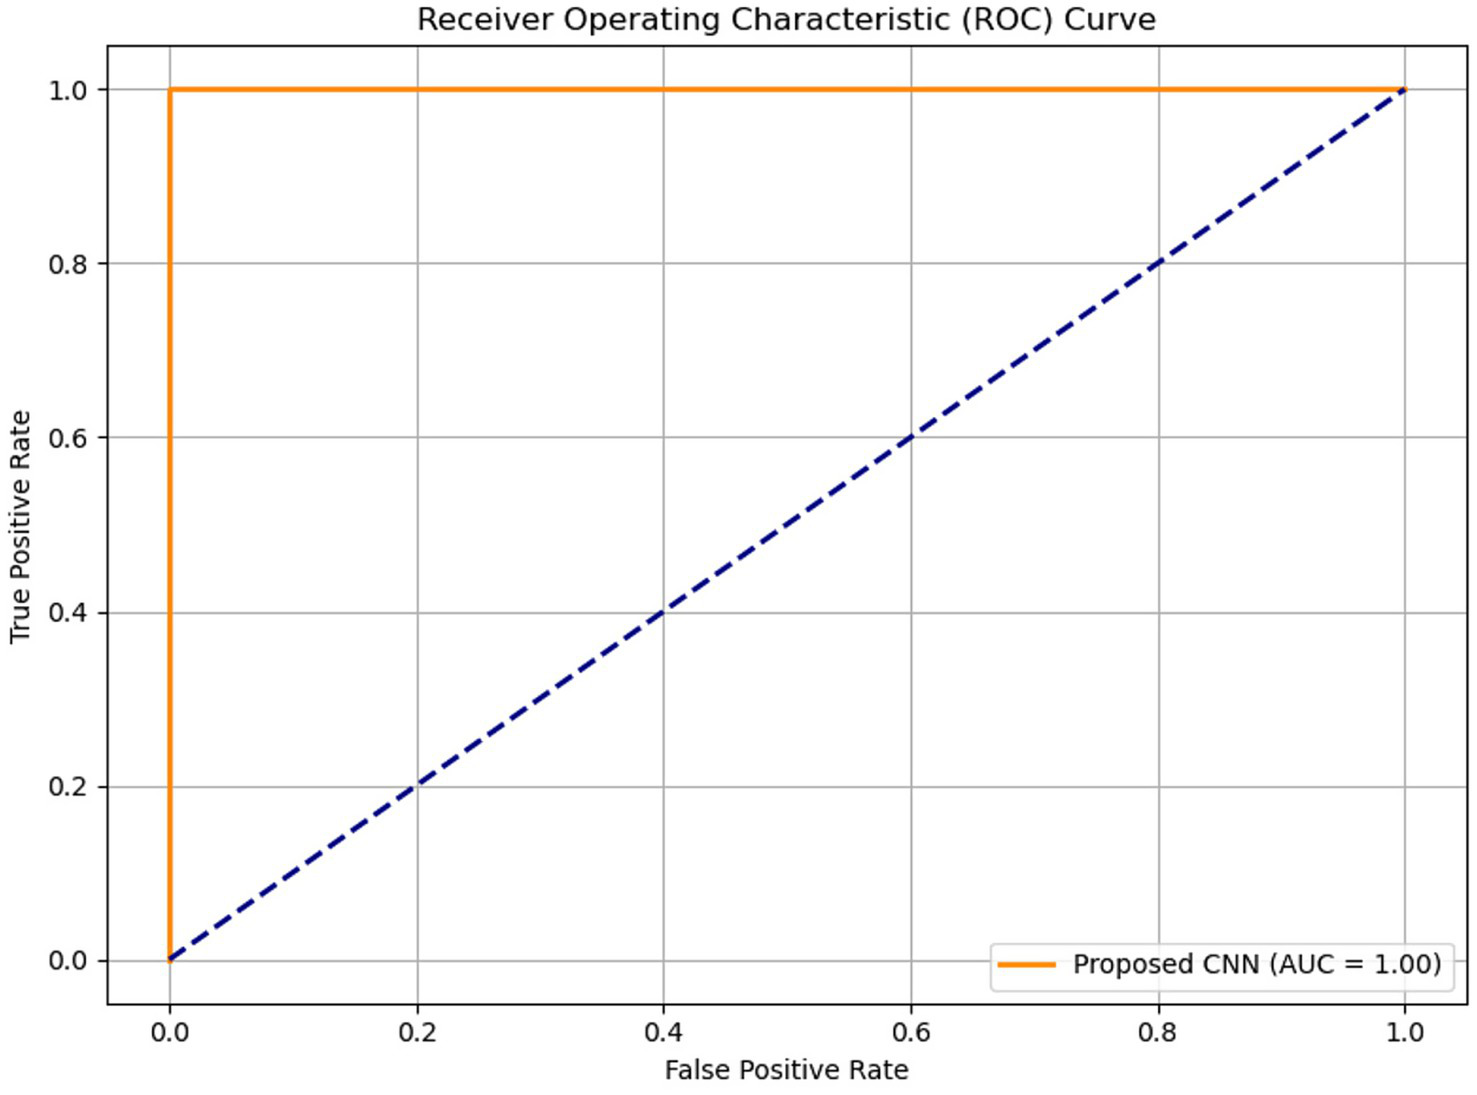
Receiver Operating Characteristic (ROC) curve of the proposed model with an AUC of 0.99, indicating excellent diagnostic accuracy.
To further assess the performance of the proposed CNN-based model, standard classification metrics were computed, including precision, recall, F1-score, accuracy, and the area under the ROC-AUC curve. Table 3 consolidates critical performance metrics, including training accuracy (99%), validation accuracy (99%), loss rate reduction from 0.412 to nearly zero, precision, recall, F1-score, and ROC-AUC (0.99), providing a clear and concise overview of the model’s effectiveness. Figure 9 illustrates the confusion matrix of both proposed and baseline models when tested with 600 test images of the second dataset. Additionally, Table 4 compares the performance of the proposed model with a baseline TensorFlow model trained on a larger dataset (1800 images) that has lower accuracy (98%) and higher loss (0.704). The proposed CNN model has superior performance despite the limited data.
Table 3
| Metric | Value |
|---|---|
| Accuracy | 99.00% |
| Precision | 98.75% |
| Recall | 99.20% |
| F1 Score | 98.87% |
| ROC-AUC | 0.99 |
| Loss Reduction | 0.412 → ~0.00 |
Performance metrics of the proposed CNN model, including accuracy, precision, recall, F1-score, ROC-AUC, and reduction in loss rate.
Figure 9
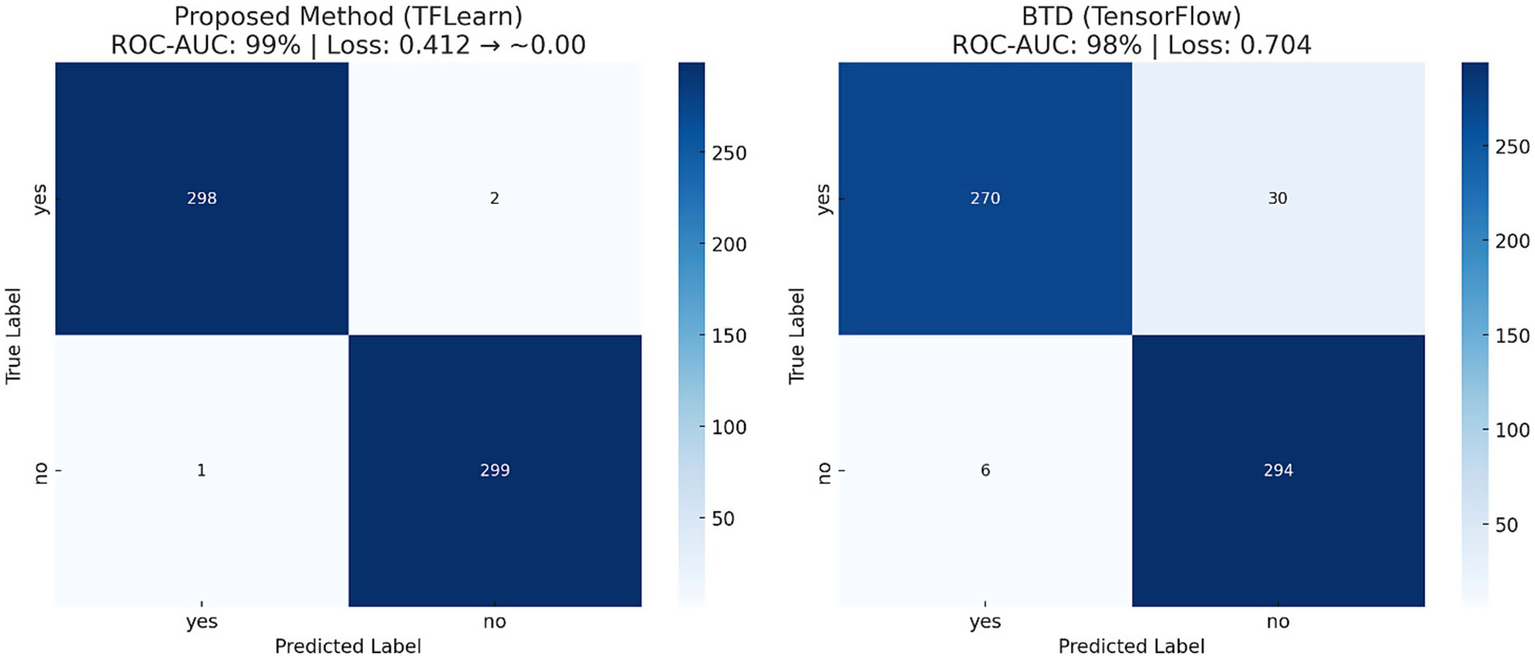
Confusion matrix showing true positive and true negative predictions, validating classification reliability.
Table 4
| Method | Epochs | Iterations | Dataset | ROC-AUC | Loss rate |
|---|---|---|---|---|---|
| BTD (TensorFlow) | 35 | 840 | 1800 | 98% | 0.704 |
| Proposed Method (TFLearn Based) | 10 | 202 | 189 | 99% | 0.412 → ~0.00 |
Comparative evaluation of the proposed CNN model versus a baseline TensorFlow implementation, highlighting improved performance with fewer training samples.
The five-layer CNN architecture was selected to balance classification accuracy and computational efficiency on a limited dataset for prospective clinical use. Early research compared the recommended design to a more complex 8-layer CNN with an extra convolution-pooling block and a second dense layer. Despite reaching 99% training accuracy, the deeper model’s validation accuracy plateaued at 96% after the 20th epoch and displayed peculiar loss oscillations, indicating overfitting due to the limited dataset size of 189 pictures. Across all training and validation sets, the five-layer model consistently reduced loss from 0.412 to near zero while maintaining 99% accuracy, demonstrating strong generalization capabilities. Furthermore, it reduced the number of parameters by approximately 38%, thereby decreasing training time on the same GPU from 7.8 s to 4.9 s per epoch. This efficiency directly supports the study’s purpose of creating a lightweight diagnostic model suited for real-time inference in clinical settings, especially when resources are constrained. The architect’s decision reflects the nature of the classification challenge. When utilizing MRI to identify brain cancers, spatial indicators such as tumor margins, regional intensity variations, and abnormal textural patterns are crucial. They may be successfully retrieved without having a massive network depth by utilizing three progressively deeper convolutional layers (32, 64, and 128 filters). According to feature map representations, the proposed CNN properly captured both low-level edge attributes and higher-level tumor form abstractions that were comparable to those in the deeper model. Given the dataset, processing settings, and observable performance limits, the five-layer CNN delivers the ideal blend of accuracy, resilience, and efficiency for this experiment.
5 Conclusion
Deep learning has become a crucial tool in biomedical image analysis, particularly for applications such as brain tumor classification using MRI scans. For quicker model construction, the proposed technique employs CPU-based TensorFlow and TFLearn, as well as GPU-based TensorFlow. Deep learning (DL) techniques are increasingly employed in medical imaging for brain tumor detection and classification. The use of MRI is essential for detecting abnormal brain tissues, and accurate tumor diagnosis is vital for treatment planning. To categorize and diagnose brain tumors from a limited MRI dataset, the study employs a deep learning approach using a Convolutional Neural Network (CNN). The proposed model achieved 99% training and 99% validation accuracy, with a validation loss reduction from 0.412 to near 0.000 across 10 epochs. Additionally, the model attained an ROC-AUC of 0.99, confirming its strong discriminative capability. The proposed CNN model outperformed a baseline model trained on a larger dataset, achieving higher accuracy (99% vs. 98%) and lower validation loss (0.412 vs. 0.704), which indicates strong potential for deployment in real-time clinical diagnostics, especially in data-limited settings. The suggested CNN model may be used in real-world healthcare environments because of its lightweight design and exceptional diagnostic precision. In a radiology department’s existing PACS (Picture Archiving and Communication System), a radiologist may use the model as an automated pre-screening tool to rank MRI images with a high likelihood of tumor incidence. Real-time feedback during diagnostic sessions could be provided by integrating the model with clinical decision support systems. Additionally, report authoring could be made easier by connecting to Radiology Information Systems (RIS). Because of its minimal computational requirements (4.9 s per epoch on a standard GPU), the model may also be implemented on-site in hospitals with limited resources, eliminating the need for cloud-based processing. Regulatory approval, interoperability with different MRI scanner outputs, and further validation across multiple-center datasets to ensure robustness are the remaining challenges. Before clinical utilization is widely accepted, these challenges need to be resolved.
6 Future directions
Future work will focus on expanding the dataset to improve model generalization and reduce bias. Integrating additional imaging modalities, such as Computed Tomography (CT) and Positron Emission Tomography (PET), as well as utilizing transfer learning with pre-trained models, may enhance performance. Exploring three-dimensional Convolutional Neural Networks (3D CNNs) can capture spatial context more effectively, while explainable AI methods, such as Gradient-weighted Class Activation Mapping (Grad-CAM), can improve interpretability. In the future, data augmentation techniques, including rotation, flipping, scaling, and brightness adjustment, can be employed to assess the model’s generalization.
Statements
Data availability statement
Publicly available datasets were analyzed in this study. This data can be found here: the datasets analyzed for this study can be found at https://www.kaggle.com/datasets/navoneel/brain-mri-images-for-brain-tumor-detection/data (Last Accessed: January 10, 2025) https://www.kaggle.com/datasets/sartajbhuvaji/brain-tumor-classification-mri (Last Accessed: January 10, 2025).
Ethics statement
Ethical approval was not required for the study involving humans in accordance with the local legislation and institutional requirements. Written informed consent to participate in this study was not required from the participants or the participants’ legal guardians/next of kin in accordance with the national legislation and the institutional requirements.
Author contributions
AN: Investigation, Validation, Methodology, Conceptualization, Software, Formal analysis, Writing – original draft. OO: Writing – original draft, Visualization, Writing – review & editing, Data curation. SA: Visualization, Writing – review & editing, Resources. TC: Visualization, Data curation, Writing – review & editing, Writing – original draft. AZ: Software, Formal analysis, Writing – original draft, Methodology, Investigation, Validation. JR: Resources, Conceptualization, Writing – review & editing.
Funding
The author(s) declare that no financial support was received for the research and/or publication of this article.
Conflict of interest
The authors declare that the research was conducted in the absence of any commercial or financial relationships that could be construed as a potential conflict of interest.
Generative AI statement
The authors declare that no Generative AI was used in the creation of this manuscript.
Any alternative text (alt text) provided alongside figures in this article has been generated by Frontiers with the support of artificial intelligence and reasonable efforts have been made to ensure accuracy, including review by the authors wherever possible. If you identify any issues, please contact us.
Publisher’s note
All claims expressed in this article are solely those of the authors and do not necessarily represent those of their affiliated organizations, or those of the publisher, the editors and the reviewers. Any product that may be evaluated in this article, or claim that may be made by its manufacturer, is not guaranteed or endorsed by the publisher.
References
1.
Kimberly WT Sorby-Adams AJ Webb AG Wu EX Beekman R Bowry R et al . Brain imaging with portable low-field MRI. Nat Rev Bioeng. (2023) 1:617–30. doi: 10.1038/s44222-023-00086-w
2.
Kia M Sadeghi S Safarpour H Kamsari M Jafarzadeh Ghoushchi S Ranjbarzadeh R . Innovative fusion of VGG16, MobileNet, EfficientNet, AlexNet, and ResNet50 for MRI-based brain tumor identification. Iran J Comput Sci. (2025) 8:185–215. doi: 10.1007/s42044-024-00216-6
3.
Appavu N. , "Brain tumor detection and classification using MRI with ResNet50 and hybrid AI deep learning techniques," 2025 international conference on data science, agents & artificial intelligence (ICDSAAI), Chennai, India: ICDSAAI, (2025), pp. 1–6.
4.
Bilal H Tian Y Ali A Muhammad Y Yahya A Izneid BA et al . An intelligent approach for early and accurate predication of cardiac disease using hybrid artificial intelligence techniques. Bioengineering. (2024) 11:1290. doi: 10.3390/bioengineering11121290
5.
Noh H. Hong S. Han B. , "Learning deconvolution network for semantic segmentation," 2015 IEEE international conference on computer vision (ICCV), Santiago, Chile, IEEE. (2015), pp. 1520–1528.
6.
Ahmed N Rozina R Ali A et al . Image denoising for COVID-19 chest X-ray based on multi-scale parallel convolutional neural network. Multimedia Systems. (2023) 29:3877–90. doi: 10.1007/s00530-023-01172-0
7.
Zhu L Xue Z Jin Z Liu X He J Liu Z et al . Make-A-volume: leveraging latent diffusion models for cross-modality 3D brain MRI synthesis In: GreenspanH, editor. Medical image computing and computer assisted intervention – MICCAI 2023. MICCAI 2023. Lecture notes in computer science. Cham: Springer (2023)
8.
Shawon MTR Shibli GMS Ahmed F Joy SKS . Explainable cost-sensitive deep neural networks for brain tumor detection from brain MRI images considering data imbalance. Multimed Tools Appl. (2025) 6:842. doi: 10.1007/s11042-025-20842-x
9.
Nassar SE Yasser I Amer HM Mohamed MA . A robust MRI-based brain tumor classification via a hybrid deep learning technique. J Supercomput. (2024) 80:2403–27. doi: 10.1007/s11227-023-05549-w
10.
Alsarhan T Ali SS Ganapathi II Ali A Werghi N . PH-GCN: boosting human action recognition through multi-level granularity with pair-wise hyper GCN. IEEE Access. (2024) 12:162608–21. doi: 10.1109/ACCESS.2024.3477321
11.
Mohammad F Al Ahmadi S Al Muhtadi J . Blockchain-based deep CNN for brain tumor prediction using MRI scans. Diagnostics. (2023) 13:1229. doi: 10.3390/diagnostics1307122
12.
Naeem AB Senapati B Chauhan AS Makhija M Singh A Gupta M et al . Hypothyroidism disease diagnosis by using machine learning algorithms. Int J Intell Syst Appl Eng. (2023) 11:368–73.
13.
Rasool N Wani NA Bhat JI Saharan S Sharma VK Alsulami BS et al . CNN-TumorNet: leveraging explainability in deep learning for precise brain tumor diagnosis on MRI images. Front Oncol. (2025) 15:1554559. doi: 10.3389/fonc.2025.1554559
14.
Rezaeijo SM Chegeni N Baghaei Naeini F Makris D Bakas S . Within-modality synthesis and novel Radiomic evaluation of brain MRI scans. Cancer. (2023) 15:3565. doi: 10.3390/cancers15143565
15.
Khan SUR Asif S Bilal O Rehman HU . Lead-CNN: lightweight enhanced dimension reduction convolutional neural network for brain tumor classification. Int J Mach Learn Cyber. (2025) 8:6. doi: 10.1007/s13042-025-02637-6
16.
Aggarwal K Kartikeya K Srivastava V . Deep learning-driven CNN models for enhanced brain tumor classification In: SinghTPKumarCJAbrahamAIguluKT, editors. Revolutionizing healthcare: impact of artificial intelligence on diagnosis, treatment, and patient care studies in computational intelligence. Cham: Springer (2025)
17.
Litjens G Kooi T Bejnordi BE Setio AAA Ciompi F Ghafoorian M et al . A survey on deep learning in medical image analysis. Med Image Anal. (2017) 42:60–88. doi: 10.1016/j.media.2017.07.005
18.
Dintakurthi M. Biccavolu V. S. S. Srinivas M. Boge L. Sreeram G. D. , (2025) "Bridging the Diagnostic Gap: Classification of MRI-Based Brain Tumors Using a CNN and Transformer-Based Hybrid Deep Learning Method," International conference on artificial intelligence and data engineering (AIDE), AIDENitte, India, 182–187.
19.
Missaoui R Hechkel W Saadaoui W Helali A Leo M . Advanced deep learning and machine learning techniques for MRI brain tumor analysis: a review. Sensors. (2025) 25:2746. doi: 10.3390/s25092746
20.
Rezk NG Alshathri S Sayed A Hemdan EE-D El-Behery H . Secure hybrid deep learning for MRI-based brain tumor detection in smart medical IoT systems. Diagnostics. (2025) 15:639. doi: 10.3390/diagnostics15050639
21.
Anish JJ Ajitha D . Exploring the state-of-the-art algorithms for brain tumor classification using MRI data. IEEE Access. (2025) 13:118033–54. doi: 10.1109/ACCESS.2025.3579727
22.
Hasan M. Z. Tamim Abdullah Asadujjaman D.M. Rahman Mahfujur , (2025) "A CNN approach to automated detection and classification of brain tumors," International conference on electrical, computer and communication engineering (ECCE), Chittagong, Bangladesh, ECCE. 1–6.
23.
Taposh M. H. Abrar T G Amit R Mahfujur R Annas MN Rafeed R , "A lightweight CNN model for detecting brain tumors using MRI based image enhancement," 2025 4th international conference on robotics, electrical and signal processing techniques (ICREST), IEEE, Bangladesh, (2025), pp. 403–408.
24.
Rangaraj KS Sripathy SK Swarnalatha P . Enhanced transfer learning and CNN approach for brain tumor detection In: HamdanRK, editor. Sustainable data management studies in big data. eds ed. Cham: Springer (2025)
25.
DM V. Fathima G. , (2025). "Efficient medical image processing for tumour detection using hybrid CNN framework," 2025 International conference on inventive computation technologies (ICICT), IEEE, Nepal. 457–463.
26.
Naeem AB Senapati B Bhuva D Zaidi A Bhuva AP Islam Sudman MS et al . Heart disease detection using feature extraction and artificial neural networks: a sensor-based approach. IEEE Access. (2024) 12:37349–62. doi: 10.1109/access.2024.3373646
27.
Ansari MM Kumar S Heyat MBB Ullah H Bin Hayat MA Sumbul PS et al . SVMVGGNet-16: a novel machine and deep learning based approaches for lung Cancer detection using combined SVM and VGGNet-16. Curr Med Imaging. (2025) 21:e15734056348824. doi: 10.2174/0115734056348824241224100809
Summary
Keywords
MRI images, deep learning, medical diagnosis, computer-aided diagnosis, healthcare, neuroimaging
Citation
Naeem AB, Osman O, Alsubai S, Cevik T, Zaidi A and Rasheed J (2025) Lightweight CNN for accurate brain tumor detection from MRI with limited training data. Front. Med. 12:1636059. doi: 10.3389/fmed.2025.1636059
Received
27 May 2025
Accepted
18 August 2025
Published
29 August 2025
Volume
12 - 2025
Edited by
Deepti Deshwal, Maharaja Surajmal Institute of Technology, India
Reviewed by
Ahmad ALI, Shenzhen University, China
S. Suchitra, Vel Tech Rangarajan Dr.Sagunthala R&D Institute of Science and Technology, India
Updates
Copyright
© 2025 Naeem, Osman, Alsubai, Cevik, Zaidi and Rasheed.
This is an open-access article distributed under the terms of the Creative Commons Attribution License (CC BY). The use, distribution or reproduction in other forums is permitted, provided the original author(s) and the copyright owner(s) are credited and that the original publication in this journal is cited, in accordance with accepted academic practice. No use, distribution or reproduction is permitted which does not comply with these terms.
*Correspondence: Jawad Rasheed, jawad.rasheed@izu.edu.tr
†ORCID: Awad Bin Naeem, orcid.org/0000-0002-1634-7653Shtwai Alsubai, orcid.org/0000-0002-6584-7400Taner Cevik, orcid.org/0000-0001-9653-5832Abdelhamid Zaidi, orcid.org/0000-0003-1305-4959Jawad Rasheed, orcid.org/0000-0003-3761-1641
Disclaimer
All claims expressed in this article are solely those of the authors and do not necessarily represent those of their affiliated organizations, or those of the publisher, the editors and the reviewers. Any product that may be evaluated in this article or claim that may be made by its manufacturer is not guaranteed or endorsed by the publisher.