Abstract
Background:
Clinical trials of intensive glycemic control in patients with type 2 diabetes mellitus (T2DM) and high cardiovascular risk have reported inconsistent findings regarding chronic kidney disease (CKD) outcomes, partly due to heterogeneity in event definitions and reliance on conventional time-to-first-event analysis. This study aimed to evaluate the renal effects of intensive glycemic control using a hierarchical composite endpoint (HCE) ranked by clinical severity and analyzed via the Win Odds (WO) method.
Method:
This post-hoc analysis included patients from the Action to Control Cardiovascular Risk in Diabetes (ACCORD) glycemia trial. We employed the win ratio statistical method to estimate the treatment effects on HCE, defined as a ranked composite of all-cause mortality, kidney failure, sustained estimated glomerular filtration rate (eGFR) declines of 57, 50, and 40% from baseline, persistent eGFR < 15 mL/min/1.73 m2, and eGFR slope. The effects of intensive glycemic control on individual HCE components and various composite kidney endpoints was assessed by Cox regression models.
Results:
Among the 9,848 participants, sustained 40% eGFR decline was the most frequent renal event in the hierarchical composite. Intensive glucose control was not associated with a significant difference in the HCE compared to standard therapy (WO = 1.03, 95% CI: 0.99–1.07). This finding was consistent with results from Cox regression (HR = 1.05, 95% CI: 0.97–1.13) and across individual components of the composite endpoint.
Conclusion:
In individuals with T2DM at high risk for cardiovascular disease, intensive glycemic control does not demonstrate a significantly detrimental effect on hierarchical composite kidney outcomes.
1 Introduction
T2DM is a chronic condition associated with a range of serious complications, including kidney damage, and peripheral neuropathy (1–4). Effective management of blood glucose levels is crucial for mitigating these complications (5, 6). Although intensive glycemic control appears to confer a near-lifelong benefit of cardiovascular health (7), the growing use of novel pharmacological agents and combination therapies has raised concerns regarding potential adverse effects on renal function (8, 9).
The ACCORD trial focusing on the assessment of conventional kidney-related outcomes have found that intensive glucose-lowering therapy are effective in reducing the risk of early-stage renal dysfunction (microalbuminuria) (10). However, these interventions have not been shown to significantly impact the progression to advanced stage of kidney diseases (kidney failure and all-cause mortality) (11, 12). In addition, previous studies analyzing the impact of intensive glucose-lowering interventions on composite renal endpoints have predominantly focused on the first occurrence of any endpoint, neglecting the varying severity levels of different outcomes. Consequently, there remains a lack of robust evidence regarding the effects on renal system function.
To address the limitations of using conventional endpoints or composite endpoints without considering severity gradations, this study employs the WOs measure within the win ratio method, incorporating multiple indicators that reflect the progression of renal dysfunction from early stages to mortality, providing a more comprehensive assessment of the impact of intensive glycemic control throughout the progression of kidney disease.
2 Methods
2.1 Trial design and oversight
This study is a post hoc analysis of ACCORD BioLINCC dataset obtain from the NIH upon approval. The design and conduct of the randomized controlled ACCORD trial have been reported previously (13). Briefly, the ACCORD trial was a rigorously designed double two-by-two factorial study. Middle-aged individuals (mean age 62.2 years) diagnosed with diabetes at high cardiovascular risk were assigned to either intensive therapy that targeted HbA1c lower than 6% (42 mmol/mol) or standard group that targeted HbA1c 7–7.9% (53–63 mmol/mol). The ACCORD glycemia trial was halted prematurely after a mean duration of 3.7 years, due to the Data Safety Monitoring Board’s observation of higher mortality rates in the intensive glucose-lowering group (14). This analysis was approved by the institutional review board (IRB) of the participating institution, and the Ethical Review Board of the First Affiliated Hospital of Xi’an Jiaotong University waived the need for additional ethical approval (MC-KYLLSL-2023-005).
2.2 eGFR measurement and endpoint definitions
eGFR was calculated in a standardized manner using the Chronic Kidney Disease Epidemiology Collaboration creatinine equation (15). Participants from the ACCORD glycemia trial with baseline eGFR measurements and two or more follow-up eGFR data were included in analyses. We defined the HCE to capture the clinical severity of kidney outcomes, which encompass all-cause mortality, end-stage renal disease (ESRD) requiring renal replacement therapy or transplantation, a sustained eGFR of less than 15 mL/min/1.73 m2 for at least 30 days, sustained declines in eGFR of 57, 50%, or 40% (each confirmed by a subsequent measurement ≥30 days later), and the eGFR slope (16, 17). In accordance with KDIGO recommendations (18), sustained eGFR <15 mL/min/1.73 m2 was incorporated into the ESRD category in the hierarchical composite for Win Odds analysis. The analysis will be restricted to events and eGFR measurements up to a specified cut-off of 3 years following randomization. The acute event will be considered to have occurred at the initial visit, which is Day 14 (this will be divided by 360 to convert to years). The coefficient for the chronic phase will also be derived, which is the proportion of the length of the chronic phase (total follow-up minus the acute phase) divided by the total follow-up for an individual (19). This will be used to derive the total GFR slope from the two-slope power-of-the-mean model.
2.3 Statistical analysis
Baseline characteristics of participants were presented as frequencies with percentages, means with standard deviation, or medians with interquartile ranges. The HCE was analyzed using WOs, an adaptation of win ratio (20) to include ties (a tie is considered a half loss and a half win for each group). For each patient pair, the winner was identified sequentially based on the severity of clinical events, from the most severe to the least severe. If one patient experienced an event, that patient was deemed the winner, with earlier occurrence further conferring an advantage; if neither patient experienced an event, the pair was considered a tie (21). The hierarchical comparison of HCE components is provided in Supplementary Table 1.
WOs were computed by summing the wins and half of the ties, then dividing by the total losses plus half of the ties (22). Maraca plot was used to visualize the contribution of components of HCE over time, combining time-to-event outcomes with a continuous outcome (23). In the Maraca plot, the x-axis represents a consistent follow-up duration for each dichotomous outcome, arranged by severity. The continuous outcome covers the entire range of possible values. The width of each component corresponds to its proportional contribution to the composite outcome. The Win Odds framework accounts for clinical severity by applying a predefined hierarchical structure to composite outcomes. As part of the sensitivity analyses, the hierarchy was extended to include albuminuria components defined by the urinary albumin-to-creatinine ratio (uACR), including incident macroalbuminuria (uACR ≥300 mg/g) and microalbuminuria (uACR 30–299 mg/g), which were placed after sustained eGFR decline events. Cox proportional hazards models were also used to evaluate the effect of intensive versus standard intervention on the time to first event across binary components of HCE, with results presented as HRs and 95% CIs. A two-slope mixed-effects model was applied to evaluate treatment effects on overall eGFR slope, with results presented as means and 95% CIs. The Cumulative incidence functions and Kaplan–Meier (KM) curves were used to estimate the probability of achieving each HCE component. All analyses were performed using Stata version 18.0 and R version 4.4.2.
3 Results
After excluding participants without baseline eGFR data (n = 48) or those with fewer than two eGFR measurements (n = 355), the analysis included a total of 9,848 participants, comprising 4,931 in the standard treatment group and 4,917 in the intensive treatment group (Supplementary Figure 1).
The median age was 62.7 years, and 38.3% participants were female. In terms of disease history, 54.6% used aspirin, and 34.9% had a history of cardiovascular disease. The prevalence of dyslipidemia and hypertension was 94.2 and 96.4%, respectively. Baseline laboratory measurements showed a mean eGFR of 91.1 mL/min/1.73 m2, with 92.0% having an eGFR more than 60 mL/min/1.73 m2. Blood pressure, LDL, HDL, BMI, and glucose values were comparable across groups (Table 1).
Table 1
| Variable | Standard Group | Intensive Group | Total |
|---|---|---|---|
| (N = 4,931) | (N = 4,917) | (N = 9,848) | |
| Demography | |||
| Age | 62.75 (6.62) | 62.73 (6.61) | 62.74 (6.61) |
| Gender | |||
| Male | 3,044 (61.71) | 3,031 (61.64) | 6,075 (61.68) |
| Female | 1,889 (38.29) | 1,886 (38.36) | 3,775 (38.32) |
| Race | |||
| White | 3,098 (62.8) | 3,080 (62.64) | 6,178 (62.72) |
| Black | 911 (18.47) | 941 (19.14) | 1,852 (18.8) |
| Hispanic | 358 (7.26) | 341 (6.94) | 699 (7.1) |
| Other | 566 (11.47) | 555 (11.29) | 1,121 (11.38) |
| Education | |||
| High School | 1,318 (26.73) | 1,292 (26.29) | 2,610 (26.51) |
| College | 1,628 (33.02) | 1,609 (32.74) | 3,237 (32.88) |
| Bachelor | 1,315 (26.67) | 1,255 (25.54) | 2,570 (26.11) |
| Disease history | |||
| Aspirin | 2,682 (54.40) | 2,696 (54.83) | 5,378 (54.61) |
| Smoking | 575 (11.66) | 610 (12.41) | 1,185 (12.03) |
| Drinking | 1,202 (24.38) | 1,167 (23.74) | 2,369 (24.06) |
| Cardiovascular | 1,694 (34.35) | 1,739 (35.37) | 3,433 (34.86) |
| Dyslipidemia | 4,645 (94.16) | 4,639 (94.35) | 9,284 (94.25) |
| Hypertension | 4,740 (96.09) | 4,752 (96.64) | 9,492 (96.37) |
| Laboratory | |||
| eGFR, mL/min per 1.73 m2 | 91.36 (28.51) | 90.8 (25.75) | 91.08 (27.17) |
| eGFR (median, IQR) | 89.7 (76–105.1) | 89.5 (74.8–104.5) | 89.6 (75.4–104.8) |
| eGFR, mL/min per 1.73 m2 | |||
| ≥ 60 | 4,554 (92.32) | 4,510 (91.72) | 9,064 (92.02) |
| <60 | 377 (7.64) | 407 (8.28) | 784 (7.96) |
| SBP (mmHg.) | 136.43 (17.19) | 136.17 (16.87) | 136.3 (17.03) |
| DBP (mmHg) | 74.95 (10.68) | 74.77 (10.57) | 74.86 (10.62) |
| LDL C (mg/dL) | 104.91 (33.78) | 104.74 (33.82) | 104.82 (33.8) |
| HDL C (mg/dL) | 41.88 (11.39) | 41.79 (11.63) | 41.83 (11.51) |
| BMI (kg/m2) | 32.24 (5.38) | 32.24 (5.41) | 32.24 (5.39) |
| Glucose (mg/dL.) | 175.8 (56.34) | 174.65 (55.59) | 175.22 (55.97) |
| Potassium (mmol/L) | 4.47 (0.5) | 4.48 (0.44) | 4.47 (0.47) |
Baseline characteristics by randomized group.
Values are N (%) or mean (SD).
A decrease in eGFR slope is the main components in the HCE. Among participants in the intensive treatment group, the most frequently observed outcome was a decline in eGFR slope (56.1%), followed by a 40 and 50% reduction in eGFR. A similar trend was observed in the standard treatment group, where 55.3% of participants experienced a decline in eGFR slope. Severe eGFR declines to below 15 mL/min/1.73 m2 were rare, occurring in only 0.3% of participants in both groups (Figure 1).
Figure 1

Number (%) of individual components of the renal composite endpoint in the ACCORD study in all persons and in the intensive glycemic intervention and standard glycemic intervention groups. ACM, all-cause mortality; ESRD, end stage renal disease.
In this study, all patients who experienced persistent eGFR <15 mL/min/1.73 m2 ultimately progressed to ESRD. Therefore, this event was incorporated into the higher-priority ESRD tier and did not serve as an independent level of comparison in the Win Odds analysis. As shown in Figure 2, tie rates exceeded 54.28% for all components except eGFR slope, which had a lower tie percentage of 39.49%, indicating greater discriminatory power. Using a tie-adjusted formula, the overall Win Odds was 1.03 (95% CI, 0.99 to 1.07), suggesting a slightly favorable trend for the placebo group compared to the intensive treatment group in terms of the HCE.
Figure 2
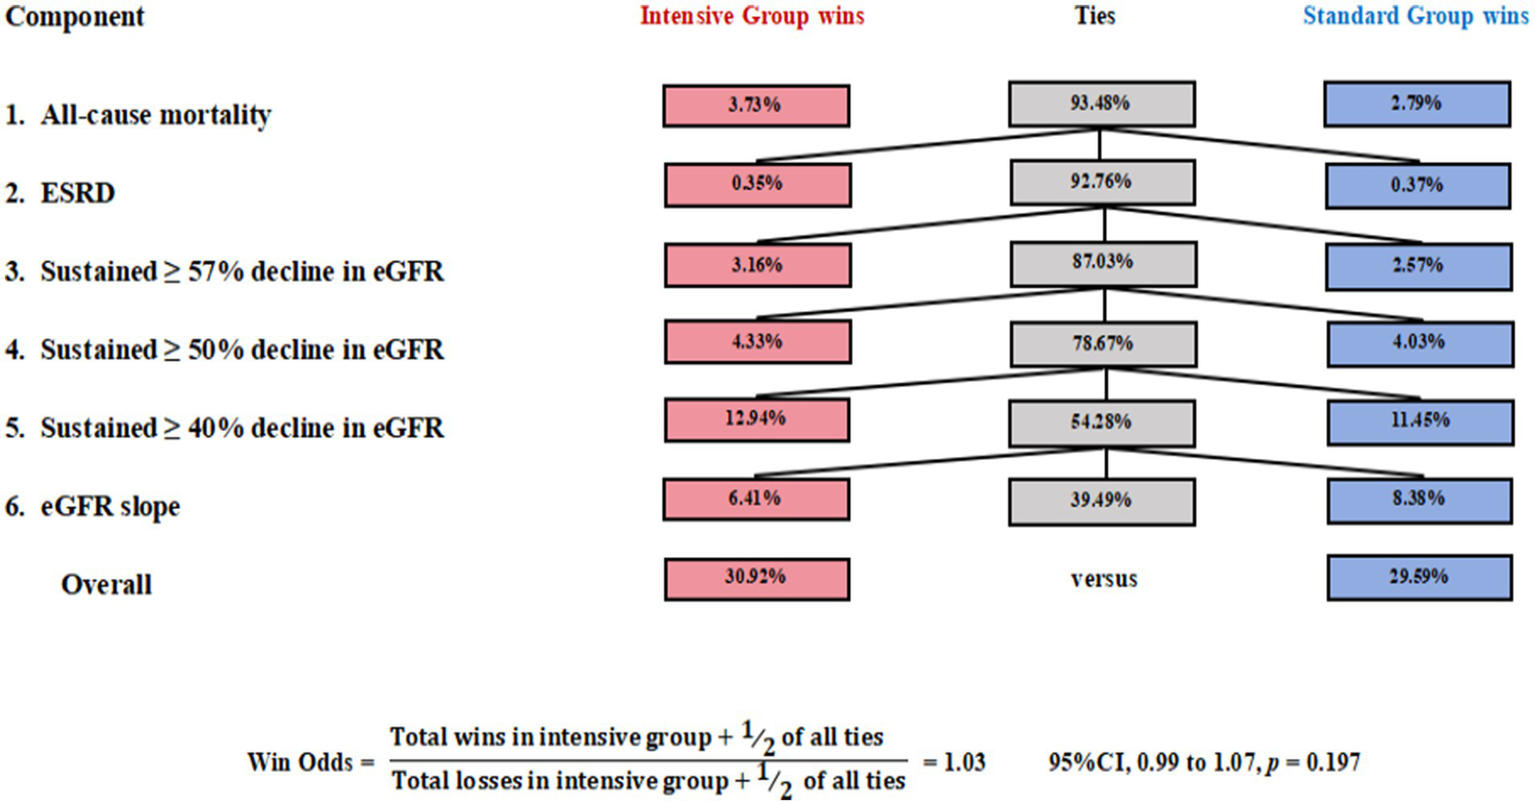
The Win Odds in the ACCORD trial. Win Odds were computed in a hierarchy: all-cause mortality; ESRD (including sustained eGFR <15 mL/min/1.73 m2); ≥57%, ≥50%, and ≥40% decline in eGFR; and eGFR slope. eGFR slope decline.
The Maraca plot demonstrates more dichotomous outcomes in the active group compared to placebo group, indicating that while the median rate of eGFR decline (shift to the right in the maraca plot) in active compared with the placebo group, the overall difference between groups was not statistically significant (Supplementary Figure 2).
Among 9,848 patients with type 2 diabetes at high cardiovascular risk receiving glucose-lowering therapy in the ACCORD trial, there were 1,987 cases of a 40% decline in eGFR, 840 cases of a 50% decline, 557 cases of a 57% decline, 33 cases of persistent eGFR < 15 mL/min/1.73 m2, 286 cases requiring dialysis, and 622 died. For the composite kidney outcome, which included all-cause mortality, ESRD, and a 40% eGFR decline, the HR was 1.05 (95%CI, 0.97 to 1.13). Similarly, for the composite endpoint including all-cause mortality, ESRD, and a 57% eGFR decline, the HR was 1.07 (95%CI, 0.97 to 1.18). When analyzing the composite outcome of all-cause mortality, ESRD, and a 50% decline in eGFR, the HR was 1.09 (95%CI, 0.98 to 1.22). The WO for the composite kidney outcome was 1.03 (95%CI, 0.99 to 1.07), again revealing no significant difference between the treatment groups (Table 2). Across multiple HCE definitions, almost no significant differences were observed between treatment groups. For the relatively comprehensive HCE (Tiers 1–8), the Win Odds was 1.00 (95% CI, 0.95 to 1.04), and the HR was 1.02 (95% CI, 0.95 to 1.08). When albuminuria-related components (Tiers 6 and 7) were included, treatment effects remained neutral. A slight benefit was observed for the combination of Tiers 7 and 8, with a Win Odds of 1.07 (95% CI, 1.02 to 1.12) (Supplementary Figure 4). Kaplan–Meier survival curves (Supplementary Figure 3) showed minimal divergence between the treatment groups for kidney-related events, supporting the conclusion that intensive glycemic control did not significantly affect kidney outcomes.
Table 2
| Treatment comparisons | Intensive vs. standard | |
|---|---|---|
| n | HR (95% CI) | |
| Event | ||
| Tier 1: All-cause mortality | 622 | 1.18 (1.01 to 1.38) |
| Tier 2: ESRD | 288 | 0.94 (0.74 to 1.18) |
| Tier 3: eGFR <15 mL/min per 1.73 m2 | 33 | 0.95 (0.48 to 1.88) |
| Tier 4: 57% eGFR decline | 557 | 1.11 (0.94 to 1.31) |
| Tier 5: 50% eGFR decline | 840 | 1.02 (0.89 to 1.17) |
| Tier 6: 40% eGFR decline | 1,987 | 1.02 (0.93 to 1.11) |
| Tier 7: eGFR slopea | −0.90 (−2.16 to 0.36) | |
| Treatment effect composite end point | ||
| HR (Tier 1 or 2 or 3 or 6) | 1.05 (0.97 to 1.13) | |
| HR (Tier 1 or 2 or 3 or 5) | 1.07 (0.97 to 1.18) | |
| HR (Tier 1 or 2 or 3 or 4) | 1.09 (0.98 to 1.22) | |
| HR (Tier 1 to 6) | 1.04 (0.97 to 1.12) | |
| WOsb | 1.03 (0.99 to 1.07) | |
Comparison of time to first event analysis and Win Odds.
aEstimated means (95% CIs) derived from the mixed-effects model. bWin Odds were computed in a hierarchy: all-cause mortality; ESRD; sustained eGFR <15 mL/min/1.73 m2; ≥57%, ≥50%, and ≥40% decline in eGFR; and eGFR slope.
4 Discussion
This study used the win ratio statistical method to compare the effects of intensive and standard glucose-lowering treatments on HCE, finding no significant difference. Further analyses using Cox modeling across various kidney outcome combinations of differing severity also showed no significant effects.
Some studies investigating intensive glycemic control in patients with T2DM have showed its effectiveness in reducing the risk of early kidney damage. Specifically, the ACCORD trial, ADVANCE trial and the EDIC study reported a lower incidence of microalbuminuria in the intensive treatment group compared to the conventional group (24–26). Likewise, R. Bilous’ analysis of the UKPDS found that tighter glycemic control reduced the relative risk of proteinuria and significantly lowered the proportion of patients with a twofold increase in plasma creatinine levels (27). Furthermore, in the VADT-F trial, a significantly higher proportion of participants in the intensive treatment group retained normal kidney function at study completion (28). Considering the above, the use of isolated and non-continuous renal endpoint endpoints without a clear severity ranking may cause heterogeneities (29). By employing HCE analysis in our study, we conducted a systematic assessment by integrating and hierarchically ranking multiple renal outcomes, including all-cause mortality, ESRD, eGFR decline, and eGFR slope, based on their clinical severity, revealing that intensive glycemic control does not exert significant adverse effects on renal function.
Moreover, while several studies have utilized composite renal outcomes, they predominantly relied on first-event analyses, which may overlook clinically more severe but later-occurring events, such as ESRD or mortality. For instance, a retrospective cohort study found that intensive glucose lowering did not reduce the risk of persistent eGFR below 15 mL/min/1.73 m2, doubling of serum creatinine levels, or ESRD (30). Similarly, a post hoc analysis of the ACCORD trial showed no significant reduction in the need for dialysis, or death from any cause in patients who received aggressive treatment (10). To address this limitation, our study utilized the WOs metric within the win ratio methodology, which prioritizes events based on clinical significance rather than chronological occurrence. This approach mitigates biases associated with traditional first-event analyses and is consistent with KDIGO and ERBP guidelines for standardized renal endpoint monitoring (18, 31, 32).
Our findings demonstrate the complementary strengths of Cox regression and the Win Odds approach in evaluating renal composite outcomes. While Cox models consider the time to first event irrespective of clinical severity, Win Odds emphasizes early and clinically significant events within a fixed 3-year window. This difference explains the limited contribution of rare but severe events, such as sustained eGFR <15 mL/min/1.73 m2, in the Win Odds analysis. Notably, when albuminuria components were incorporated into the hierarchy, Win Odds revealed modestly favorable trends, highlighting the sensitivity of uACR as an early indicator of kidney injury. This is consistent with previous findings, such as those by An et al. (33), which reported that intensive HbA1c reduction may coincide with short-term eGFR decline in patients with elevated uACR. Given the limited number of events for certain uACR-related tiers, this trend should be interpreted cautiously due to the potential for false-positive findings. Collectively, these results underscore the value of hierarchical composite frameworks for capturing nuanced treatment effects across heterogeneous renal outcomes and the importance of including sensitive markers like uACR in future endpoint definitions.
Although the use of a composite outcome strengthens the validity of our findings, the relatively homogeneous patient population may limit the generalizability of the results. Additionally, the relatively short follow-up period restricts the ability to comprehensively evaluate the long-term effects of intensive glycemic control on renal function. Finally, the inclusion of renal status may be incomplete in our study, underscoring the need for more comprehensive assessments in future research.
5 Conclusion
Using hierarchical definitions for kidney endpoints, this study found no significant difference between the intensive and standard glucose-lowering groups. Sensitivity analyses consistently supported this conclusion, suggesting that intensive glycemic control may not provide a clear advantage over standard treatment in improving renal outcomes.
Statements
Data availability statement
The individual-level, de-identified participant data from the Action to Control Cardiovascular Risk in Diabetes (ACCORD) trial are publicly available through the Biologic Specimen and Data Repository Information Coordinating Center (BioLINCC). The dataset can be accessed at: https://biolincc.nhlbi.nih.gov/studies/accord/Repository: BioLINCC (NHLBI) Accession Number: 2003-001.
Ethics statement
Ethical approval was not required for the study involving humans in accordance with the local legislation and institutional requirements. Written informed consent to participate in this study was not required from the participants or the participants’ legal guardians/next of kin in accordance with the national legislation and the institutional requirements.
Author contributions
ZS: Conceptualization, Formal analysis, Writing – original draft, Methodology. HX: Formal analysis, Writing – original draft, Methodology, Conceptualization. JZ: Investigation, Data curation, Writing – review & editing, Conceptualization. YL: Writing – review & editing, Data curation, Conceptualization, Investigation. CL: Formal analysis, Visualization, Funding acquisition, Methodology, Writing – review & editing. TC: Software, Writing – review & editing, Methodology, Formal analysis. SG: Writing – review & editing, Validation, Project administration, Supervision. NZ: Resources, Supervision, Project administration, Writing – review & editing, Validation.
Funding
The author(s) declare that financial support was received for the research and/or publication of this article. This study was supported, in part, by funds from the National Natural Science Foundation of China (no. 82322060) to CL.
Acknowledgments
The authors would like to thank the funding agency National Natural Science Foundation of China for supporting our research. The authors gratefully acknowledge the ACCORD investigators, study teams, and participants for their contributions in making these data available for secondary analysis.
Conflict of interest
HX was employed by Shaannxi International Trust Limited-Liability Company.
The remaining authors declare that the research was conducted in the absence of any commercial or financial relationships that could be construed as a potential conflict of interest.
Generative AI statement
The authors declare that no Gen AI was used in the creation of this manuscript.
Publisher’s note
All claims expressed in this article are solely those of the authors and do not necessarily represent those of their affiliated organizations, or those of the publisher, the editors and the reviewers. Any product that may be evaluated in this article, or claim that may be made by its manufacturer, is not guaranteed or endorsed by the publisher.
Supplementary material
The Supplementary material for this article can be found online at: https://www.frontiersin.org/articles/10.3389/fmed.2025.1636392/full#supplementary-material
References
1.
Crawford AL Laiteerapong N . Type 2 diabetes. Ann Intern Med. (2024) 177:ITC81-96. doi: 10.7326/AITC202406180
2.
American Diabetes Association . Chronic kidney disease and risk management: standards of care in diabetes—2024. Diabetes Care. (2024) 47:S219–30. doi: 10.2337/dc22-S011
3.
Kim DL Lee SE Kim NH . Renal protection of mineralocorticoid receptor antagonist, finerenone, in diabetic kidney disease. Endocrinol Metab. (2023) 38:43–55. doi: 10.3803/EnM.2022.1629
4.
Soheilipour F Abbasi KN Imankhan M Eskandari D . Complications and treatment of early-onset type 2 diabetes. Int J Endocrinol Metab. (2023) 21:e135004. doi: 10.5812/ijem-135004
5.
Lachin JM Nathan DM . Understanding metabolic memory: the prolonged influence of glycemia during the diabetes control and complications trial (DCCT) on future risks of complications during the study of the epidemiology of diabetes interventions and complications (EDIC). Diabetes Care. (2021) 44:2216–24. doi: 10.2337/dc20-3097
6.
Lind M Imberg H Coleman RL Nerman O Holman RR . Historical hba(1c) values may explain the type 2 diabetes legacy effect: ukpds 88. Diabetes Care. (2021) 44:2231–7. doi: 10.2337/dc20-2439
7.
Adler AI Coleman RL Leal J Whiteley WN Clarke P Holman RR . Post-trial monitoring of a randomised controlled trial of intensive glycaemic control in type 2 diabetes extended from 10 years to 24 years (ukpds 91). Lancet. (2024) 404:145–55. doi: 10.1016/S0140-6736(24)00537-3
8.
van Raalte DH Bjornstad P Cherney DZI de Boer IH Fioretto P Gordin D et al . Combination therapy for kidney disease in people with diabetes mellitus. Nat Rev Nephrol. (2024) 20:433–46. doi: 10.1038/s41581-024-00827-z
9.
Tong L Adler S . Glycemic control of type 2 diabetes mellitus across stages of renal impairment: information for primary care providers. Postgrad Med. (2018) 130:381–93. doi: 10.1080/00325481.2018.1457397
10.
Mottl AK Buse JB Ismail-Beigi F Sigal RJ Pedley CF Papademetriou V et al . Long-term effects of intensive glycemic and blood pressure control and fenofibrate use on kidney outcomes. Clin J Am Soc Nephrol. (2018) 13:1693–702. doi: 10.2215/CJN.06200518
11.
Lo C Zoungas S . Intensive glucose control in patients with diabetes prevents onset and progression of microalbuminuria, but effects on end-stage kidney disease are still uncertain. Evid Based Med. (2017) 22:219–20. doi: 10.1136/ebmed-2017-110806
12.
Lee DH . The beneficial effect of glycemic control against adverse outcomes in patients with type 2 diabetes mellitus and chronic kidney disease. Diabetes Metab J. (2023) 47:484–6. doi: 10.4093/dmj.2023.0165
13.
Buse JB Bigger JT Byington RP Cooper LS Cushman WC Friedewald WT et al . Action to control cardiovascular risk in diabetes (accord) trial: design and methods. Am J Cardiol. (2007) 99:21i–33i. doi: 10.1016/j.amjcard.2007.03.003
14.
Papademetriou V Lovato L Doumas M Nylen E Mottl A Cohen RM et al . Chronic kidney disease and intensive glycemic control increase cardiovascular risk in patients with type 2 diabetes. Kidney Int. (2015) 87:649–59. doi: 10.1038/ki.2014.296
15.
Levey AS Stevens LA Schmid CH Zhang YL Castro AR Feldman HI et al . A new equation to estimate glomerular filtration rate. Ann Intern Med. (2009) 150:604–12. doi: 10.7326/0003-4819-150-9-200905050-00006
16.
Heerspink H Jongs N Schloemer P Little DJ Brinker M Tasto C et al . Development and validation of a new hierarchical composite end point for clinical trials of kidney disease progression. J Am Soc Nephrol. (2023) 34:2025–38. doi: 10.1681/ASN.0000000000000243
17.
Sugawara Y Kanda E Ohsugi M Ueki K Kashihara N Nangaku M . Egfr slope as a surrogate endpoint for end-stage kidney disease in patients with diabetes and egfr > 30 ml/min/1.73 m(2) in the j-dreams cohort. Clin Exp Nephrol. (2024) 28:144–52. doi: 10.1007/s10157-023-02408-z
18.
Kidney Disease: Improving Global Outcomes (KDIGO) CKD Work Group . KDIGO 2024 clinical practice guideline for the evaluation and management of chronic kidney disease. Kidney Int. (2024) 105:S117–314. doi: 10.1016/j.kint.2023.10.018
19.
Vonesh E Tighiouart H Ying J Heerspink HL Lewis J Staplin N et al . Mixed-effects models for slope-based endpoints in clinical trials of chronic kidney disease. Stat Med. (2019) 38:4218–39. doi: 10.1002/sim.8282
20.
Song J Verbeeck J Huang B Hoaglin DC Gamalo-Siebers M Seifu Y et al . The win odds: statistical inference and regression. J Biopharm Stat. (2023) 33:140–50. doi: 10.1080/10543406.2022.2089156
21.
Monzo L Levy B Duarte K Baudry G Combes A Ouattara A et al . Use of the win ratio analysis in critical care trials. Am J Respir Crit Care Med. (2024) 209:798–804. doi: 10.1164/rccm.202309-1644CP
22.
Brunner E Vandemeulebroecke M Mutze T . Win odds: an adaptation of the win ratio to include ties. Stat Med. (2021) 40:3367–84. doi: 10.1002/sim.8967
23.
Karpefors M Lindholm D Gasparyan SB . The maraca plot: a novel visualization of hierarchical composite endpoints. Clin Trials. (2023) 20:84–8. doi: 10.1177/17407745221134949
24.
Charu V Liang JW Chertow GM Li J Montez-Rath ME Geldsetzer P et al . Heterogeneous treatment effects of intensive glycemic control on kidney microvascular outcomes and mortality in accord. J Am Soc Nephrol. (2024) 35:216–28. doi: 10.1681/ASN.0000000000000272
25.
Tian J Ohkuma T Cooper M Harrap S Mancia G Poulter N et al . Effects of intensive glycemic control on clinical outcomes among patients with type 2 diabetes with different levels of cardiovascular risk and hemoglobin a(1c) in the advance trial. Diabetes Care. (2020) 43:1293–9. doi: 10.2337/dc19-1817
26.
de Boer IH Sun W Gao X Cleary PA Lachin JM Molitch ME et al . Effect of intensive diabetes treatment on albuminuria in type 1 diabetes: long-term follow-up of the diabetes control and complications trial and epidemiology of diabetes interventions and complications study. Lancet Diabetes Endocrinol. (2014) 2:793–800. doi: 10.1016/S2213-8587(14)70155-X
27.
Bilous R . Microvascular disease: what does the ukpds tell us about diabetic nephropathy?Diabet Med. (2008) 25:25–9. doi: 10.1111/j.1464-5491.2008.02496.x
28.
Agrawal L Azad N Bahn GD Ge L Reaven PD Hayward RA et al . Long-term follow-up of intensive glycaemic control on renal outcomes in the veterans affairs diabetes trial (vadt). Diabetologia. (2018) 61:295–9. doi: 10.1007/s00125-017-4473-2
29.
Little DJ Gasparyan SB Schloemer P Jongs N Brinker M Karpefors M et al . Validity and utility of a hierarchical composite end point for clinical trials of kidney disease progression: a review. J Am Soc Nephrol. (2023) 34:1928–35. doi: 10.1681/ASN.0000000000000244
30.
Kornelius E Lo SC Huang CN Wang YH Yang YS . Association of blood glucose and renal end points in advanced diabetic kidney disease. Diabetes Res Clin Pract. (2020) 161:108011. doi: 10.1016/j.diabres.2020.108011
31.
Verbeeck J De Backer M Verwerft J Salvaggio S Valgimigli M Vranckx P et al . Generalized pairwise comparisons to assess treatment effects: jacc review topic of the week. J Am Coll Cardiol. (2023) 82:1360–72. doi: 10.1016/j.jacc.2023.06.047
32.
Clodi M Abrahamian H Brath H Schernthaner G Brix J Ludvik B et al . Antihyperglycemic treatment guidelines for diabetes mellitus type 2 (update 2023). Wien Klin Wochenschr. (2023) 135:32–44. doi: 10.1007/s00508-023-02186-4
33.
An L Yu Q Chen L Tang H Liu Y Yuan Q et al . The association between the decline of egfr and a reduction of hemoglobin a(1c) in type 2 diabetic patients. Front Endocrinol. (2021) 12:723720. doi: 10.3389/fendo.2021.723720
Summary
Keywords
type 2 diabetes mellitus, intensive glycemic control, diabetic kidney disease, hierarchical composite endpoint, cardiovascular risk, cardio-renal syndrome, Win Odds
Citation
Song Z, Xu H, Zhang J, Liu Y, Li C, Chen T, Guo S and Zhu N (2025) Intensive glycemic control and kidney disease risk: insights on hierarchical composite endpoint from a randomized clinical trial. Front. Med. 12:1636392. doi: 10.3389/fmed.2025.1636392
Received
29 May 2025
Accepted
29 July 2025
Published
03 September 2025
Volume
12 - 2025
Edited by
Giuseppe Armentaro, University of Magna Graecia, Italy
Reviewed by
Zhijun Huang, Central South University, China
Roger D. Jones, Ca ‘Foscari University of Venice, Italy
Updates
Copyright
© 2025 Song, Xu, Zhang, Liu, Li, Chen, Guo and Zhu.
This is an open-access article distributed under the terms of the Creative Commons Attribution License (CC BY). The use, distribution or reproduction in other forums is permitted, provided the original author(s) and the copyright owner(s) are credited and that the original publication in this journal is cited, in accordance with accepted academic practice. No use, distribution or reproduction is permitted which does not comply with these terms.
*Correspondence: Sujuan Guo, guosujuan820206@163.com; Ni Zhu, zhuni789@163.com
†These authors have contributed equally to this work
Disclaimer
All claims expressed in this article are solely those of the authors and do not necessarily represent those of their affiliated organizations, or those of the publisher, the editors and the reviewers. Any product that may be evaluated in this article or claim that may be made by its manufacturer is not guaranteed or endorsed by the publisher.