 Mingjun Gao†
 Qi Zhao
- Department of Ophthalmology, The Second Affiliated Hospital of Dalian Medical University, Dalian, China
Purpose: This study aimed to investigate longitudinal changes in ocular parameters and develop a machine learning-based model for predicting myopia onset and shift within 1 year in school-aged premyopic children.
Methods: This prospective cohort study enrolled 320 premyopic children aged 6–12 years from the Ophthalmology Clinic of The Second Affiliated Hospital of Dalian Medical University. Uncorrected visual acuity (logMAR), cycloplegic spherical equivalent (SE), axial length (AL), average corneal curvature (CC), and subfoveal choroidal thickness (SFCT) were measured at baseline and 6-month intervals for 12 months. Premyopia was defined as - 0.50 D < SE ≤ + 0.75 D. A multivariable analysis evaluated predictive factors including age, gender, parental myopia, baseline SE, AL, CC, axial length/corneal radius (AL/CR), and SFCT. Machine learning algorithms were used to predict 1-year myopia onset and myopia shift, along with Shapley Additive exPlanations (SHAP) interpretation.
Results: Among 284 participants (88.8% retention rate), 141 children (49.3%) developed myopia. The cohort exhibited an annual SE progression of −0.695 ± 0.222 D and AL elongation of 0.356 ± 0.122 mm. The AL/CR increased from 2.986 ± 0.061 to 3.029 ± 0.072 (p < 0.001), while SFCT demonstrated a significant reduction of 21.535 ± 9.731 μm (p < 0.001). The optimal model achieved an AUC-ROC of 0.963 (95% CI: 0.930–0.997) for myopia onset prediction, with baseline SE emerging as the most significant predictor, followed by parental myopia, SFCT, and age. Meanwhile, our algorithm also achieved clinically acceptable 1-year predictions of SE.
Conclusion: Premyopic children exhibited accelerated myopic progression. Our machine learning-based predictive models showed promising performance for myopia onset and myopia shift, providing clinically valuable risk stratification for targeted prevention strategies.
1 Introduction
Myopia has become a major global public health issue, especially in East Asia. Among Chinese children and adolescents, its prevalence shows an annual increase, increasing from 55.5% in 2010 to 60.1% in 2019, with the peak age of onset dropping from 12 years old in 2010 to 7 years old in 2019 (1). An earlier onset of myopia is associated with a higher risk of developing more severe myopia in adulthood. The rapid increase in high myopia cases, coupled with population aging, suggests a potential dramatic increase in vision-impaired pathologic myopia over the coming decades (2), underscoring the critical importance of predicting the risk of myopia and implementing early interventions.
To enable early intervention in children at imminent risk of myopia onset, the International Myopia Institute (IMI) introduced the concept of “premyopia” in 2019. This condition is defined as a refractive state with a spherical equivalent between −0.50 D and +0.75 D. When combined with baseline refraction, age, and other quantifiable risk factors, these factors indicate a sufficient likelihood of future myopia development to warrant preventive intervention (3). This definition has been consistently adopted in the IMI white papers on myopia management in 2021 and 2023 (4, 5).
Premyopia represents a substantial proportion of children. The Ireland Eye Study (IES) reported a premyopia prevalence of 32.4% among schoolchildren aged 6–7 years (6), while a Spanish study documented a prevalence of 42.4% among children aged 5–7 years (7). In China, a study conducted in Shanghai found a premyopia prevalence of 21.9% among school-aged children, which significantly exceeded the prevalence of myopia (2.8%) (8). In Taiwan, the prevalence of premyopia reached 52% among preschool children (9). Children in the premyopic phase often exhibit no significant visual impairment and lack subjective complaints, leading to frequent oversight by their parents.
A previous study has shown that the axial length of the eye grows rapidly before myopia onset (10). Furthermore, the rate of myopic shift and axial elongation in the year preceding myopia onset exceeds that observed in children with myopia (11). Therefore, premyopia represents a critical period characterized by rapid axial elongation and heightened myopia risk, while also constituting a vital window for management and early intervention.
Although established methods effectively control myopia progression, they carry potential side effects. The necessity of early clinical intervention for all premyopic cases remains uncertain. Consequently, identifying individuals at the highest risk who warrant early treatment is clinically imperative. Rational and effective premyopia management could shift the focus of myopia control earlier, thereby mitigating myopia onset and progression.
Machine learning (ML), an automated approach to data analysis for model building, surpasses traditional linear regression by effectively managing complex non-linear relationships and delivering superior predictive performance. In ophthalmology, ML is applied in areas such as disease diagnosis, severity grading, and progression prediction (12). Notable examples include its role in diagnosing diabetic retinopathy (13), predicting myopia progression (14, 15), customizing contact lens parameters (16, 17), and forecasting visual acuity outcomes following treatment for neovascular age-related macular degeneration (18). Various ML algorithms are available, each with unique strengths and limitations. Random forest, a supervised learning algorithm, is extensively used in classification and regression tasks and serves as the foundation of many modern machine learning systems. Although there is a tendency for overfitting, this risk can be minimized by careful system design.
Therefore, this prospective observational study aims to investigate the characteristics of myopia progression in school-aged premyopic children. Leveraging baseline clinical data and ML techniques, the study further aims to predict myopia onset and myopic shift in this population, identify potential risk factors for myopia development, and accurately stratify high-risk premyopic children to guide clinical interventions.
2 Methods
2.1 Study population
This prospective longitudinal observational study enrolled premyopic children aged 6–12 years at the Ophthalmology Clinic of The Second Affiliated Hospital of Dalian Medical University between September 2023 and March 2024. The study protocol was approved by the Ethics Committee of The Second Hospital of Dalian Medical University and adhered to the tenets of the Declaration of Helsinki. Written informed consent was obtained from the parents or legal guardians of all participants.
2.2 Sample size
Based on clinical relevance, model generalizability, and measurement feasibility, nine variables—gender, age, parental myopia, and standard ophthalmic parameters—were included, with an events-per-variable (EPV) ratio set at 10. Based on prior literature indicating a 1-year myopia incidence rate of approximately one-third in premyopia (19), a total of 320 subjects were recruited, accounting for a 15% attrition rate and the requirements for model accuracy.
2.3 Inclusion and exclusion criteria
All participants met the following inclusion criteria: children aged 6–12 years with cycloplegic spherical equivalent refraction ≤ + 0.75 D and > − 0.50 D in both eyes, astigmatism or anisometropia of −1.00 D or less in both eyes, best-corrected distance visual acuity of 0.20 logMAR or better in both eyes, intraocular pressure (IOP) of less than 21 mmHg, and legal guardians who fully comprehended the study and provided signed informed consent. The exclusion criteria were as follows: children with other ocular diseases (e.g., strabismus, amblyopia, cataract, other media opacities, or ocular tumors), previous or current treatment with myopia control interventions (e.g., atropine and multifocal spectacles), inability to cooperate with ophthalmic examinations, or inability to complete two follow-up visits due to geographical constraints.
2.4 Study procedures
No clinical intervention was performed. Standard myopia prevention education was provided during visits, including limiting continuous near work to ≤40 min per session and ensuring ≥10 h of weekly outdoor sunlight exposure. Baseline and 6- and 12-month follow-up data included sex, age, parental myopia history, uncorrected visual acuity (UCVA), cycloplegic spherical equivalent refraction (SE), axial length (AL), subfoveal choroidal thickness (SFCT), average corneal curvature (CC), and axial length-to-corneal radius ratio (AL/CR). These parameters were analyzed to develop prediction models for 1-year SE progression and myopia onset.
Children exhibiting UCVA >logMAR 0.2 in both eyes during follow-up were prescribed single-vision spectacles for classroom use. SE was calculated as the sphere plus half of the cylindrical power. Myopia was defined as SE ≤ −0.50 D.
SE was measured three times using an autorefractor (ARK-1, NIDEK, Japan), with the average calculated. All 3 readings should be at most 0.25D apart in both the spherical and cylinder components. Three drops of 1% cyclopentolate (Alcon) were instilled at 5-min intervals. Refraction was performed 30 min after the last drop. A fourth drop was administered if the pupillary light reflexes persisted or pupil size was <6.0 mm 15 min post-instillation.
CC and AL were measured three times using the Lenstar LS900 (Haag-Streit, Switzerland), and averages were recorded. AL/CR = AL (mm) × mean CC (D)/337.5.
UCVA was measured using a logMAR chart (VSK-VC-Y; WeiShiKang, Guangzhou, China).
SFCT was measured vertically from Bruch’s membrane to the choroid–scleral interface at the foveal center using OCT (Cirrus HD-OCT 5000; Carl Zeiss, Germany). OCT imaging was conducted at similar time points to minimize diurnal variation. All scans were acquired without any cycloplegia.
2.5 Statistical analysis
Statistical analyses were performed using SPSS (version 27.0) and Python statsmodels (version 0.13.2). Continuous variables were analyzed using independent samples t-tests and Wilcoxon rank-sum tests, while categorical variables were assessed using chi-squared tests. Within-group changes were evaluated using repeated-measures analysis of variance (ANOVA). A p-value of < 0.05 was deemed statistically significant.
2.6 Algorithm design
We developed a machine learning-based binary classification model to predict 1-year myopia incidence and a regression model to predict SE at follow-up, using clinically collected metrics. The dataset was split into 70% for training and 30% for testing using a stratified random sampling approach. Stratification was based on the outcome variable (myopia onset) to ensure a similar distribution of events between the sets. This split ratio is conventional in machine learning and was deemed adequate given the number of features and events, thereby helping to mitigate overfitting while maintaining sufficient power for validation.
2.6.1 Classification model development and evaluation
Univariate and multivariate logistic regression analyses were used to find significant clinical predictors of myopia onset. Features with a p-value of < 0.05 in the multivariate analysis were incorporated into machine learning algorithms. Five algorithms, Logistic Regression (LR), Naïve Bayes (NB), Decision Tree (DT), Random Forest (RF), and Support Vector Machine (SVM), were comprehensively evaluated to optimize myopia-onset prediction performance. The diverse algorithmic spectrum ensured robust capture of complex data patterns. We used a 5-fold cross-validation (cv. = 5) combined with a grid search (GridSearchCV) technique to identify the optimal hyperparameters and prevent overfitting. The best set of hyperparameters identified through the above cross-validation process was used to train a final model on the entire 70% training set. This final model was then evaluated on the completely unseen 30% test set. Test-set performance metrics included accuracy, precision, recall, F1-score, and area under the receiver operating characteristic curve (AUC) (20). We combined Shapley Additive exPlanations (SHAP) feature importance with correlation coefficients to visualize each feature’s predictive contribution.
2.6.2 Regression model development and evaluation
Random Forest Regressor was used for regression tasks. Hyperparameters were optimized via grid search (GridSearchCV) to enhance predictive performance. Features were scaled to [0, 1] using min–max normalization to improve the model efficacy. Five-fold cross-validation (cv. = 5) mitigated overfitting, and parallel processing (n_jobs = −1) accelerated the computations.
The optimized model was trained on the training set. The model performance was quantified using the mean squared error (MSE), mean absolute error (MAE), root mean squared error (RMSE), and coefficient of determination (R2) between the predicted and actual SE values across the training and test sets, ensuring generalizability.
3 Results
3.1 Baseline characteristics of premyopic children
Table 1 presents the baseline characteristics of the study cohort. A total of 284 school-aged premyopic children completed the 1-year follow-up (attrition rate: 11.3%).
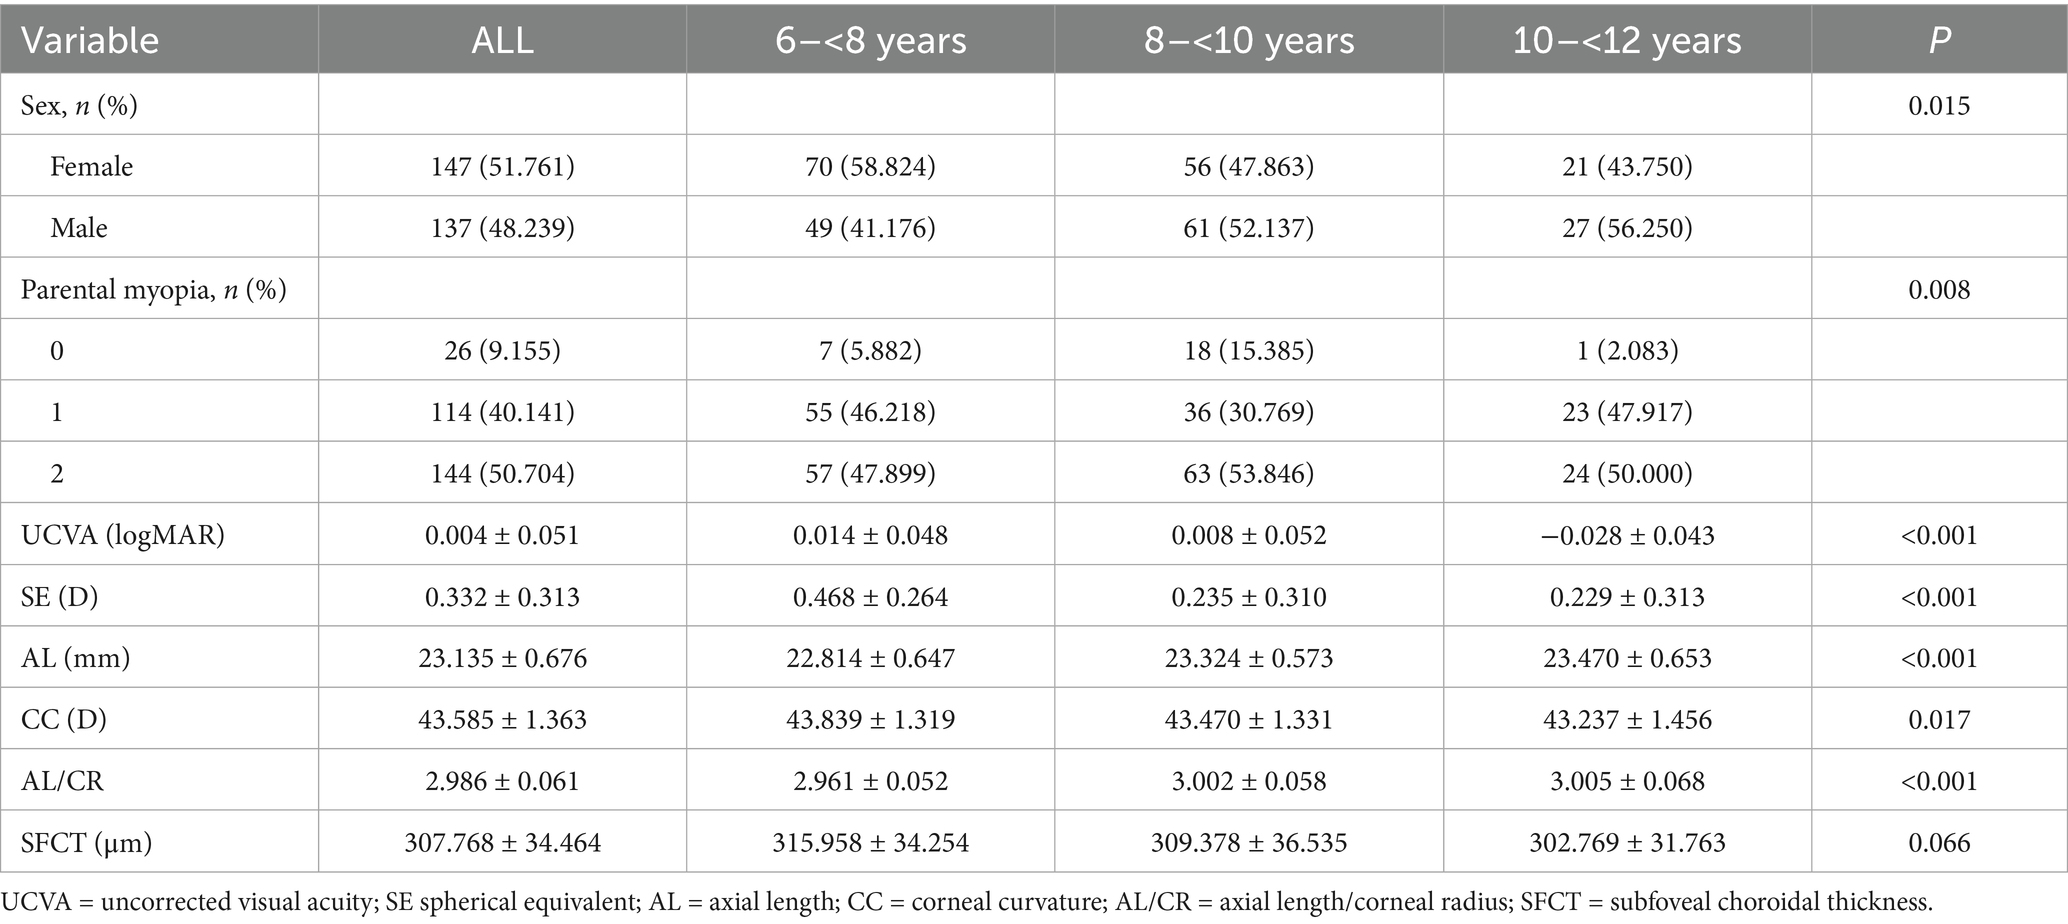
Table 1. Characteristics of premyopia children who were included in the study at baseline (n = 284).
3.2 Myopia progression in Premyopic children over 1 year
After 1 year, 141 children developed myopia (incidence rate: 49.3%), with the rate being 51.7% (76/147) among female and 47.4% (65/137) among male children. The mean annual refractive progression was −0.695 ± 0.222 D, with a mean axial elongation of 0.356 ± 0.122 mm. The corneal curvature did not show any significant changes. The AL/CR increased from 2.986 ± 0.061 at baseline to 3.029 ± 0.072. SFCT decreased significantly by 21.535 ± 9.731 μm during the follow-up period (Table 2).
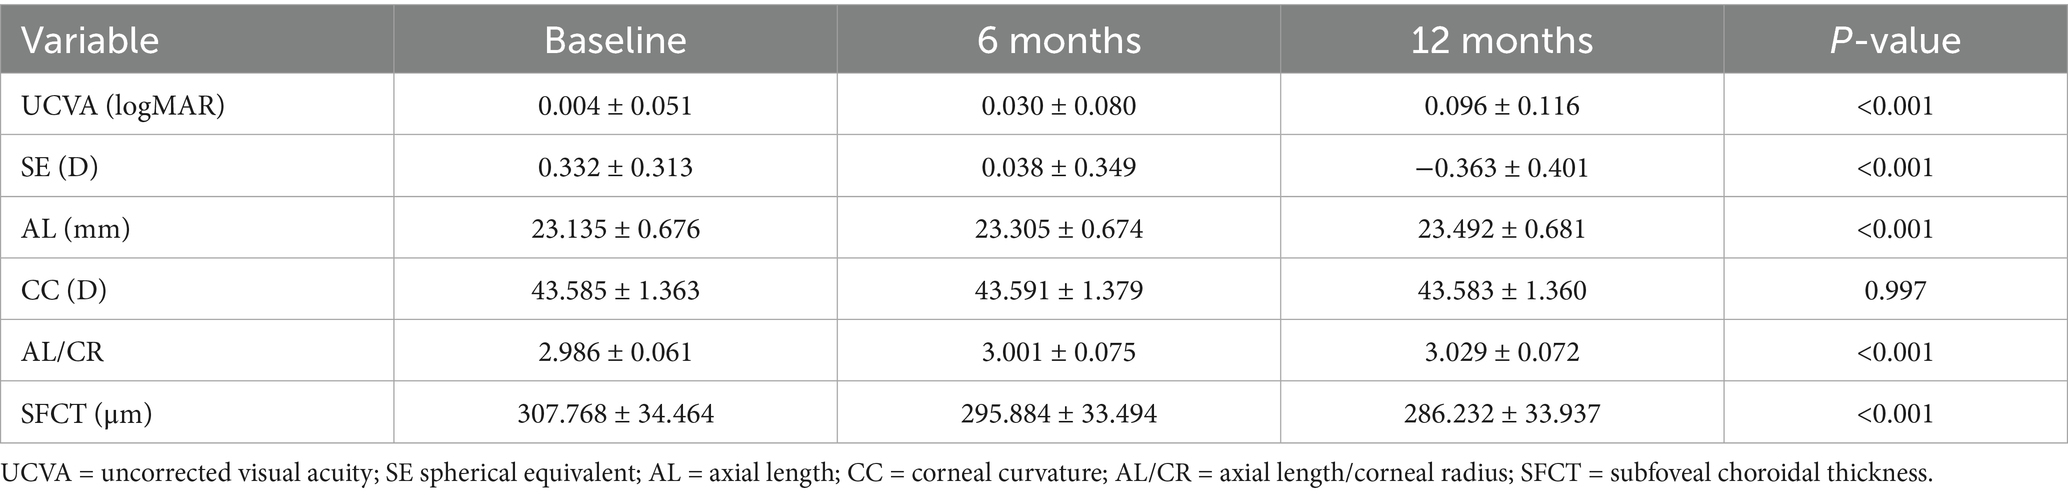
Table 2. Changes in ocular parameters during the follow-up stage.
3.3 Myopia onset prediction
There was no statistically significant difference in the baseline characteristics between the test and training sets, ensuring no bias between the groups (Supplementary Table 1). Univariate and multivariate logistic regression analyses identified significant features in the training set. Features with a p-value of < 0.05 in the multivariate analysis—baseline SE, SFCT, age, and parental myopia—were incorporated into the machine learning prediction models (Supplementary Table 2).
The performance metrics of the five clinical models were compared. The DT underperformed on the test set, particularly in terms of sensitivity and recall, suggesting potential overfitting. LR and NB showed consistent performance across the training and test sets, though AUC and accuracy were slightly lower in the test set. SVM demonstrated strong training performance but a modest decline in testing. RF achieved a high AUC with balanced precision and recall in both sets (Figure 1 and Table 3).
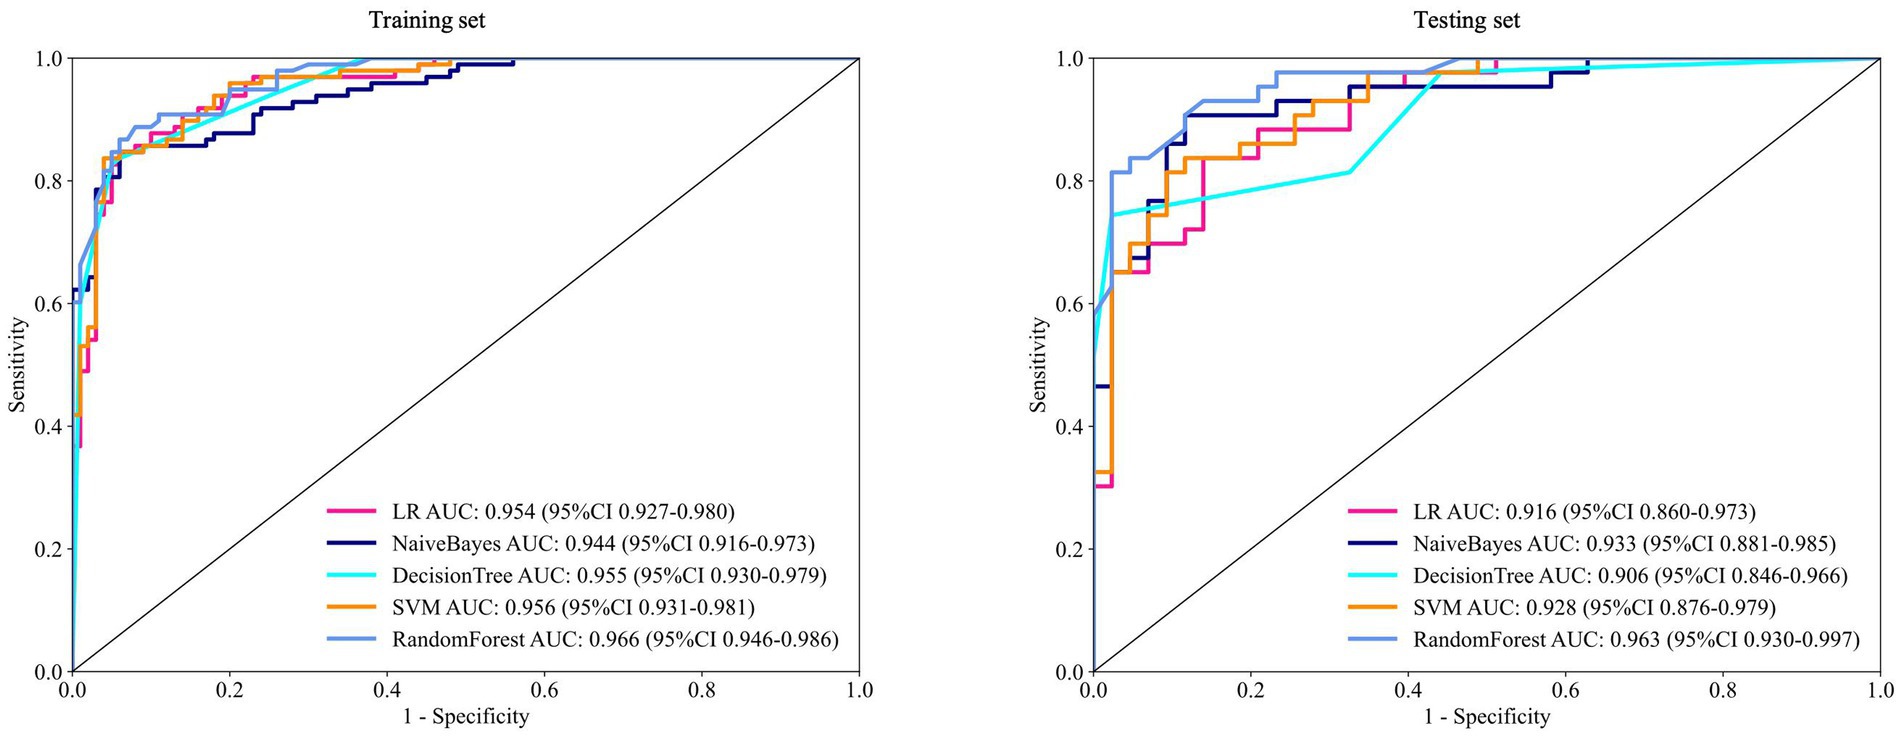
Figure 1. ROC of five machine learning algorithms for predicting the risk of myopia onset at 12 months in the training and test sets. ROC = receiver operating characteristic curve; AUC = area under the receiver operating characteristic curve.
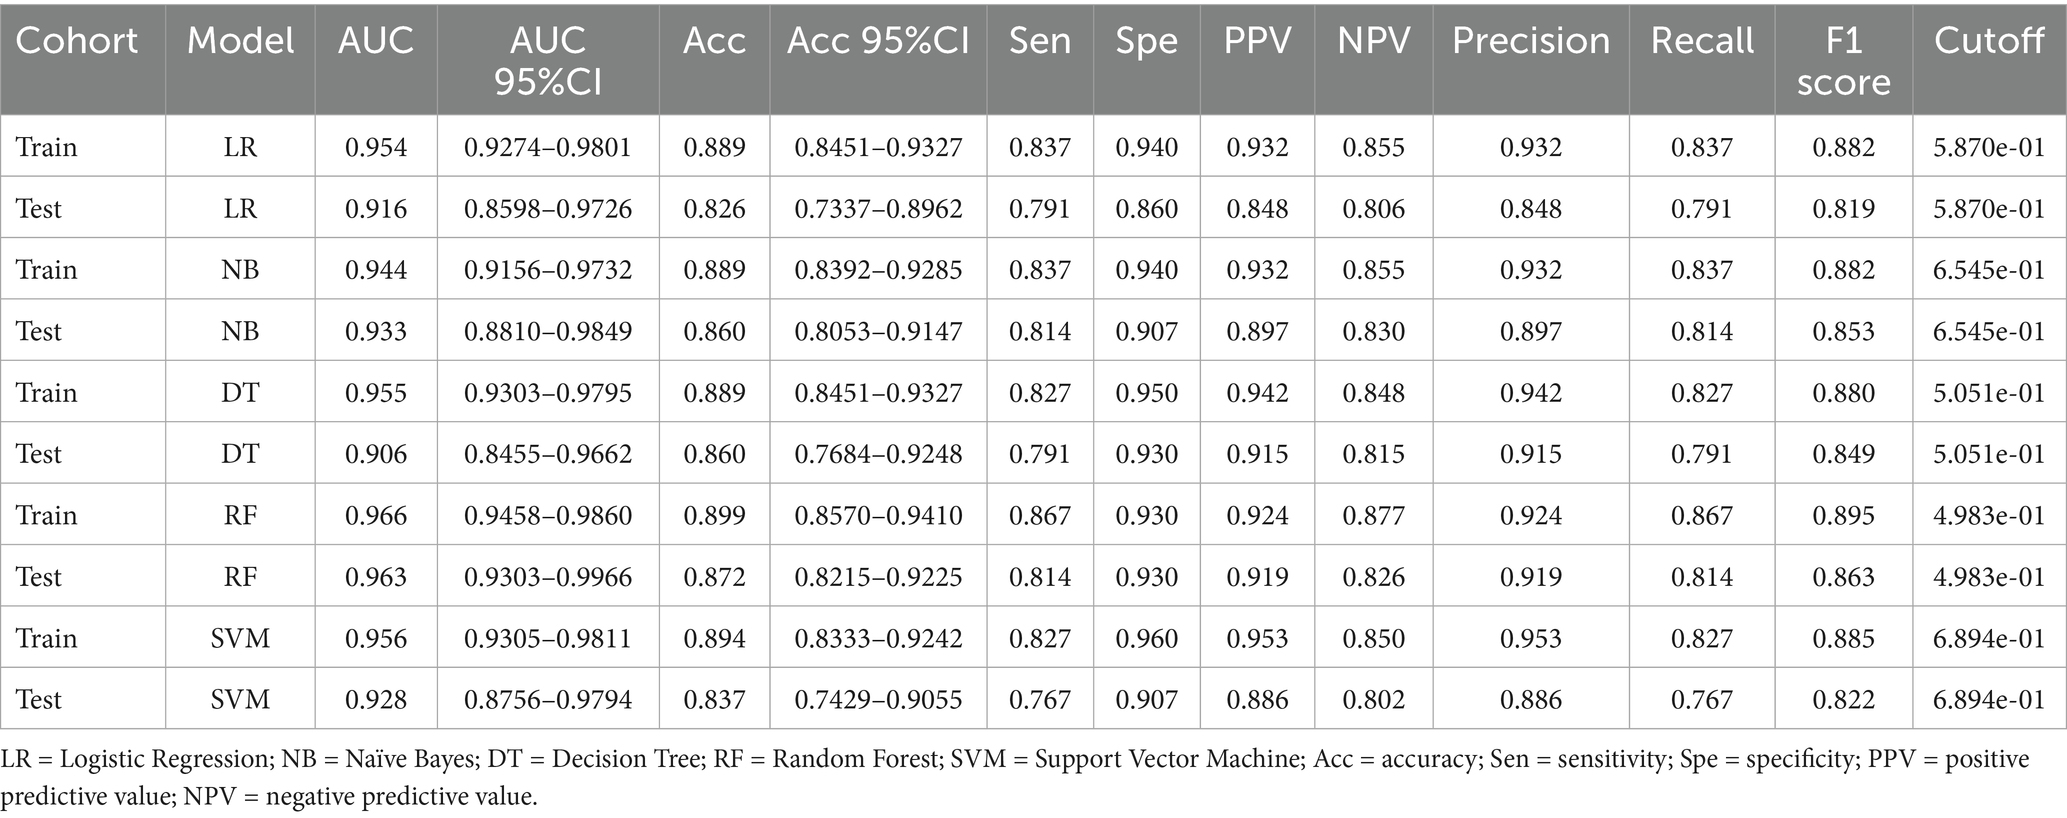
Table 3. Performance metrics of different models on the training set and test set.
Shapley Additive exPlanations (SHAP) analysis was used to quantify feature contributions to the predictions. Lower baseline SE, parental myopia, thinner SFCT, and older age increased the 1-year myopia risk. Baseline SE exerted the strongest influence on the model output, followed by parental myopia, SFCT, and age (Figure 2).
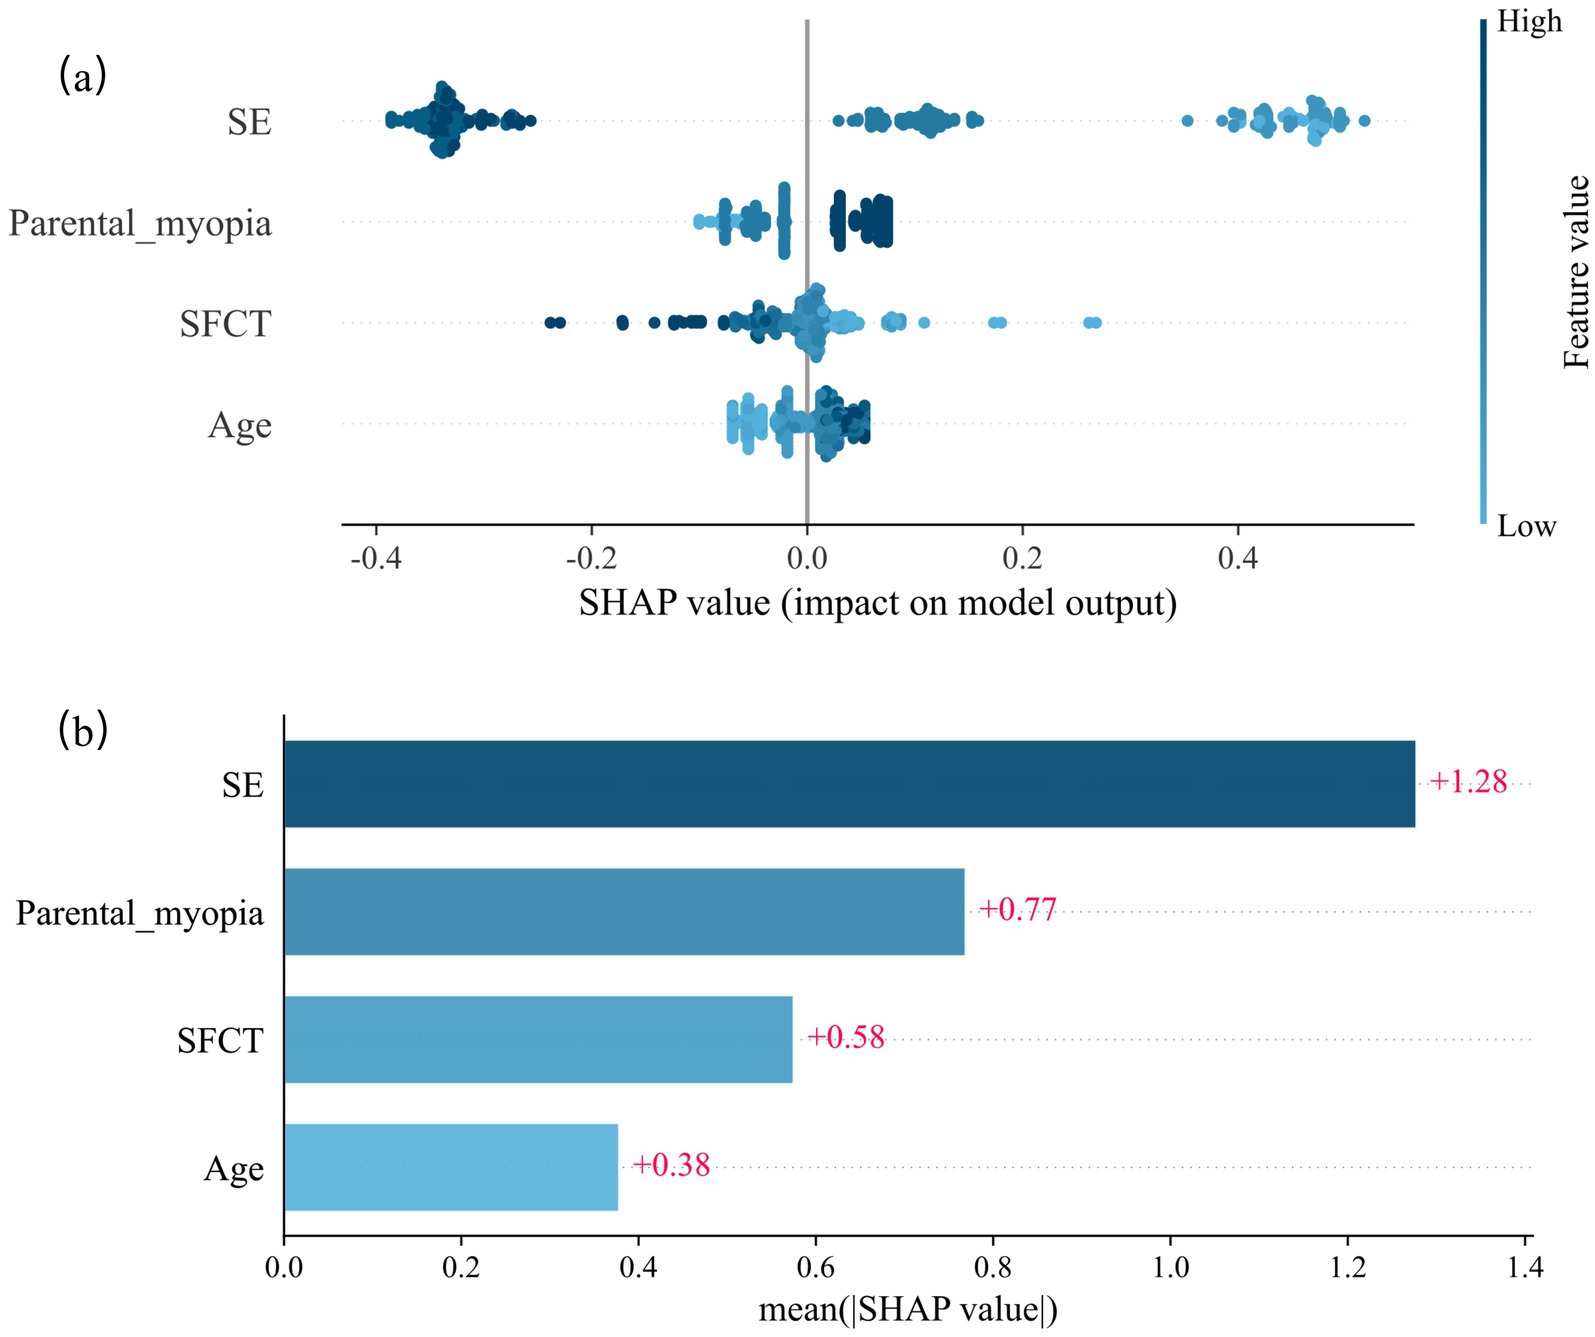
Figure 2. SHAP values of the random forest model for predicting the risk of myopia onset at 12 months. (a) Scatter plot of SHAP values of the random forest model. (b) The average SHAP values of the model output by the four indicators. SHAP = Shapley Additive exPlanations.
3.4 Myopia progression prediction
The trained model achieved an R2 of 0.8931 in the training set, indicating an excellent data fit. The MAE, MSE, and RMSE of the training set were 0.1002, 0.0179, and 0.1337, respectively, indicating that the model had good predictive performance on the training set. For the test set, R2 = 0.7667, MAE = 0.1417, MSE = 0.0335, and RMSE = 0.1830. Despite the slightly reduced test performance, the prediction accuracy remained robust (Figure 3).
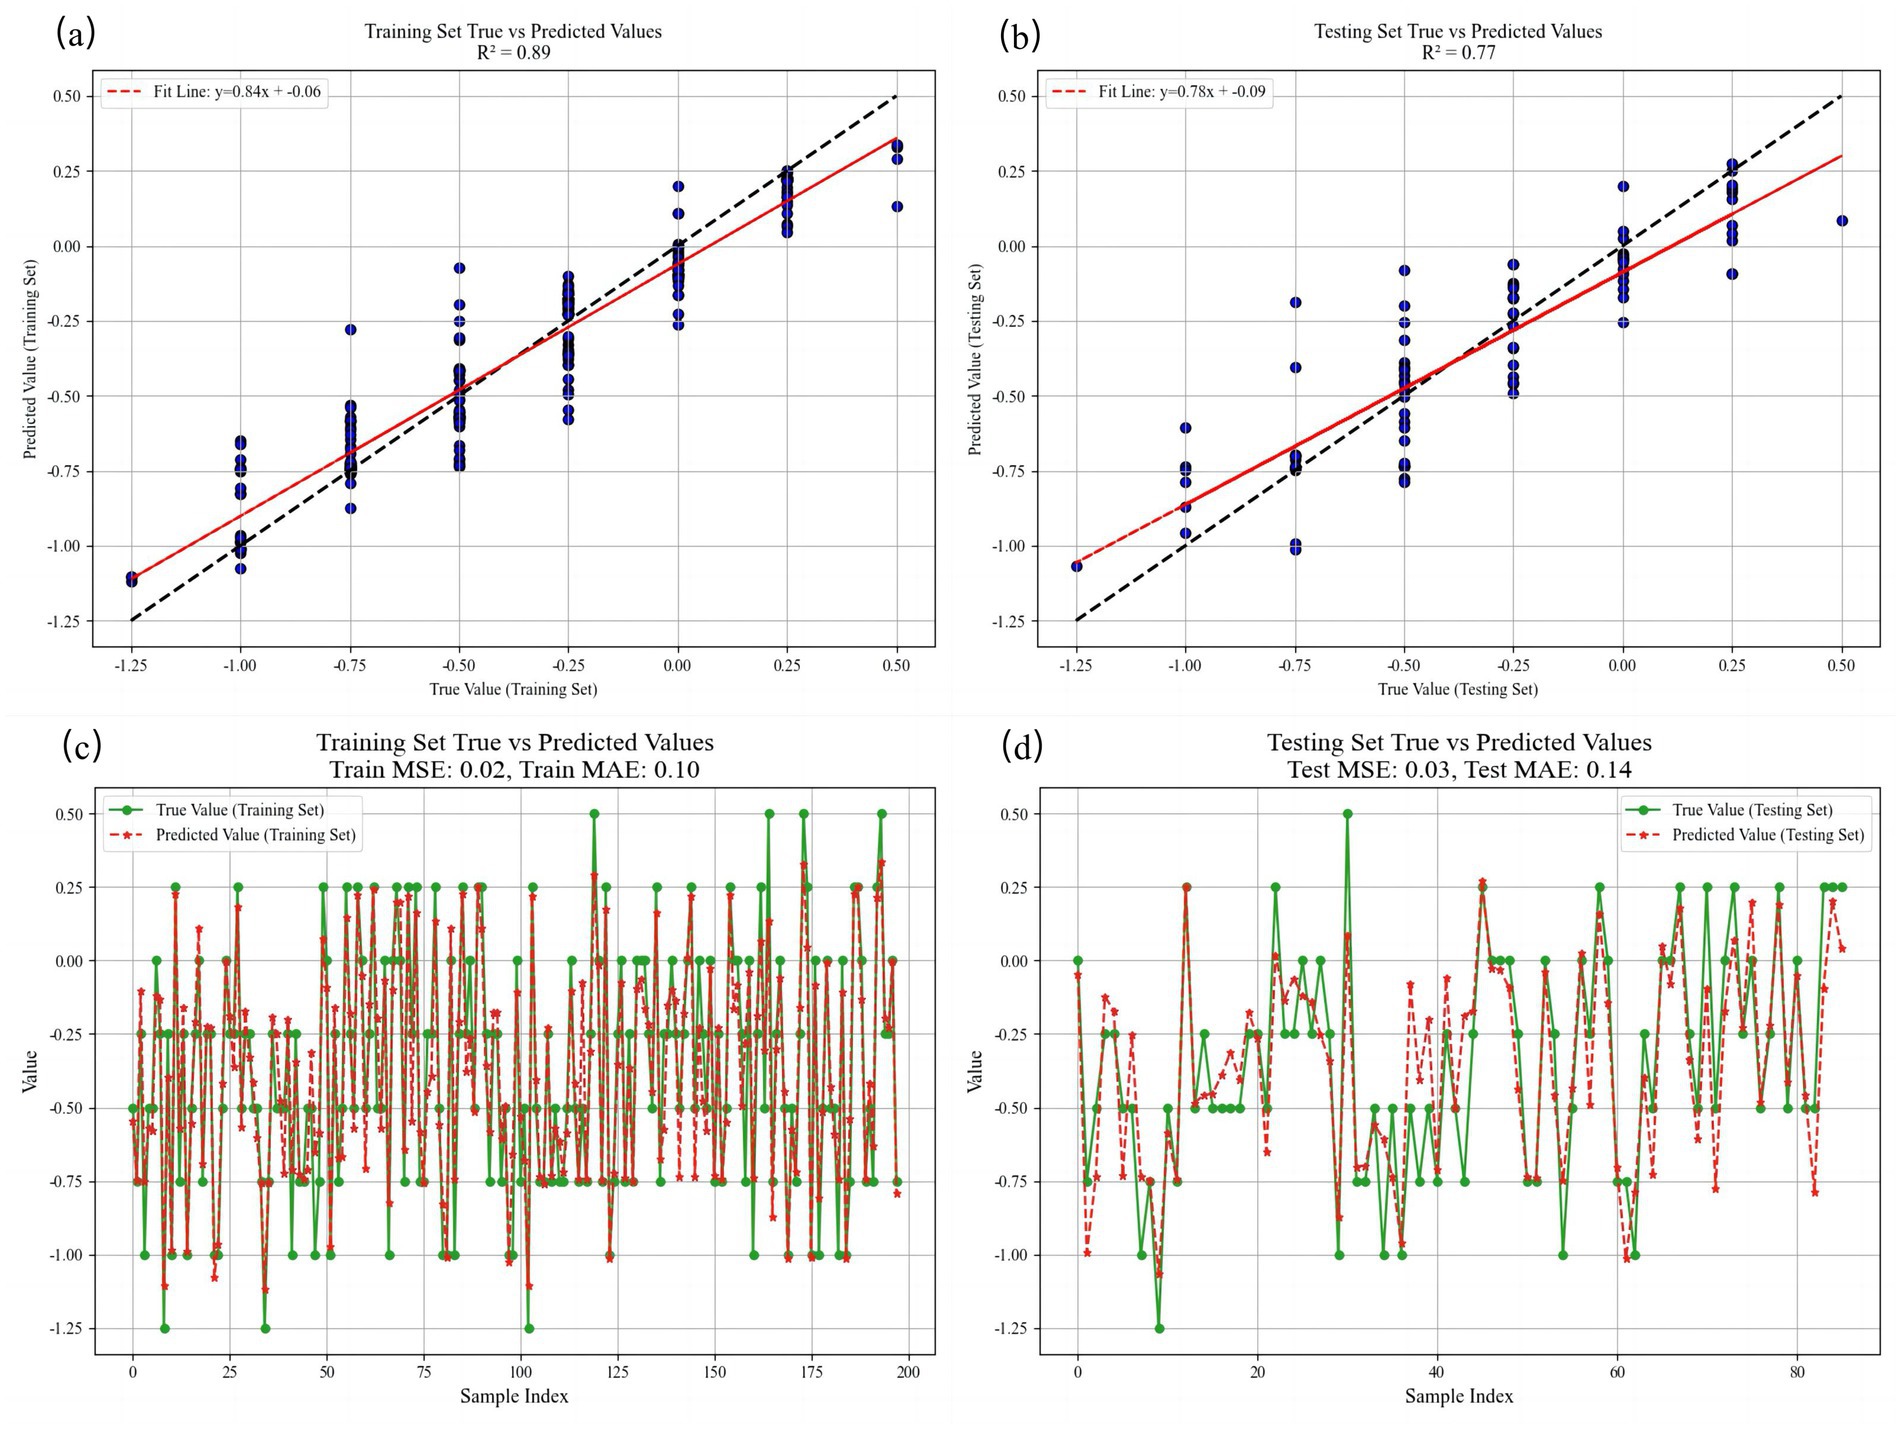
Figure 3. Comparison of SE predicted values and true values at 12 months in both training and testing sets. (a) The fitting situation of linear regression in the training set. (b) The fitting situation of linear regression in the testing set. (c) Visualization of the comparison between the true value and the predicted value in the training set. (d) Visualization of the comparison between the true value and the predicted value in the testing set. R2 = coefficient of determination, MSE = mean squared error, MAE = mean absolute error, and RMSE = root mean squared error.
4 Discussion
Previous machine learning-based models primarily focused on diagnosing non-cycloplegic myopia and predicting risks of high myopia or pathologic myopia (8, 14, 21, 22), with insufficient consideration for early intervention in premyopia. Our study provided the longitudinal evidence establishing the predictive value of ocular and genetic factors for myopia development in premyopic children. Using the predictive modeling approach, children identified as high risk for developing myopia within 1 year may be considered for early interventions such as low-concentration atropine eye drops (23), peripheral defocus spectacles (24), or a combination thereof. Children at low risk may avoid unnecessary interventions beyond reinforced lifestyle education. This approach holds significant potential for delaying myopia onset and advancing personalized treatment.
Premyopic individuals exhibit depleted hyperopic reserve and elevated myopia risk (25, 26). A previous study reported that approximately one-third of premyopic children developed myopia within 1 year, compared to a < 1% incidence among non-premyopic emmetropic children (19). Children with baseline SE > +2.00 D showed a 5-year myopia incidence of merely 4.4% versus 92.0% among those with SE between 0.00 and −0.50 D (25). Our findings confirmed this high-risk profile, demonstrating a 49.3% 1-year myopia incidence in school-aged premyopes. Therefore, our study was designed to capture the initial onset and shift in myopia within a high-risk premyopic population. The 1-year horizon allowed us to observe early changes and build a foundational model.
We further identified that lower baseline SE, parental myopia, thinner baseline SFCT, and older age increased the risk of myopia. Baseline SE emerged as the strongest predictor of myopia onset within 1 year among premyopic children in China, with lower SE values conferring a higher risk. Although AL is significant in myopia control (27), the baseline AL and AL/CR ratio were not predictive in our study. This discrepancy may stem from variations in the AL-SE correspondence. Our cohort showed a mean annual AL increase of 0.356 ± 0.122 mm, with 1 mm AL elongation corresponding to 1.95 D SE progression, consistent with previous reports that found SE changes of 0.83 D, 1.74 D, and 1.83 D per 1 mm AL increase in emmetropes, premyopes, and myopes, respectively (28). This gradient is reflected in lens power loss (29). During abnormal axial elongation, the crystalline lens may initially compensate for the myopic shift; however, this compensatory mechanism diminishes at myopia onset (30), exacerbating SE progression per millimeter of AL growth. Consequently, SE changes outpaced axial elongation in premyopia. Additionally, lens power decreased with age (31), which aligns with our observation of a higher myopia incidence in older children, suggesting lens involvement in myopiogenesis.
The choroid, a highly vascularized structure that nourishes the retinal pigment epithelium and outer retina, is critical for retinal function (32). The IMI discussed choroidal involvement in myopia in the latest series of myopia control (33). Choroidal thinning, which is strongly correlated with AL elongation, may coincide with myopia onset. Animal studies have indicated that chicks with initially thinner choroids exhibit faster axial growth than those with thicker choroids (34). However, clinical evidence establishing a thinner SFCT as a predictor of subsequent myopia in premyopic children remains unreported. Our study addressed this gap, demonstrating a significant SFCT reduction (21.535 ± 9.731 μm) during follow-up. Predictive modeling further established a thinner baseline SFCT as a significant risk factor for 1-year myopia development in premyopia.
While our algorithm demonstrated promising predictive performance with the ocular parameters and parental myopia history, a previous study found that gender differences (particularly higher susceptibility in females), urban–rural residence disparities, and reduced outdoor activity time were also significant independent risk factors affecting the occurrence of myopia. Their study documented a distinct risk hierarchy: urban female > urban male > rural female > rural male children. These factors likely operate through multiple pathways, including differential educational pressures, variations in natural light exposure affecting dopamine-mediated ocular growth regulation, and gender-specific hormonal influences on scleral remodeling (35).
Although the incidence of myopia was slightly higher in female (51.7%) than in male children (47.4%) in our cohort, gender did not demonstrate significant predictive value during feature selection for the prediction model. Tideman et al. (36) reported that risk scores combining environmental factors and ocular parameters could identify high-risk children. Another model suggested that ocular factors outweighed environmental and genetic predictors in myopia progression (22). Another cohort study found that 2-year myopia incidence was correlated solely with parental myopia, independent of environmental factors such as near-work duration, diopter hours, outdoor time, or tutoring (28). Environmental factors (e.g., daily near-work duration, outdoor activity, and lighting conditions) present high measurement challenges and significant quantification errors due to behavioral inconsistencies and seasonal variations. Consequently, to ensure model robustness, these factors were excluded from the prediction algorithm and addressed through post-prediction clinical counseling. Our algorithm exclusively focuses on stable, quantifiable predictors (e.g., biometric parameters, baseline refractive status, and genetic markers).
5 Limitations
This study had several limitations. First, this single-arm cohort study lacked a control group, preventing comparison of ocular progression in children with different refractive statuses. Considering the current effectiveness of myopia control strategies, we assessed the ethical justification for establishing an untreated myopia control group. Additionally, due to the necessity and practical difficulties of clinical cycloplegic examinations, no high hyperopia reserve control group was included. Consequently, the model is best suited to risk stratification within a premyopic cohort identified by current clinical standards rather than for screening the general pediatric population. This design choice, while pragmatic, may restrict the model’s utility in settings where population-wide screening is required.
Second, the sample size was constrained by single-center recruitment, which precluded external validation and may limit the generalizability of the findings. Although internal validation was conducted, external testing is required before clinical implementation. Moreover, the algorithm was developed and validated exclusively for Chinese school-aged children (6–12 years). While core biometric relationships suggest cross-population applicability, clinical use in non-Asian cohorts will require local calibration and prospective validation. Finally, due to the high incidence of premyopia converting into myopia within 1 year, our model only predicted the risk of myopia occurrence within a specific 12-month period. Given the single-center design, limited follow-up period, and lack of external validation, the study should be considered a preliminary pilot investigation. Further multicenter studies with longer follow-up are needed to confirm the generalizability and clinical utility of the proposed model.
Third, we acknowledge that the exclusion of environmental and behavioral predictors—such as time spent outdoors, near-work intensity, and degree of urbanicity—is a significant limitation. Therefore, our predictions should be interpreted as reflecting baseline biological risk, which must be integrated into the patient’s lifestyle and supplemented by clinical counseling. It should be emphasized that this tool serves as a decision-support aid rather than a standalone diagnostic instrument.
6 Conclusion
Over the 1-year study period, premyopic children exhibited significant myopic progression, axial elongation, and subfoveal choroidal thinning, with a myopia incidence of 49.3%. We developed machine learning-based models to predict myopia onset and progression in school-aged premyopes. These models demonstrated high accuracy and identified key risk factors: lower baseline SE, parental myopia, thinner baseline SFCT, and older age collectively increased 1-year myopia risk. Our research facilitates the early identification of high-risk premyopic individuals for targeted intervention, which can improve the efficiency of myopia prevention among school-age children.
Data availability statement
The raw data supporting the conclusions of this article will be made available by the authors, without undue reservation.
Ethics statement
The studies involving humans were approved by the ethics committee of The Second Hospital of Dalian Medical University. The studies were conducted in accordance with the local legislation and institutional requirements. Written informed consent for participation in this study was provided by the participants’ legal guardians/next of kin.
Author contributions
MG: Resources, Visualization, Software, Writing – original draft, Investigation, Conceptualization, Methodology, Validation, Writing – review & editing. YH: Data curation, Investigation, Writing – original draft. YL: Data curation, Investigation, Writing – original draft. ZS: Formal Analysis, Writing – original draft, Software, Resources, Validation. QZ: Visualization, Funding acquisition, Writing – review & editing, Supervision, Conceptualization, Methodology.
Funding
The author(s) declare that no financial support was received for the research and/or publication of this article.
Conflict of interest
The authors declare that the research was conducted in the absence of any commercial or financial relationships that could be construed as a potential conflict of interest.
Generative AI statement
The authors declare that no Gen AI was used in the creation of this manuscript.
Any alternative text (alt text) provided alongside figures in this article has been generated by Frontiers with the support of artificial intelligence and reasonable efforts have been made to ensure accuracy, including review by the authors wherever possible. If you identify any issues, please contact us.
Publisher’s note
All claims expressed in this article are solely those of the authors and do not necessarily represent those of their affiliated organizations, or those of the publisher, the editors and the reviewers. Any product that may be evaluated in this article, or claim that may be made by its manufacturer, is not guaranteed or endorsed by the publisher.
Supplementary material
The Supplementary material for this article can be found online at: https://www.frontiersin.org/articles/10.3389/fmed.2025.1646277/full#supplementary-material
References
1. Zhong, PL, Ma, N, Liu, YF, Dang, JJ, Shi, D, Cai, S, et al. Trend of the detection rate of myopia among Chinese Han children and adolescents aged 7-18 years from 2010 to 2019. Zhonghua Yu Fang Yi Xue Za Zhi. (2023) 57:20–6. doi: 10.3760/cma.j.cn112150-20221008-00964
2. Verkicharla, PK, Ohno-Matsui, K, and Saw, SM. Current and predicted demographics of high myopia and an update of its associated pathological changes. Ophthalmic Physiol Opt. (2015) 35:465–75. doi: 10.1111/opo.12238
3. Flitcroft, DI, He, M, Jonas, JB, Jong, M, Naidoo, K, and Ohno-Matsui, K. IMI - defining and classifying myopia: a proposed set of standards for clinical and epidemiologic studies. Invest Ophthalmol Vis Sci. (2019) 60:M20–30. doi: 10.1167/iovs.18-25957
4. Jong, M, Jonas, JB, Wolffsohn, JS, Berntsen, DA, Cho, P, Clarkson-Townsend, D, et al. IMI 2021 yearly digest. Invest Ophthalmol Vis Sci. (2021) 62:7. doi: 10.1167/iovs.62.5.7
5. Sankaridurg, P, Berntsen, DA, Bullimore, MA, Cho, P, Flitcroft, I, Gawne, TJ, et al. IMI 2023 Digest. Digest Invest Ophthalmol Vis Sci. (2023) 64:34. doi: 10.1167/iovs.64.10.34
6. Harrington, S, and O'Dwyer, V. The association between time spent on screens and reading with myopia, premyopia and ocular biometric and anthropometric measures in 6- to 7-year-old schoolchildren in Ireland. Ophthalmic Physiol Opt. (2023) 43:505–16. doi: 10.1111/opo.13116
7. Alvarez-Peregrina, C, Ruiz-Pomeda, A, Martinez-Perez, C, Prieto-Garrido, FL, Villa-Collar, C, Gonzalez-Perez, M, et al. Subjective behavioral measures in myopic and pre-myopic children before and after the COVID lockdown. Front Med (Lausanne). (2023) 10:1308423. doi: 10.3389/fmed.2023.1308423
8. Yin, Y, Li, L, Wang, T, Lin, S, Wang, J, Wang, H, et al. Establishment of noncycloplegic methods for screening myopia and pre-myopia in preschool children. Front Med. (2023) 10:1291387. doi: 10.3389/fmed.2023.1291387
9. Wang, CY, Hsu, NW, Yang, YC, Chen, YL, Shyong, MP, and Tsai, DC. Premyopia at preschool age: population-based evidence of prevalence and risk factors from a serial survey in Taiwan. Ophthalmology. (2022) 129:880–9. doi: 10.1016/j.ophtha.2022.03.017
10. Mutti, DO, Hayes, JR, Mitchell, GL, Jones, LA, Moeschberger, ML, Cotter, SA, et al. Refractive error, axial length, and relative peripheral refractive error before and after the onset of myopia. Invest Ophthalmol Vis Sci. (2007) 48:2510–9. doi: 10.1167/iovs.06-0562
11. Xiang, F, He, M, and Morgan, IG. Annual changes in refractive errors and ocular components before and after the onset of myopia in Chinese children. Ophthalmology. (2012) 119:1478–84. doi: 10.1016/j.ophtha.2012.01.017
12. Consejo, A, Melcer, T, and Rozema, JJ. Introduction to machine learning for ophthalmologists. Semin Ophthalmol. (2018) 34:19–41. doi: 10.1080/08820538.2018.1551496
13. Grzybowski, A, Brona, P, Lim, G, Ruamviboonsuk, P, Tan, GSW, Abramoff, M, et al. Artificial intelligence for diabetic retinopathy screening: a review. Eye (Lond). (2020) 34:451–60. doi: 10.1038/s41433-019-0566-0
14. Lin, H, Long, E, Ding, X, Diao, H, Chen, Z, Liu, R, et al. Prediction of myopia development among Chinese school-aged children using refraction data from electronic medical records: a retrospective, multicentre machine learning study. PLoS Med. (2018) 15:e1002674. doi: 10.1371/journal.pmed.1002674
15. Tang, T, Yu, Z, Xu, Q, Peng, Z, Fan, Y, Wang, K, et al. A machine learning-based algorithm used to estimate the physiological elongation of ocular axial length in myopic children. Eye Vis (Lond). (2020) 7:50. doi: 10.1186/s40662-020-00214-2
16. Fan, Y, Yu, Z, Tang, T, Liu, X, Xu, Q, and Peng, Z. Machine learning algorithm improves accuracy of ortho-K lens fitting in vision shaping treatment. Cont Lens Anterior Eye. (2021) 45:101474. doi: 10.1016/j.clae.2021.101474
17. Fan, Y, Yu, Z, Peng, Z, Xu, Q, Tang, T, Wang, K, et al. Machine learning based strategy surpasses the traditional method for selecting the first trial Lens parameters for corneal refractive therapy in Chinese adolescents with myopia. Cont Lens Anterior Eye. (2021) 44:101330. doi: 10.1016/j.clae.2020.05.001
18. Rohm, M, Tresp, V, Muller, M, Kern, C, Manakov, I, and Weiss, M. Predicting visual acuity by using machine learning in patients treated for neovascular age-related macular degeneration. Ophthalmology. (2018) 125:1028–36. doi: 10.1016/j.ophtha.2017.12.034
19. He, XG. Understanding and reflection on the prevention and control of pre-myopia in children. Zhonghua Yan Ke Za Zhi. (2024) 60:316–21. doi: 10.3760/cma.j.cn112142-20240130-00056
20. Mu, J, Zhong, H, and Jiang, M. Machine-learning models to predict myopia in children and adolescents. Front Med. (2024) 11:1482788. doi: 10.3389/fmed.2024.1482788
21. Liu, L, Li, R, Huang, D, Lin, X, Zhu, H, Wang, Y, et al. Prediction of premyopia and myopia in Chinese preschool children: a longitudinal cohort. BMC Ophthalmol. (2021) 21:283. doi: 10.1186/s12886-021-02045-8
22. Li, SM, Ren, MY, Gan, J, Zhang, SG, Kang, MT, Li, H, et al. Machine learning to determine risk factors for myopia progression in primary school children: the Anyang childhood eye study. Ophthalmol Ther. (2022) 11:573–85. doi: 10.1007/s40123-021-00450-2
23. Wang, W, Zhang, F, Yu, S, Ma, N, Huang, C, Wang, M, et al. Prevention of myopia shift and myopia onset using 0.01% atropine in premyopic children - a prospective, randomized, double-masked, and crossover trial. Eur J Pediatr. (2023) 182:2597–606. doi: 10.1007/s00431-023-04921-5
24. Su, B, Cho, P, Vincent, SJ, Zheng, J, Chen, J, Ye, C, et al. Novel lenslet-ARray-integrated spectacle lenses for myopia control: a 1-year randomized, double-masked, controlled trial. Ophthalmology. (2024) 131:1389–97. doi: 10.1016/j.ophtha.2024.07.002
25. Wang, SK, Guo, Y, Liao, C, Chen, Y, Su, G, Zhang, G, et al. Incidence of and factors associated with myopia and high myopia in Chinese children, based on refraction without Cycloplegia. JAMA Ophthalmol. (2018) 136:1017–24. doi: 10.1001/jamaophthalmol.2018.2658
26. Li, SM, Wei, S, Atchison, DA, Kang, MT, Liu, L, Li, H, et al. Annual incidences and progressions of myopia and high myopia in Chinese schoolchildren based on a 5-year cohort study. Invest Ophthalmol Vis Sci. (2022) 63:8. doi: 10.1167/iovs.63.1.8
27. Chamberlain, P, Lazon de la Jara, P, Arumugam, B, and Bullimore, MA. Axial length targets for myopia control. Ophthalmic Physiol Opt. (2021) 41:523–31. doi: 10.1111/opo.12812
28. Ma, Y, Zou, H, Lin, S, Xu, X, Zhao, R, Lu, L, et al. Cohort study with 4-year follow-up of myopia and refractive parameters in primary schoolchildren in Baoshan District, Shanghai. Clin Experiment Ophthalmol. (2018) 46:861–72. doi: 10.1111/ceo.13195
29. Rozema, J, Dankert, S, Iribarren, R, Lanca, C, and Saw, SM. Axial growth and Lens power loss at myopia onset in Singaporean children. Invest Ophthalmol Vis Sci. (2019) 60:3091–9. doi: 10.1167/iovs.18-26247
30. Xiong, S, He, X, Sankaridurg, P, Zhu, J, Wang, J, Zhang, B, et al. Accelerated loss of crystalline lens power initiating from emmetropia among young school children: a 2-year longitudinal study. Acta Ophthalmol. (2022) 100:e968–76. doi: 10.1111/aos.15002
31. Zhang, J, Jin, L, Chen, Q, Wang, D, Chen, X, Li, Y, et al. Changes in Lens thickness and power before and after myopia onset. Invest Ophthalmol Vis Sci. (2025) 66:36. doi: 10.1167/iovs.66.3.36
32. Nickla, DL, and Wallman, J. The multifunctional choroid. Prog Retin Eye Res. (2010) 29:144–68. doi: 10.1016/j.preteyeres.2009.12.002
33. Ostrin, LA, Harb, E, Nickla, DL, Read, SA, Alonso-Caneiro, D, Schroedl, F, et al. IMI-the dynamic choroid: new insights, challenges, and potential significance for human myopia. Invest Ophthalmol Vis Sci. (2023) 64:4. doi: 10.1167/iovs.64.6.4
34. Nickla, DL, and Totonelly, K. Choroidal thickness predicts ocular growth in normal chicks but not in eyes with experimentally altered growth. Clin Exp Optom. (2015) 98:564–70. doi: 10.1111/cxo.12317
35. Rai, BB, Ashby, RS, French, AN, and Maddess, T. Rural-urban differences in myopia prevalence among myopes presenting to Bhutanese retinal clinical services: a 3-year national study. Graefes Arch Clin Exp Ophthalmol. (2021) 259:613–21. doi: 10.1007/s00417-020-04891-6
36. Tideman, JWL, Polling, JR, Jaddoe, VWV, Vingerling, JR, and Klaver, CCW. Environmental risk factors can reduce axial length elongation and myopia incidence in 6- to 9-year-old children. Ophthalmology. (2019) 126:127–36. doi: 10.1016/j.ophtha.2018.06.029
Glossary
UCVA - Uncorrected visual acuity
BCVA - Best-corrected visual acuity
IOP - Intraocular pressure
SE - Spherical equivalent
AL - Axial length
CC - Corneal curvature
SFCT - Subfoveal choroidal thickness
AL/CR - Axial length/corneal radius
SHAP - Shapley Additive exPlanations
ML - Machine learning
EPV - Events per variable
LR - Logistic regression
NB - Naïve Bayes
DT - Decision tree
RF - Random Forest
SVM - Support vector machine
ROC - Receiver operating characteristic curve
AUC - Area under the receiver operating characteristic curve
MSE - Mean squared error
MAE - Mean absolute error
RMSE - root mean squared error
R2 - Coefficient of determination
Keywords: premyopia, myopic progression, subfoveal choroidal thickness, machine learning, prediction model
Citation: Gao M, Hou Y, Lu Y, Shi Z and Zhao Q (2025) Prediction of myopia onset and shift in premyopic school-aged children: a machine learning-based algorithm. Front. Med. 12:1646277. doi: 10.3389/fmed.2025.1646277
Edited by:
Gábor Jandó, University of Pécs, HungaryReviewed by:
Bhim Bahadur Rai, Australian National University, AustraliaBrian Vohnsen, University College Dublin, Ireland
Copyright © 2025 Gao, Hou, Lu, Shi and Zhao. This is an open-access article distributed under the terms of the Creative Commons Attribution License (CC BY). The use, distribution or reproduction in other forums is permitted, provided the original author(s) and the copyright owner(s) are credited and that the original publication in this journal is cited, in accordance with accepted academic practice. No use, distribution or reproduction is permitted which does not comply with these terms.
*Correspondence: Qi Zhao, emhhb3FpZG11QDEyNi5jb20=; emhhb3FpMDIxOUAxMjYuY29t
†ORCID: Mingjun Gao, orcid.org/0000-0003-2789-713X
Yanhua Hou, orcid.org/0009-0008-2448-064X
Yutong Lu, orcid.org/0009-0003-3005-4480
Zhanhua Shi, orcid.org/0009-0001-7208-8158
Qi Zhao, orcid.org/0000-0003-1412-2722