 Luis D’Marco1,2†
 Ana Checa-Ros1,3†
 Antonella Locascio4
 Owahabanun Joshua Okojie1
 Iris Viejo5
 Valmore Bermúdez6
 Cristina Karohl7
 Paolo Raggi2*
- 1Grupo de Enfermedades Cardiorrenales y Metabólicas, Departamento de Medicina y Cirugía, Universidad Cardenal Herrera-CEU, CEU Universities, Valencia, Spain
- 2Division of Cardiology, Department of Medicine, Alberta Heart Institute, University of Alberta, Edmonton, AB, Canada
- 3Aston Institute of Health & Neurodevelopment, Aston University, The Aston Triangle, Birmingham, United Kingdom
- 4Departamento de Ciencias Biomédicas, Universidad Cardenal Herrera-CEU, CEU Universities, Valencia, Spain
- 5Nephrology Department, Hospital Universitari i Politècnic La Fe, Valencia, Spain
- 6Facultad de Ciencias de la Salud, Universidad Simón Bolívar, Barranquilla, Colombia
- 7Faculdade de Medicina, Universidade Federal do Rio Grande do Sul, Porto Alegre, Brazil
Background: Several studies suggest that C-peptide (CP) is involved in regulating lipolysis, adipokine release, and other functions in the adipose tissue. On the other hand, organ-specific adipose tissues, such as the epicardial adipose tissue (EAT), have been reported as an independent cardiovascular risk factor in patients on dialysis. This study aimed to evaluate the association between CP, EAT volume, and coronary artery calcification (CAC) as markers of cardiovascular risk, on subjects with type 2 diabetes receiving insulin and dialysis.
Methods: This is a retrospective study on 62 patients with chronic kidney disease (CKD) stage 5 on dialysis awaiting kidney transplantation and referred for cardiovascular risk stratification at the Emory University Hospital. Computed tomography (CT) was used to assess CAC and to measure EAT volume. Demographic and anthropometric data were collected from all patients through record review.
Results: The mean patient age was 43 ± 11 and 55% were women. None of the serum analytical parameters correlated with CP. Subjects with higher BMI exhibited higher levels of CP. EAT volume strongly correlated with CP levels, and it was significantly correlated with CAC. On the contrary, no correlation was found between CP and CAC.
Conclusion: The significant association between EAT volume and CP suggests a potential role of CP in the cardiovascular physiopathology of patients with ESKD on dialysis. Insufficient statistical power was probably the cause of the lack of association of CP with CAC. Observational prospective studies are required to characterize CP as a cardiovascular risk marker in patients with ESKD.
Introduction
The deleterious effects of hyperinsulinemia, both endogenous and exogenous, manifest as weight gain and several metabolic and neurohumoral alterations leading to cardiorenal damage (1, 2).
C-peptide (CP), a peptide composed of 31 amino acids released by the pancreatic β-cells in the same equimolar ratio as insulin into the blood, is clinically used in monitoring pancreatic β-cell function and insulin needs in patients with diabetes (3). Recent studies suggest that this peptide may exhibit hormonal properties targeting various tissues (4), although there exists some controversy regarding its actions in physiological and under diverse pathological conditions. According to in vitro and in vivo studies, CP reduces apoptosis in the heart, aorta, kidney and vascular endothelial cells by downregulating the activation of transcription factor p53 (5, 6). Under physiological conditions, CP is also reported to play an antioxidant role by restoring the mitochondrial electron transport chain activity and thereby reducing the generation of reactive oxygen species (ROS) (7, 8). Additionally, CP seems to be involved in the secretion of adipokines and adipose tissue functioning (9, 10). However, CP oversecretion, as it occurs in pathological states such as obesity, is linked to the production of pro-inflammatory factors (IL-6, IL-1β), inhibition of lipolysis, increased secretion of the pro-inflammatory adipokine leptin (11, 12) and mesenchymal stem-cell dysfunction (13). In patients with diabetes, opposing effects from CP have been described for type-1 (T1DM) and type-2 diabetes mellitus (T2DM). On the one hand, higher levels of CP have been associated with a lower long-term complication rate in T1DM (14), including less glomerular hypertrophy, hyperfiltration, and proteinuria (15). On the other hand, CP has been reported to have pro-inflammatory and pro-atherogenic effects in T2DM patients by accumulating in the vessel wall (16–18) and inducing microvascular damage. Clinical research has uncovered that in obese patients suffering from T2DM, there exists a positive correlation between CP concentrations and pro-inflammatory chemokines (C-C chemokine ligand 2 (CCL2)), as well as E-selectin, among others.
Visceral adipose tissues, including the epicardial adipose tissue (EAT) located below the visceral pericardium, have been associated with an increased risk of cardiovascular events both in the general and dialysis-dependent populations (19–23). In patients with coronary artery disease, the EAT is inflamed and releases a large quantity of inflammatory cytokines and pro-atherogenic mediators (24). EAT has been proposed to promote atherosclerosis via paracrine and autocrine effects (25–27).
A positive correlation between CP and EAT in patients with T2DM and obesity have been reported by prior studies (28, 29), suggesting the potential involvement of CP in systemic inflammation and cardiovascular events. We hypothesized that increased CP levels in patients at high cardiovascular risk, such as those with end-stage chronic kidney disease (ESKD), are associated with EAT volume and coronary artery calcium (CAC), two known risk markers. If this were demonstrated, CP may become a useful tool to gauge the undesirable side effects of long-term insulin therapy.
Patients with ESKD undergoing dialysis represent a unique clinical population in terms of insulin and CP metabolism. Given that their renal function is markedly diminished, degradation and clearance of insulin and CP are considerably decreased, leading to their accumulation regardless of endogenous pancreatic secretion (30). Consequently, the measurement and interpretation of CP in this group require specific consideration, as standard reference ranges may differ from the general population. Furthermore, most of the patients with T2DM on dialysis receive exogenous insulin, which can further increase circulating insulin and CP levels, contributing to visceral adiposity (EAT) and microvascular damage (CAC).
Our study aims to evaluate the relationship between CP, EAT and CAC in patients with T2DM on dialysis to further understand the potential involvement of CP in the common cardiovascular complications occurring in this population.
Methods
Study population
This is a cross-sectional study on 62 patients with ESKD undergoing renal replacement therapy (RRT) who were awaiting kidney transplantation. All patients were referred for cardiovascular risk stratification at Emory University Hospital (Atlanta, GA, USA), between December 2009 and October 2012. The cohort included 43 patients receiving hemodialysis and 19 receiving peritoneal dialysis, all of them with a previous diagnosis of T2DM and on treatment with insulin.
This study received approval from the Emory University Institutional Review Board (approval number: 23/424) and was performed in accordance with the Declaration of Helsinki as revised in 2013. Adult participant consent was waived given the retrospective nature of the study. The study protocol has been already detailed in a prior publication (19), and it is briefly summarized here.
Clinical data collection
Demographic, anthropometric and clinical data were collected from the electronic medical records by LDM (further curated by OJO, AL and IV). Patients who smoked regularly were classified as current smokers. Hypertension was defined as a blood pressure >140/90 mmHg, or as the current intake of antihypertensive medications. History of cardiovascular disease included known coronary artery disease, heart failure, stroke, and peripheral vascular disease.
Analytical data collection
Blood samples to measure glucose, lipid and mineral metabolism, as well as renal function markers, were collected after 12 h of fasting and a 15-min resting period, and stored at a temperature between 4°C and 15°C. The samples were later centrifuged in cold and measured using standard assays at the Emory University Hospital. CP levels were determined on an advanced automated immunoassay analyzer (ADVIA Centaur, Siemens, Forchheim, Germany: reference range 0.05-30 ng/mL; CV ~ 6%).
Imaging protocol
Cardiovascular risk assessment was performed using either positron emission tomography with computer tomography (PET-CT; Siemens Biograph, 40-slice CT, Siemens, Forchheim, Germany), or single photon emission tomography with CT (SPECT–CT; GE Discovery NM 530, GE Medical Systems, Milwaukee, WI, USA). Patients were instructed to fast and avoid caffeinated beverages or theophylline-containing medications for a minimum of 12 h prior to imaging. Initial scout and transmission CT scans were obtained for orientation and attenuation correction with patients breathing shallowly. A further non-contrast CT scan was obtained during breath-hold for the evaluation of vascular calcification and EAT volume analyses (as described below), using prospective ECG triggering at 3-mm slice thickness to minimize radiation exposure.
Laboratory and imaging assessments were carried out on the same day. Measurements of vascular calcifications and EAT volume were performed by experienced investigators (CK, PR) blinded to clinical and analytical variables.
Coronary artery calcium scoring
Each area of calcification in the coronary arteries was scored using a semiautomatic software available on the workstation (Leonardo, Siemens Medical Solutions, Forchheim, Germany). CAC was considered present if a minimum of three contiguous pixels with an attenuation of ≥130 Hounsfield Units (HU) were detected along the course of a coronary artery (Figure 1, arrows). The Agatston score was used to quantify coronary artery calcium (CAC).
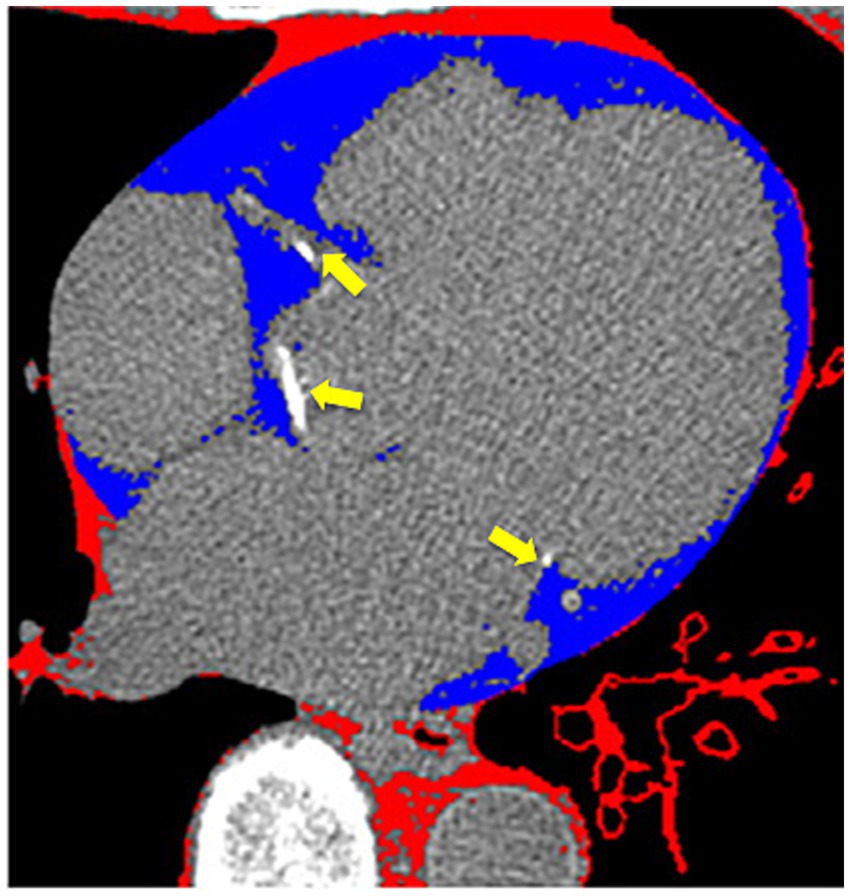
Figure 1. Cardiac computer tomography imaging. The arrows show calcium deposits in the coronary arteries. Blue-colored areas represent the epicardial adipose tissue.
Epicardial adipose tissue measurement
EAT was identified as a hypodense region surrounding the myocardium and bounded by the pericardium on CT, using the Volume Software (Leonardo workstation, Siemens, Forchheim, Germany). The pericardium was manually traced from the mid-left atrium to the apex of the left ventricle, using a 10-mm thickness. By applying an attenuation threshold between-250 and-30 HU, many structures such as the myocardium, coronary arteries, coronary calcium, aorta, and blood pool were effectively excluded, highlighting only the EAT (Figure 1, blue area). Individual EAT volumes at each level were summed to calculate the total EAT volume. The estimated total radiation dose for the chest CT was 2.5 mSv.
Statistical analysis
Normally distributed continuous variables were reported as mean ± standard deviation (SD). Categorical parameters were presented as absolute or relative frequencies (percentages). The Student’s t-test was used to compare normally distributed parameters. Categorical data were compared using the Chi-square test. Spearman’s bivariate correlations were conducted to test the strength of the association between variables.
Statistical analyses (VB, LDM, ACR) were performed using the statistical software package SPSS version 19 (SPSS Inc., IBM). A two-tailed p-value <0.05 was considered statistically significant.
Results
Demographics and clinical characteristics
The demographic, clinical, anthropometric, and analytical characteristics of the patients enrolled in this study are summarized in Table 1. Mean age of patients was 43 ± 11 years, with a slight female predominance (55%). Over half of the participants (52%, n = 32) were identified as African American, reflecting the demographic diversity of the cohort. Diabetes mellitus was the leading cause of CKD, present in 93% (n = 58) of patients, while hypertension accounted for only 3% (n = 2). Other etiologies represented the remaining 3% of cases. The majority of patients (69%, n = 43) were undergoing hemodialysis, whereas 31% (n = 19) were on peritoneal dialysis, with a mean dialysis duration of 24 months. This distribution highlights the predominance of diabetes-related CKD in this population and the varied dialysis modalities employed.
Table 1. Demographic, clinical, and analytical characteristics of the patients.
CP levels and correlations
No significant difference in CP levels was observed between hemodialysis and peritoneal dialysis patients, nor correlation with any demographic or analytical parameters. However, a notable linear relationship emerged between body mass index (BMI) and CP levels. Patients with a higher BMI (mean 29 ± 7 kg/m2) exhibited elevated serum CP concentrations (mean 4 ± 5 ng/mL), with a statistically significant correlation (r = 0.30, p = 0.03). This suggests that adiposity may influence CP metabolism in CKD patients, independent of dialysis modality.
EAT volume and CAC
The average EAT volume was 96 ± 67 mL, while CAC scores were highly variable (369 ± 997). A strong positive association was observed between serum CP levels and EAT volume (r = 0.51, p = 0.03), reinforcing the potential role of metabolic factors in ectopic fat deposition (Figure 2). Stratification of EAT volume by CP quartiles showed a progressive increase, further underscoring this relationship (Figure 3). Additionally, EAT volume significantly correlated with CAC (p < 0.01), suggesting a link between pericardial fat and vascular calcification.
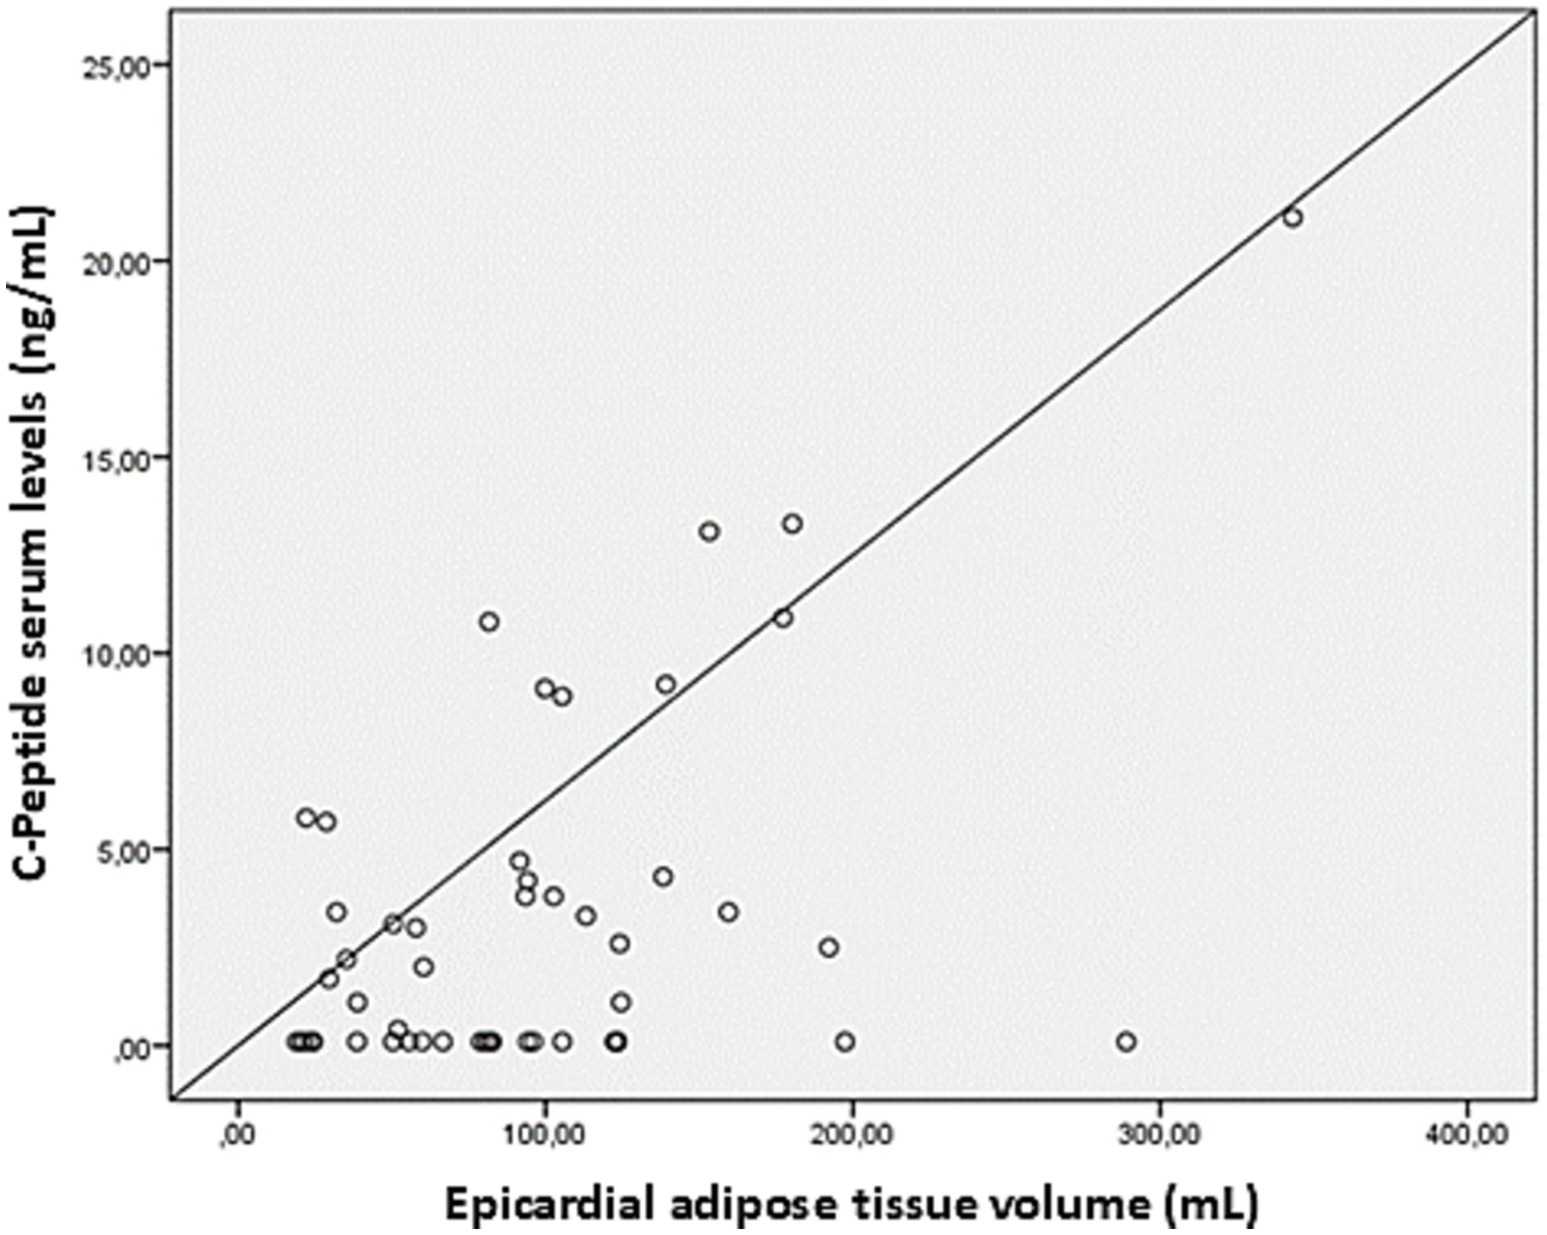
Figure 2. Linear correlation between serum levels of C-peptide and the volumes of epicardial adipose tissue. Scatter plot showing the relationship between epicardial adipose tissue volume (mL) and C-peptide serum levels (ng/mL). Each point represents an individual measurement, with the diagonal line indicating the reference for linear correlation.
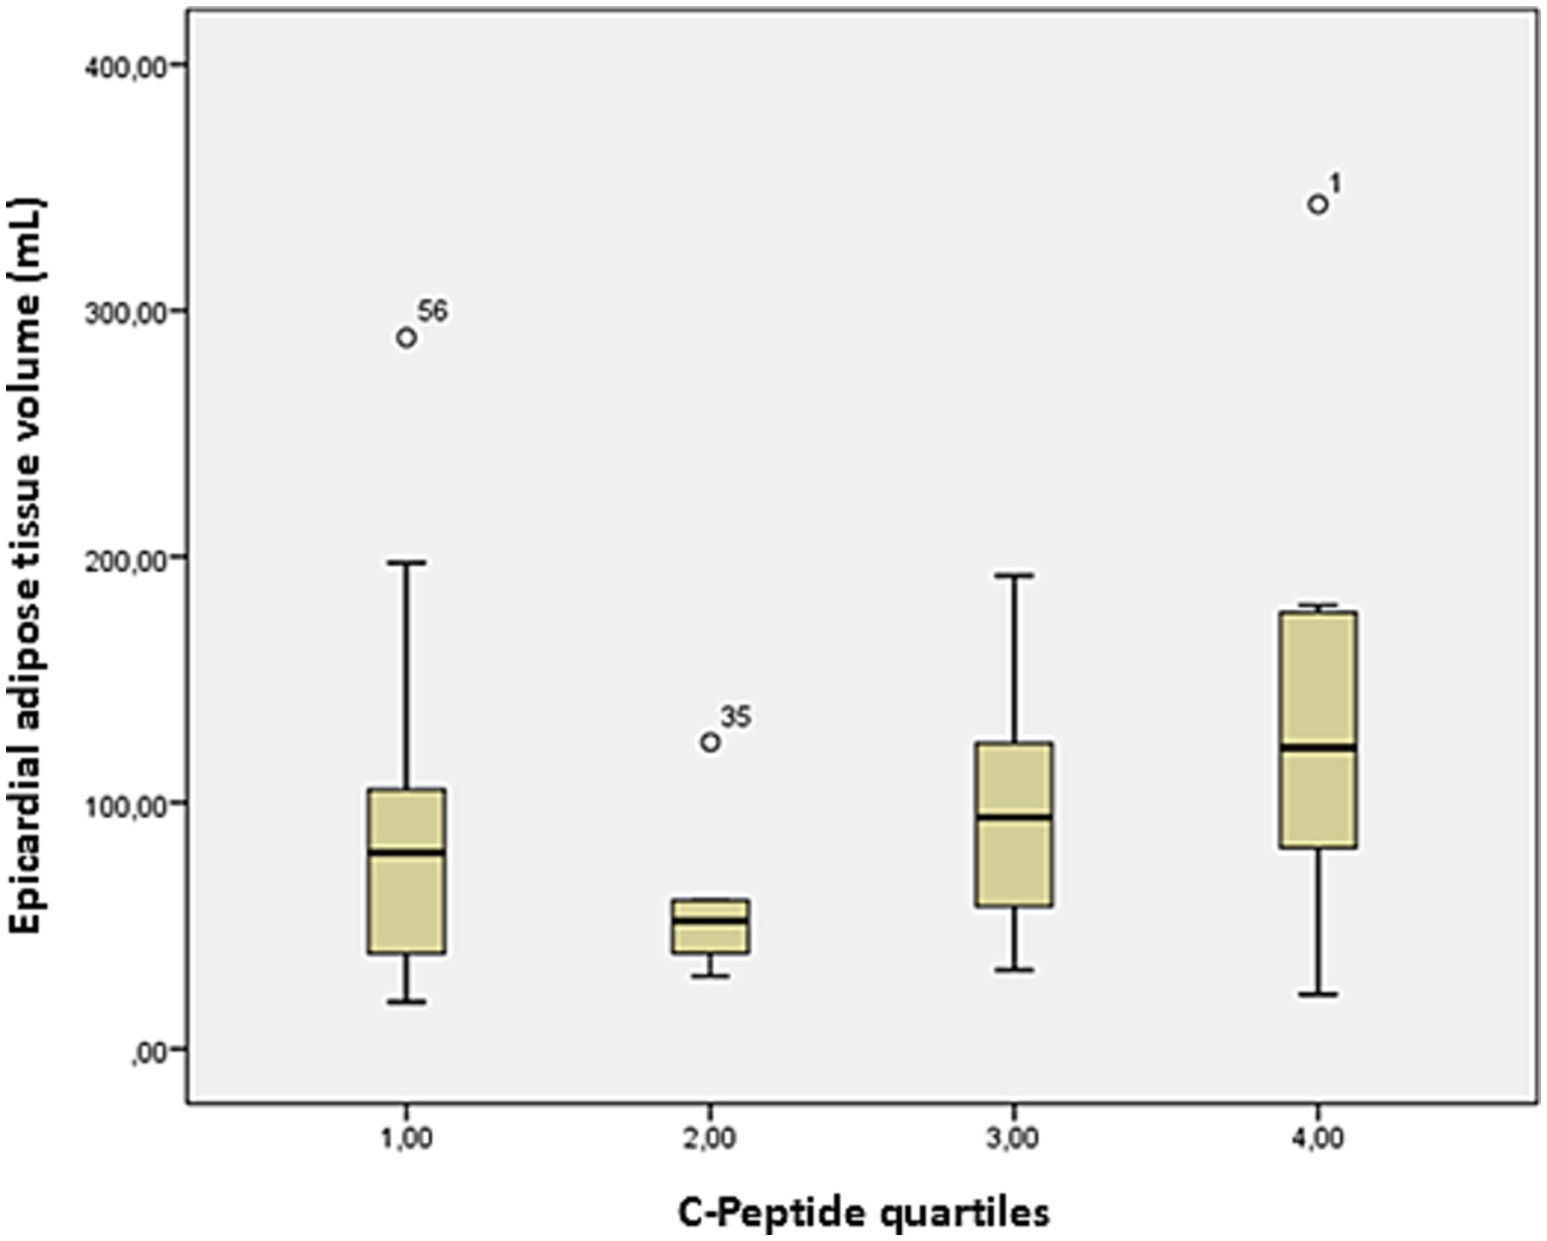
Figure 3. Box plot of EAT volume on cardiac CT and CP quartiles. Bars represent the minimum and maximum ranges of EAT volume values. The bottom and upper box limits encompass the 25–75% interquartile ranges. The black crossbars within the boxes represent median values. EAT volume tends to increase from lower to higher C-peptide quartiles, with the highest median values observed in quartile 4.
CP and CAC relationship
Despite the association between EAT and CAC, no direct correlation was found between serum CP levels and CAC scores. This indicates that, although CP may contribute to EAT accumulation, its influence on coronary calcification may be indirect or mediated by other metabolic pathways. These results highlight the complex interplay between adiposity, metabolic markers, and cardiovascular risk among patients with CKD.
Discussion
Our main finding was a significant correlation between CP and EAT volume in patients with T2DM receiving RRT. Additionally, as shown previously, EAT and CAC were strongly correlated. However, no association was found between CP serum level and CAC.
As expected due to decreased renal clearance, the mean circulating CP value in our sample (4 ± 5 ng/mL) was higher than the range of values previously reported in healthy people (0.36–3.61 ng/mL) (31) and in patients with T2DM at milder stages of CKD (~0.6–3 ng/mL) (32). The CP concentrations in our study were also within the range priorly reported by Guthoff et al. (33). In a population of 107 patients with ESKD awaiting kidney transplantation (4.47–8.28 ng/mL), who showed values significantly higher than a gender, age and BMI-matched cohort of healthy controls.
CP is sometimes used as a marker of insulin reserve to evaluate insulin needs in T2DM patients. Although insulin is routinely indicated in many dialysis units for glycemic control in patients with diabetes, CP is not included as part of their regular monitoring (33, 34). Despite its well-known hypoglycemic action, insulin has definite lipogenic effects that may be counterproductive. Besides, management of this drug in patients on dialysis is particularly challenging due to the diverse alterations in glucose and insulin metabolism that go beyond the reduced insulin clearance by the diseased kidneys (35). These alterations include reduced insulin secretion and sensitivity, the hypoglycemic effect of dialysis, decline in renal gluconeogenesis and deficient catecholamine release (36–38). Thus, CP monitoring may help gauge insulin needs and dosing in patients affected by ESKD.
Insulin promotes lipogenesis and suppresses hepatic gluconeogenesis. This occurs via the increase of glucose uptake in the adipocyte and the activation of lipogenic and glycolytic enzymes via covalent modification (39). Paradoxically, the positive effect of insulin on lipid production in the liver is maintained under conditions of insulin resistance, unlike its defective action on gluconeogenesis. Hence, the deleterious effects of hyperinsulinemia are related to increased cardiovascular risk, insulin resistance, weight gain, and an increase in visceral adipose tissue (33, 34).
Thus, insulin dosage adjustments should be made to improve the undesirable actions of this hormone. Dose reduction could be obtained with the introduction of new hypoglycemic drugs, such as glucagon-like peptide-1 receptor agonists (GLP1-RA) or dual GLP-1 and GIP (glucose-dependent insulinotropic polypeptide) receptor agonists. Not only do these drugs control glycemia in T2DM, but they also slow kidney dysfunction progression in patients with CKD not on dialysis (40–45), besides inducing significant weight loss without provoking episodes of hypoglycemia (46). Additionally, elimination of GLP-1RA is not dependent on renal function, representing an attractive option in dialysis (47).
As mentioned earlier, CP is a widely accepted biomarker of both β-cell function and insulin resistance (48). Insulin resistance, measured as the product of serum insulin by glucose level, has proven to be an adverse prognostic indicator of cardiovascular mortality (49). However, there is some evidence that CP levels are a better predictor of cardiovascular disease and overall mortality than serum insulin levels, while also supporting the increased mortality risk associated with an insulin-resistant state (50). This could also be due to CP having certain influence on the atherogenic process through the accumulation of oxidized LDL and the proliferation of aortic smooth muscle cells (16, 18, 51).
The role of CP in diabetic vascular complications is contradictory, as the progression of cardiovascular disease may be accelerated by insulin resistance mechanisms or the pathological functions of CP previously mentioned in the introduction. The statistically significant association found between this peptide and EAT aligns with the results found by Erman et al. (52). In people with metabolic syndrome, and may suggest a potential involvement of CP in the cardiovascular complications frequently present in patients with ESKD. Given that our study was a cross-sectional analysis, we were unable to determine whether CP is associated with further cardiovascular events or overall mortality in this population. Prospective studies with long-term follow-up are required to clarify whether CP is a predictor for cardiovascular endpoints in dialysis-dependent populations. EAT has been associated with cardiovascular risk and mortality in patients receiving dialysis (21, 23, 53, 54). In our prior publication, we reported that EAT was an independent factor for the prediction of inducible myocardial perfusion defects and higher CAC scores in ESKD (19). The physiological role of EAT is multifaceted, involving mechanical, metabolic, thermogenic, and endocrine/paracrine functions (55). Direct interaction between the inflamed EAT and the coronary arteries is believed to promote the development of atherosclerosis via the action of adipocytokines with pro-inflammatory properties. This process could be augmented by CP, which stimulates the release of chemokines from the adipocytes in EAT (12).
The CAC scores showed a highly skewed distribution with large variability (369 ± 997). Given our modest sample size, outlier exclusion was not applied. Unlike previous authors who applied logarithmic transformation of Agatston scores (56, 57), we opted to use a non-parametric statistical test (Spearman’s correlation) to assess the strength of the relationship between CAC and CP, as this test does not assume normality and is appropriate for skewed data. Nonetheless, the lack of correlation between CP levels and the extent of CAC may have been due to a power issue or the selection of relatively healthy and younger subjects for kidney transplantation.
Our study presents a few limitations besides its small size: it was a cross-sectional analysis; several patients were excluded due to missing serum CP values; the lack of regression analyses and adjustment for potential confounders (age, BMI, sex, diabetes duration, dialysis vintage) limits the independence of the associations found; no logarithmic transformation or sensitivity analysis was performed on the highly variable CAC scores; finally, no information on insulin type and dosage was obtained for most patients.
Conclusion
In patients with T2DM on dialysis, a significant association between CP levels and EAT volume was found, highlighting a potential role of CP in the increased cardiometabolic risk characteristic of this population. Although a strong correlation between EAT and CAC was shown, no association between CAC and CP was reported. Longstanding observational prospective studies on larger samples and broader dialysis populations are required to assess the specific involvement of CP as a cardiovascular risk marker in patients with ESKD and as a predictor of CAC changes over time.
Data availability statement
The raw data supporting the conclusions of this article will be made available by the authors, without undue reservation.
Ethics statement
The studies involving humans were approved by Emory University Institutional Review Board–approval: 23/424. The studies were conducted in accordance with the local legislation and institutional requirements. Written informed consent from participants was waived due to the retrospective nature of the study.
Author contributions
LD'M: Data curation, Writing – review & editing, Methodology, Investigation, Writing – original draft, Formal analysis. AC-R: Formal analysis, Writing – original draft. AL: Data curation, Validation, Writing – review & editing. OJO: Validation, Writing – review & editing, Data curation. IV: Writing – review & editing, Data curation, Validation. VB: Writing – review & editing, Resources, Formal analysis. CK: Writing – review & editing, Investigation, Methodology. PR: Writing – review & editing, Supervision, Conceptualization, Resources.
Funding
The author(s) declare that no financial support was received for the research and/or publication of this article.
Conflict of interest
The authors declare that the research was conducted in the absence of any commercial or financial relationships that could be construed as a potential conflict of interest.
Generative AI statement
The authors declare that no Gen AI was used in the creation of this manuscript.
Any alternative text (alt text) provided alongside figures in this article has been generated by Frontiers with the support of artificial intelligence and reasonable efforts have been made to ensure accuracy, including review by the authors wherever possible. If you identify any issues, please contact us.
Publisher’s note
All claims expressed in this article are solely those of the authors and do not necessarily represent those of their affiliated organizations, or those of the publisher, the editors and the reviewers. Any product that may be evaluated in this article, or claim that may be made by its manufacturer, is not guaranteed or endorsed by the publisher.
References
1. Artunc, F, Schleicher, E, Weigert, C, Fritsche, A, Stefan, N, and Häring, H-U. The impact of insulin resistance on the kidney and vasculature. Nat Rev Nephrol. (2016) 12:721–37. doi: 10.1038/nrneph.2016.145
2. Jia, G, DeMarco, VG, and Sowers, JR. Insulin resistance and hyperinsulinaemia in diabetic cardiomyopathy. Nat Rev Endocrinol. (2016) 12:144–53. doi: 10.1038/nrendo.2015.216
3. Jones, AG, and Hattersley, AT. The clinical utility of C-peptide measurement in the care of patients with diabetes. Diabet Med. (2013) 30:803–17. doi: 10.1111/dme.12159
4. Vejrazkova, D, Vankova, M, Lukasova, P, Vcelak, J, and Bendlova, B. Insights into the physiology of C-peptide. Physiol Res. (2020) 69:S237–43. doi: 10.33549/physiolres.934519
5. Bhatt, MP, Lim, Y-C, Hwang, J, Na, S, Kim, Y-M, and Ha, K-S. C-peptide prevents hyperglycemia-induced endothelial apoptosis through inhibition of reactive oxygen species–mediated transglutaminase 2 activation. Diabetes. (2013) 62:243–53. doi: 10.2337/db12-0293
6. Bhatt, MP, Lee, Y-J, Jung, S-H, Kim, YH, Hwang, JY, Han, E-T, et al. C-peptide protects against hyperglycemic memory and vascular endothelial cell apoptosis. J Endocrinol. (2016) 231:97–108. doi: 10.1530/JOE-16-0349
7. Vejandla, H, Hollander, JM, Kothur, A, and Brock, RW. C-peptide reduces mitochondrial superoxide generation by restoring complex i activity in high glucose-exposed renal microvascular endothelial cells. ISRN Endocrinol. (2012) 2012:162802. doi: 10.5402/2012/162802
8. Bhatt, MP, Lim, Y-C, Kim, Y-M, and Ha, K-S. C-peptide activates AMPKα and prevents ROS-mediated mitochondrial fission and endothelial apoptosis in diabetes. Diabetes. (2013) 62:3851–62. doi: 10.2337/db13-0039
9. Park, J-H, Nguyen, TN, Shim, HM, Yu, GI, Ha, EY, and Cho, H. Identification of adipsin as a biomarker of beta cell function in patients with type 2 diabetes. J Clin Med. (2024) 13:7351. doi: 10.3390/jcm13237351
10. Ghorbani, A, Omrani, G, Hadjzadeh, M, and Varedi, M. Proinsulin C-peptide inhibits lipolysis in diabetic rat adipose tissue through phosphodiestrase-3B enzyme. Horm Metab Res. (2012) 45:221–5. doi: 10.1055/s-0032-1323764
11. Janowska, J, Chudek, J, Olszanecka-Glinianowicz, M, Semik-Grabarczyk, E, and Zahorska-Markiewicz, B. Interdependencies among selected pro-inflammatory markers of endothelial dysfunction, C-peptide, anti-inflammatory interleukin-10 and glucose metabolism disturbance in obese women. Int J Med Sci. (2016) 13:490–9. doi: 10.7150/ijms.14110
12. Garcia-Serrano, S, Gutiérrez-Repiso, C, Gonzalo, M, Garcia-Arnes, J, Valdes, S, Soriguer, F, et al. Peptide modifies leptin and visfatin secretion in human adipose tissue. Obesity. (2015) 23:1607–15. doi: 10.1002/oby.21137
13. Ghorbani, A. Pathological consequences of C-peptide deficiency in insulin-dependent diabetes mellitus. World J Diabetes. (2015) 6:145–50. doi: 10.4239/wjd.v6.i1.145
14. Luppi, P, and Drain, P. C-peptide antioxidant adaptive pathways in β cells and diabetes. J Intern Med. (2017) 281:7–24. doi: 10.1111/joim.12522
15. Ghorbani, A, Shafiee-Nick, R, Zojaji, S, and Rajabi-Mashhadi, M. Physiological effects of proinsulin-connecting peptide in human subcutaneous adipose tissue. Physiol Int. (2017) 104:193–205. doi: 10.1556/2060.104.2017.2.2
16. Wang, Y, Wan, H, Chen, Y, Xia, F, Zhang, W, Wang, C, et al. Association of C-peptide with diabetic vascular complications in type 2 diabetes. Diabetes Metab. (2020) 46:33–40. doi: 10.1016/j.diabet.2019.04.004
17. Kim, S-T, Kim, B-J, Lim, D-M, Song, I-G, Jung, J-H, Lee, K-W, et al. Basal C-peptide level as a surrogate marker of subclinical atherosclerosis in type 2 diabetic patients. Diabetes Metab J. (2011) 35:41. doi: 10.4093/dmj.2011.35.1.41
18. Marx, N, Walcher, D, Raichle, C, Aleksic, M, Bach, H, Grüb, M, et al. C-peptide colocalizes with macrophages in early arteriosclerotic lesions of diabetic subjects and induces monocyte chemotaxis in vitro. Arterioscler Thromb Vasc Biol. (2004) 24:540–5. doi: 10.1161/01.ATV.0000116027.81513.68
19. Karohl, C, D’Marco, L, Bellasi, A, and Raggi, P. Hybrid myocardial imaging for risk stratification prior to kidney transplantation: added value of coronary calcium and epicardial adipose tissue. J Nucl Cardiol. (2013) 20:1013–20. doi: 10.1007/s12350-013-9761-8
20. D’Marco, L, Cortez, M, Salazar, M, Lima-Martínez, M, and Bermúdez, V. Epicardial adipose tissue: a cardiovascular risk marker to evaluate in chronic kidney disease. Clin Invest Arterioscler. (2020) 32:129–34. doi: 10.1016/j.arteri.2019.10.006
21. D’Marco, LG, Bellasi, A, Kim, S, Chen, Z, Block, GA, and Raggi, P. Epicardial adipose tissue predicts mortality in incident hemodialysis patients: a substudy of the Renagel in new Dialysis trial. Nephrol Dial Transplant. (2013) 28:2586–95. doi: 10.1093/ndt/gft264
22. Karatas, A, Canakci, E, Bektas, O, Bayrak, T, Bayrak, A, Altınbas, A, et al. Relationship of epicardial fat tissue thickness with oxidant biomarkers in chronic kidney disease. Bratisl Lek Listy.(2018) 119:566–71. doi: 10.4149/BLL_2018_102
23. Turkmen, K, Kayikcioglu, H, Ozbek, O, Solak, Y, Kayrak, M, Samur, C, et al. The relationship between epicardial adipose tissue and malnutrition, inflammation, atherosclerosis/calcification syndrome in ESRD patients. Clin J Am Soc Nephrol. (2011) 6:1920–5. doi: 10.2215/CJN.00890111
24. Salazar, J, Luzardo, E, Mejías, JC, Rojas, J, Ferreira, A, Rivas-Ríos, JR, et al. Epicardial fat: physiological, pathological, and therapeutic implications. Cardiol Res Pract. (2016) 2016:1291537. doi: 10.1155/2016/1291537
25. Nagy, E, Jermendy, AL, Merkely, B, and Maurovich-Horvat, P. Clinical importance of epicardial adipose tissue. Arch Med Sci. (2017) 13:864–74. doi: 10.5114/aoms.2016.63259
26. Rabkin, SW. Epicardial fat: properties, function and relationship to obesity. Obes Rev. (2007) 8:253–61. doi: 10.1111/j.1467-789X.2006.00293.x
27. Iacobellis, G, Corradi, D, and Sharma, AM. Epicardial adipose tissue: anatomic, biomolecular and clinical relationships with the heart. Nat Clin Pract Cardiovasc Med. (2005) 2:536–43. doi: 10.1038/ncpcardio0319
28. Murai, T, Takebe, N, Nagasawa, K, Todate, Y, Nakagawa, R, Nakano, R, et al. Association of epicardial adipose tissue with serum level of cystatin C in type 2 diabetes. PLoS One. (2017) 12:e0184723. doi: 10.1371/journal.pone.0184723
29. Castro-Barquero, S, Casas, R, Rimm, EB, Tresserra-Rimbau, A, Romaguera, D, Martínez, JA, et al. Loss of visceral fat is associated with a reduction in inflammatory status in patients with metabolic syndrome. Mol Nutr Food Res. (2023) 67:e2200264. doi: 10.1002/mnfr.202200264
30. Savu, O, Elian, V, Steriade, O, Teodoru, I, Mihut, S, Tacu, C, et al. The impact of basal insulin analogues on glucose variability in patients with type 2 diabetes undergoing renal replacement therapy for end-stage renal disease. Int Urol Nephrol. (2016) 48:265–70. doi: 10.1007/s11255-015-1175-x
31. Whiss, PA, Baldimtsi, E, and Wahlberg, J. Fasting plasma C-peptide correlates with body mass index, hsCRP, apolipoprotein B, and other atherogenic lipids in healthy individuals. Physiol Rep. (2025) 13:e70282. doi: 10.14814/phy2.70282
32. Yang, Q, Liu, Y, Peng, J, Pan, J, Chen, L, Cui, J, et al. High levels of serum C-peptide are associated with a decreased risk for incident renal progression in patients with type 2 diabetes: a retrospective cohort study. BMJ Open Diabetes Res Care. (2023) 11:e003201. doi: 10.1136/bmjdrc-2022-003201
33. Guthoff, M, Wagner, R, Vosseler, D, Peter, A, Nadalin, S, Häring, H-U, et al. Impact of end-stage renal disease on glucose metabolism—a matched cohort analysis. Nephrol Dialysis Transplant. (2017) 32:670–6. doi: 10.1093/ndt/gfx018
34. Morillas, C, D’Marco, L, Puchades, MJ, Solá-Izquierdo, E, Gorriz-Zambrano, C, Bermúdez, V, et al. Insulin withdrawal in diabetic kidney disease: what are we waiting for? Int J Environ Res Public Health. (2021) 18:5388. doi: 10.3390/ijerph18105388
35. Papademetriou, V, Lovato, L, Doumas, M, Nylen, E, Mottl, A, Cohen, RM, et al. Chronic kidney disease and intensive glycemic control increase cardiovascular risk in patients with type 2 diabetes. Kidney Int. (2015) 87:649–59. doi: 10.1038/ki.2014.296
36. Bellasi, A, Di Micco, L, Santoro, D, Marzocco, S, De Simone, E, Cozzolino, M, et al. Correction of metabolic acidosis improves insulin resistance in chronic kidney disease. BMC Nephrol. (2016) 17:158. doi: 10.1186/s12882-016-0372-x
37. Kalantar-Zadeh, K, Kopple, JD, Regidor, DL, Jing, J, Shinaberger, CS, Aronovitz, J, et al. A1C and survival in maintenance hemodialysis patients. Diabetes Care. (2007) 30:1049–55. doi: 10.2337/dc06-2127
38. Sharma, R, and Rosner, MH. Glucose in the dialysate: historical perspective and possible implications? Hemodial Int. (2008) 12:221–6. doi: 10.1111/j.1542-4758.2008.00256.x
39. Kersten, S. Mechanisms of nutritional and hormonal regulation of lipogenesis. EMBO Rep. (2001) 2:282–6. doi: 10.1093/embo-reports/kve071
40. Rossing, P, Baeres, FMM, Bakris, G, Bosch-Traberg, H, Gislum, M, Gough, SCL, et al. The rationale, design and baseline data of FLOW, a kidney outcomes trial with once-weekly semaglutide in people with type 2 diabetes and chronic kidney disease. Nephrol Dial Transplant. (2023) 38:2041–51. doi: 10.1093/ndt/gfad009
41. Pfeffer, MA, Claggett, B, Diaz, R, Dickstein, K, Gerstein, HC, Køber, LV, et al. Lixisenatide in patients with type 2 diabetes and acute coronary syndrome. N Engl J Med. (2015) 373:2247–57. doi: 10.1056/NEJMoa1509225
42. Holman, RR, Bethel, MA, Mentz, RJ, Thompson, VP, Lokhnygina, Y, Buse, JB, et al. Effects of once-weekly exenatide on cardiovascular outcomes in type 2 diabetes. N Engl J Med. (2017) 377:1228–39. doi: 10.1056/NEJMoa1612917
43. Marso, SP, Daniels, GH, Brown-Frandsen, K, Kristensen, P, JFE, M, Nauck, MA, et al. Liraglutide and cardiovascular outcomes in type 2 diabetes. N Engl J Med. (2016) 375:311–22. doi: 10.1056/NEJMoa1603827
44. Davies, MJ, Bain, SC, Atkin, SL, Rossing, P, Scott, D, Shamkhalova, MS, et al. Efficacy and safety of liraglutide versus placebo as add-on to glucose-lowering therapy in patients with type 2 diabetes and moderate renal impairment (LIRA-RENAL): a randomized clinical trial. Diabetes Care. (2016) 39:222–30. doi: 10.2337/dc14-2883
45. Perkovic, V, Tuttle, KR, Rossing, P, Mahaffey, KW, Mann, JFE, Bakris, G, et al. Effects of semaglutide on chronic kidney disease in patients with type 2 diabetes. N Engl J Med. (2024) 391:109–21. doi: 10.1056/NEJMoa2403347
46. Górriz, JL, Soler, MJ, Navarro-González, JF, García-Carro, C, Puchades, MJ, D’Marco, L, et al. GLP-1 receptor agonists and diabetic kidney disease: a call of attention to nephrologists. J Clin Med. (2020) 9:947. doi: 10.3390/jcm9040947
47. Müller, TD, Finan, B, Bloom, SR, D’Alessio, D, Drucker, DJ, Flatt, PR, et al. Glucagon-like peptide 1 (GLP-1). Mol Metab. (2019) 30:72–130. doi: 10.1016/j.molmet.2019.09.010
48. Toffolo, G, De Grandi, F, and Cobelli, C. Estimation of β-cell sensitivity from intravenous glucose tolerance test c-peptide data: knowledge of the kinetics avoids errors in modeling the secretion. Diabetes. (1995) 44:845–54. doi: 10.2337/diab.44.7.845
49. Ausk, KJ, Boyko, EJ, and Ioannou, GN. Insulin resistance predicts mortality in nondiabetic individuals in the U.S. Diabetes Care. (2010) 33:1179–85. doi: 10.2337/dc09-2110
50. Patel, N, Taveira, TH, Choudhary, G, Whitlatch, H, and Wu, W. Fasting serum C-peptide levels predict cardiovascular and overall death in nondiabetic adults. J Am Heart Assoc. (2012) 1:e003152. doi: 10.1161/JAHA.112.003152
51. Lebherz, C, and Marx, N. C-peptide and its career from innocent bystander to active player in diabetic atherogenesis. Curr Atheroscler Rep. (2013) 15:339. doi: 10.1007/s11883-013-0339-3
52. Erman, H, Böyük, B, Cetin, SI, Sevinc, S, Bulut, U, and Maviş, O. Beta cell function as an assessment tool for cardiovascular risk in patients with metabolic syndrome. J Surg Med. (2021) 5:1002–6. doi: 10.28982/josam.847350
53. Tonbul, HZ, Turkmen, K, Kayıkcıoglu, H, Ozbek, O, Kayrak, M, and Biyik, Z. Epicardial adipose tissue and coronary artery calcification in diabetic and nondiabetic end-stage renal disease patients. Ren Fail. (2011) 33:770–5. doi: 10.3109/0886022X.2011.599913
54. Turan, MN, Gungor, O, Asci, G, Kircelli, F, Acar, T, Yaprak, M, et al. Epicardial adipose tissue volume and cardiovascular disease in hemodialysis patients. Atherosclerosis. (2013) 226:129–33. doi: 10.1016/j.atherosclerosis.2012.10.061
55. D’Marco, L, Puchades, MJ, Gorriz, JL, Romero-Parra, M, Lima-Martínez, M, Soto, C, et al. Epicardial adipose tissue, adiponectin and leptin: a potential source of cardiovascular risk in chronic kidney disease. Int J Mol Sci. (2020) 21:978. doi: 10.3390/ijms21030978
56. Lee, J, Hu, T, Williams, MC, Hoori, A, Wu, H, Kim, JN, et al. Detection of arterial remodeling using epicardial adipose tissue assessment from CT calcium scoring scan. Front Cardiovasc Med. (2025) 12:1543816. doi: 10.3389/fcvm.2025.1543816
Keywords: C-peptide, epicardial adipose tissue, vascular calcification, chronic kidney disease, dialysis, ESKD
Citation: D’Marco L, Checa-Ros A, Locascio A, Joshua Okojie O, Viejo I, Bermúdez V, Karohl C and Raggi P (2025) C-peptide and epicardial adipose tissue in dialysis-dependent chronic kidney disease patients. Front. Med. 12:1650859. doi: 10.3389/fmed.2025.1650859
Edited by:
Prem Prakash Kushwaha, Case Western Reserve University, United StatesReviewed by:
Ioannis Eleftherios Neofytou, University General Hospital of Thessaloniki AHEPA, GreeceLovlesh Thakur, Cleveland State University, United States
Copyright © 2025 D’Marco, Checa-Ros, Locascio, Joshua Okojie, Viejo, Bermúdez, Karohl and Raggi. This is an open-access article distributed under the terms of the Creative Commons Attribution License (CC BY). The use, distribution or reproduction in other forums is permitted, provided the original author(s) and the copyright owner(s) are credited and that the original publication in this journal is cited, in accordance with accepted academic practice. No use, distribution or reproduction is permitted which does not comply with these terms.
*Correspondence: Paolo Raggi, cmFnZ2lAdWFsYmVydGEuY2E=
†These authors have contributed equally to this work